Article

Assessing the Suitability of Fractal Dimension for Measuring Graphic Complexity Change in Schematic Metro Networks

1
Faculty of Geosciences and Environmental Engineering, Southwest Jiaotong University, Chengdu 611756, China
2
School of Geographic Sciences, East China Normal University, Shanghai 200241, China
3
Institute for Global Innovation and Development, East China Normal University, Shanghai 200062, China
4
Faculty of Resources and Environmental Science, Hubei University, Wuhan 430062, China
*
Author to whom correspondence should be addressed.
ISPRS Int. J. Geo-Inf. 2024, 13(2), 38; https://doi.org/10.3390/ijgi13020038
Submission received: 17 November 2023 / Revised: 19 January 2024 / Accepted: 19 January 2024 / Published: 25 January 2024

Abstract

:
Schematization is a process of generating schematic network maps (e.g., metro network maps), where the graphic complexity of networks is usually reduced. In the past two decades, various automated schematization methods have been developed. A quantitative and accurate description of the complexity variation in the schematization is critical to evaluate the usability of schematization methods. It is noticed that fractal dimension ( F ) has been widely used to analyze the complexity of geographic objects, and this indicator may be appropriate for this purpose. In some existing studies, although F has been employed to describe the complexity variation, the theoretical and experimental basis for adopting this approach is inadequate. In this study, experiments based on 26 Chinese cities’ metro networks showed that the F of all these metro networks have decreased in schematization, and a significant positive correlation exists between the F of original networks and the reduction of F after schematization. The above results were verified to have similar trends with the subjective opinions of participants in a psychological questionnaire. Therefore, it can be concluded that F can quantitatively measure the complexity change of networks in schematization. These discoveries provide the basis for using F to evaluate the usability of schematization methods.

1. Introduction

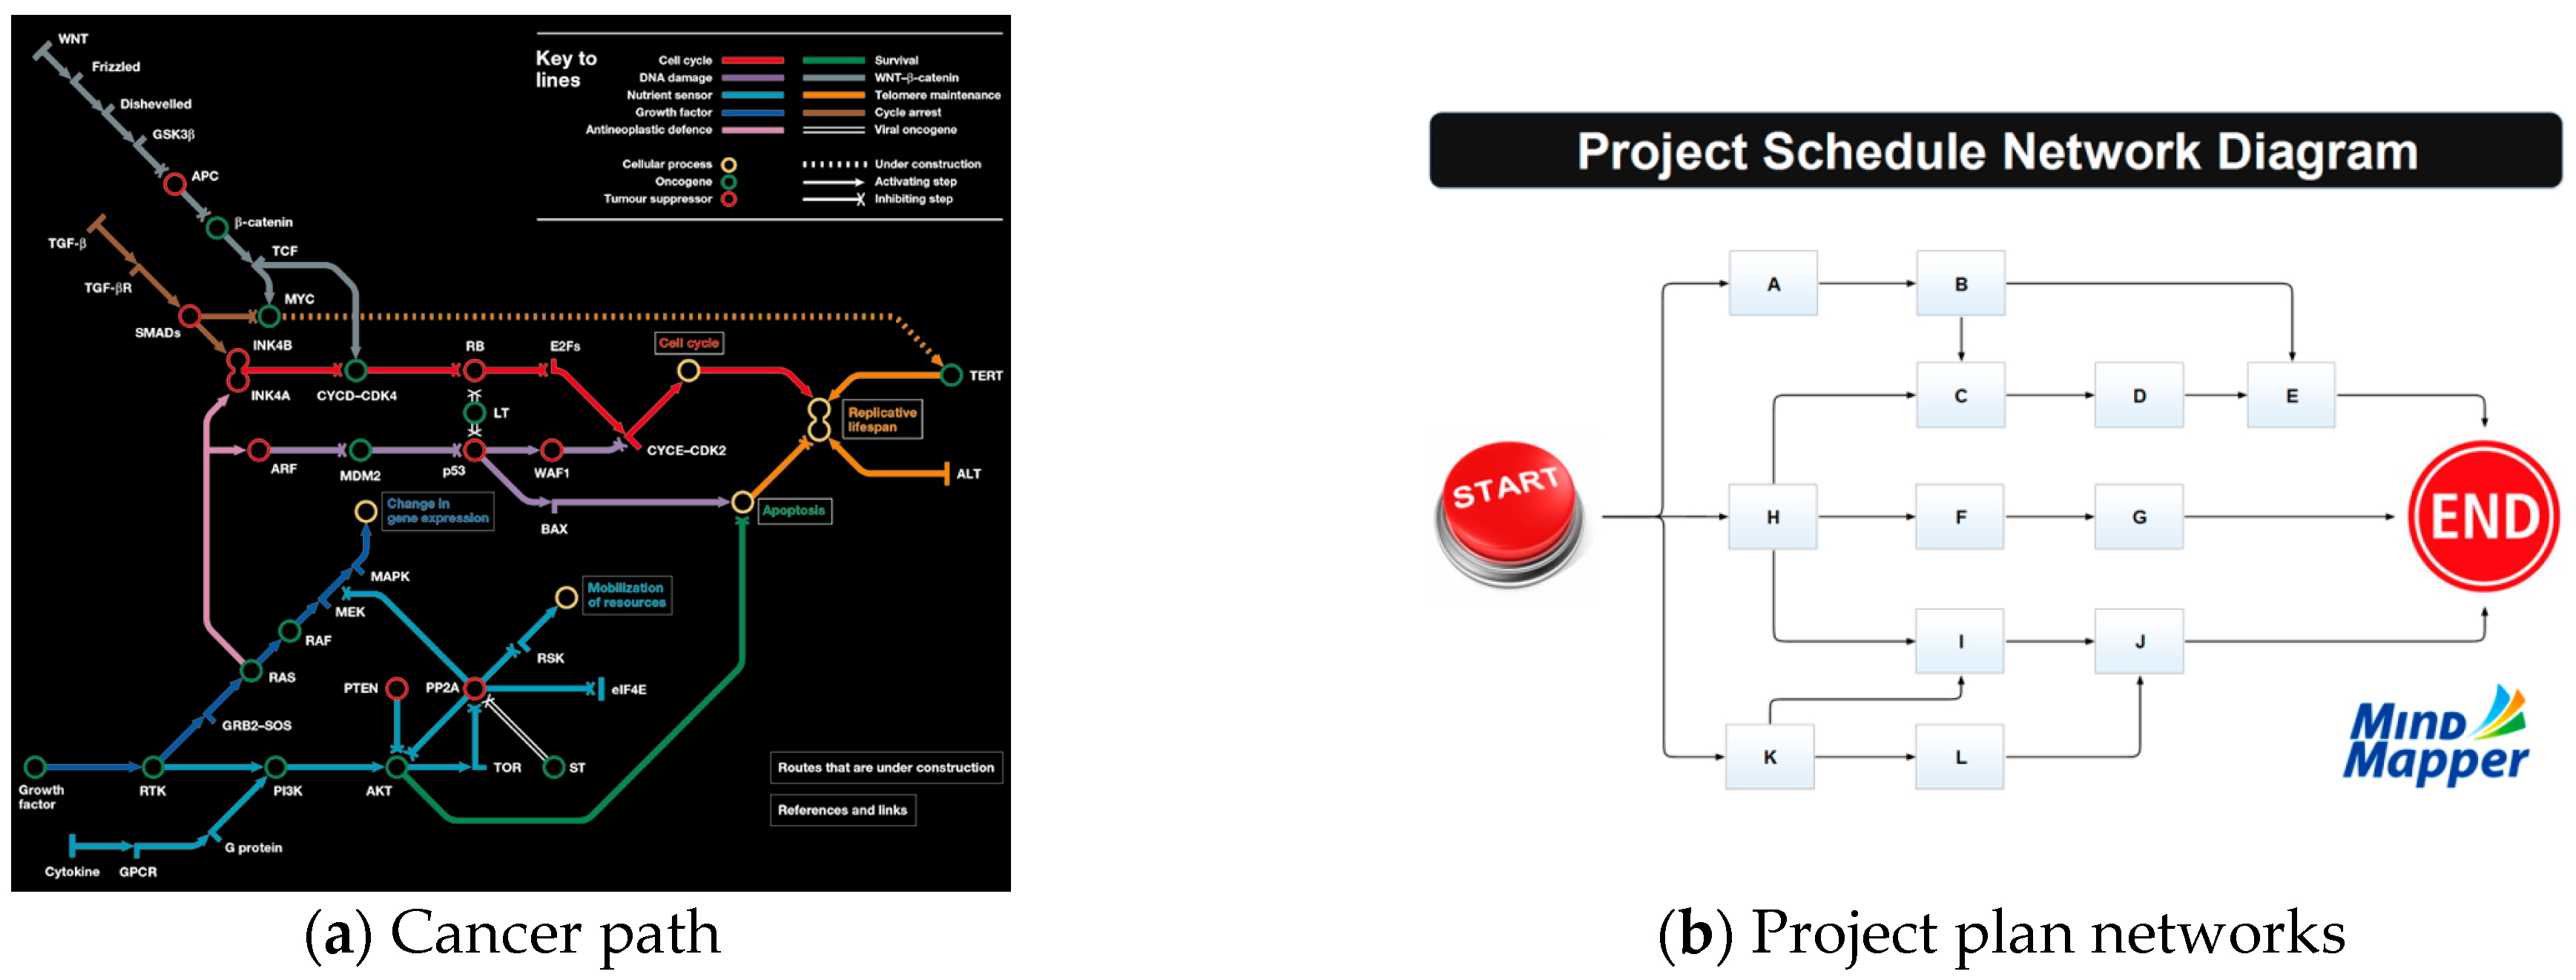
Schematization is a process of generating schematic network maps, where the complexity of networks is reduced by removing geographical features, simplifying lines, re-orientating lines, etc. (see Figure 1). Although some details are removed, and the geographical reality is changed for schematic network maps, the essential structures and topological relationships are still preserved [1,2]. As a result, such maps are widely used for tasks that can be performed without exact details and geographical reality, such as route planning and orientation tasks [3,4,5,6]. One famous example of schematic network maps is the London Underground map designed by Harry Charles Beck in the 1930s, which has been regarded as one of the top ten maps in the twentieth century [7]. On this map, congested areas are enlarged, and lines are re-orientated along specific directions with the preservation of topological relationships [8]. Nowadays, schematic network maps have been widely used in representing various spatial networks (e.g., bus route networks and metro networks) and non-spatial networks (e.g., cancer path and project plan networks, see Figure 2).
In the past two decades, researchers from various fields, such as cartography, geographical information science, and computational geometry, have conducted a considerable number of studies in the development of automated schematization methods. Most methods follow a three-step procedure [10], outlined below:
  • to simplify lines to basic shapes;
  • to re-orient lines along grid lines;
  • to enlarge congested areas to spread the density of the network.
The context that follows provides a limited review of automated schematization methods. Generally, the automated generation of schematic maps is treated as an optimization problem. It is time-consuming to solve this optimization problem due to its NP-hard nature [11]. To achieve the optimal result within an acceptable time, various optimization algorithms (e.g., simulated annealing algorithms, genetic algorithms, and hill-climbing algorithms) are used with one or more constraints [2,11,12,13,14,15]. On the other hand, the utility improvement of schematic maps has gained a great deal of attention. Compared with the traditional method, i.e., segment-based methods, a stroke-based method was proposed for generating more usable schematic maps like the London Underground map [16]. To enlarge congested areas in an appropriate way, a fish-eye view technique was employed with an automated approach for schematic maps [17]. The labeling problem of stations is a critical point for the quality of schematic maps, but the attention to this problem is limited. In recent years, the name placement of stations has been revisited, and numerous official schematic metro networks have been studied manually to generate a series of labeling rules [18]. Moreover, an artificial neural network-based method was presented for the automated labeling of schematic metro maps [1].
These studies improve the automated level of schematization. However, how to evaluate the usability of schematization methods is not well considered. In the existing work, questionnaires [19,20,21] and eye-tracking-based experiments [22,23,24,25] are two main methods of evaluation. Unfortunately, these two methods cannot quantitatively measure the complexity change of networks in schematization. Fractal dimension is widely used to analyze the complexity of geographic objects [26,27,28,29,30,31], and such an indicator may be appropriate for this purpose. To verify our hypothesis, in this study, fractal dimension was employed to measure the complexity change of 26 Chinese metro networks in schematization, and the acquired results were then compared with the results acquired from a psychological questionnaire.
The remainder of this article is organized as follows. Section 2 introduces the employed metro networks and fractal theory. Section 3 analyzes the change in fractal dimensions in schematization and compares them with results from the psychological questionnaire. In Section 4 and Section 5, the discussion and conclusion are provided, respectively.

2. Data and Method

2.1. The Metro Networks of 26 Chinese Cities as the Experimental Data

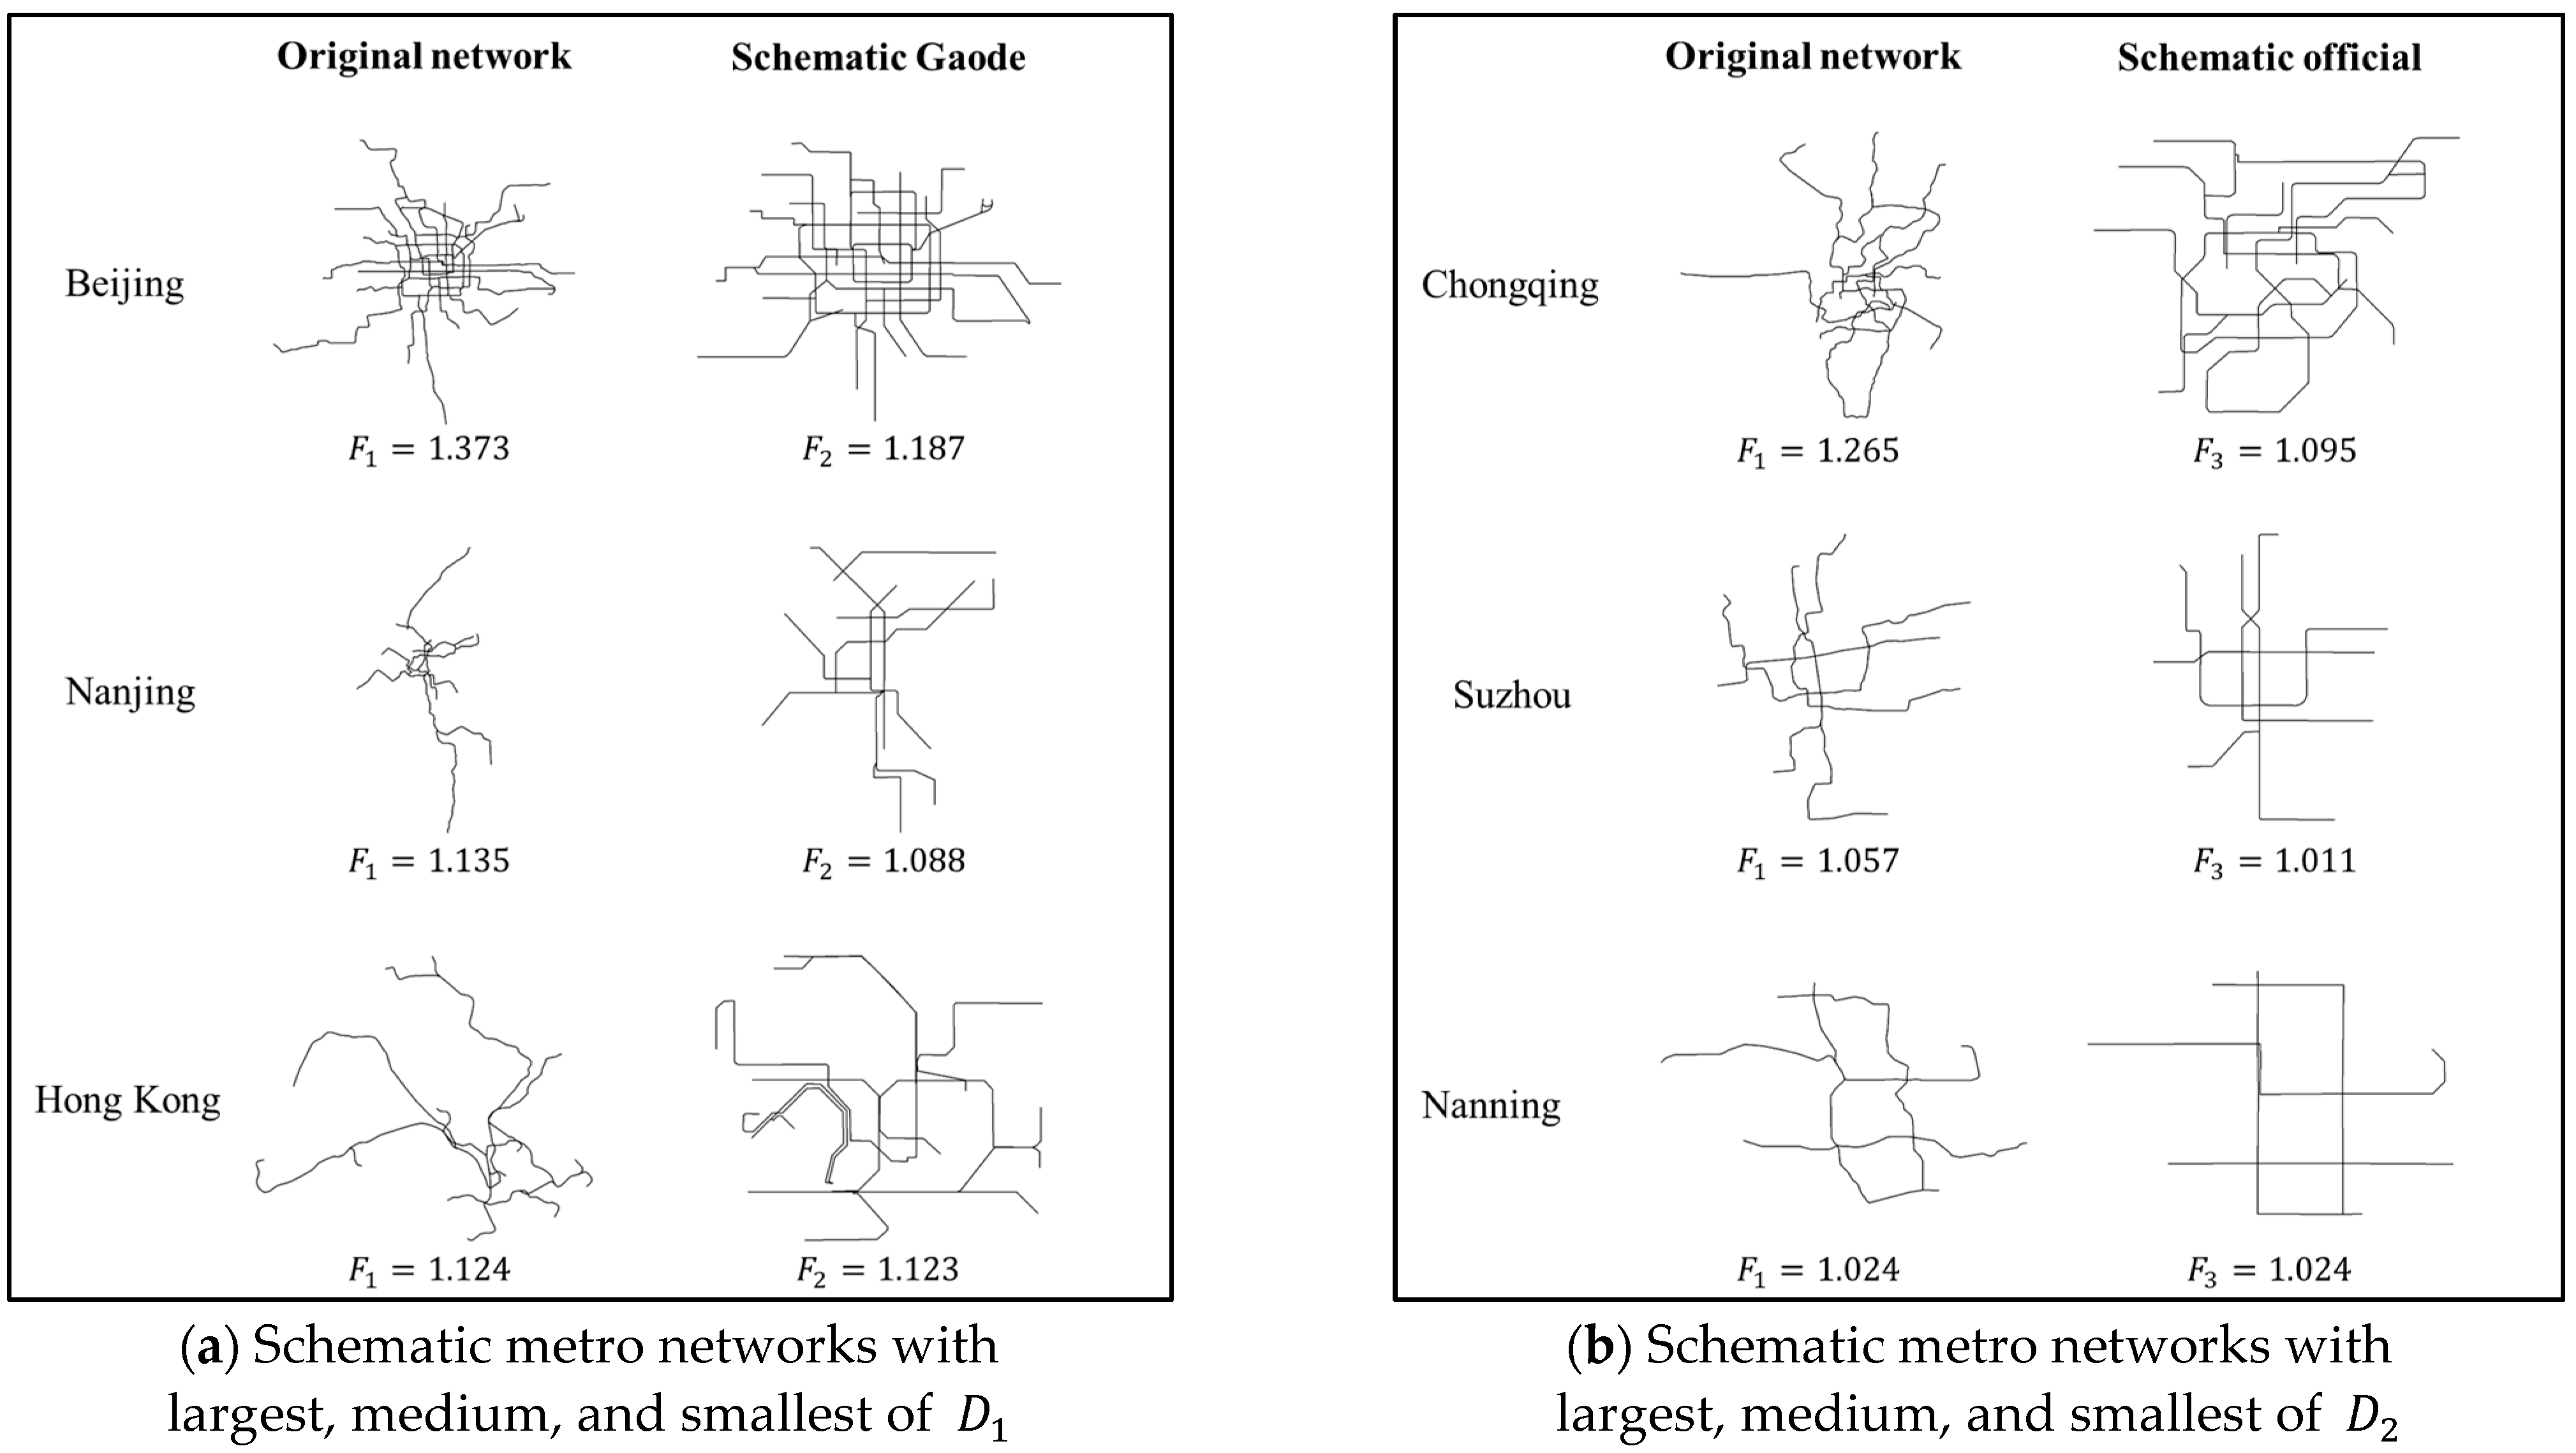
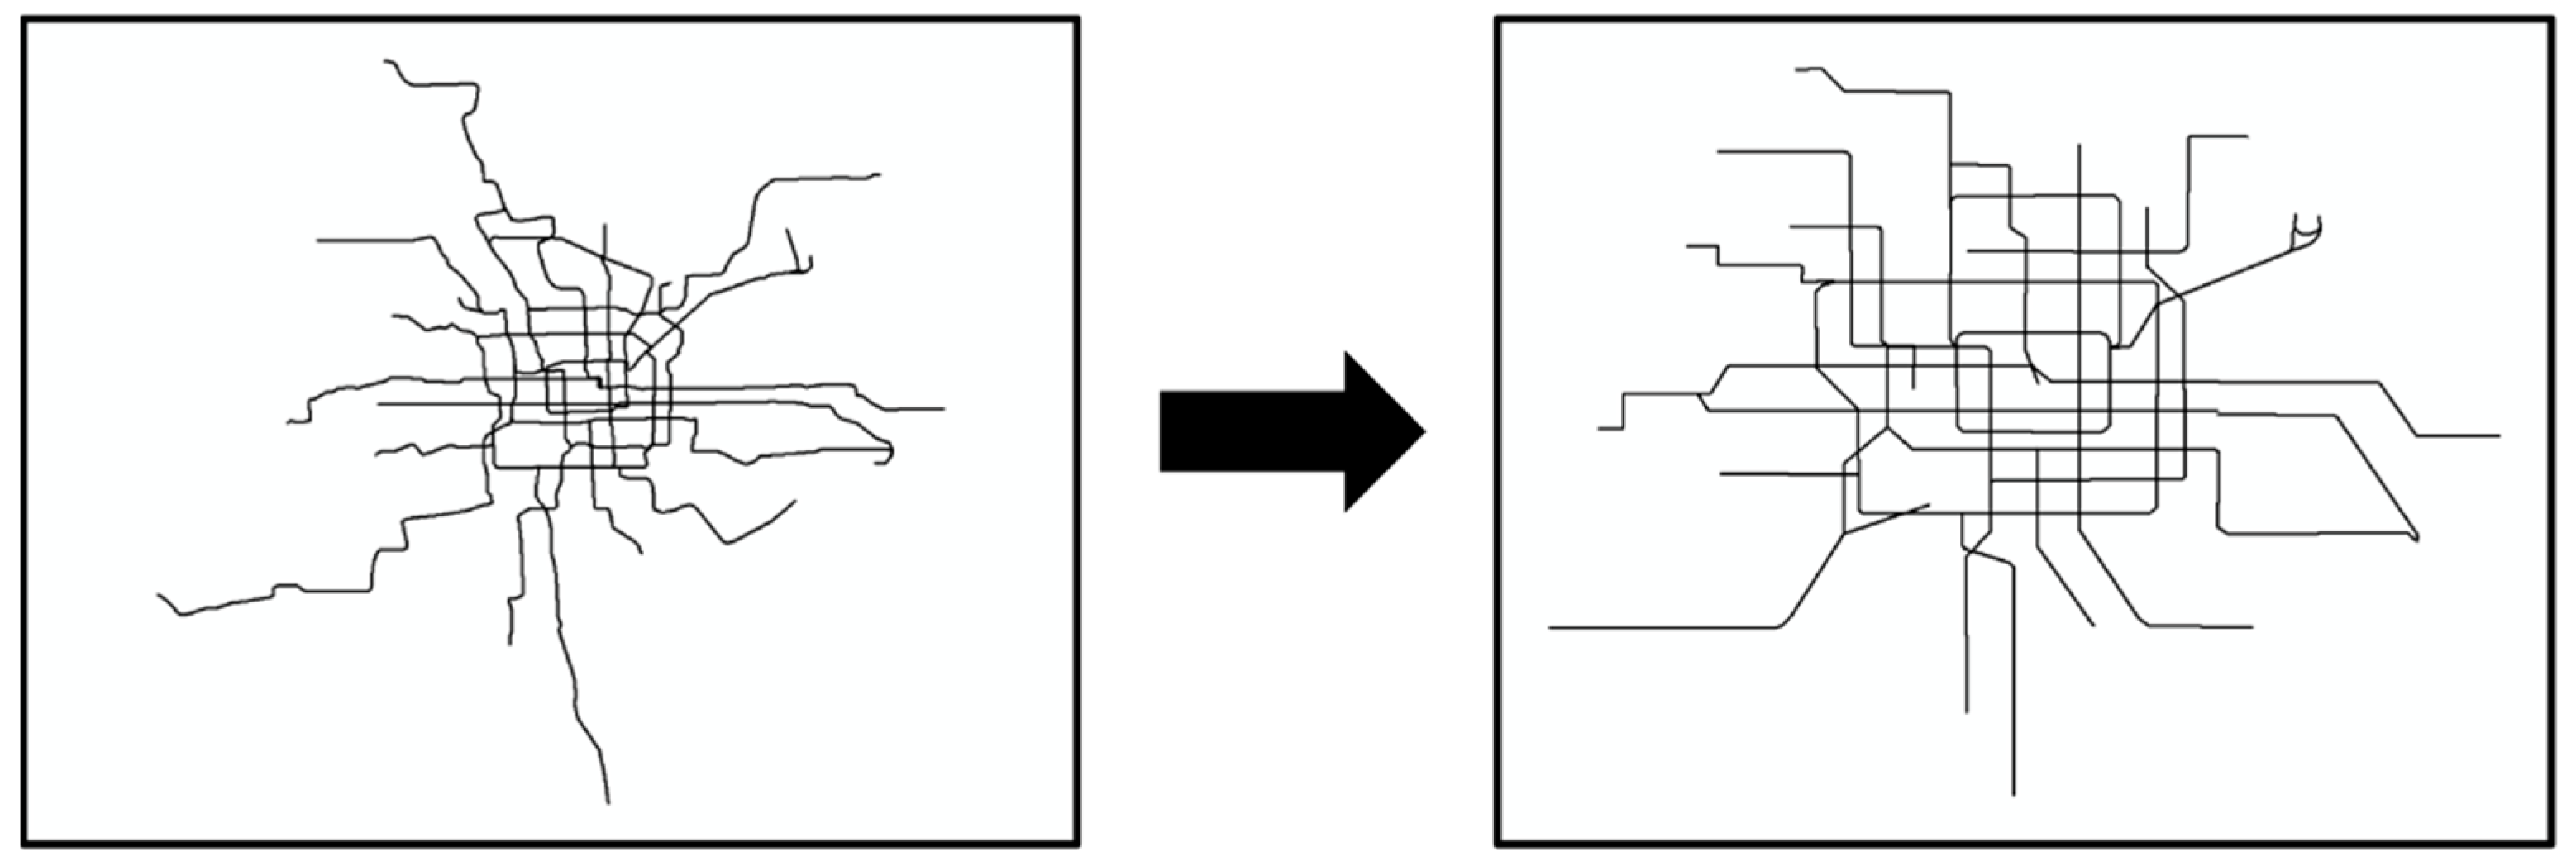
More than 100 cities in the world have constructed their own metro operation systems and designed corresponding schematic metro maps (https://en.wikipedia.org/wiki/List_of_metro_systems, accessed on 16 November 2023). These maps may be very different because of the design differences (e.g., different line design rules). To diminish these effects, it is better to employ metro networks from the same country or region. In the past decade, China has constructed the largest number of metro operation systems in the world, and we have collected metro networks of 26 Chinese cities from two sources (official websites and Gaode map) as the experimental data, all of which have two or more lines. It is important to note the differences between schematic metro networks produced by official websites and Gaode map; that is, official websites adopt the octilinear design of lines (i.e., lines are re-orientated into horizontal, vertical, and diagonal directions), but Gaode maps adopt the multilinear design of lines (i.e., any angle of lines can be used), as shown in Figure 3. The complete network data can be found in the supplementary material.

2.2. Fractal Theory

  • The development of fractal theory
The term “fractal” refers to “a curve or pattern that includes a smaller curve or pattern which has exactly the same shape” (https://www.oxfordlearnersdictionaries.com/definition/english/fractal?q=fractal, accessed on 16 November 2023). Such fractals are strictly self-similar, and they only exist in mathematical patterns, such as Koch Snow and Sierpinski Triangle. Gradually, in order to describe those complex objects in nature (such as coastal lines), the concept of the fractal is extended to refer to those statistically self-similar objects measured by power-law relationships between the measurement scale and the number of scales needed to cover objects [32]. The absolute value of the scaling exponent in such a power-law relationship is the fractal dimension [33]. It was reported that the power-law-based fractal dimension is “too strict for many geographic features” [34], and an alternative indicator called “ht-index” was recently proposed based on power-law-like distributions [35,36]. In this study, the research objects are metro networks that are usually described by the power-law-exponent-based fractal dimension, so the fractal dimension hereafter refers to the exponent of a power-law relationship.
  • Calculation of fractal dimension
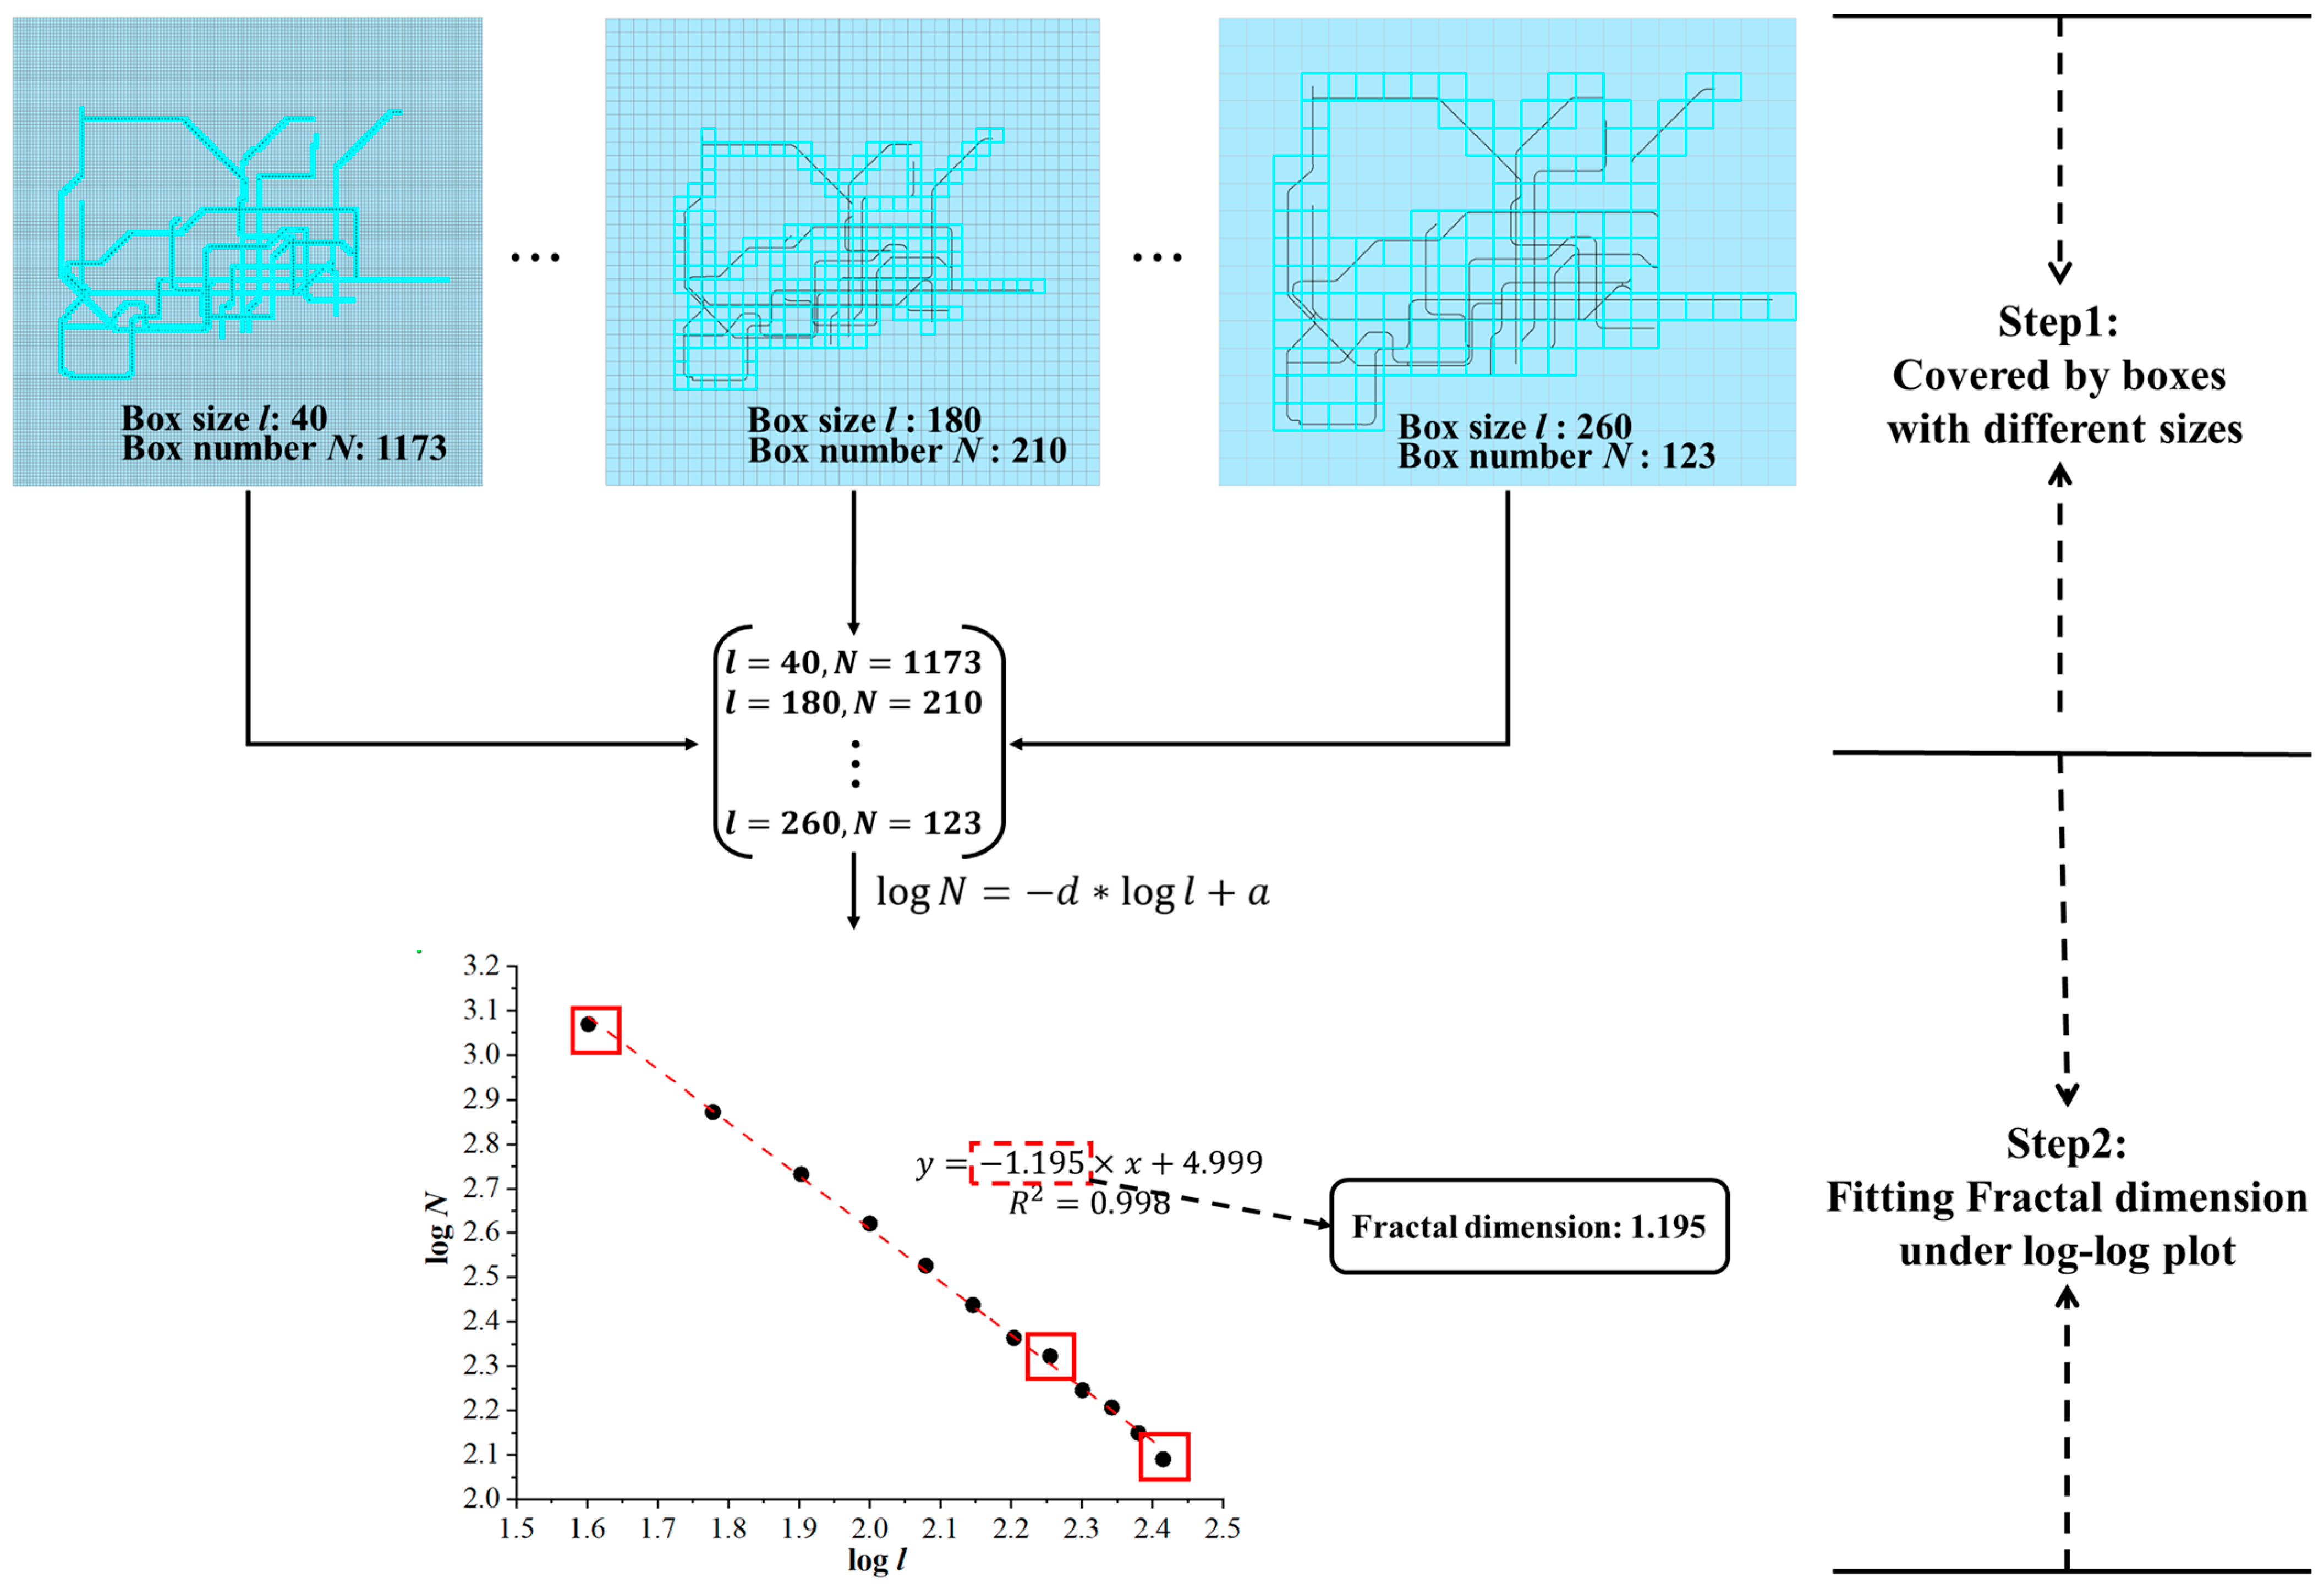
A variety of methods for the calculation of fractal dimension are available, such as the divider method [36], area-based method [37], and box-counting method [38]. Among these methods, the box-counting method is the most appropriate one for analyzing the complexity of transport networks [39,40,41,42], so we have employed the box-counting method for the calculation of fractal dimension. Based on the box-counting method, the number of boxes N g is acquired by overlaying a grid of squares with size l g on the object to be measured (see Figure 4). By progressively reducing l g , we can acquire a series of box numbers N g , and fractal dimension can then be calculated as follows:
N g l g F g ,
where l g refers to the side length of boxes, N g refers to the number of boxes covering the feature, and F g is the box-counting fractal dimension.

3. Analysis of Complexity Change in Schematization

In this section, the complexity change of metro networks in schematization will be firstly analyzed by fractal dimensions. To further verify the reliability, these fractal-dimension-based results will be compared with the subjective opinions of participants acquired from a psychological questionnaire.

3.1. Complexity Change in Schematization by Fractal Dimension

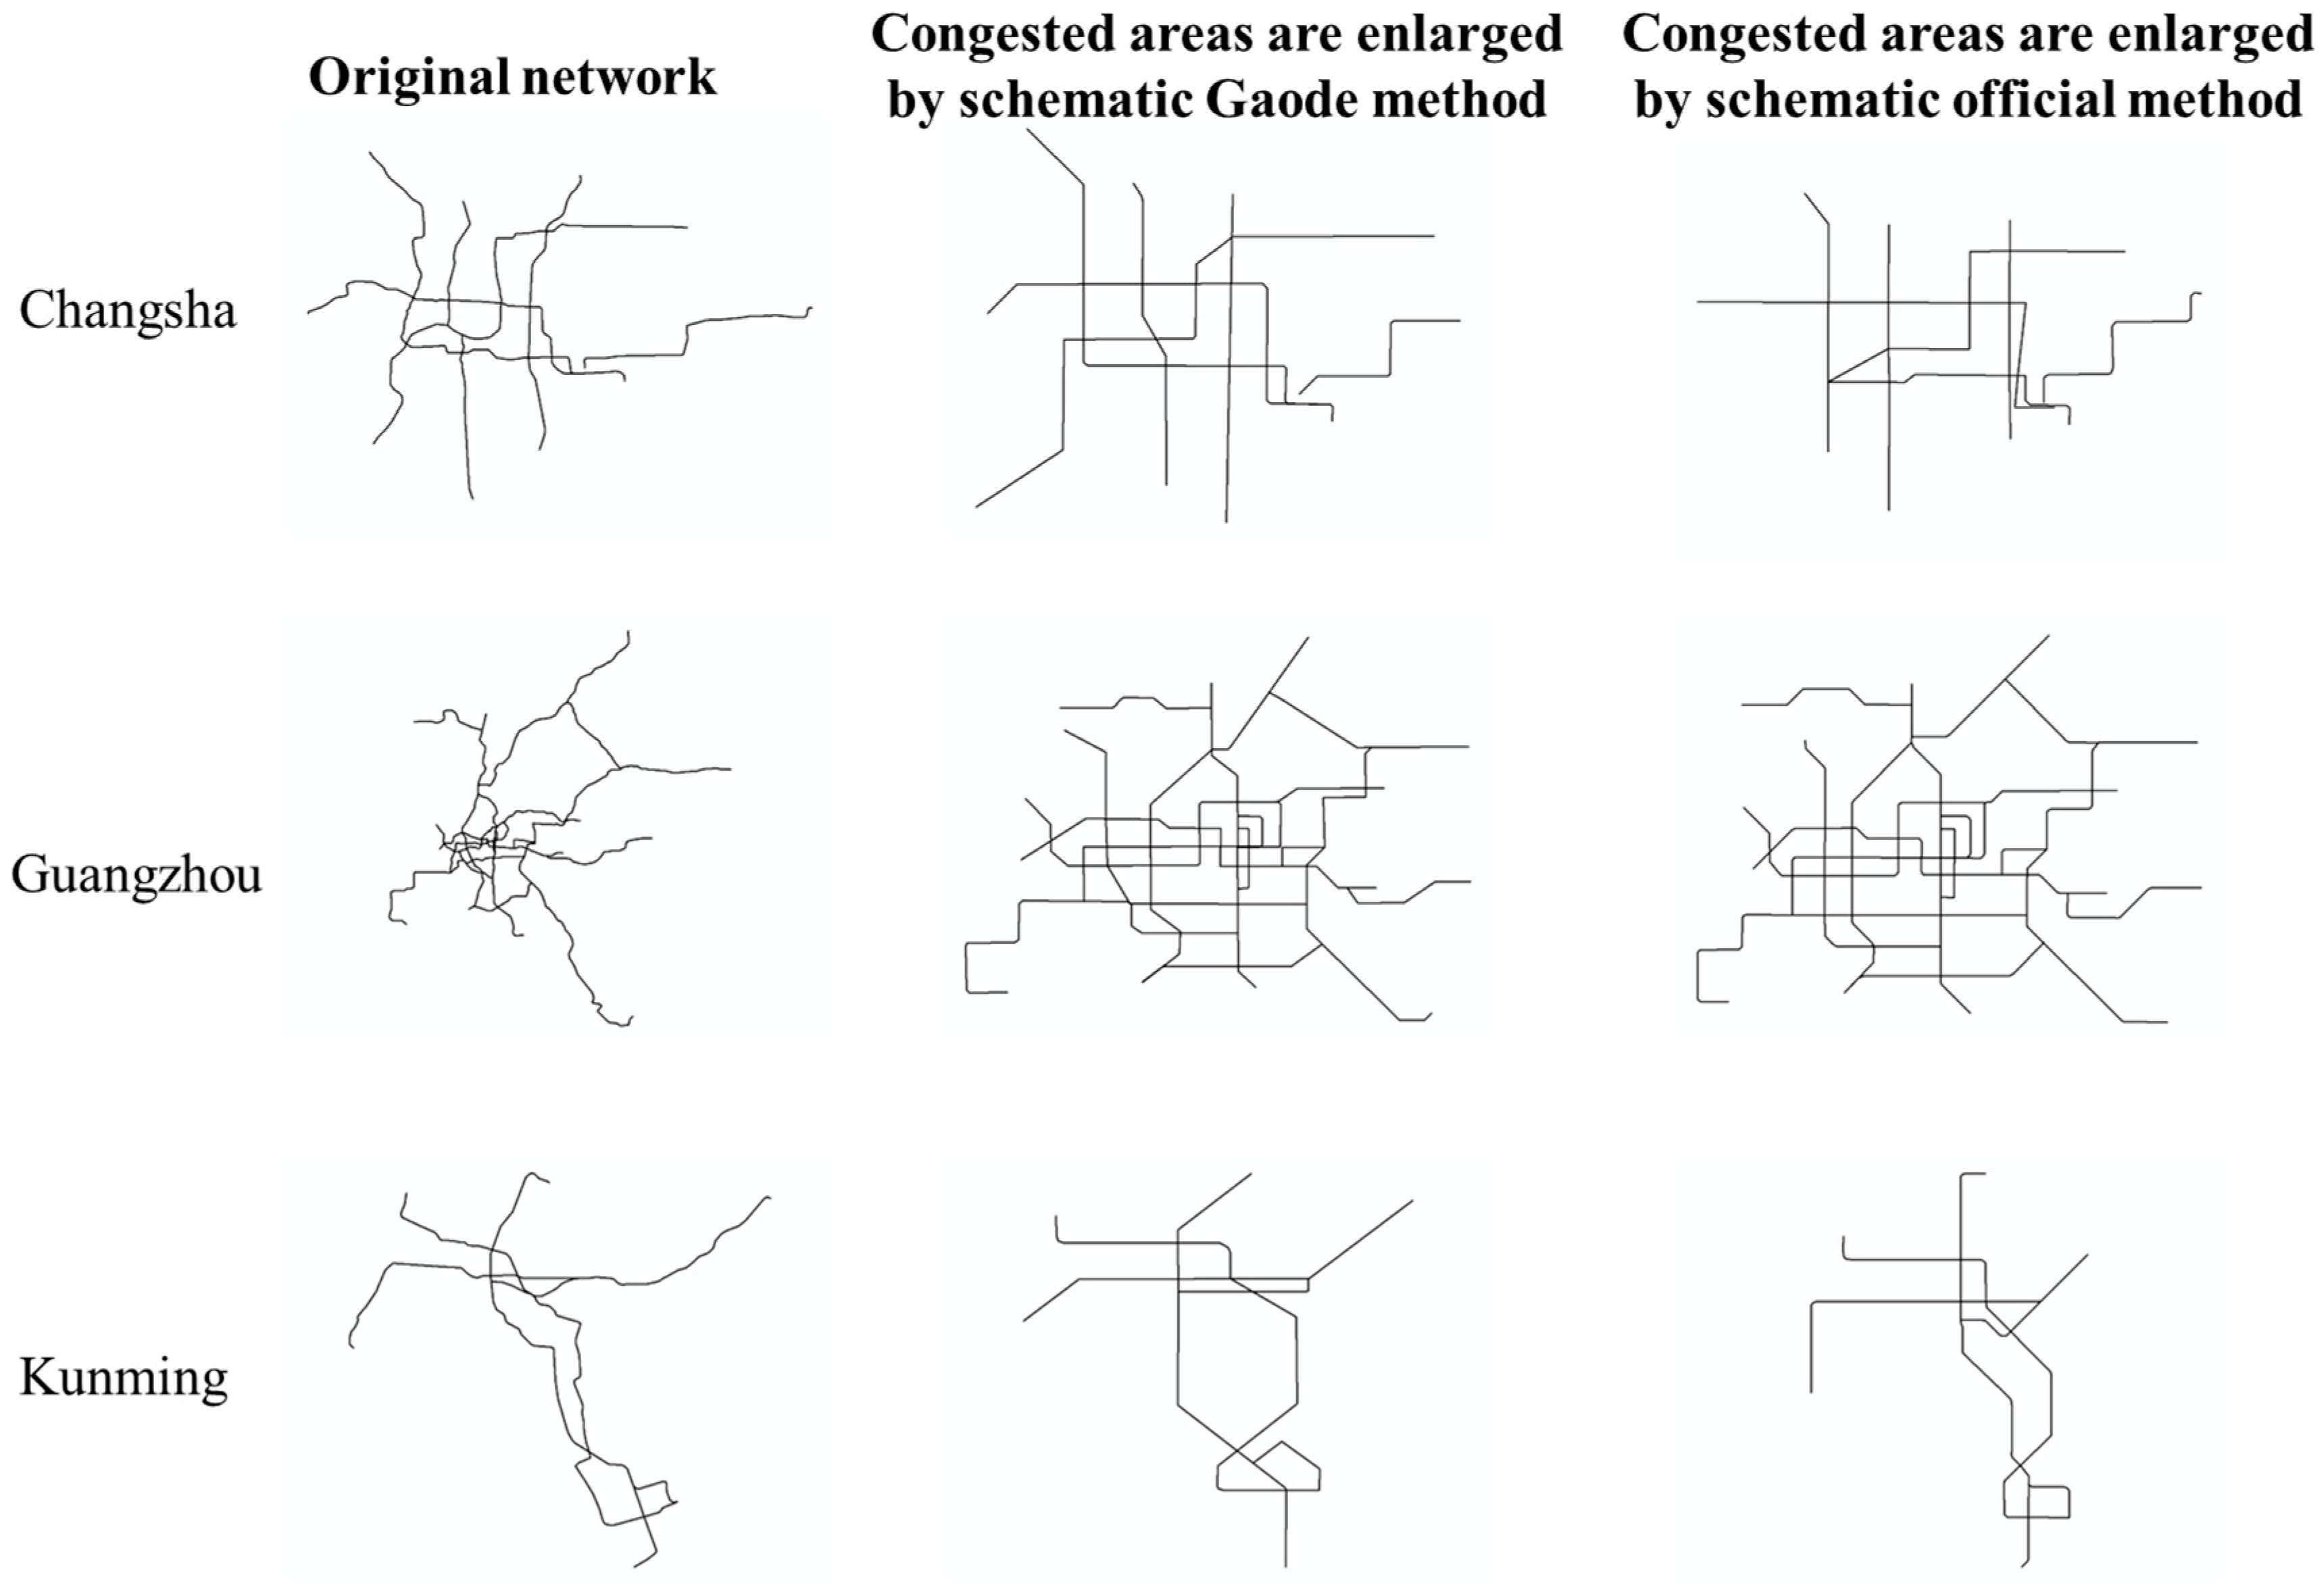
The fractal dimensions of original metro networks, schematic Gaode metro networks, and schematic official metro networks (i.e., F 1 , F 2 , and F 3 ) in 26 Chinese cities have been calculated based on the box-counting method. All values of adjusted R-square in the calculation of fractal dimensions are larger than 0.998, which ensures that the acquired fractal dimensions are reliable. The differences in fractal dimensions between original networks and schematic Gaode networks (i.e., D 1 ) and between original networks and schematic official networks (i.e., D 2 ) are also presented. All of the data are given in Table 1. In order to facilitate the understanding of the relationship between graphic complexity variations after schematization and D , the schematic metro networks with the largest, medium, and smallest of D 1 and D 2 are displayed in Figure 5, respectively.
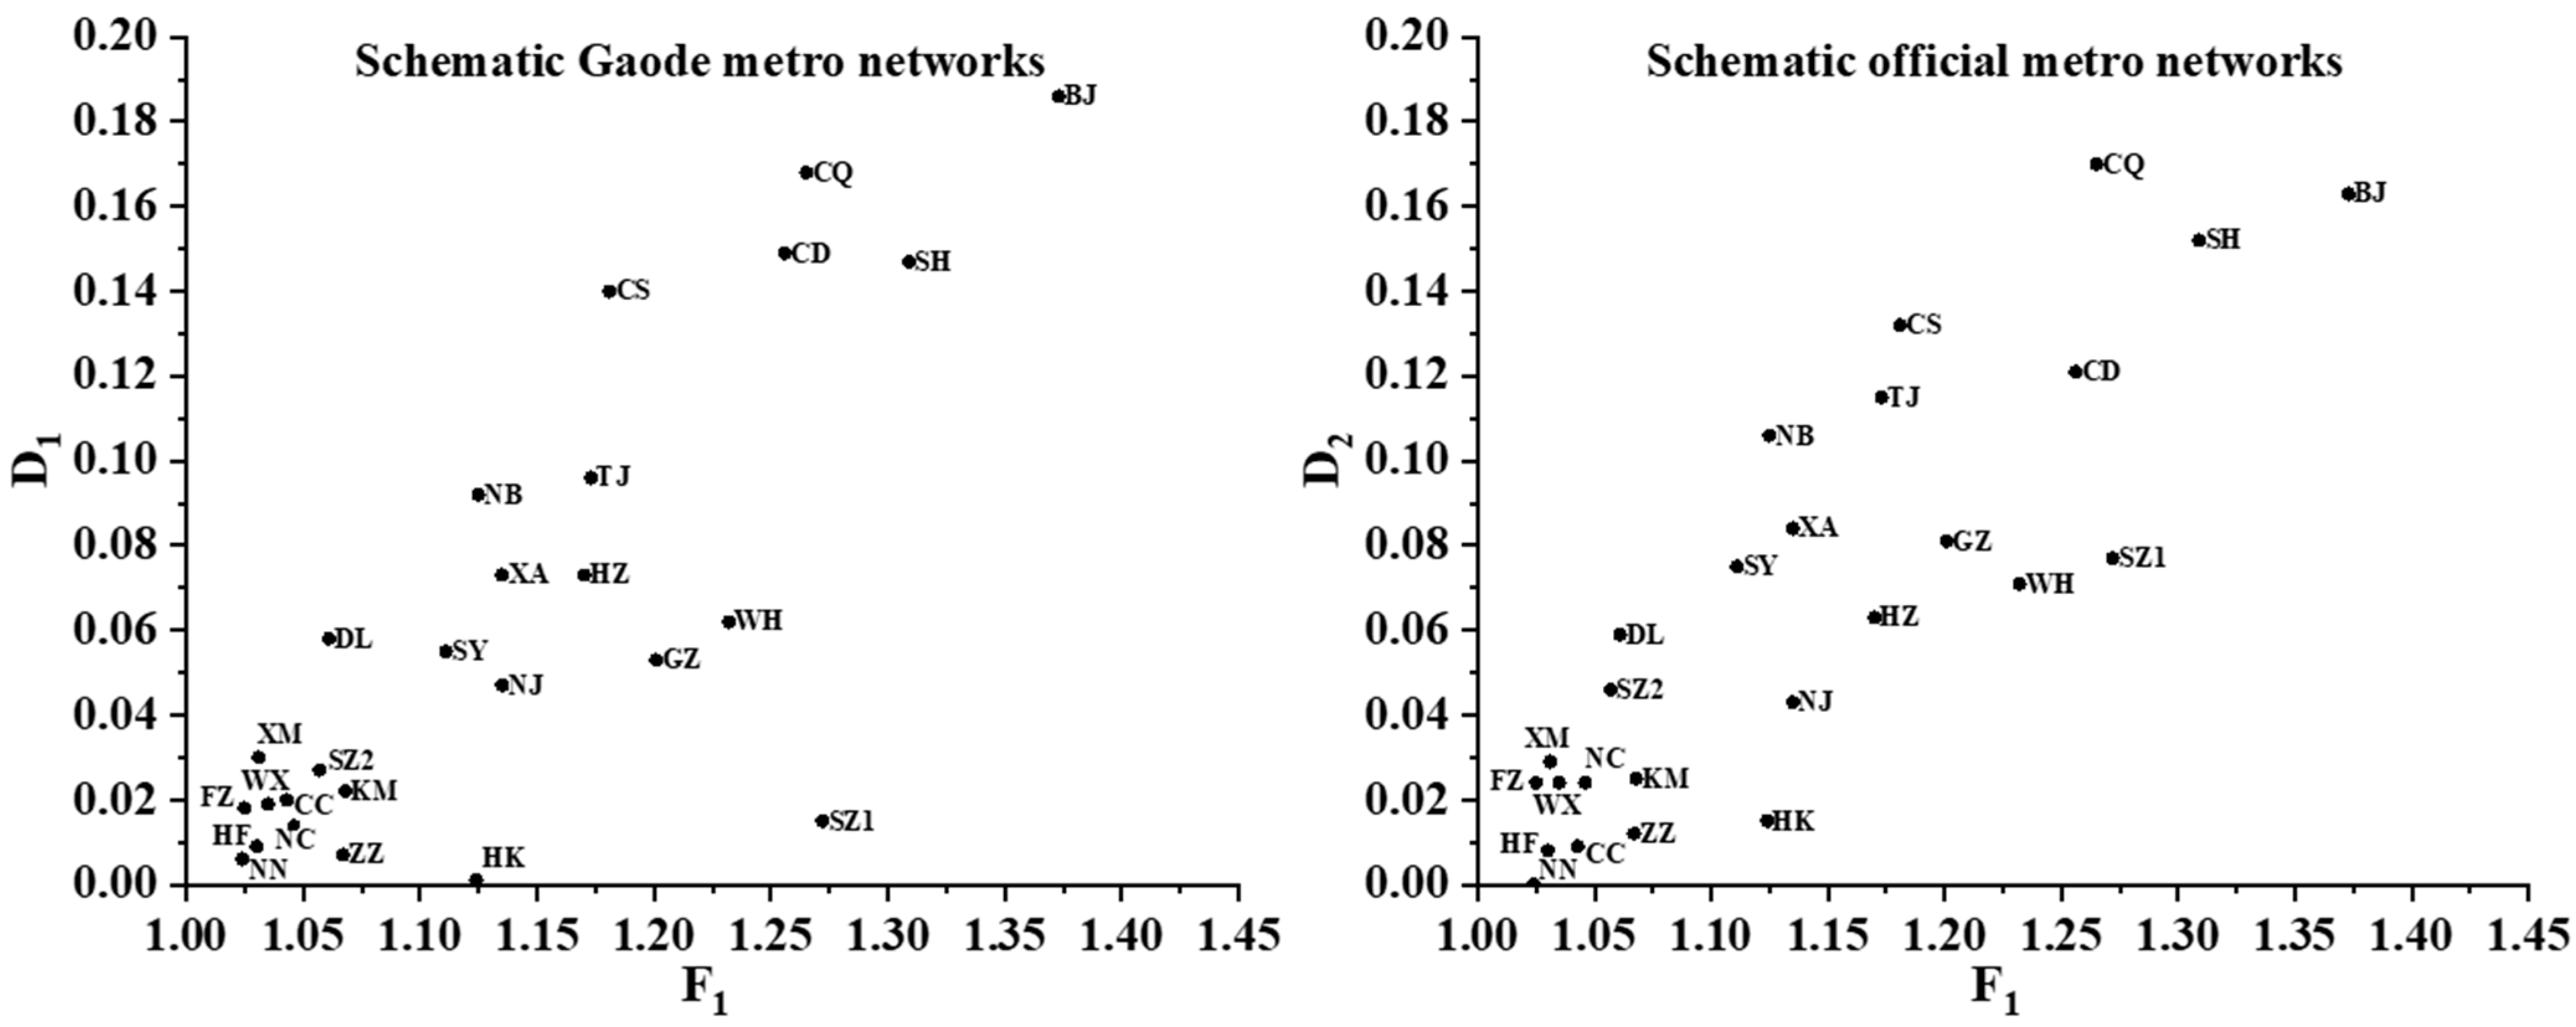
It was found that F 2 and F 3 are decreased when compared with F 1 . This result indicates that the complexities of metro networks have been reduced in schematization. Figure 6 shows the scattered data between F 1 and D 1 and between F 1 and D 2 . Visually, both scattered data have a positive correlation. To further understand the complexity reduction in various networks, the potential correlations between F 1 and D 1 and between F 1 and D 2 were explored with the values of Spearman’s correlation coefficient (SCC). As a result, the value of SCC between F 1 and D 1 was 0.715, while that between F 1 and D 2 was 0.853. As the pairs ( F , D ) are not independent observations, statistical tests were not appropriate for this study. To further confirm the possible relationships, various confidence intervals of SCCs were calculated using bootstrapping (i.e., a nonparametric statistical method). To enhance statistical robustness, two strategies for bootstrapping were applied in this study. Firstly, the original paired observations ( 2 × 26 ) were replicated to form multi-repeated observations ( 2 × 2600 ) through 100 replications. Secondly, 1000 iterations were performed for calculating confidence intervals, generating sets of paired resamples from the multi-repeated observations, with each resampling size matching that of the multi-repeated observations. In addition, the extracted elements were put back after each sampling. The outcomes, as presented in Table 2 and Figure 7, demonstrate that the calculated confidence intervals exhibit narrow widths (with a maximum width of approximately 0.05). Importantly, all lower and upper bounds of the confidence intervals are positive. These results prove a positive correlation between F 1 and both D 1 and D 2 , and they indicate that an original metro network with a large fractal dimension may suffer more in complexity reduction than an original one with a small fractal dimension. In addition, when comparing F 3 with F 2 , it was found that the F 3 values of 17 metro networks were smaller (e.g., Shenzhen and Chongqing), while the F 3 values of the other 9 metro networks (e.g., Beijing and Chengdu) were larger. These results imply that no schematization method can state with certainty that the resultant schematic network maps are an improvement.

3.2. Comparison of Complexity Change between Fractal Dimension and Psychological Questionnaire

The fractal dimensions of metro networks computed in the previous subsection indicated that schematic Gaode and official metro networks exhibit lower complexity than original metro networks. This subsection compares the complexity change between the fractal dimension and subjective opinions acquired by a psychological questionnaire.
This study conducted a psychological questionnaire to acquire subjective opinions about the complexity change when comparing the original and schematic metro networks, as shown in Figure 8, and the main body of the questionnaire can be found in the supplementary material. This questionnaire requires participants to score the complexity change from 26 cities’ metro networks using a 5-grade marking system (Table 3). To facilitate participants’ comprehension of complexity change, the questionnaire included three illustrative instances representing “very high”, “medium”, and “very low” levels of complexity change, respectively, as illustrated in Figure 9. The questionnaire was designed using the “Wenjuanxing” online platform, and we sent the link to the questionnaire to 80 participants from Southwest Jiaotong University. More precisely, each questionnaire designed with the Gaode or the official schematic method was filled out by 40 participants. The detailed information (e.g., gender and age) of participants is listed in Table 4.
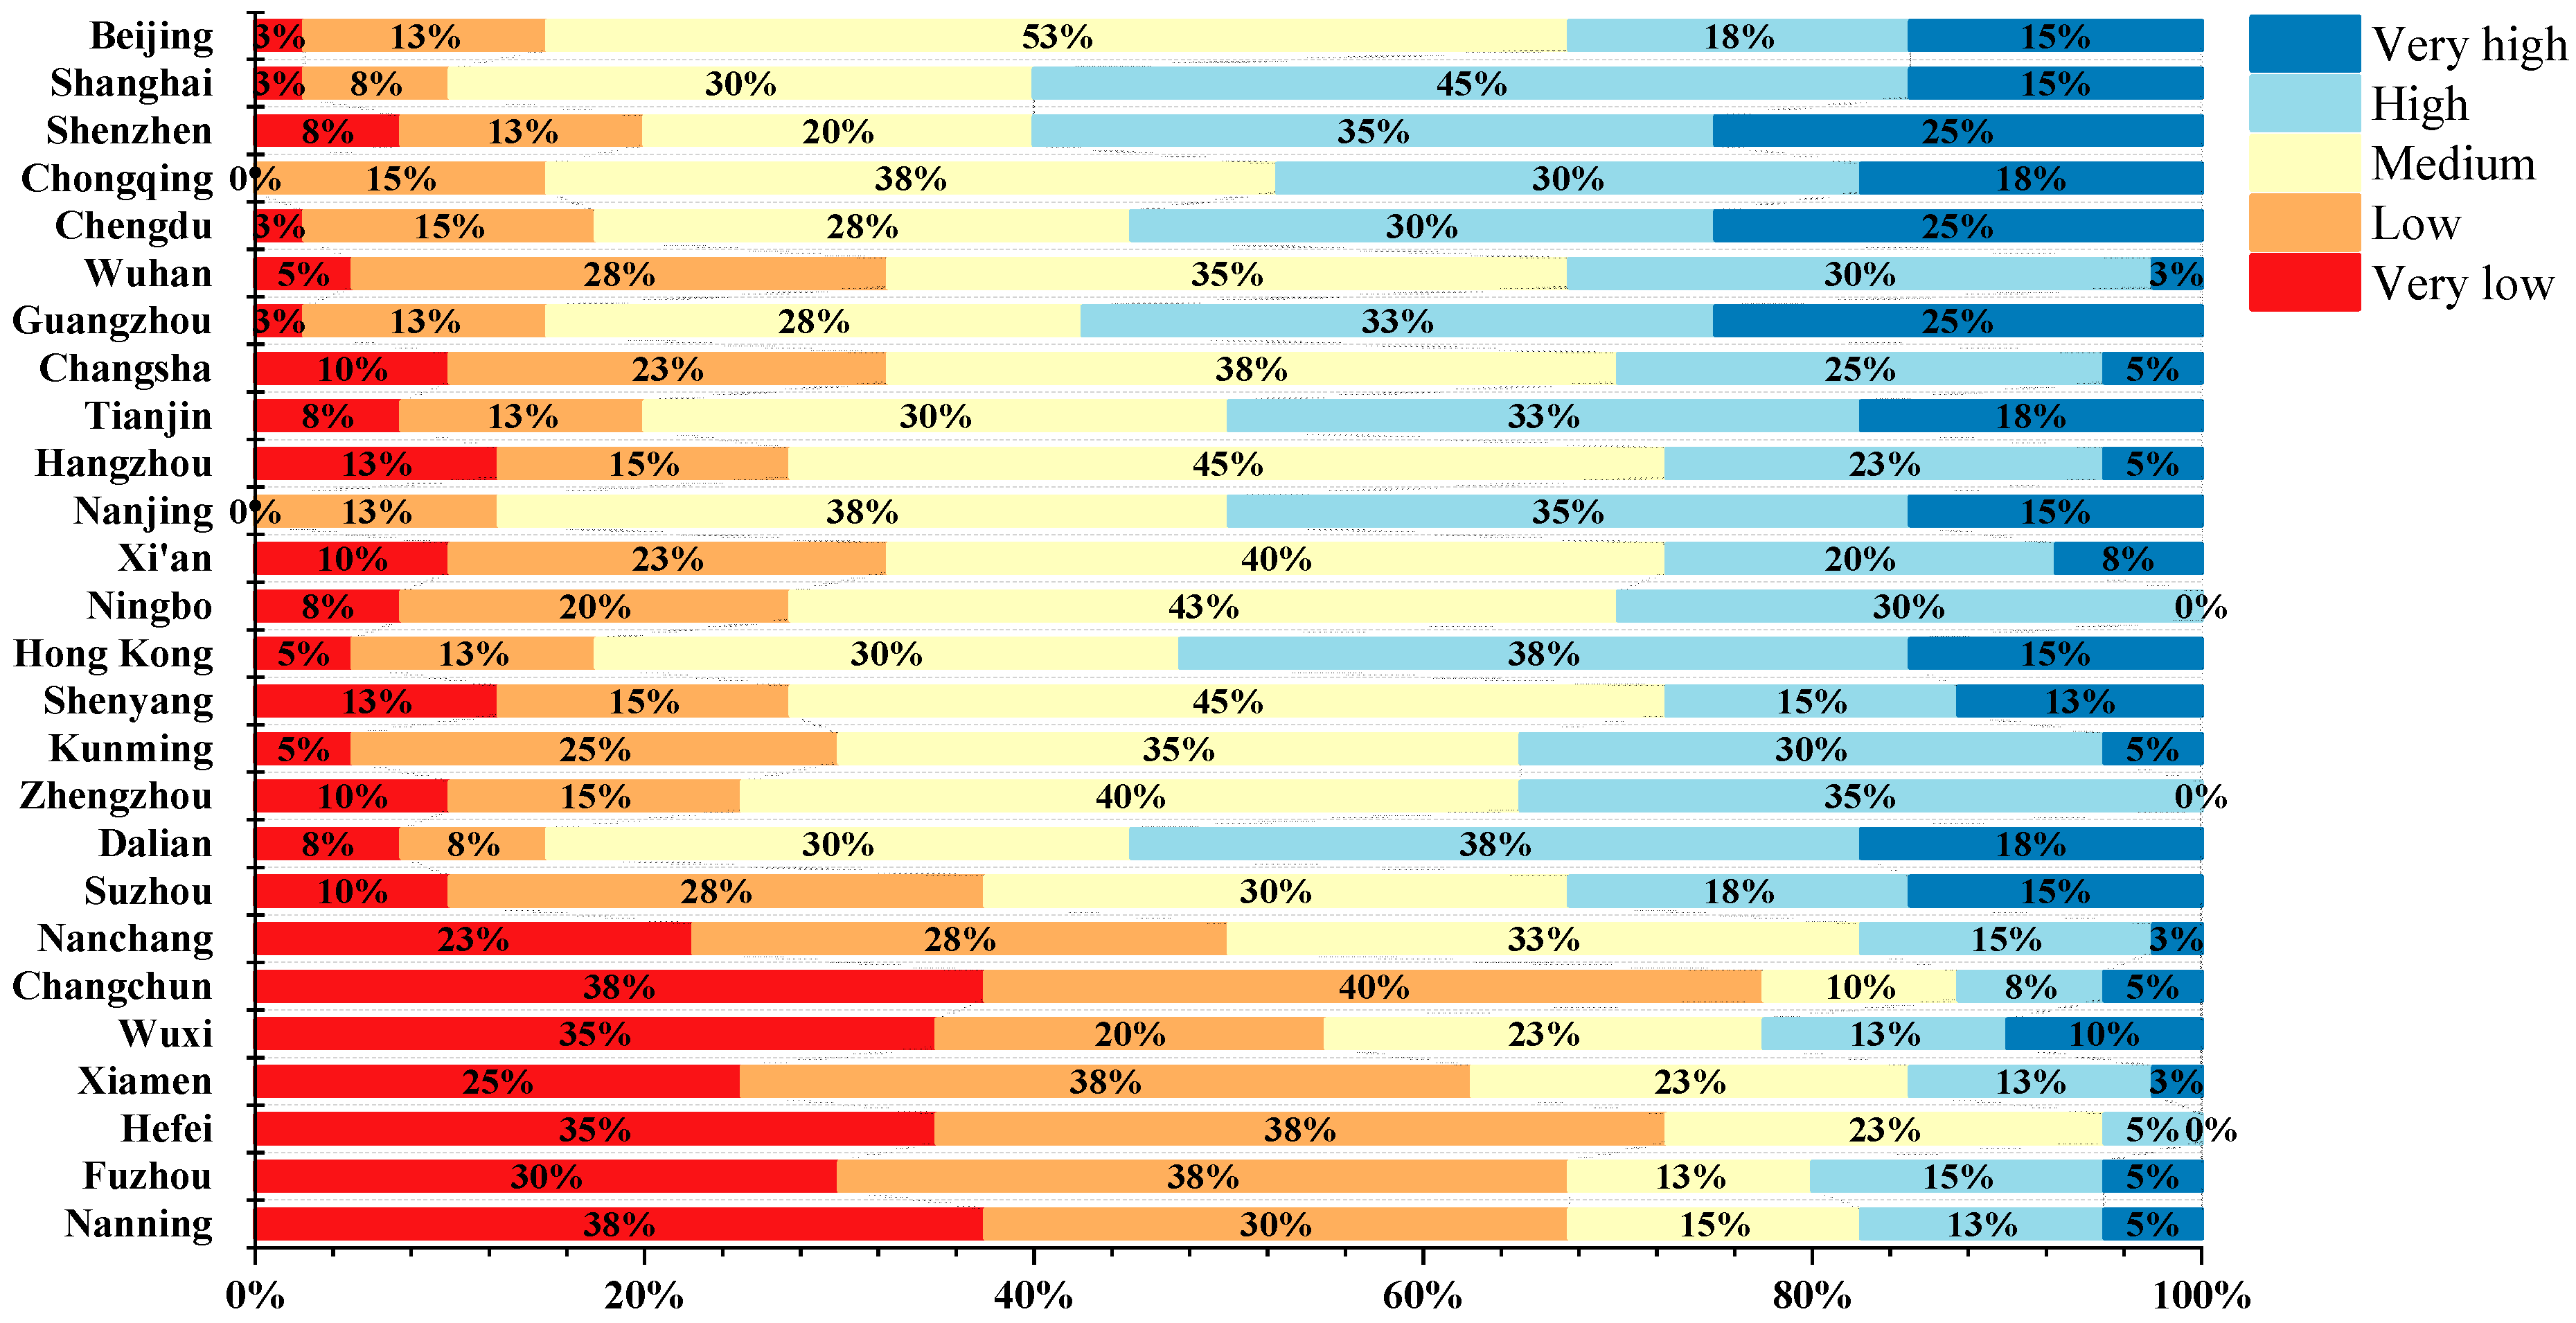
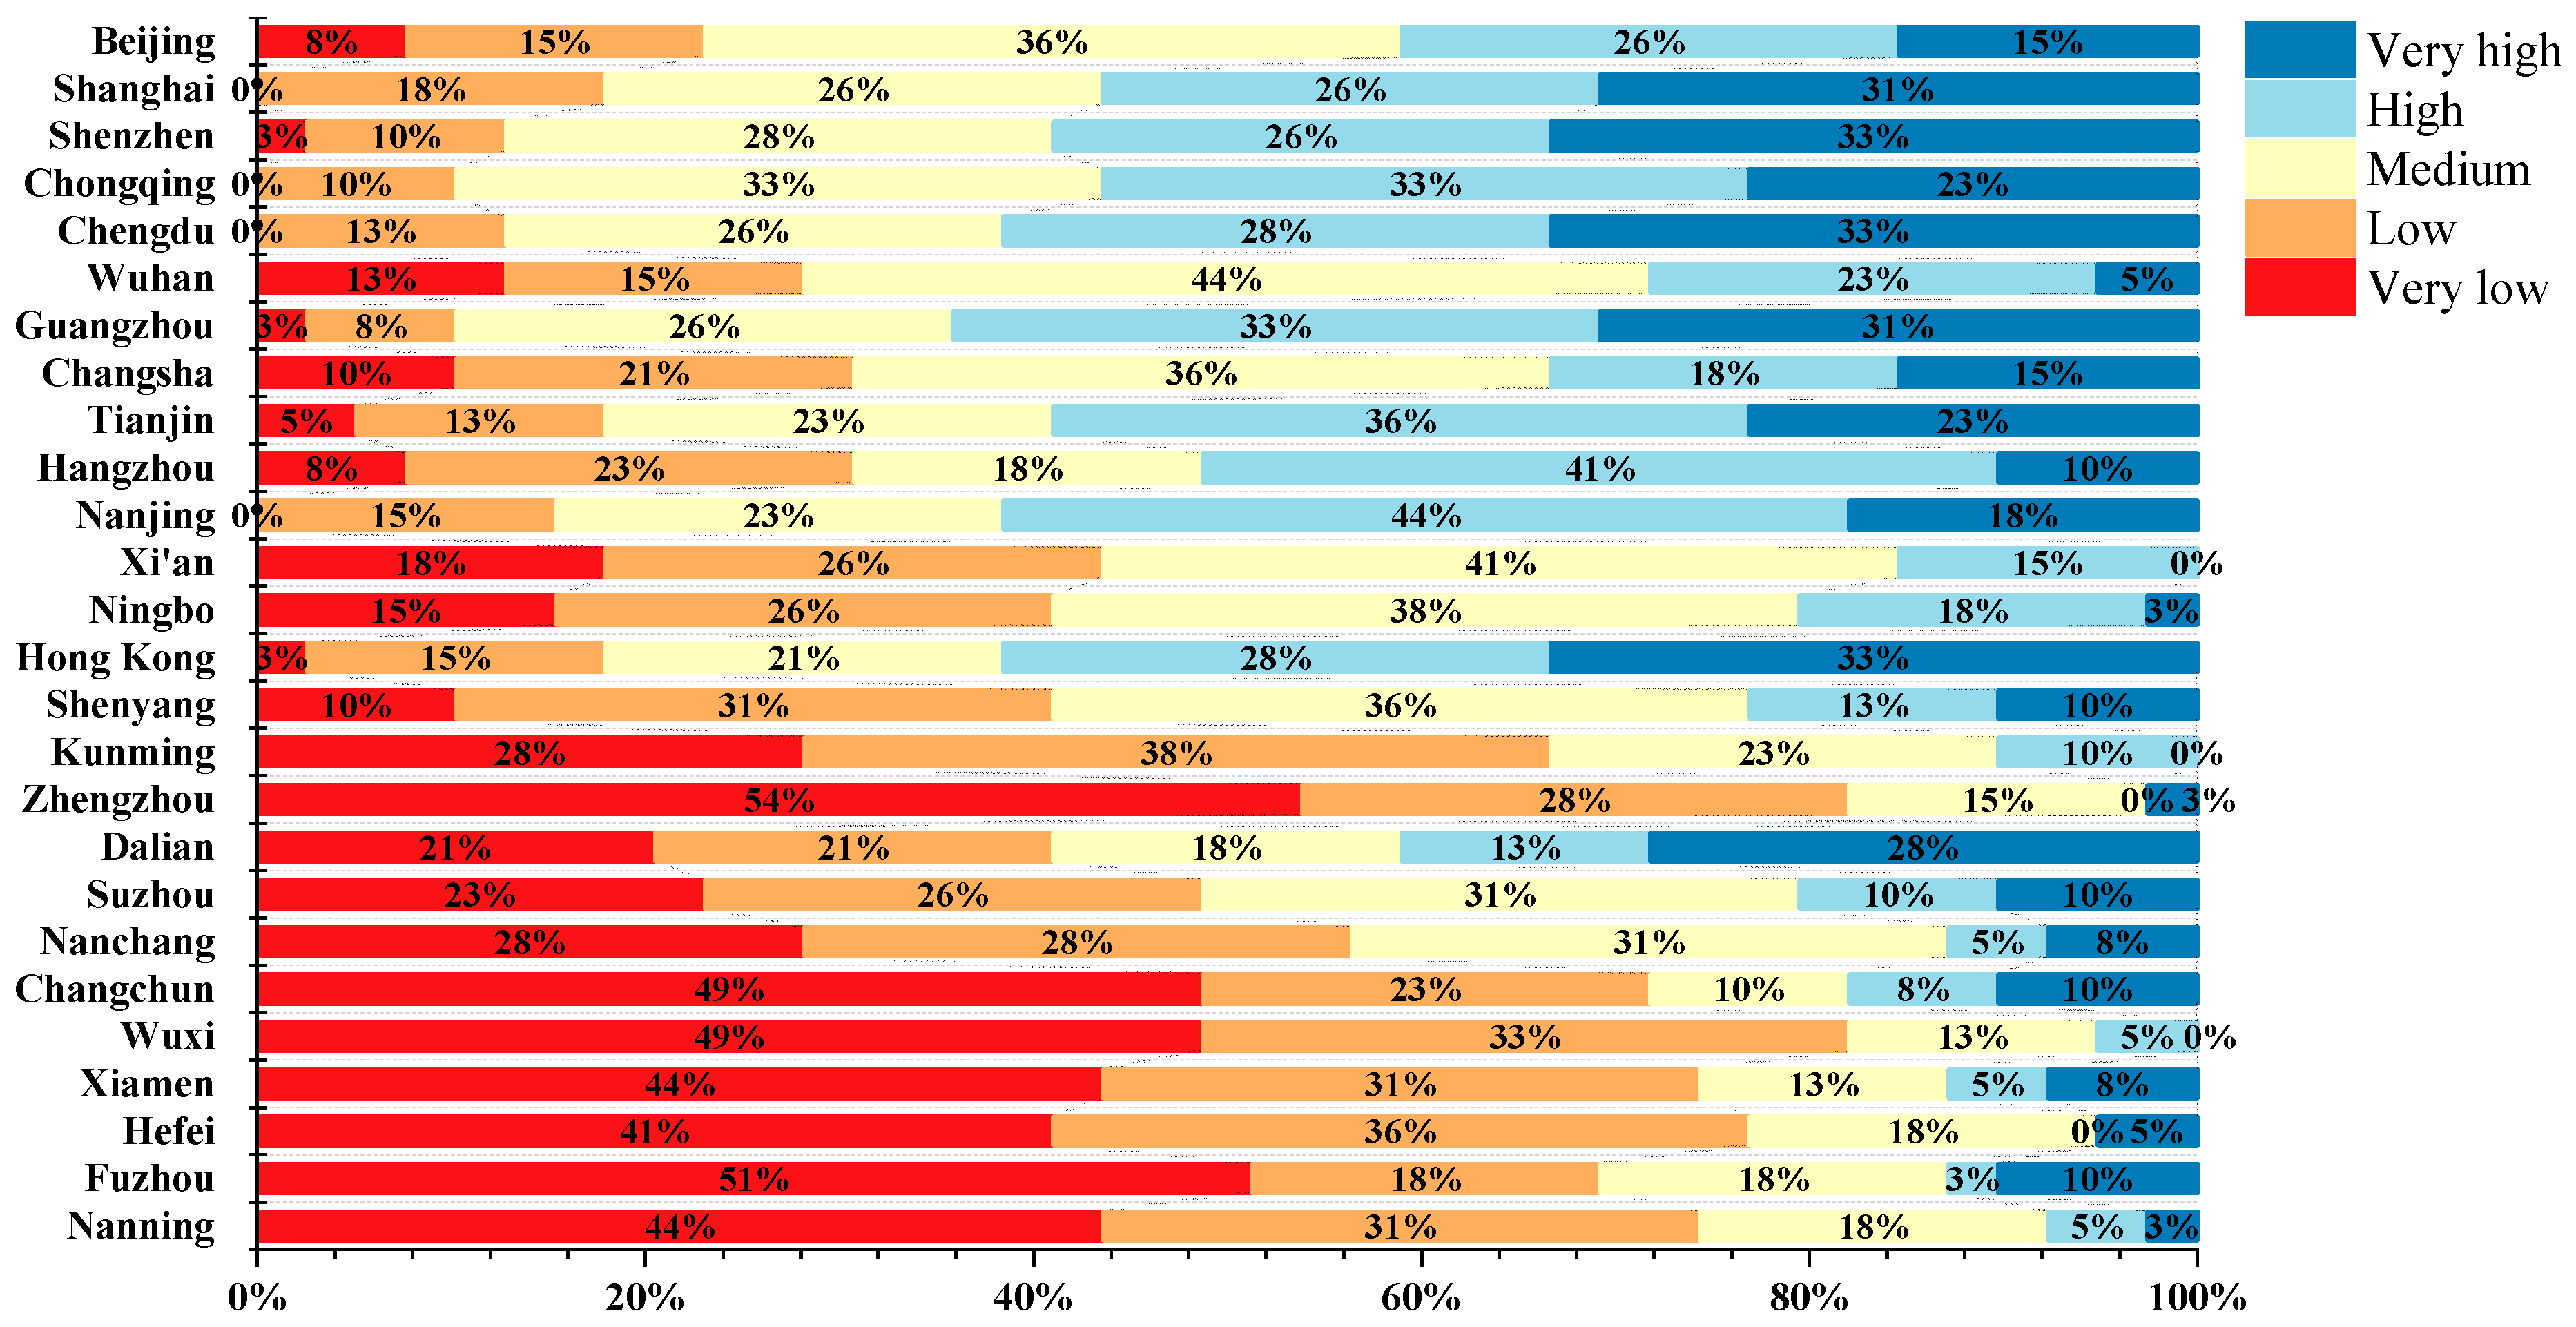
Figure 10 and Figure 11 illustrate the proportions of each grade for 26 cities in questionnaires with the Gaode and official schematic methods, respectively. Table 5 shows the average score of the complexity change of 26 cities’ metro networks simplified by the Gaode and official schematization methods. Figure 12 shows scatter plots with the fractal dimension difference ( D 1 and D 2 ) on the x-axis and average scores ( S 1 and S 2 ) on the y-axis. SCC was calculated to explore the correlation between D and S . The SCC value between D 1 and S 1 was 0.411, while the correlation between D 2 and S 2 was 0.687. The same bootstrapping statistical method was employed, and the calculated confidence intervals (see Table 6) exhibit narrow widths (with a maximum width of approximately 0.07), as shown in Figure 13. Meanwhile, all lower and upper bounds within these intervals present positive values. These results prove a positive correlation between D and S , and they indicate that the complexity change in schematization measured by fractal dimension and scored by subjective opinions has a positive correlation. In addition, such a positive correlation is more evident in official schematization methods than in Gaode schematization methods. It can be inferred that the complexity reduction by official schematization methods is more consistent with subjective opinions than that using Gaode schematization methods.

3.3. Correlation between the Original Metro Network’s Complexity and the Complexity Change of Subjective Opinions

Based on the investigation of the previous section, an original metro network with a large fractal dimension may suffer more in complexity reduction than an original one with a small fractal dimension. Naturally, an inquiry arises regarding the correlation between the original metro network’s complexity measured by fractal dimension and the complexity change in schematization scored by subjective opinions. This section explores this correlation.
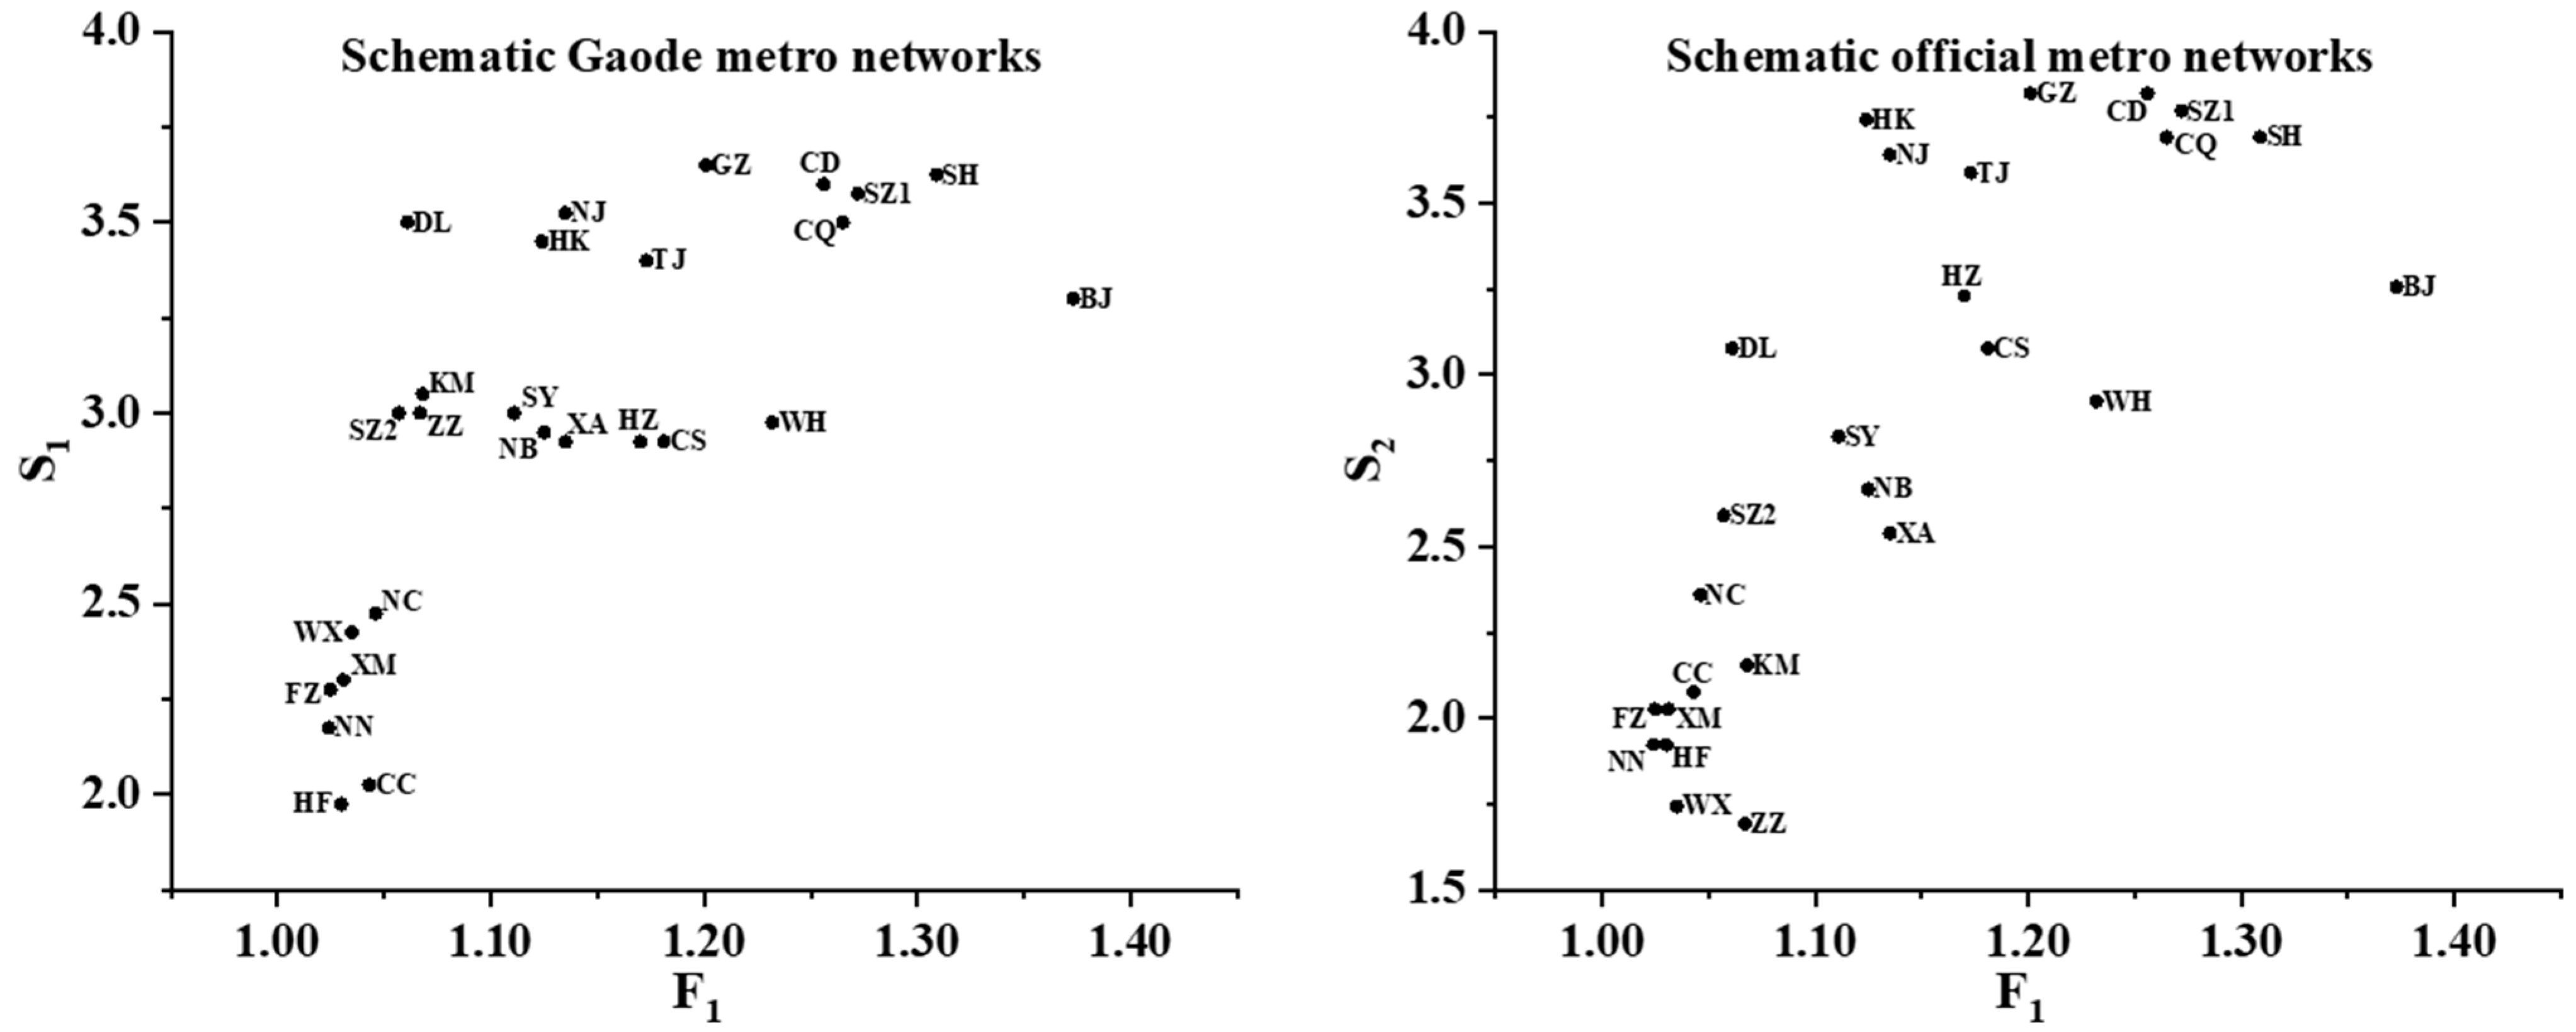
Figure 14 shows scatter plots with the fractal dimensions of the original networks ( F ) on the x-axis and average scores ( S ) on the y-axis. Visually, both plots display a significantly positive correlation. To further quantitatively explore the correlation, this study calculated the SCCs between F 1 and both S 1 and S 2 . The SCC between F 1 and S 1 is 0.745, while that between F 1 and S 2 is 0.824.
Table 7 and Figure 15 show the calculated confidence intervals with narrow widths (with a maximum width of approximately 0.07). All lower and upper bounds within these intervals present positive values. These results indicate a positive correlation between F and S , and they imply that the greater complexity of the original metro network appears to correspond with a more significant complexity reduction in its schematic metro network, as discerned through subjective viewpoints.

4. Discussion

To evaluate fractal dimension in a thorough way, we compared F with two metrics, i.e., Feature Congestion ( F C ) and Edge Density ( E D ), that are widely used for measuring the clutter or complexity of images [43]. The core idea of F C is to consider the differences among features (e.g., luminance contrast and color) of pixels. The calculation of F C for an image is to average the features for all pixels, and the larger F C is, the more complex the image, and vice versa. A MATLAB code for the calculation of F C [43] has been used in this study, and the luminance contrast, color, and orientation of pixels are considered in this code. The core idea of E D is to count the number of pixels covered by the object edge. The calculation of E D follows two steps: (1) detecting the object edges for an image, and (2) calculating the percentage of edge pixels. It is clear that the larger E D is, the more complex the image, and vice versa.
We calculated F C and E D of the original, Gaode schematic, and official schematic metro networks, respectively, for 26 cities, as shown in Table 8. It was found that F C and E D of the schematic metro networks for almost all of the cities are increased when compared with that of the original metro networks. This result indicates that the metro networks become more complex after schematization, which is inconsistent with that of F .
Indeed, the calculation of F C takes the background pixels into consideration. These background pixels make up a large percentage of the pixels, and they have the same luminance contrast, color, and orientation. This leads to an inaccurate measure of the complexity of metro networks. To eliminate the effect of background pixels, we calculated the average of local F C for all metro line pixels, and the results are shown in the “ F C m o d i f i e d ” column of Table 8. It was found that F C m o d i f i e d of the schematic metro networks for almost all of the cities is decreased when compared with that of the original metro networks. This indicates that F C is able to measure the complexity change of networks in schematization but needs to eliminate the effect of background pixels.
The calculation of E D considers the number of metro line pixels; that is, the more pixels there are, the larger the E D . As described in the introduction section, it is essential to enlarge congested areas in schematization (see Figure 16). In this process, the number of metro line pixels usually increases, leading to a larger E D .

5. Conclusions

Schematization has been widely used to represent various spatial and non-spatial networks. How to quantitatively evaluate the usability of schematization methods is still a problem. It is believed that measuring the complexity change of networks in schematization can help to solve this problem. In this study, fractal dimension is employed as an indicator to measure the complexity change. To diminish the effects of design differences in schematization, 26 metro operation systems from one country (i.e., China) with their original and schematic networks were considered. It was found that (1) fractal dimensions of all these metro networks have decreased in schematization, and (2) an original network with a large fractal dimension may suffer more in the fractal dimension reduction than an original network with a small fractal dimension. These results were verified to have trends similar to those of the subjective opinions of participants in a psychological questionnaire. Therefore, it can be concluded that fractal dimension can quantitatively measure the complexity change of metro networks in schematization. These discoveries can provide the basis for using fractal dimensions to evaluate the usability of schematization methods. Future work would explore the effect of design differences (e.g., octilinear and multilinear designs of metro lines) on the complexity change in schematization.

Supplementary Materials

The following supporting information can be downloaded at: https://www.mdpi.com/article/10.3390/ijgi13020038/s1.

Author Contributions

Conceptualization, Tian Lan; methodology, Tian Lan and Zhiwei Wu; investigation, Zhiwei Wu, Chenzhen Sun, Donglin Cheng, Xing Shi and Guangjun Zeng; writing—original draft preparation, Tian Lan; writing—review and editing, Tian Lan and Zhiwei Wu; visualization, Qian Peng; supervision, Hong Zhang; funding acquisition, Tian Lan and Hong Zhang. All authors have read and agreed to the published version of the manuscript.

Funding

This research was funded by the National Natural Science Foundation of China (Grant Nos. 42101442 and 42171420) and the National Key Research and Development Program of China (Grant No. 2022YFB3904202).

Data Availability Statement

The data presented in this study are available upon request from the corresponding authors. The data are not publicly available due to privacy.

Conflicts of Interest

The authors declare no conflicts of interest.

References

  1. Lan, T.; Li, Z.L.; Wang, J.C.; Gong, C.Y.; Ti, P. An ANNs-based method for automated labelling of schematic metro maps. ISPRS Int. J. Geo-Inf. 2022, 11, 36. [Google Scholar] [CrossRef]
  2. Stott, J.; Rodgers, P.; Martínez-Ovando, J.C.; Walker, S.G. Automatic metro map layout using multicriteria optimization. IEEE Trans. Vis. Comput. Graph. 2011, 17, 101–114. [Google Scholar] [CrossRef] [PubMed]
  3. Nöllenburg, M. A survey on automated metro map layout methods. In Proceedings of the 1st Schematic Mapping Workshop, Essex, UK, 2–3 April 2014. [Google Scholar]
  4. Hong, S.-H.; Merrick, D.; do Nascimento, H.A. Automatic visualisation of metro maps. J. Vis. Lang. Comput. 2006, 17, 203–224. [Google Scholar] [CrossRef]
  5. Ti, P.; Wu, H.; Li, Z.L.; Li, M.Y.; Dai, R.Y.; Xiong, T. Revealing schematic map designs with preservation of relativity in node position and segment length in existing official maps. ISPRS Int. J. Geo-Inf. 2023, 12, 309. [Google Scholar] [CrossRef]
  6. Zheng, M.-C.; Liu, Y.-W. Effect of compositions of MRT system route maps on cognitive mapping. ISPRS Int. J. Geo-Inf. 2021, 10, 569. [Google Scholar] [CrossRef]
  7. Forrest, D. The top ten maps of the twentieth century: A personal view. Cartogr. J. 2003, 40, 5–15. [Google Scholar] [CrossRef]
  8. Cartwright, W. Rethinking the definition of the word ‘map’: An evaluation of Beck’s representation of the London Underground through a qualitative expert survey. Int. J. Digit. Earth 2015, 8, 522–537. [Google Scholar] [CrossRef]
  9. Hahn, W.C.; Weinberg, R.A. A subway map of cancer pathways. Nat. Rev. Cancer 2002, 2, 331–334. [Google Scholar] [CrossRef]
  10. Elroi, D.S. Designing a network line-map schematization software enhancement package. In Proceedings of the 8th International ESRI User Conference, Redlands, CA, USA, 21–25 March 1988. [Google Scholar]
  11. Nollenburg, M.; Wolff, A. Drawing and labeling high-quality metro maps by mixed-integer programming. IEEE Trans. Vis. Comput. Graph. 2011, 17, 626–641. [Google Scholar] [CrossRef]
  12. Mark Ware, J.; Taylor, G.E.; Anand, S.; Thomas, N. Automated production of schematic maps for mobile applications. Trans. GIS 2006, 10, 25–42. [Google Scholar] [CrossRef]
  13. Lan, T.; Li, Z.L.; Ti, P. Integrating general principles into mixed-integer programming to optimize schematic network maps. Int. J. Geogr. Inf. Sci. 2019, 33, 2305–2333. [Google Scholar] [CrossRef]
  14. Ware, M.; Richards, N. An Ant Colony System algorithm for automatically schematizing transport network data sets. In Proceedings of the 2013 IEEE Congress on Evolutionary Computation, Cancun, Mexico, 20–23 June 2013; pp. 1892–1900. [Google Scholar]
  15. Galvao, M.; Ramos, F.; Lamar, M.; Taco, P. Dynamic Visualization of Transit Information Using Genetic Algorithms for Path Schematization; Springer: Cham, Switzerland, 2017; pp. 99–113. [Google Scholar]
  16. Li, Z.L.; Dong, W.H. A stroke-based method for automated generation of schematic network maps. Int. J. Geogr. Inf. Sci. 2010, 24, 1631–1647. [Google Scholar] [CrossRef]
  17. Ti, P.; Li, Z.L. Generation of schematic network maps with automated detection and enlargement of congested areas. Int. J. Geogr. Inf. Sci. 2014, 28, 521–540. [Google Scholar] [CrossRef]
  18. Lan, T.; Li, Z.L.; Peng, Q.; Gong, X.Y. Automated labeling of schematic maps by optimization with knowledge acquired from existing maps. Trans. GIS 2020, 24, 1722–1739. [Google Scholar] [CrossRef]
  19. Roberts, M.J.; Newton, E.J.; Lagattolla, F.D.; Hughes, S.; Hasler, M.C. Objective versus subjective measures of Paris Metro map usability: Investigating traditional octolinear versus all-curves schematics. Int. J. Hum.-Comput. Stud. 2013, 71, 363–386. [Google Scholar] [CrossRef]
  20. Roberts, M.J.; Gray, H.; Lesnik, J. Preference versus performance: Investigating the dissociation between objective measures and subjective ratings of usability for schematic metro maps and intuitive theories of design. Int. J. Hum.-Comput. Stud. 2017, 98, 109–128. [Google Scholar] [CrossRef]
  21. Lloyd, P.B.; Rodgers, P.; Roberts, M.J. Metro map colour-coding: Effect on usability in route tracing. In Proceedings of the Diagrammatic Representation and Inference: 10th International Conference, Diagrams 2018, Proceedings 10, Edinburgh, UK, 18–22 June 2018; pp. 411–428. [Google Scholar]
  22. Burch, M.; Raschke, M.; Blascheck, T.; Kurzhals, K.; Weiskopf, D. How do people read metro maps? An eye tracking study. In Proceedings of the 1st Workshop on Schematic Mapping, Essex, UK, 2–3 April 2014; pp. 2–3. [Google Scholar]
  23. Burch, M.; Kurzhals, K.; Weiskopf, D. Visual task solution strategies in public transport maps. In Proceedings of the 2nd International Workshop on Eye Tracking for Spatial Research, Vienna, Austria, 23 September 2014; pp. 32–36. [Google Scholar]
  24. Liu, Z.; Li, Z.L. Impact of schematic designs on the cognition of underground tube maps. Int. Arch. Photogramm. Remote Sens. Spat. Inf. Sci. 2016, 41, 421–423. [Google Scholar] [CrossRef]
  25. Netzel, R.; Ohlhausen, B.; Kurzhals, K.; Woods, R.; Burch, M.; Weiskopf, D. User performance and reading strategies for metro maps: An eye tracking study. Spat. Cogn. Comput. 2017, 17, 39–64. [Google Scholar] [CrossRef]
  26. Goodchild, M.F. Fractals and the accuracy of geographical measures. J. Int. Assoc. Math. Geol. 1980, 12, 85–98. [Google Scholar] [CrossRef]
  27. Yan Guang, C.; Jing, L. The fractal features of the transport network of Henan Province. J. Xinyang Norm. Univ. (Nat. Sci. Ed.) 1998, 11, 172–177. [Google Scholar]
  28. Fairbairn, D. Measuring map complexity. Cartogr. J. 2006, 43, 224–238. [Google Scholar] [CrossRef]
  29. Mohajeri, N.; Longley, P.; Batty, M. City shape and the fractality of street patterns. Quaest. Geogr. 2012, 31, 29–37. [Google Scholar] [CrossRef]
  30. Lan, T.; Li, Z.L.; Zhang, H. Urban allometric scaling beneath structural fractality of road networks. Ann. Am. Assoc. Geogr. 2019, 109, 943–957. [Google Scholar] [CrossRef]
  31. Zhang, H.; Gao, P.C.; Lan, T.; Liu, C.L. Exploring the structural fractality of urban road networks by different representations. Prof. Geogr. 2021, 73, 348–362. [Google Scholar] [CrossRef]
  32. Mandelbrot, B. How long is the coast of Britain? Statistical self-similarity and fractional dimension. Science 1967, 156, 636–638. [Google Scholar] [CrossRef]
  33. Mandelbrot, B.B. The Fractal Geometry of Nature; WH Freeman: New York, NY, USA, 1982; Volume 1. [Google Scholar]
  34. Jiang, B.; Yin, J.J. Ht-index for quantifying the fractal or scaling structure of geographic features. Ann. Assoc. Am. Geogr. 2014, 104, 530–540. [Google Scholar] [CrossRef]
  35. Gao, P.C.; Liu, Z.; Liu, G.; Zhao, H.R.; Xie, X.X. Unified metrics for characterizing the fractal nature of geographic features. Ann. Am. Assoc. Geogr. 2017, 107, 1315–1331. [Google Scholar] [CrossRef]
  36. Batty, M.; Longley, P.A. The fractal simulation of urban structure. Environ. Plan. A 1986, 18, 1143–1179. [Google Scholar] [CrossRef]
  37. Mandelbrot, B.B. Stochastic models for the Earth’s relief, the shape and the fractal dimension of the coastlines, and the number-area rule for islands. Proc. Natl. Acad. Sci. USA 1975, 72, 3825–3828. [Google Scholar] [CrossRef]
  38. Gagnepain, J.; Roques-Carmes, C. Fractal approach to two-dimensional and three-dimensional surface roughness. Wear 1986, 109, 119–126. [Google Scholar] [CrossRef]
  39. Benguigui, L. A fractal analysis of the public transportation system of Paris. Environ. Plan. A 1995, 27, 1147–1161. [Google Scholar] [CrossRef]
  40. Lu, Y.M.; Tang, J.M. Fractal dimension of a transportation network and its relationship with urban growth: A study of the Dallas-Fort Worth area. Environ. Plan. B Plan. Des. 2004, 31, 895–911. [Google Scholar] [CrossRef]
  41. Lan, T.; Peng, Q.; Wang, H.Y.; Gong, X.Y.; Li, J.; Shi, Z.C. Exploring allometric scaling relations between fractal dimensions of metro networks and economic, environmental and social indicators: A case study of 26 cities in China. ISPRS Int. J. Geo-Inf. 2021, 10, 429. [Google Scholar] [CrossRef]
  42. Prah, K.; Shortridge, A.M. Vertical vs. Horizontal fractal dimensions of roads in relation to relief characteristics. ISPRS Int. J. Geo-Inf. 2023, 12, 487. [Google Scholar] [CrossRef]
  43. Rosenholtz, R.; Li, Y.Z.; Nakano, L. Measuring visual clutter. J. Vis. 2007, 7, 17. [Google Scholar] [CrossRef]
Figure 1. Hong Kong metro maps (China-Mike 2020; MTR 2020).
Ijgi 13 00038 g001
Figure 2. Examples of non-spatial schematic networks: cancer path [9] and project plan networks (https://www.biggerplate.com/mindmaps/ptloNDXs/project-schedule-network-diagram, accessed on 16 November 2023).
Ijgi 13 00038 g002
Figure 3. Some examples of original and schematic network maps (all of the network data of 26 Chinese cities can be found in the supplementary material).
Ijgi 13 00038 g003
Figure 4. Two steps of calculating box-counting fractal dimension for a schematic metro network. Step 1: obtain the number of boxes ( N ) that cover the line feature for various box sizes ( l ). Step 2: calculate the fractal dimension ( d ) by fitting the log–log function log N = d × log l + a .
Ijgi 13 00038 g004
Figure 5. The schematic metro networks with the largest, medium, and smallest of D 1 and D 2 .
Ijgi 13 00038 g005
Figure 6. Relations between fractal dimensions of original metro networks and the difference of fractal dimensions after schematization. The abbreviation of cities’ names is as follows. BJ: Beijing, SH: Shanghai, SZ 1: Shenzhen, CQ: Chongqing, CD: Chengdu, WH: Wuhan, GZ: Guangzhou, CS: Changsha, TJ: Tianjin, HZ: Hangzhou, NJ: Nanjing, XA: Xi’an, NB: Ningbo, SY: Shenyang, HK: Hong Kong, KM: Kunming, ZZ: Zhengzhou, DL: Dalian, SZ 2: Suzhou, NC: Nanchang, CC: Changchun, WX: Wuxi, XM: Xiamen, HF: Hefei, FZ: Fuzhou, NN: Nanning.
Ijgi 13 00038 g006
Figure 7. Confidence intervals of SCC between F and D .
Ijgi 13 00038 g007
Figure 8. An example of the original and schematic metro networks in the psychological questionnaire.
Ijgi 13 00038 g008
Figure 9. Three illustrative instances representing “very high”, “medium”, and “very low” levels of complexity change in the psychological questionnaire.
Ijgi 13 00038 g009
Figure 10. The proportions of each grade in questionnaires with Gaode schematic methods.
Ijgi 13 00038 g010
Figure 11. The proportions of each grade in questionnaires with official schematic methods.
Ijgi 13 00038 g011
Figure 12. Relations between the fractal dimension differences and average scores.
Ijgi 13 00038 g012
Figure 13. Confidence intervals of SCC between D and S .
Ijgi 13 00038 g013
Figure 14. Relations between the fractal dimensions of original metro networks and average scores.
Ijgi 13 00038 g014
Figure 15. Confidence intervals of SCC between F and S .
Ijgi 13 00038 g015
Figure 16. Congested areas of metro networks are enlarged by schematic methods.
Ijgi 13 00038 g016
Table 1. Fractal dimensions of metro networks in 26 cities.
City F 1 R 1 F 2 R 2 F 3 R 3 D 1 D 2
Beijing1.3730.9991.1870.9981.2100.9980.1860.163
Shanghai1.3090.9981.1620.9981.1570.9980.1470.152
Shenzhen1.2720.9981.2570.9981.1950.9980.0150.077
Chongqing1.2650.9981.0970.9991.0950.9990.1680.170
Chengdu1.2560.9991.1070.9981.1350.9990.1490.121
Wuhan1.2320.9991.1700.9991.1610.9990.0620.071
Guangzhou1.2010.9981.1480.9981.1200.9980.0530.081
Changsha1.1810.9991.0410.9991.0490.9990.1400.132
Tianjin1.1730.9991.0770.9991.0580.9990.0960.115
Hangzhou1.1700.9981.0970.9991.1070.9990.0730.063
Nanjing1.1350.9991.0880.9981.0920.9980.0470.043
Xi’an1.1350.9981.0620.9991.0510.9990.0730.084
Ningbo1.1250.9991.0330.9991.0190.9990.0920.106
Hong Kong1.1240.9991.1230.9991.1090.9990.0010.015
Shenyang1.1110.9991.0560.9991.0360.9990.0550.075
Kunming1.0680.9991.0460.9991.0430.9990.0220.025
Zhengzhou1.0670.9991.0600.9991.0550.9990.0070.012
Dalian1.0610.9991.0030.9991.0020.9990.0580.059
Suzhou1.0570.9991.0300.9991.0110.9990.0270.046
Nanchang1.0460.9991.0320.9991.0220.9980.0140.024
Changchun1.0430.9991.0230.9991.0340.9990.0200.009
Wuxi1.0350.9991.0160.9991.0110.9990.0190.024
Xiamen1.0310.9991.0010.9991.0020.9990.0300.029
Hefei1.0300.9991.0210.9991.0220.9990.0090.008
Fuzhou1.0250.9991.0070.9991.0010.9990.0180.024
Nanning1.0240.9991.0180.9991.0240.9990.0060.000
Note: F 1 , F 2 , and F 3 refer to the fractal dimensions of original metro networks, schematic Gaode networks, and schematic official networks, respectively; R 1 , R 2 , and R 3 refer to the values of the adjusted R-square when calculating F 1 , F 2 , and F 3 in the log–log plots; D 1 and D 2 are the differences between fractal dimensions of original and schematic networks, i.e., D 1 = F 1 F 2 and D 2 = F 1 F 3 .
Table 2. Confidence intervals of SCC between F and D calculated using bootstrapping.
Paired Observations F 1   and   D 1 F 1   and   D 2
Spearman correlation coefficient0.7150.853
95% Confidence Interval(0.690, 0.739)(0.844, 0.861)
90% Confidence Interval(0.694, 0.736)(0.846, 0.860)
85% Confidence Interval(0.696, 0.733)(0.846, 0.859)
80% Confidence Interval(0.698, 0.731)(0.847, 0.858)
75% Confidence Interval(0.700, 0.729)(0.847, 0.858)
70% Confidence Interval(0.702, 0.728)(0.848, 0.857)
65% Confidence Interval(0.703, 0.726)(0.848, 0.857)
60% Confidence Interval(0.704, 0.725)(0.849, 0.857)
55% Confidence Interval(0.705, 0.724)(0.849, 0.856)
50% Confidence Interval(0.707, 0.724)(0.850, 0.856)
45% Confidence Interval(0.708, 0.723)(0.850, 0.855)
40% Confidence Interval(0.709, 0.722)(0.850, 0.855)
35% Confidence Interval(0.709, 0.721)(0.851, 0.855)
30% Confidence Interval(0.710, 0.720)(0.851, 0.855)
25% Confidence Interval(0.711, 0.719)(0.851, 0.854)
20% Confidence Interval(0.712, 0.719)(0.851, 0.854)
15% Confidence Interval(0.713, 0.718)(0.852, 0.854)
10% Confidence Interval(0.714, 0.717)(0.852, 0.853)
5% Confidence Interval(0.714, 0.716)(0.852, 0.853)
Table 3. The 5-grade marking system for scoring complexity change.
AspectScore (Total 5 Scores)
12345
Complexity change comparing the original schematic metro networksVery lowLowMediumHighVery high
Table 4. The detailed information of questionnaires.
MethodValid RecordsGender
(Male/Female)
Age RangeCartography
Background
Other
Backgrounds
Gaode4022/1818–60337
Official3925/1418–50354
Table 5. Average scores of complexity change of 26 cities’ metro networks simplified by Gaode and official schematization methods.
CityOriginal NetworkSchematic Gaode
Network
Schematic Official
Network
F 1 S 1 D 1 S 2 D 2
Beijing1.3733.3000.1863.2560.163
Shanghai1.3093.6250.1473.6920.152
Shenzhen1.2723.5750.0153.7690.077
Chongqing1.2653.5000.1683.6920.170
Chengdu1.2563.6000.1493.8210.121
Wuhan1.2322.9750.0622.9230.071
Guangzhou1.2013.6500.0533.8210.081
Changsha1.1812.9250.1403.0770.132
Tianjin1.1733.4000.0963.5900.115
Hangzhou1.1702.9250.0733.2310.063
Nanjing1.1353.5250.0473.6410.043
Xi’an1.1352.9250.0732.5380.084
Ningbo1.1252.9500.0922.6670.106
Hong Kong1.1243.4500.0013.7440.015
Shenyang1.1113.0000.0552.8210.075
Kunming1.0683.0500.0222.1540.025
Zhengzhou1.0673.0000.0071.6920.012
Dalian1.0613.5000.0583.0770.059
Suzhou1.0573.0000.0272.5900.046
Nanchang1.0462.4750.0142.3590.024
Changchun1.0432.0250.0202.0770.009
Wuxi1.0352.4250.0191.7440.024
Xiamen1.0312.3000.0302.0260.029
Hefei1.0301.9750.0091.9230.008
Fuzhou1.0252.2750.0182.0260.024
Nanning1.0242.1750.0061.9230.000
Table 6. Confidence intervals of SCC between D and S calculated using bootstrapping.
Paired Observations D 1   and   S 1 D 2   and   S 2
Spearman correlation coefficient0.4110.687
95% Confidence Interval(0.377, 0.444)(0.660, 0.712)
90% Confidence Interval(0.382, 0.439)(0.664, 0.707)
85% Confidence Interval(0.386, 0.436)(0.667, 0.706)
80% Confidence Interval(0.389, 0.434)(0.669, 0.704)
75% Confidence Interval(0.391, 0.432)(0.671, 0.702)
70% Confidence Interval(0.393, 0.429)(0.673, 0.700)
65% Confidence Interval(0.395, 0.427)(0.674, 0.698)
60% Confidence Interval(0.396, 0.426)(0.676, 0.697)
55% Confidence Interval(0.398, 0.424)(0.677, 0.696)
50% Confidence Interval(0.399, 0.423)(0.678, 0.695)
45% Confidence Interval(0.400, 0.422)(0.679, 0.694)
40% Confidence Interval(0.402, 0.421)(0.680, 0.694)
35% Confidence Interval(0.403, 0.420)(0.681, 0.693)
30% Confidence Interval(0.405, 0.418)(0.682, 0.692)
25% Confidence Interval(0.406, 0.417)(0.683, 0.691)
20% Confidence Interval(0.407, 0.416)(0.684, 0.690)
15% Confidence Interval(0.408, 0.415)(0.685, 0.689)
10% Confidence Interval(0.409, 0.414)(0.685, 0.689)
5% Confidence Interval(0.411, 0.413)(0.686, 0.688)
Table 7. Confidence intervals of SCC between F and S calculated using bootstrapping.
Paired Observations F 1   and   S 1 F 1   and   S 2
Spearman correlation coefficient0.7450.824
95% Confidence Interval(0.723, 0.764)(0.812, 0.835)
90% Confidence Interval(0.728, 0.762)(0.814, 0.832)
85% Confidence Interval(0.730, 0.759)(0.816, 0.831)
80% Confidence Interval(0.732, 0.758)(0.816, 0.830)
75% Confidence Interval(0.733, 0.756)(0.817, 0.829)
70% Confidence Interval(0.734, 0.755)(0.818, 0.829)
65% Confidence Interval(0.735, 0.754)(0.818, 0.828)
60% Confidence Interval(0.736, 0.753)(0.819, 0.828)
55% Confidence Interval(0.737, 0.752)(0.819, 0.828)
50% Confidence Interval(0.738, 0.752)(0.820, 0.827)
45% Confidence Interval(0.738, 0.751)(0.820, 0.827)
40% Confidence Interval(0.739, 0.751)(0.821, 0.827)
35% Confidence Interval(0.740, 0.750)(0.821, 0.826)
30% Confidence Interval(0.741, 0.749)(0.821, 0.826)
25% Confidence Interval(0.741, 0.748)(0.822, 0.825)
20% Confidence Interval(0.742, 0.747)(0.822, 0.825)
15% Confidence Interval(0.743, 0.747)(0.823, 0.825)
10% Confidence Interval(0.743, 0.746)(0.823, 0.824)
5% Confidence Interval(0.744, 0.745)(0.823, 0.824)
Table 8. F C , E D , and F C m o d i f i e d of metro networks in 26 cities.
CityOriginal NetworkGaode Schematic NetworkOfficial Schematic Network
E D F C F C m o d i f i e d E D F C F C m o d i f i e d E D F C F C m o d i f i e d
Beijing0.01513.17816.05300.02033.64455.61730.02123.78525.8693
Shanghai0.01443.10515.62470.02414.10726.25930.02464.12096.3228
Shenzhen0.01613.32845.51080.01873.44175.83380.02133.70055.4791
Chongqing0.01132.84935.61350.01573.14175.39540.01863.58355.2646
Chengdu0.01403.06585.45780.02133.64865.55350.02764.35875.2923
Wuhan0.01182.86895.31000.01162.62245.10090.01482.88904.9391
Guangzhou0.00952.56555.23330.01753.36684.91640.01863.47064.8253
Changsha0.00942.58724.69730.01072.58344.18490.00912.37074.3177
Tianjin0.00742.27315.05080.01432.99044.39200.01412.93224.3624
Hangzhou0.00752.33244.90700.00922.40104.82830.01202.71704.6717
Nanjing0.00541.98414.80540.00972.37944.46080.01092.56384.4574
Xi’an0.01092.77654.45170.00932.43924.23560.01142.73784.2618
Ningbo0.00782.39364.32180.00982.42613.92330.00872.25313.8586
Hong Kong0.01032.70484.63390.01633.13244.62630.01683.13594.5962
Shenyang0.00832.40204.32810.00902.41334.21480.00702.09843.9724
Kunming0.00742.31694.62830.00822.19554.24820.00692.08584.3488
Zhengzhou0.00962.56774.91290.01082.59764.67020.00942.45034.7618
Dalian0.00411.88174.45390.00541.94743.88930.00581.99433.7701
Suzhou0.00862.50584.68230.00862.35854.32950.00822.27854.3417
Nanchang0.00652.14044.33990.00672.09434.01810.00742.16874.0834
Changchun0.00752.24754.16240.00772.18753.95890.00692.07253.9943
Wuxi0.00642.15444.16730.00662.10623.94280.00662.08113.9722
Xiamen0.00602.11433.95690.00631.98913.60940.00531.87173.5871
Hefei0.00792.32794.18530.00832.28143.88800.00782.20203.9378
Fuzhou0.00491.92343.79030.00481.83343.59910.00531.91273.7133
Nanning0.00772.35314.22860.00792.21583.89780.00832.23633.8855
Disclaimer/Publisher’s Note: The statements, opinions and data contained in all publications are solely those of the individual author(s) and contributor(s) and not of MDPI and/or the editor(s). MDPI and/or the editor(s) disclaim responsibility for any injury to people or property resulting from any ideas, methods, instructions or products referred to in the content.