


Enhancing the K-Means Algorithm through a Genetic Algorithm Based on Survey and Social Media Tourism Objectives for Tourism Path Recommendations
 ,
,  , ,
, ,
Abstract
1. Introduction
- ➢
- Enhancing the traditional k-means algorithm by using the GA to determine initial seeds, selecting the appropriate number of clusters (k), and recommending the best tourism path based on survey and social media tourism objectives.
- ➢
- Collecting the tourism objectives from social media platforms through an online questionnaire and from TripAdvisor.
- ➢
- Selecting and visualizing the optimal tourism path using GAs and the geographic information system (GIS) environment.
- ➢
- Demonstrating the optimal time to implement the GA algorithm for finding the best tourism path through a comparison of our approach with other state-of-the-art methods.
Related Work
2. Methodology
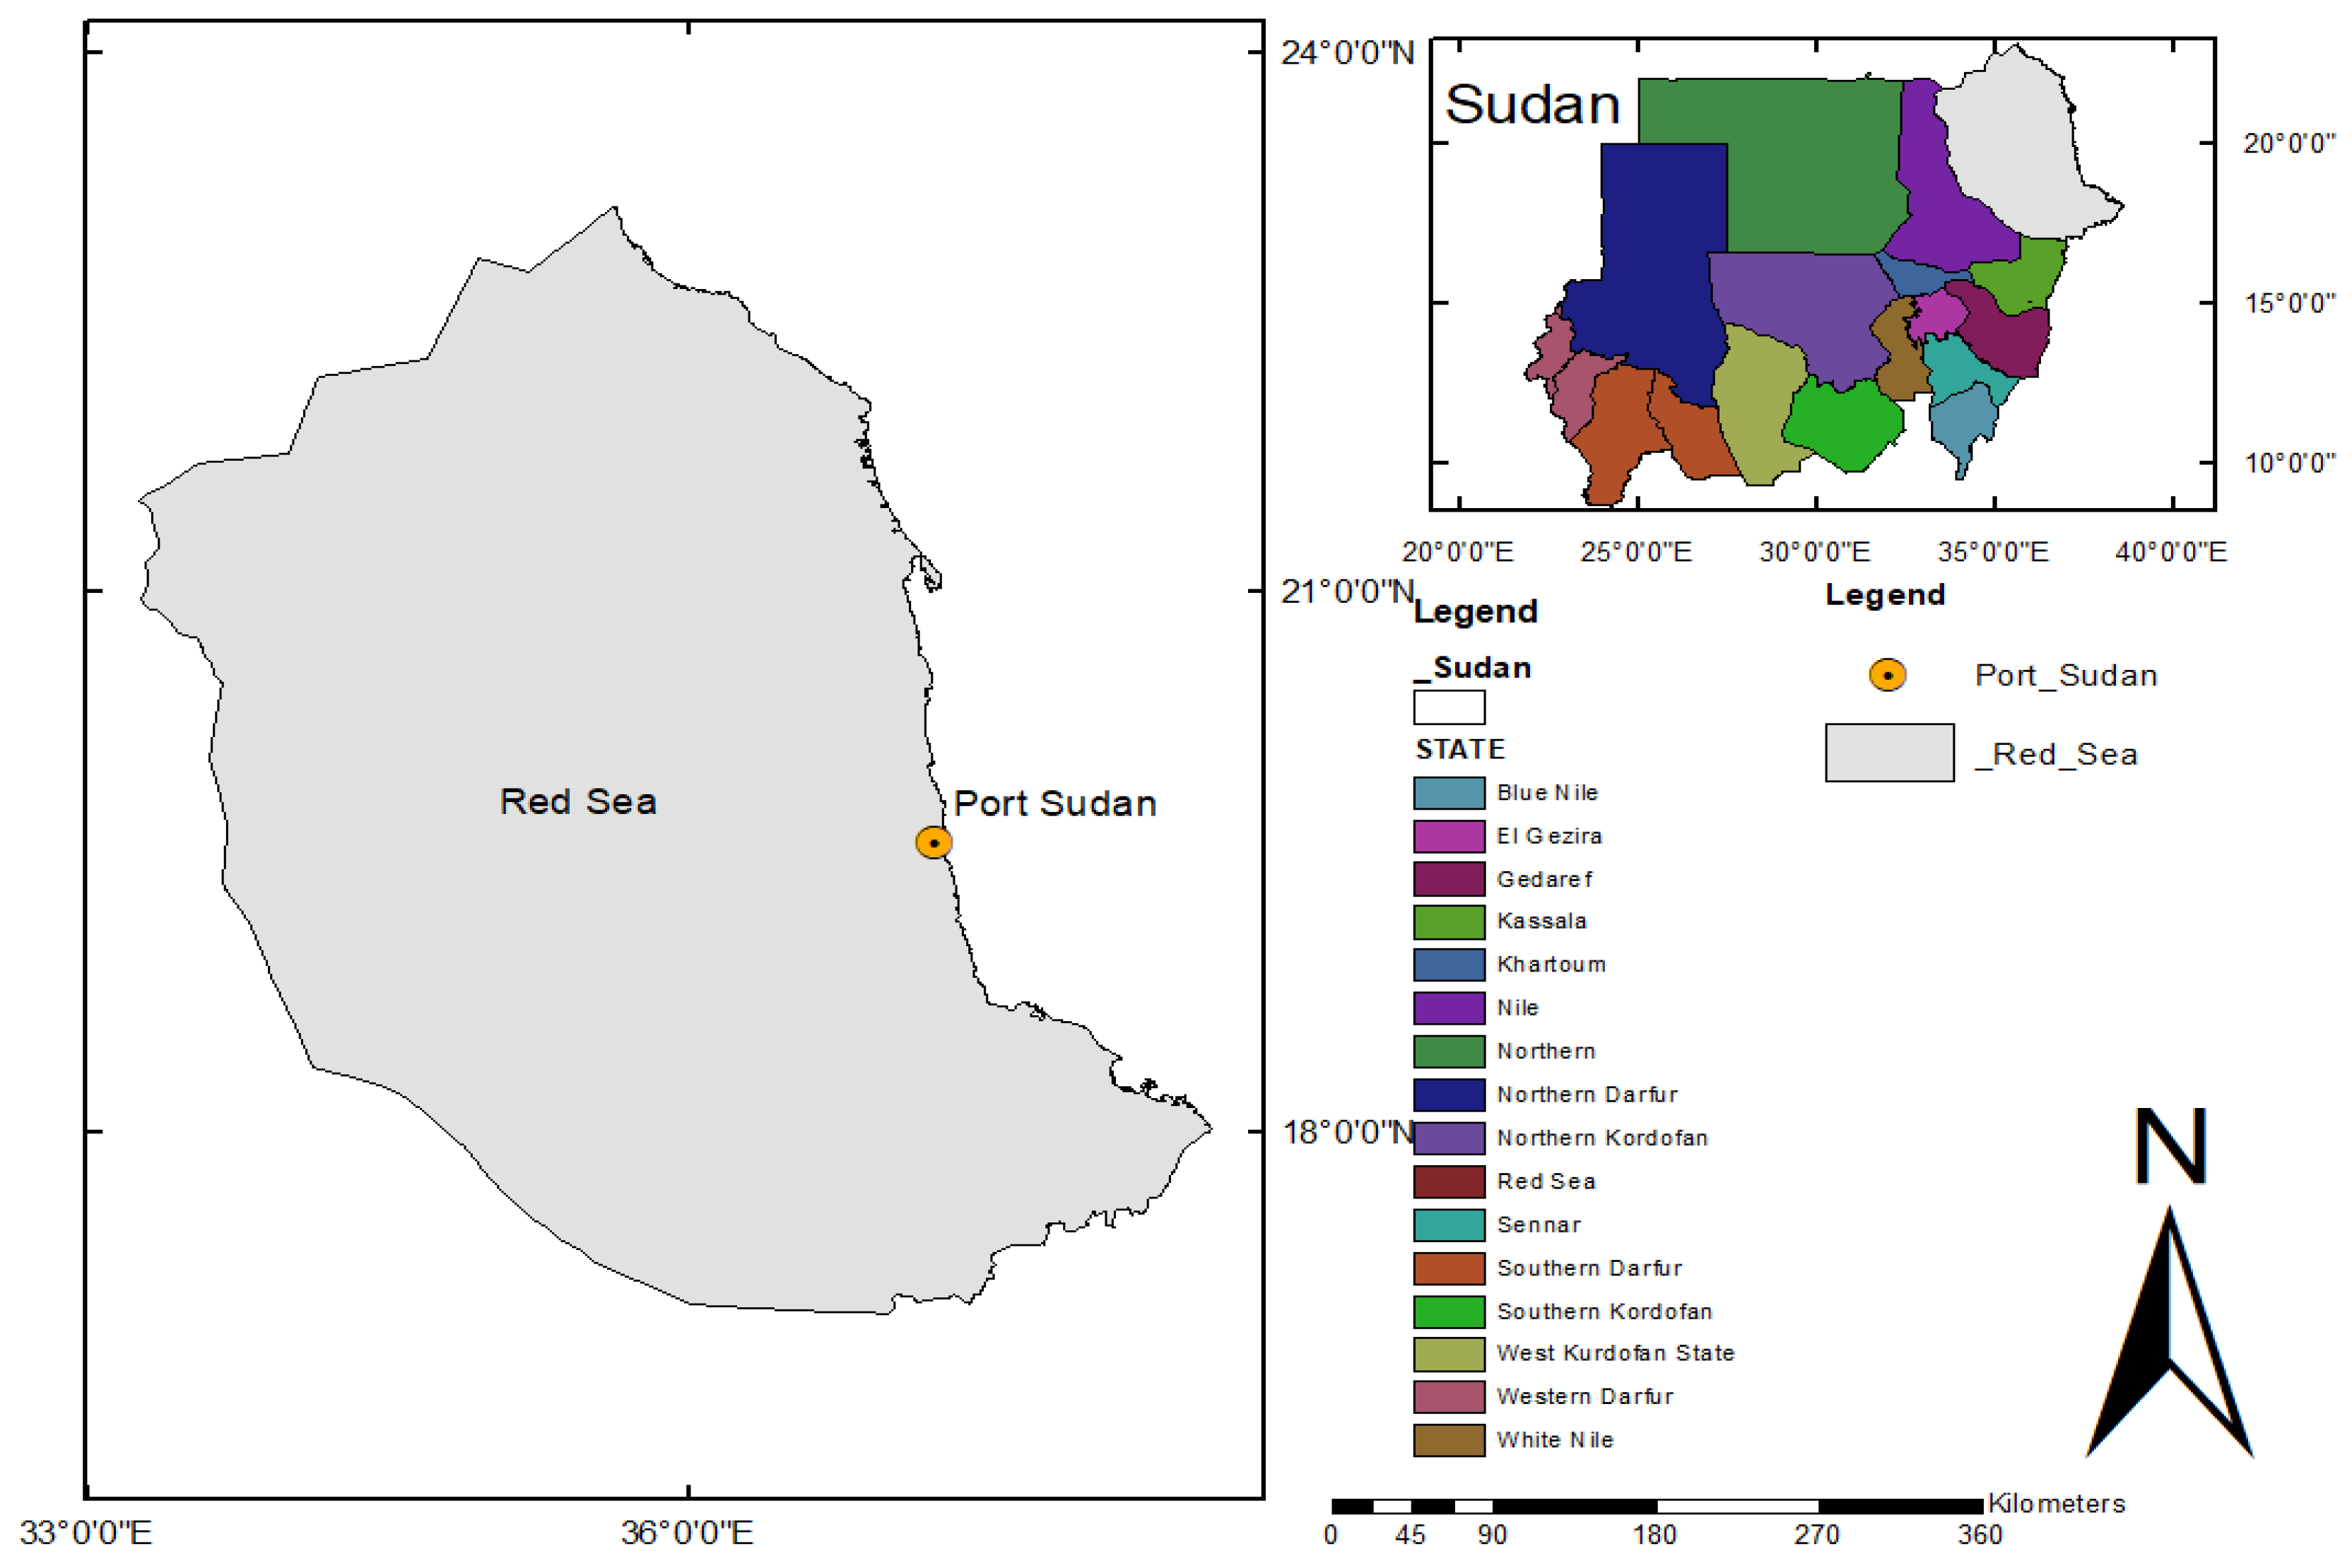
2.1. Survey and Social Media Data
2.2. Selection Objectives
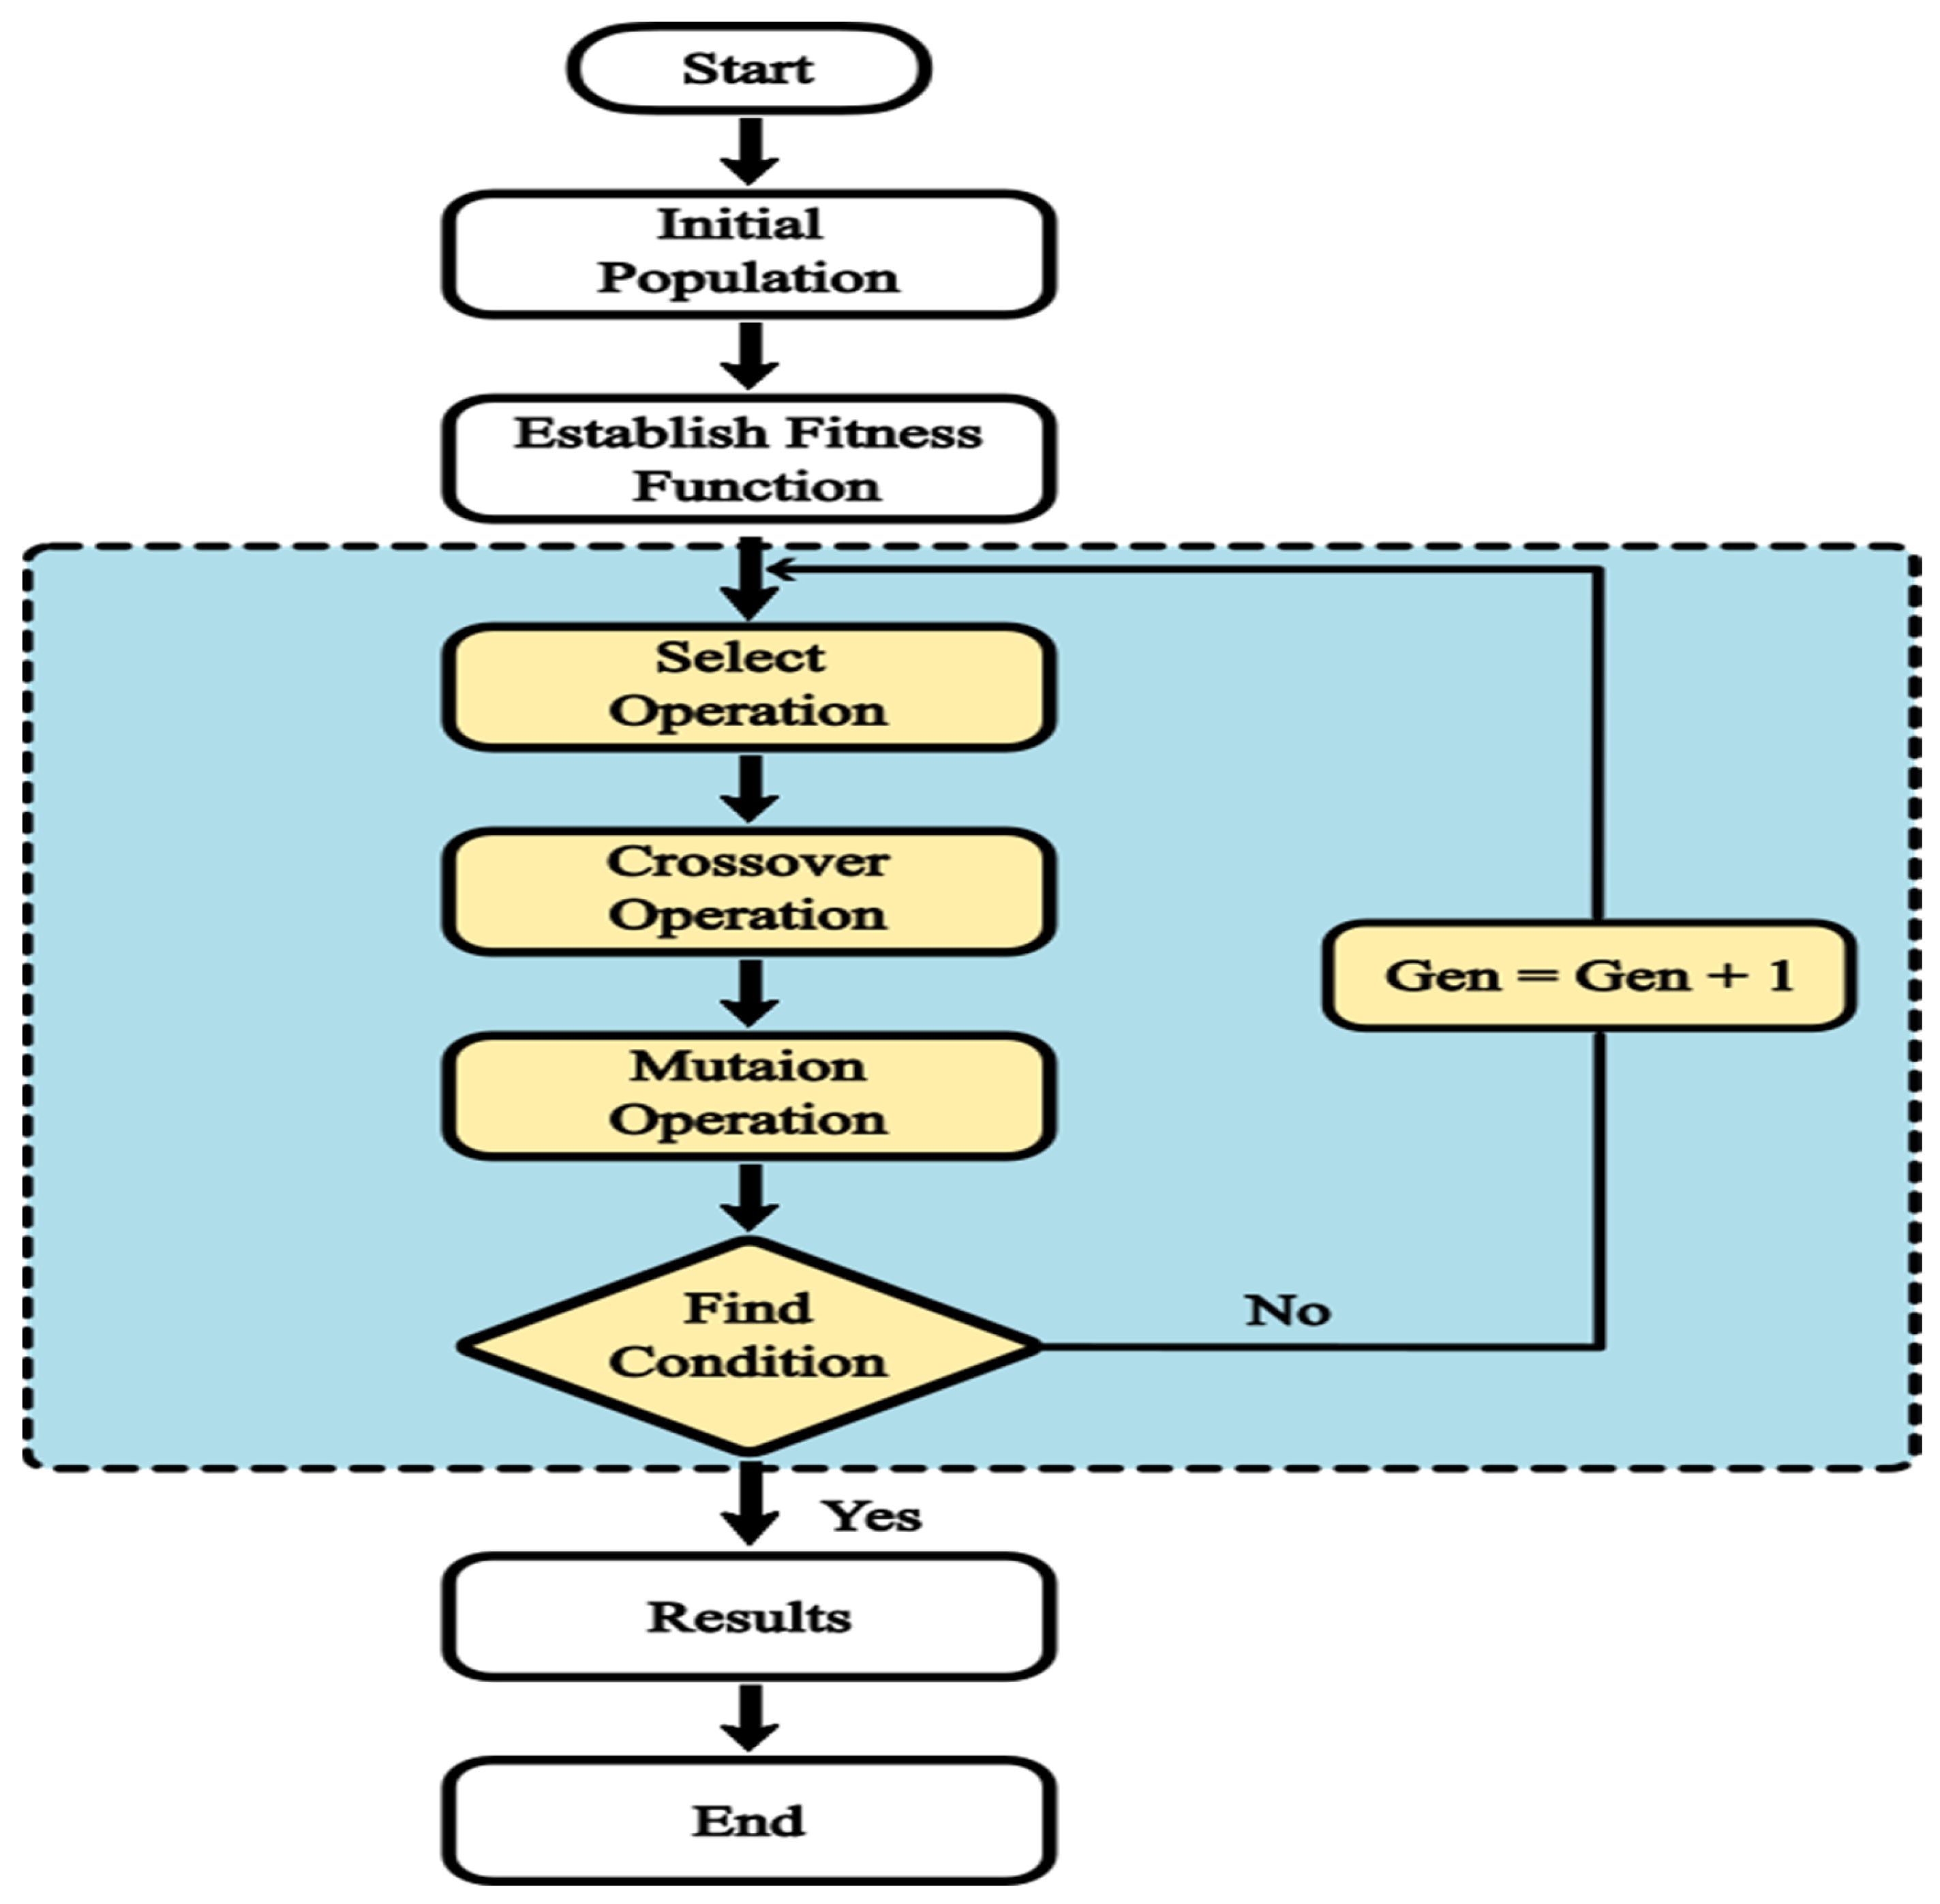
2.3. Genetic Algorithm
- Initialization: population of possible solutions is generated randomly.
- Evaluation: each solution is tested for its fitness to use a successful fitness function.
- Selection: more fitness functions are chosen to be the parents of the following generation.
- Crossover: new individuals are generated by combining the existing genetic material of the selected parents.
- Mutation: new individuals may undergo mutation, which introduces small changes in parents and a new generation replaces the old generation. The algorithm stops when a stopping parameter is satisfied, such as a set number of generations or a successful solution. Figure 2 shows the GA operations.
2.4. K-Means Algorithm
- ➢
- Choose several clusters k.
- ➢
- Randomly initialize k centroid.
- ➢
- After the initial centroids have been selected at random, decide on each point nearest to the centroid.
- ➢
- Recalculate the centroids according to the new value of the mean of all the data points in that cluster. If given two points x and y, cluster C with k data points (, …, then the centroid C is calculated as ( ( + + …… + )).
- ➢
- Repeat the 3–4 steps until the centroids stop moving altogether or the maximum number of iterations has been achieved.
- ➢
- The k-means algorithm aims are determined and then find the minimized sum distance between the data and determine the centroid. Many methods can be used to determine distance such as the Euclidean distance method; this method is most commonly used if given two points x and y and the Euclidean distance is calculated as Equation (1):
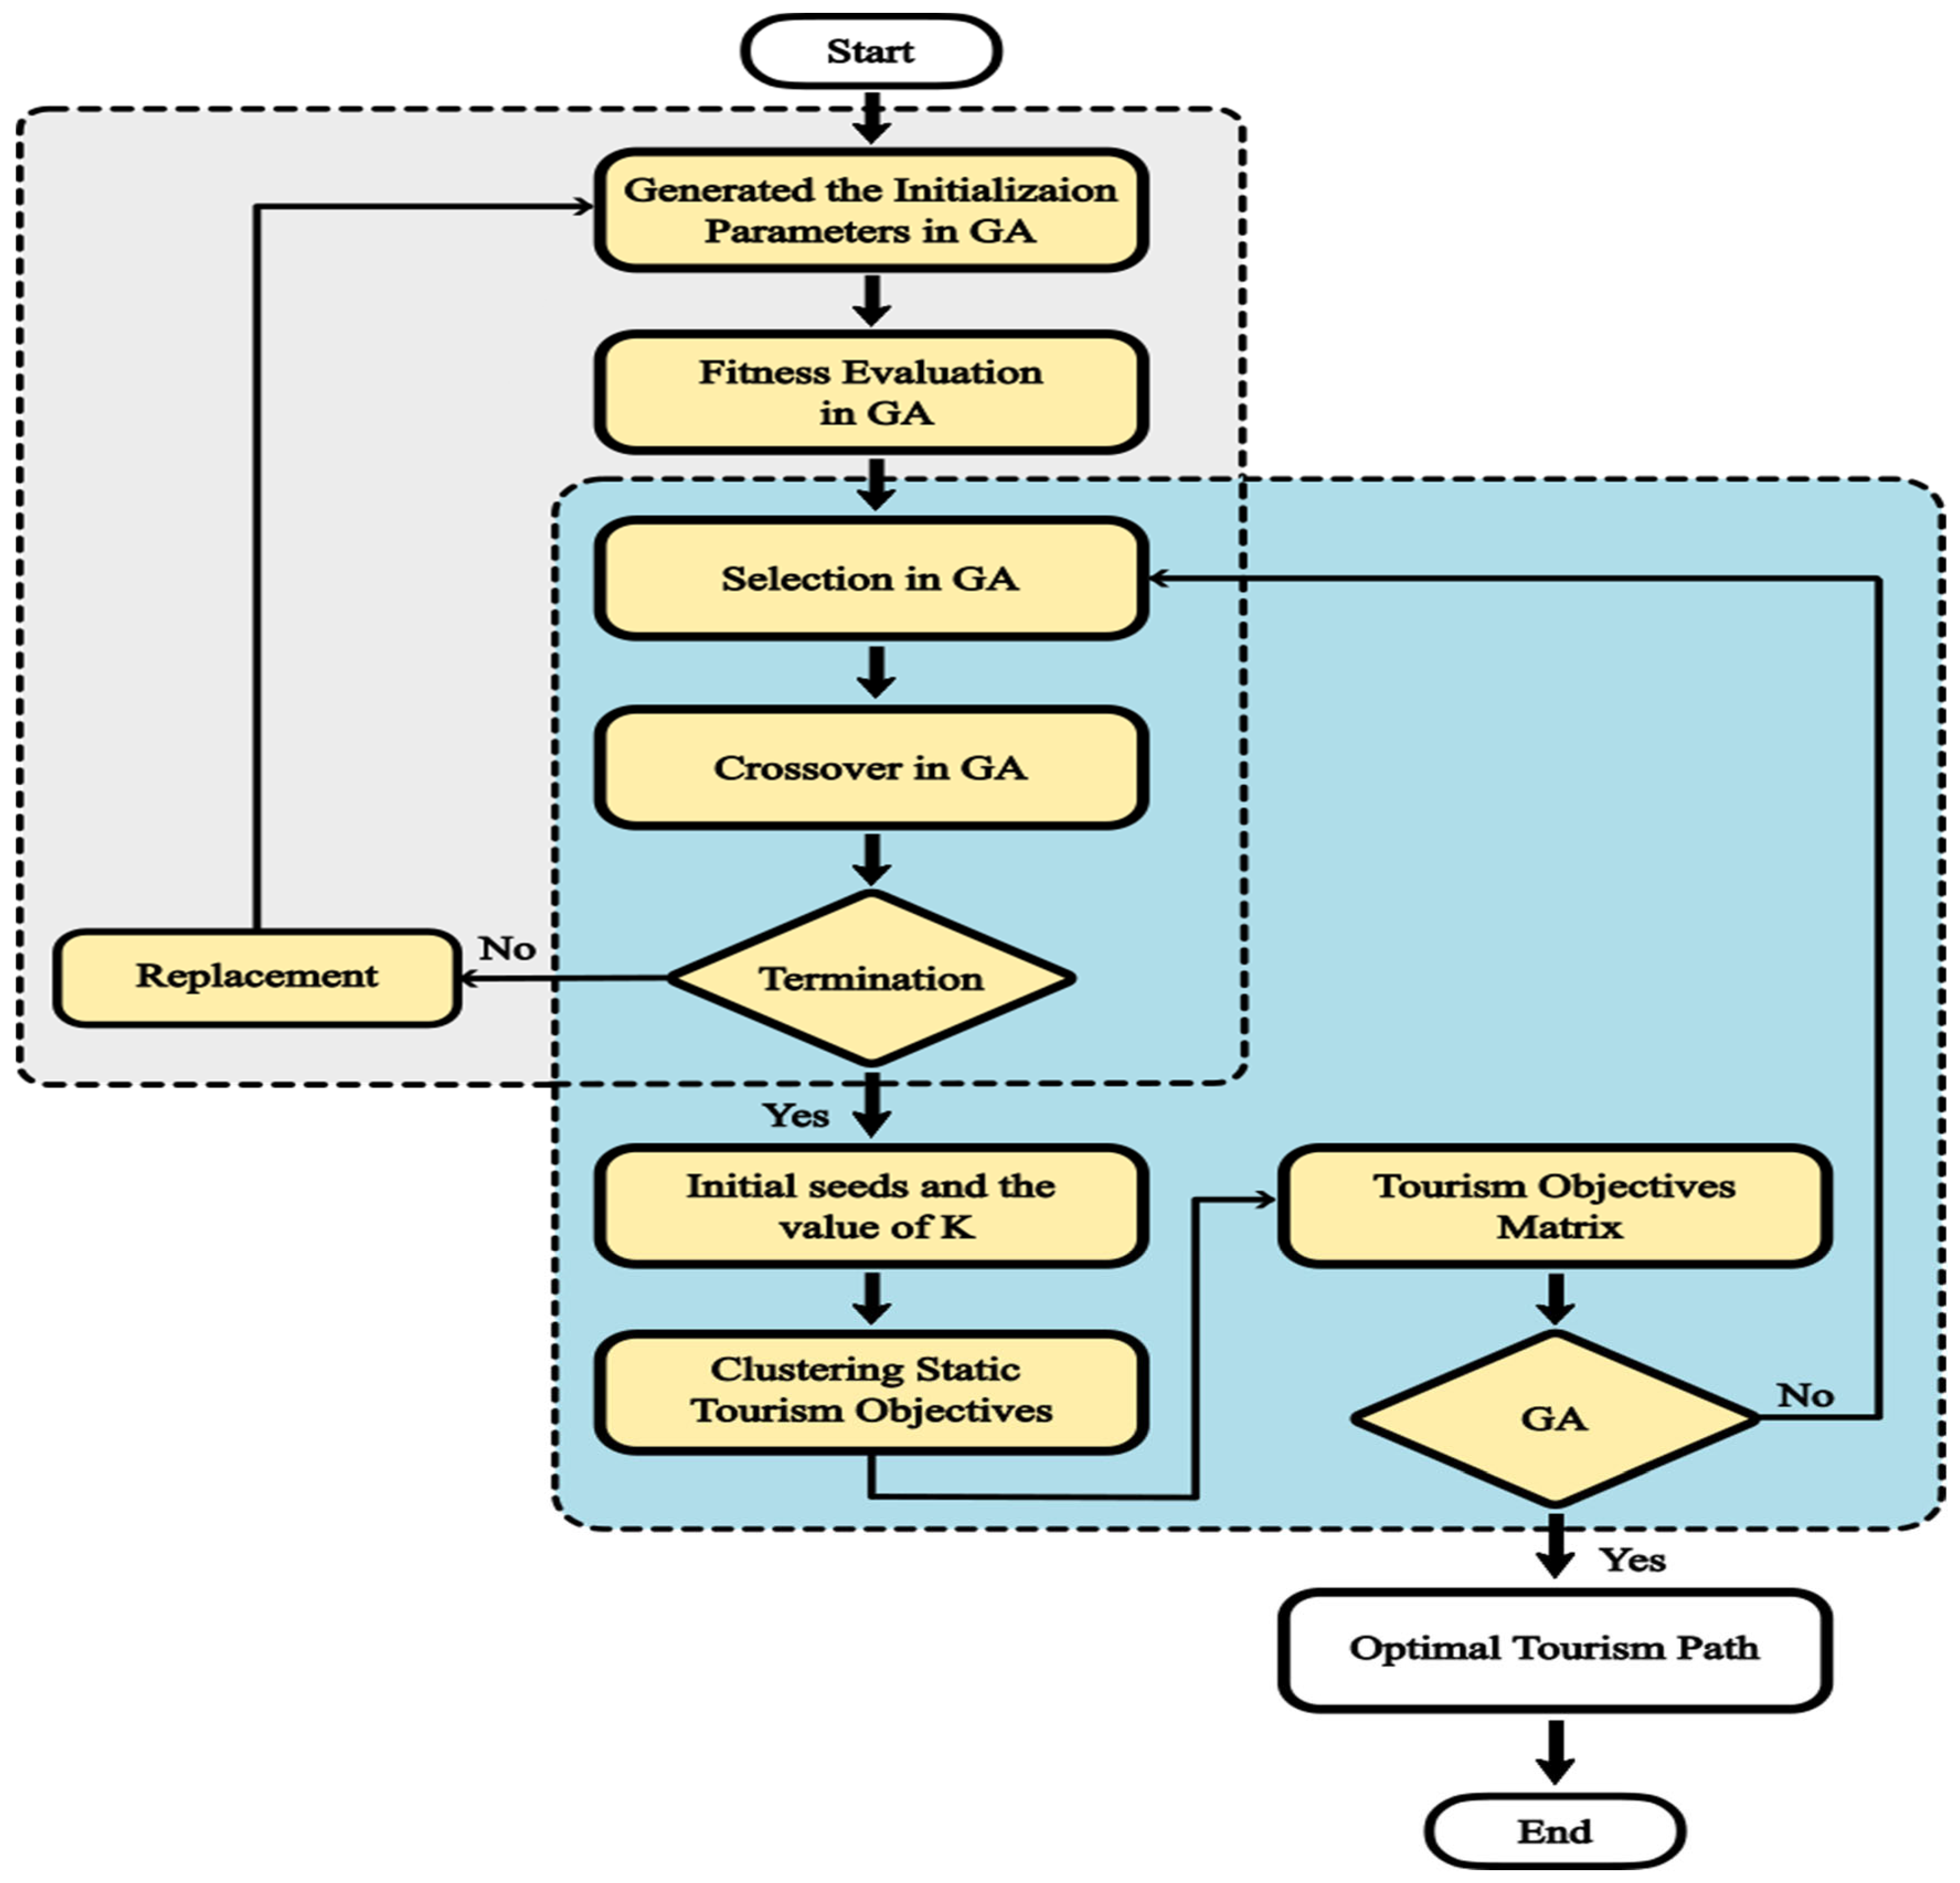
2.5. Enhancing the K-Means Algorithm though GA
| Algorithm 1: Pseudo code of enhancing k-means by GA |
| Begin Initialization Generate a solution population, representing possible data clusterings, cluster centers in k-means. Fitness Evaluation Assess solution fitness based on clustering quality, often measured by sum of squared errors (SSE) Selection Choose parent solutions for the next generation, with higher fitness solutions having a better chance. Crossover Create new solutions by combining features from two parents averaging cluster centers. Mutation Randomly alter some new solution features to maintain diversity and prevent premature convergence. Replacement Replace some current solutions with the new ones. Termination If a stopping criterion is met, stop and return the best intial seeds and k value found. Otherwise. Repeat From step 2. Print: Else Print: Fail end if end |
3. System Implementation and Experimental Analysis
4. Results and Discussion
4.1. Results
4.2. Discussion
5. Conclusions and Future Work
- ❖
- Optimize and classify 12 tourism objectives based on social media platforms to determine the path of tourists.
- ❖
- Apply the GA to determine the number of clusters, initial seeds, and the optimal path planning.
- ❖
- Optimize and visualize the tourism path planning approach based on the social media tourism objectives.
Author Contributions
Funding
Data Availability Statement
Conflicts of Interest
References
- Minazzi, R. Social Media Marketing in Tourism and Hospitality; Springer: Cham, Switzerland, 2015. [Google Scholar]
- Tenemaza, M.; Luján-Mora, S.; De Antonio, A.; Ramirez, J. Improving itinerary recommendations for tourists through metaheuristic algorithms: An optimization proposal. IEEE Access 2020, 8, 79003–79023. [Google Scholar] [CrossRef]
- Lee, J.Y.; Tsou, M.-H. Mapping spatiotemporal tourist behaviors and hotspots through location-based photo-sharing service (Flickr) data. In Progress in Location Based Services 2018; Springer: Cham, Switzerland, 2018; pp. 315–334. [Google Scholar]
- Wan, L.; Hong, Y.; Huang, Z.; Peng, X.; Li, R. A hybrid ensemble learning method for tourist route recommendations based on geo-tagged social networks. Int. J. Geogr. Inf. Sci. 2018, 32, 2225–2246. [Google Scholar] [CrossRef]
- Zhu, J.; Zhang, J.; Zhu, Q.; Li, W.; Wu, J.; Guo, Y. A knowledge-guided visualization framework of disaster scenes for helping the public cognize risk information. Int. J. Geogr. Inf. Sci. 2024, 38, 1–28. [Google Scholar] [CrossRef]
- Aftab, S.; Khan, M.M. Role of social media in promoting tourism in Pakistan. J. Soc. Sci. Humanit. 2019, 58, 101–113. [Google Scholar] [CrossRef]
- Jimenez-Barreto, J.; Sthapit, E.; Rubio, N.; Campo, S. Exploring the dimensions of online destination brand experience: Spanish and North American tourists’ perspectives. Tour. Manag. Perspect. 2019, 31, 348–360. [Google Scholar] [CrossRef]
- Ahsini, Y.; Díaz-Masa, P.; Inglés, B.; Rubio, A.; Martínez, A.; Magraner, A.; Conejero, J.A. The Electric Vehicle Traveling Salesman Problem on Digital Elevation Models for Traffic-Aware Urban Logistics. Algorithms 2023, 16, 402. [Google Scholar] [CrossRef]
- Silva, C.E.; César, T.S.; Gomes, I.P.; Silva, J.A.; Wolf, D.F.; Alves, R.; Souza, J.R. Scheduling System for Multiple Self-driving Cars Using K-Means and Bio-inspired Optimization Algorithms. SN Comput. Sci. 2023, 4, 647. [Google Scholar] [CrossRef]
- Gaur, L.; Afaq, A.; Solanki, A.; Singh, G.; Sharma, S.; Jhanjhi, N.; My, H.T.; Le, D.-N. Capitalizing on big data and revolutionary 5G technology: Extracting and visualizing ratings and reviews of global chain hotels. Comput. Electr. Eng. 2021, 95, 107374. [Google Scholar] [CrossRef]
- Hamid, R.A.; Albahri, A.S.; Alwan, J.K.; Al-Qaysi, Z.; Albahri, O.S.; Zaidan, A.; Alnoor, A.; Alamoodi, A.H.; Zaidan, B. How smart is e-tourism? A systematic review of smart tourism recommendation system applying data management. Comput. Sci. Rev. 2021, 39, 100337. [Google Scholar] [CrossRef]
- Li, W.; Zhu, J.; Zhu, Q.; Zhang, J.; Han, X.; Dehbi, Y. Visual attention-guided augmented representation of geographic scenes: A case of bridge stress visualization. Int. J. Geogr. Inf. Sci. 2024, 38. [Google Scholar] [CrossRef]
- Ahmed, M.; Seraj, R.; Islam, S.M.S. The k-means algorithm: A comprehensive survey and performance evaluation. Electronics 2020, 9, 1295. [Google Scholar] [CrossRef]
- Jahwar, A.F.; Abdulazeez, A.M. Meta-heuristic algorithms for K-means clustering: A review. PalArch’s J. Archaeol. Egypt/Egyptol. 2020, 17, 12002–12020. [Google Scholar]
- Huang, J. Design of Tourism Data Clustering Analysis Model Based on K-Means Clustering Algorithm. In International Conference on Multi-Modal Information Analytics; Springer: Cham, Switzerland, 2022; pp. 373–380. [Google Scholar]
- Yuan, C.; Yang, H. Research on K-value selection method of K-means clustering algorithm. J 2019, 2, 226–235. [Google Scholar] [CrossRef]
- Ikotun, A.M.; Ezugwu, A.E.; Abualigah, L.; Abuhaija, B.; Heming, J. K-means clustering algorithms: A comprehensive review, variants analysis, and advances in the era of big data. Inf. Sci. 2023, 622, 178–210. [Google Scholar] [CrossRef]
- Yang, Z.; Jiang, F.; Yu, X.; Du, J. Initial Seeds Selection for K-means Clustering Based on Outlier Detection. In Proceedings of the 2022 5th International Conference on Software Engineering and Information Management (ICSIM), Yokohama, Japan, 21–23 January 2022; pp. 138–143. [Google Scholar]
- Li, W.; Zhu, J.; Fu, L.; Zhu, Q.; Xie, Y.; Hu, Y. An augmented representation method of debris flow scenes to improve public perception. Int. J. Geogr. Inf. Sci. 2021, 35, 1521–1544. [Google Scholar] [CrossRef]
- Han, M. Research on optimization of K-means Algorithm Based on Spark. In Proceedings of the 2023 IEEE 6th Information Technology, Networking, Electronic and Automation Control Conference (ITNEC), Chongqing, China, 24–26 February 2023; pp. 1829–1836. [Google Scholar]
- Bahmani, B.; Moseley, B.; Vattani, A.; Kumar, R.; Vassilvitskii, S. Scalable k-means++. arXiv 2012, arXiv:1203.6402. [Google Scholar] [CrossRef]
- Chaudhary, M.; Pruthi, J.; Jain, V.K.; Suryakant. A novel squirrel search clustering algorithm for text document clustering. Int. J. Inf. Technol. 2022, 14, 3277–3286. [Google Scholar] [CrossRef]
- Al Shaqsi, J.; Wang, W. Robust Clustering Ensemble Algorithm. SSRN Electron. J. 2022. [Google Scholar] [CrossRef]
- Alzyadat, T.; Yamin, M.; Chetty, G. Genetic algorithms for the travelling salesman problem: A crossover comparison. Int. J. Inf. Technol. 2020, 12, 209–213. [Google Scholar] [CrossRef]
- Al-Kaseem, B.R.; Taha, Z.K.; Abdulmajeed, S.W.; Al-Raweshidy, H.S. Optimized energy–efficient path planning strategy in WSN with multiple Mobile sinks. IEEE Access 2021, 9, 82833–82847. [Google Scholar] [CrossRef]
- Chen, J.; Zhang, Y.; Wu, L.; You, T.; Ning, X. An adaptive clustering-based algorithm for automatic path planning of heterogeneous UAVs. IEEE Trans. Intell. Transp. Syst. 2021, 23, 16842–16853. [Google Scholar] [CrossRef]
- Ahmed, A.; Ju, H.; Yang, Y.; Xu, H. An Improved Unit Quaternion for Attitude Alignment and Inverse Kinematic Solution of the Robot Arm Wrist. Machines 2023, 11, 669. [Google Scholar] [CrossRef]
- Hu, F.; Li, Z.; Yang, C.; Jiang, Y. A graph-based approach to detecting tourist movement patterns using social media data. Cartogr. Geogr. Inf. Sci. 2019, 46, 368–382. [Google Scholar] [CrossRef]
- Riaz, M.; Sherani. Investigation of information sharing via multiple social media platforms: A comparison of Facebook and WeChat adoption. Qual. Quant. 2021, 55, 1751–1773. [Google Scholar] [CrossRef]
- Hashimy, S.Q.; Halim, T.S. The Impact of Social Media on Afghanistan’s Tourism Industry: A Roadmap for the Future in the Internet Highway. Law Soc. Policy Rev. 2023, 1, 17–50. [Google Scholar]
- Sakas, D.P.; Reklitis, D.P.; Terzi, M.C.; Vassilakis, C. Multichannel digital marketing optimizations through Big Data Analytics in the tourism and Hospitality Industry. J. Theor. Appl. Electron. Commer. Res. 2022, 17, 1383–1408. [Google Scholar] [CrossRef]
- Kim, J.; Kang, Y. Automatic classification of photos by tourist attractions using deep learning model and image feature vector clustering. ISPRS Int. J. Geo-Inf. 2022, 11, 245. [Google Scholar] [CrossRef]
- Chen, Y.; Zheng, X.; Fang, Z.; Yu, Y.; Kuang, Z.; Huang, Y. Research on optimization of tourism route based on genetic algorithm. J. Phys. Conf. Ser. 2020, 1575, 012027. [Google Scholar] [CrossRef]
- Kamsing, P.; Torteeka, P.; Yooyen, S.; Yenpiem, S.; Delahaye, D.; Notry, P.; Phisannupawong, T.; Channumsin, S. Aircraft trajectory recognition via statistical analysis clustering for Suvarnabhumi International Airport. In Proceedings of the 2020 22nd International Conference on Advanced Communication Technology (ICACT), Pyeongchang, Republic of Korea, 16–19 February 2020; pp. 290–297. [Google Scholar]
- Dadashpour Moghaddam, M.; Ahmadzadeh, H.; Valizadeh, R. A GIS-based assessment of urban tourism potential with a branding approach utilizing hybrid modeling. Spat. Inf. Res. 2022, 30, 399–416. [Google Scholar] [CrossRef]
- Zhou, X.; Xu, C.; Kimmons, B. Detecting tourism destinations using scalable geospatial analysis based on cloud computing platform. Comput. Environ. Urban Syst. 2015, 54, 144–153. [Google Scholar] [CrossRef]
- Wang, H.; Yan, J. Effects of social media tourism information quality on destination travel intention: Mediation effect of self-congruity and trust. Front. Psychol. 2022, 13, 1049149. [Google Scholar] [CrossRef]
- Sarkar, S.K.; George, B. Social media technologies in the tourism industry: An analysis with special reference to their role in sustainable tourism development. Int. J. Tour. Sci. 2018, 18, 269–278. [Google Scholar] [CrossRef]
- Tahir, M.; Tubaishat, A.; Al-Obeidat, F.; Shah, B.; Halim, Z.; Waqas, M. A novel binary chaotic genetic algorithm for feature selection and its utility in affective computing and healthcare. Neural Comput. Appl. 2020, 34, 1–22. [Google Scholar] [CrossRef]
- Damos, M.A.; Zhu, J.; Li, W.; Hassan, A.; Khalifa, E. A novel urban tourism path planning approach based on a multiobjective genetic algorithm. ISPRS Int. J. Geo-Inf. 2021, 10, 530. [Google Scholar] [CrossRef]
- Pizzuti, C.; Procopio, N. A k-means based genetic algorithm for data clustering. In Proceedings of the International Joint Conference SOCO’16-CISIS’16-ICEUTE’16, San Sebastián, Spain, 19–21 October 2016; Proceedings 11. pp. 211–222. [Google Scholar]
- Tabianan, K.; Velu, S.; Ravi, V. K-means clustering approach for intelligent customer segmentation using customer purchase behavior data. Sustainability 2022, 14, 7243. [Google Scholar] [CrossRef]
- Ghezelbash, R.; Maghsoudi, A.; Shamekhi, M.; Pradhan, B.; Daviran, M. Genetic algorithm to optimize the SVM and K-means algorithms for mapping of mineral prospectivity. Neural Comput. Appl. 2023, 35, 719–733. [Google Scholar] [CrossRef]
- Zubair, M.; Iqbal, M.A.; Shil, A.; Chowdhury, M.; Moni, M.A.; Sarker, I.H. An improved K-means clustering algorithm towards an efficient data-driven modeling. Ann. Data Sci. 2022, 9, 1–20. [Google Scholar] [CrossRef]
- Daviran, M.; Ghezelbash, R.; Niknezhad, M.; Maghsoudi, A.; Ghaeminejad, H. Hybridizing K-means clustering algorithm with harmony search and artificial bee colony optimizers for intelligence mineral prospectivity mapping. Earth Sci. Inform. 2023, 16, 2143–2165. [Google Scholar] [CrossRef]
- Sajidha, S.; Desikan, K.; Chodnekar, S.P. Initial seed selection for mixed data using modified k-means clustering algorithm. Arab. J. Sci. Eng. 2020, 45, 2685–2703. [Google Scholar] [CrossRef]


| Selected Objective | Explanation and References | Evaluation Scale | Rating |
|---|---|---|---|
| Entertainment value (EN) | The value of entertainment refers to the entertainment available in the tourist site, which is available to the visitor. | Very high | 10 |
| High | 7 | ||
| Medium | 4 | ||
| Low | 1 | ||
| Aesthetic and art (AA) | Aesthetics and arts include the aesthetic and artistic sensitivity. The practical, cultural, and philosophical qualities of the site. | Very high | 10 |
| High | 7 | ||
| Medium | 4 | ||
| Low | 1 | ||
| Cultural–historical value (CH) | The historical and cultural value is considered to be one of the most important factors that affects why tourists flock to tourist sites. | Very high | 10 |
| High | 7 | ||
| Medium | 4 | ||
| Low | 1 | ||
| Scientific value (SI) | The scientific value of the tourist site indicates the scientific importance of the site, such as universities and others. | Very high | 10 |
| High | 7 | ||
| Medium | 4 | ||
| Low | 1 | ||
| Size of tourism destination (TD) | The size of the tourist destination, the height of the place, and the ability of the tourist destination to accommodate tourists. | >50 km2 | 10 |
| >10–50 km2 | 7 | ||
| 1–10 km2 | 4 | ||
| <1 km2 | 1 | ||
| Tourism seasonality (TS) | Tourism seasonality is the possibility of visiting a tourist site in a specific season of year, some sites that can be visited year-round, such as museums, some site have seasonality such as gardens. | >300 days/year | 10 |
| >200–300 days/year | 7 | ||
| 100–200 days/year | 4 | ||
| <100 days/year | 1 | ||
| Quality of service (QS) | Quality of service includes all services provided within tourist sites such as restaurants, cafes, shops, and others. | Very high | 10 |
| High | 7 | ||
| Medium | 4 | ||
| Low | 1 | ||
| Time in site (TI) | This includes the time spent by the visitor inside the site, taking into account the opening and closing times of the gates. | >3 | 10 |
| >2–3 | 7 | ||
| >1–2 | 4 | ||
| 0–1 | 1 | ||
| Biodiversity (BI) | The value of biological diversity is evaluated according to the different types of endemic animals. | Very high | 10 |
| High | 7 | ||
| Medium | 4 | ||
| Low | 1 |
| Visitor NO | EN | AA | CH | SI | TD | TS | QS | TI | BI |
|---|---|---|---|---|---|---|---|---|---|
| 1 | low | Medium | Medium | V.high | 3 | 3 | Medium | 7 | low |
| 2 | Medium | low | High | V.high | 4 | 4 | V.high | 5 | High |
| 3 | Medium | High | V.high | High | 7 | 5 | V.high | 3 | V.high |
| 4 | High | V.high | Medium | V.high | 5 | 5 | Medium | 10 | Medium |
| 5 | Medium | low | V.high | High | 3 | 7 | V.high | 7 | low |
| 6 | High | Medium | low | Medium | 10 | 5 | High | 5 | High |
| 7 | low | low | High | Medium | 7 | 3 | Medium | 7 | Medium |
| 8 | low | High | Medium | V.high | 3 | 7 | V.high | 5 | Medium |
| 9 | High | low | High | V.high | 10 | 4 | V.high | 3 | V.high |
| 10 | low | V.high | low | Medium | 5 | 7 | High | 7 | Medium |
| 11 | V.high | Medium | low | V.high | 5 | 10 | Medium | 10 | V.high |
| 12 | low | Medium | High | V.high | 3 | 4 | Medium | 3 | V.high |
| 13 | V.high | Medium | V.high | High | 7 | 5 | V.high | 5 | High |
| 14 | High | V.high | Medium | V.high | 5 | 5 | low | 3 | Medium |
| 15 | High | V.high | Medium | V.high | 10 | 5 | High | 5 | High |
| 16 | low | Medium | Medium | low | 10 | 5 | V.high | 7 | low |
| 17 | High | V.high | Medium | V.high | 5 | 5 | V.high | 5 | High |
| 18 | Medium | High | V.high | High | 7 | 5 | V.high | 3 | V.high |
| 19 | High | V.high | Medium | V.high | 3 | 7 | V.high | 7 | low |
| 20 | low | low | High | Medium | 7 | 3 | Medium | 7 | Medium |
| 21 | High | Medium | low | Medium | 3 | 7 | V.high | 5 | Medium |
| 22 | low | low | High | Medium | 10 | 4 | V.high | 3 | V.high |
| 23 | High | Medium | low | Medium | 7 | 3 | Medium | 7 | Medium |
| 24 | low | low | High | Medium | 3 | 7 | V.high | 5 | Medium |
| 25 | High | V.high | Medium | V.high | 5 | 5 | Medium | 10 | Medium |
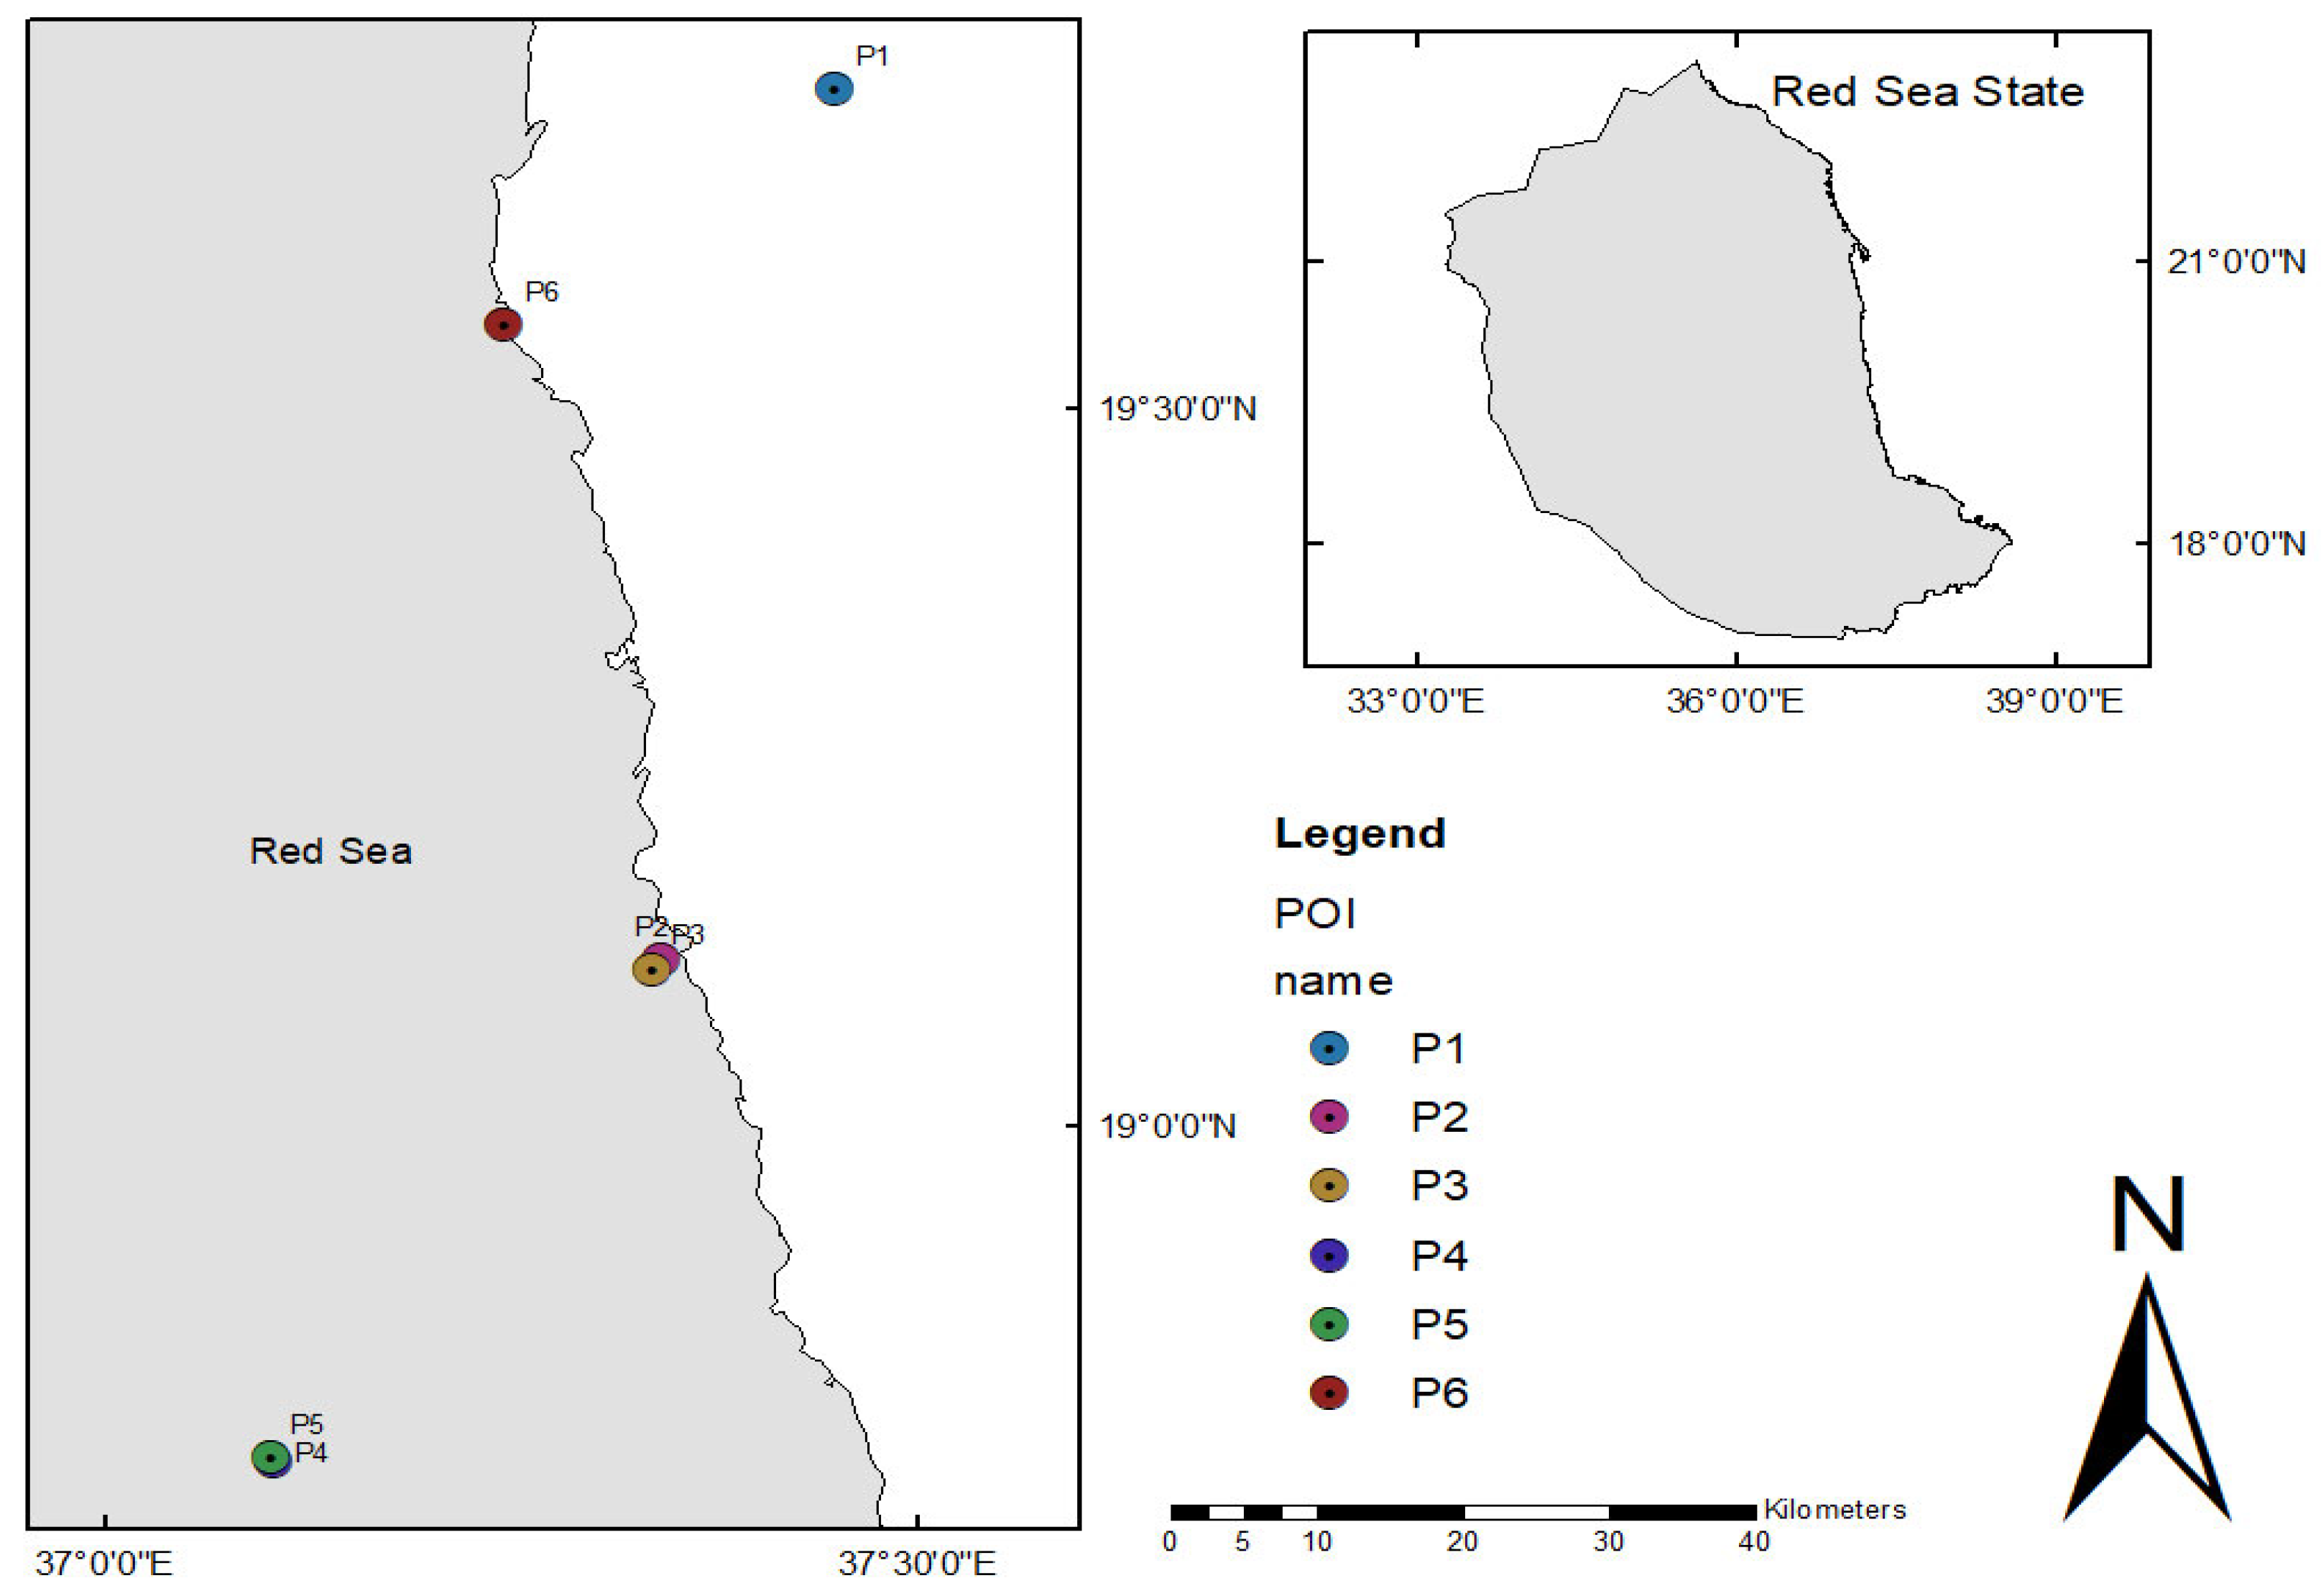
| POI | E | N | Name |
| P1 | 37.45045 | 19.72309 | Sanganeb Reserve |
| P2 | 37.34297 | 19.11629 | Othman Digna port |
| P3 | 37.33744 | 19.11293 | Suakin city |
| P4 | 37.10517 | 18.76735 | Arquette Resort |
| P5 | 37.10307 | 18.77391 | Lake Arquette |
| P6 | 37.24676 | 19.55832 | Red Sea Resort |
| POI | P1 | P2 | P3 | P4 | P5 | P6 |
| P1 | 0 | 2 | 4 | 1 | 3 | 3 |
| P2 | 2 | 0 | 2 | 4 | 2 | 3 |
| P3 | 4 | 3 | 0 | 1 | 2 | 3 |
| P4 | 1 | 4 | 1 | 0 | 3 | 1 |
| P5 | 3 | 2 | 2 | 3 | 0 | 4 |
| P6 | 3 | 3 | 3 | 1 | 4 | 0 |
| POI | P1 | P2 | P3 | P4 | P5 | P6 |
| P1 | 0 | 67.5 | 68.9 | 112.5 | 111.9 | 29.9 |
| P2 | 67.5 | 0 | 0.45 | 45.4 | 44.2 | 50.3 |
| P3 | 68.9 | 0.45 | 0 | 44.11 | 44.4 | 49.9 |
| P4 | 112.5 | 45.4 | 44.11 | 0 | 1.21 | 89.9 |
| P5 | 111.9 | 44.2 | 44.4 | 1.21 | 0 | 88.8 |
| P6 | 29.9 | 50.3 | 49.9 | 89.9 | 88.8 | 0 |
| POI | P1 | P2 | P3 | P4 | P5 | P6 |
| P1 | 0 | 500 | 400 | 300 | 450 | 300 |
| P2 | 500 | 0 | 250 | 350 | 300 | 700 |
| P3 | 400 | 250 | 0 | 250 | 200 | 150 |
| P4 | 300 | 350 | 250 | 0 | 150 | 400 |
| P5 | 450 | 300 | 200 | 150 | 0 | 300 |
| P6 | 300 | 700 | 150 | 400 | 300 | 0 |
| Parameters | Values |
|---|---|
| Population size | 100 |
| Crossover probability | 0.85 |
| Mutation probability | 0.10 |
| Number of generations | 4000 |
| NO | The Objectives | The Path |
|---|---|---|
| 1 | EN | P1-P5-P6-P3-P2-P4-P1 |
| 2 | AA | P4-P2-P1-P4-P6-P5-P4 |
| 3 | CH | P5-P2-P4-P6-P3-P1-P5 |
| 4 | SI | P3-P4-P6-P1-P2-P5-P3 |
| 5 | TD | P2-P4-P6-P3-P1-P5-P2 |
| 6 | TS | P4-P6-P4-P1-P2-P3-P4 |
| 7 | QS | P6-P1-P5-P2-P3-P4-P6 |
| 8 | TI | P6-P3-P2-P4-P5-P1-P6 |
| 9 | BI | P5-P3-P4-P1-P2-P6-P5 |
| 10 | Tourist preferences | P1-P5-P6-P3-P2-P4-P1 |
| 11 | Travel costs | P6-P5-P2-P1-P3-P4-P5 |
| 12 | Total distances | P2-P3-P4-P5-P6-P1-P2 |
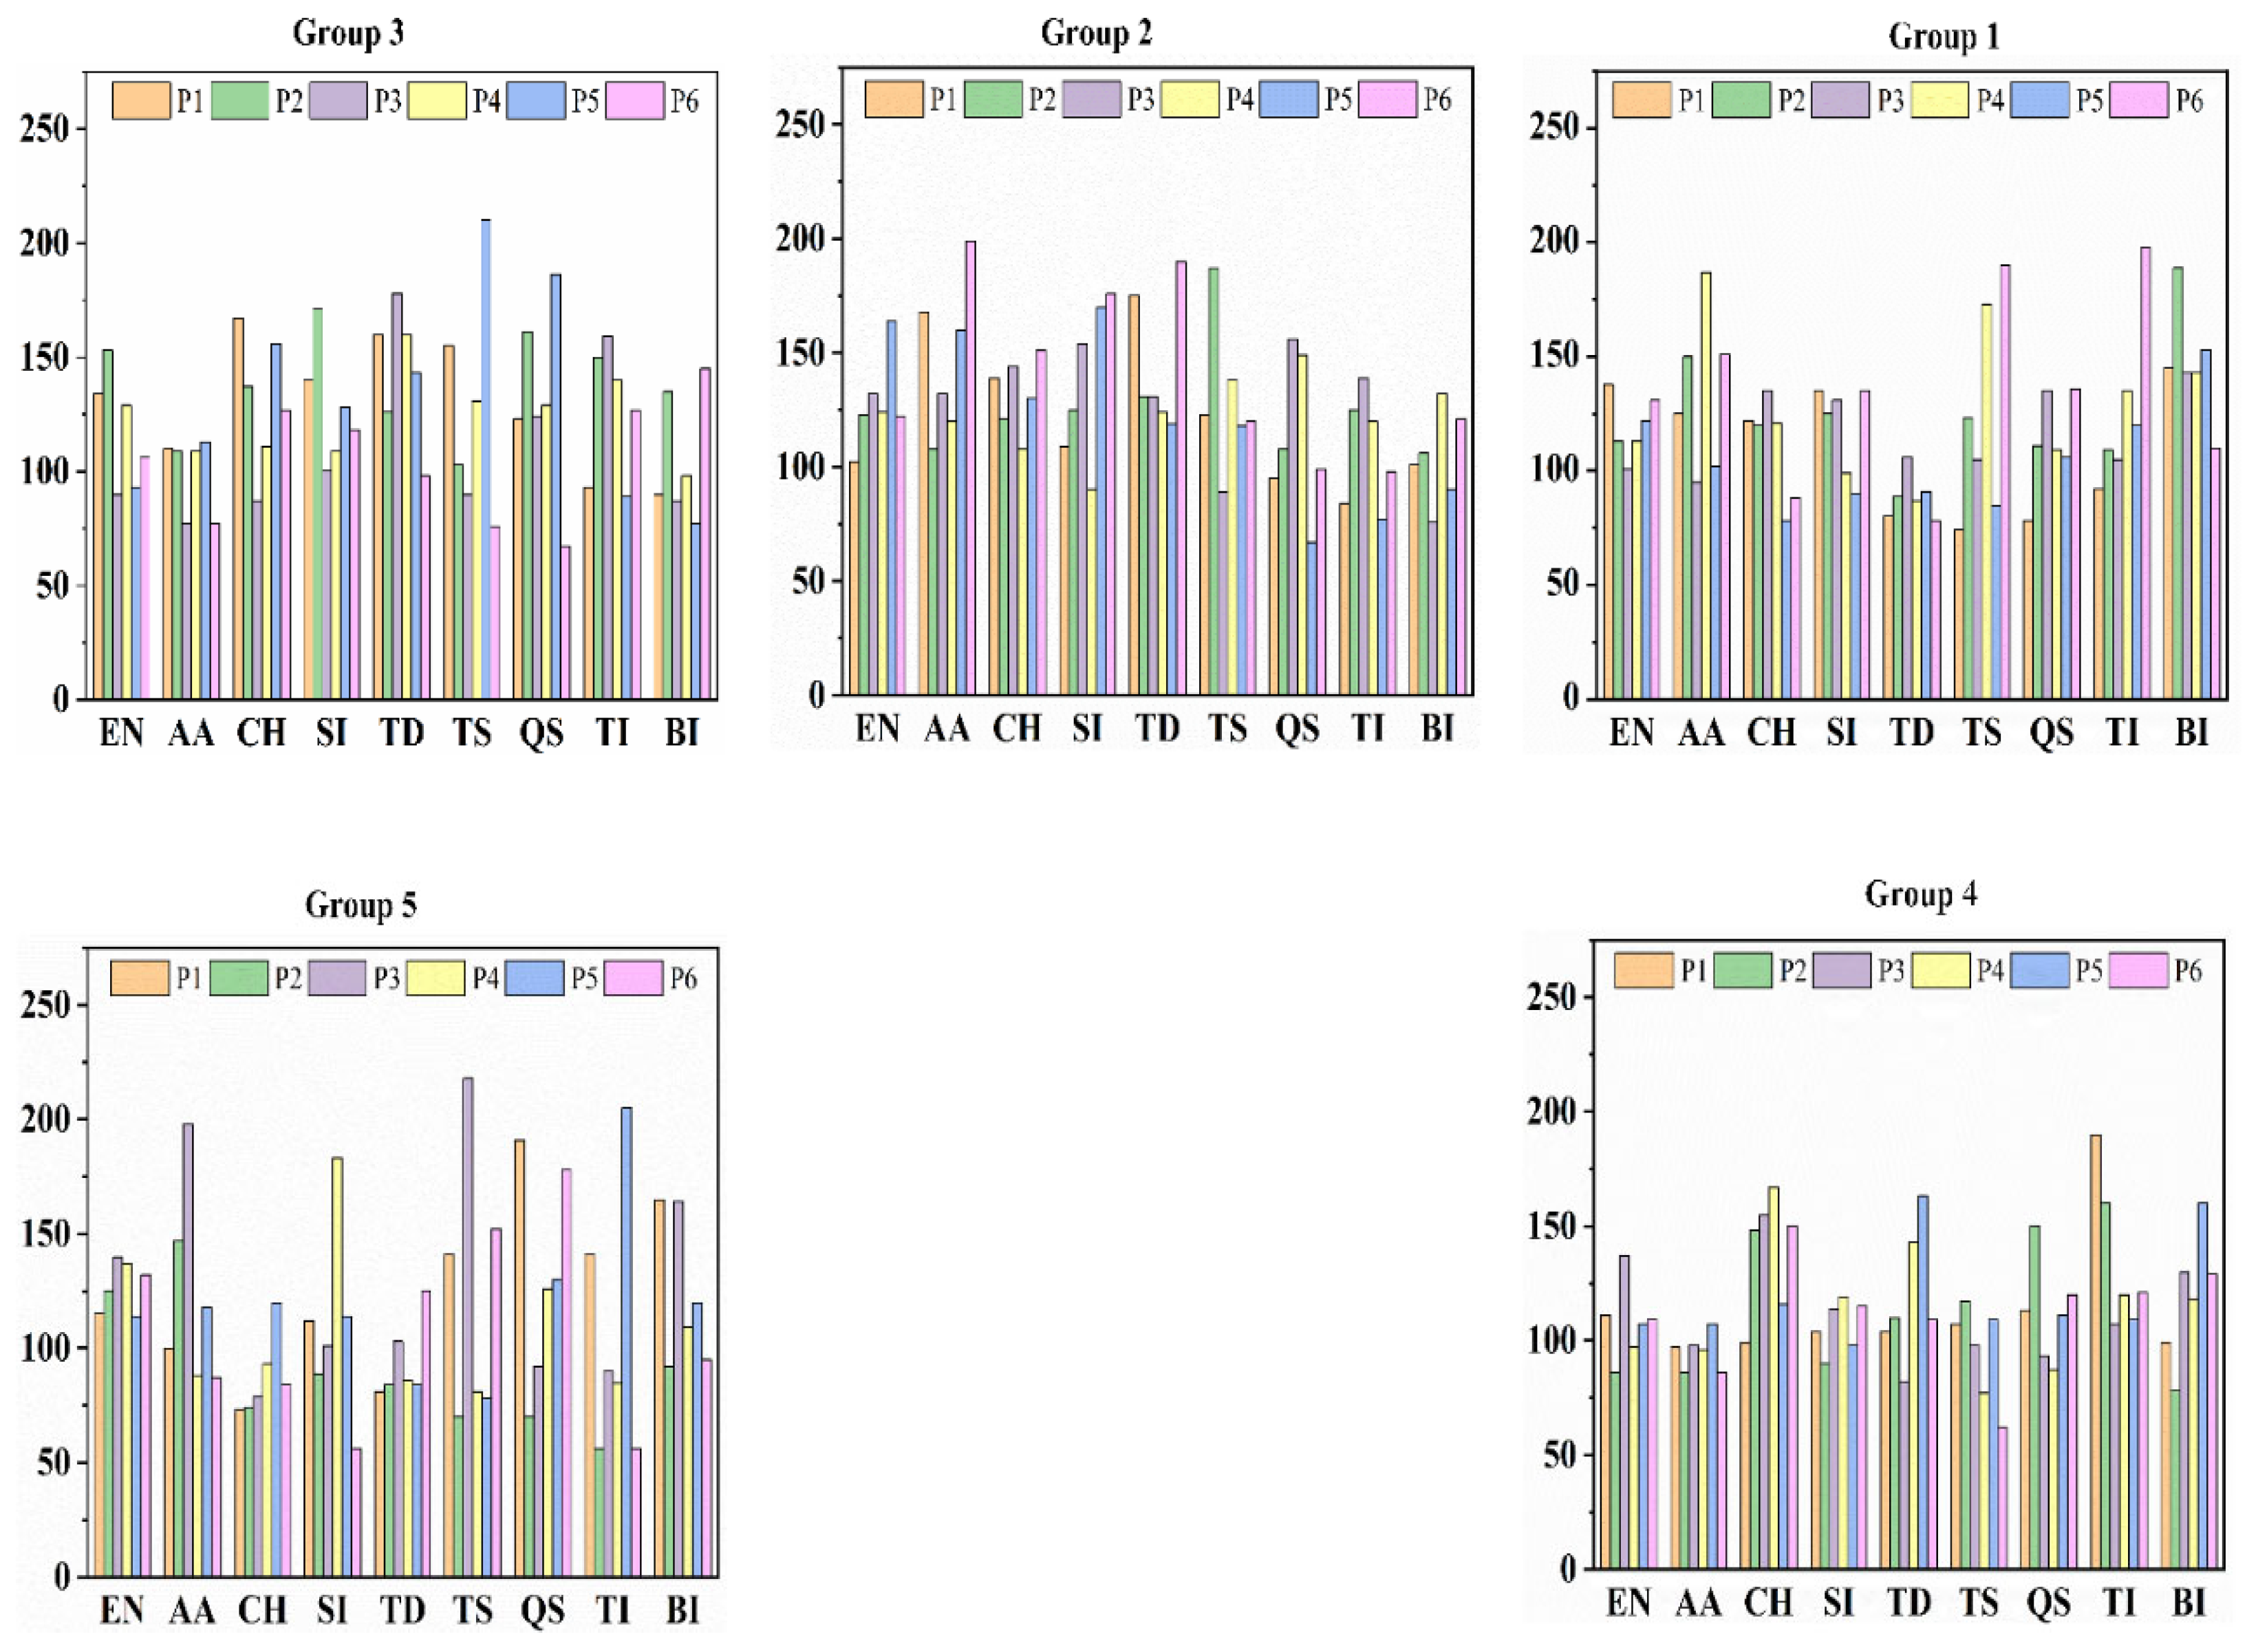
| Group 1 | ||||||
|---|---|---|---|---|---|---|
| POI/Objective | P1 | P2 | P3 | P4 | P5 | P6 |
| EN | 138 | 113 | 101 | 113 | 122 | 131 |
| AA | 125 | 150 | 95 | 187 | 102 | 151 |
| CH | 122 | 120 | 135 | 121 | 78 | 88 |
| SI | 135 | 125 | 131 | 99 | 90 | 135 |
| TD | 80 | 89 | 106 | 87 | 91 | 78 |
| TS | 74 | 123 | 105 | 173 | 85 | 190 |
| QS | 78 | 111 | 135 | 109 | 106 | 136 |
| TI | 92 | 109 | 105 | 135 | 120 | 198 |
| BI | 145 | 189 | 143 | 143 | 153 | 110 |
| Group 2 | ||||||
| POI/Objective | P1 | P2 | P3 | P4 | P5 | P6 |
| EN | 102 | 123 | 132 | 124 | 164 | 122 |
| AA | 168 | 108 | 132 | 120 | 160 | 199 |
| CH | 139 | 121 | 144 | 108 | 130 | 151 |
| SI | 109 | 125 | 154 | 90 | 170 | 176 |
| TD | 175 | 131 | 131 | 124 | 119 | 190 |
| TS | 123 | 187 | 89 | 138 | 118 | 120 |
| QS | 95 | 108 | 156 | 149 | 67 | 99 |
| TI | 84 | 125 | 139 | 120 | 77 | 98 |
| BI | 101 | 106 | 76 | 132 | 90 | 121 |
| Group 3 | ||||||
| POI/Objective | P1 | P2 | P3 | P4 | P5 | P6 |
| EN | 134 | 153 | 90 | 129 | 93 | 106 |
| AA | 110 | 109 | 77 | 109 | 113 | 77 |
| CH | 167 | 137 | 87 | 111 | 156 | 127 |
| SI | 140 | 171 | 100 | 109 | 128 | 118 |
| TD | 160 | 126 | 178 | 160 | 143 | 98 |
| TS | 155 | 103 | 90 | 131 | 210 | 76 |
| QS | 123 | 161 | 124 | 129 | 186 | 67 |
| TI | 93 | 150 | 159 | 140 | 89 | 127 |
| BI | 90 | 135 | 87 | 98 | 77 | 145 |
| Group 4 | ||||||
| POI/Objective | P1 | P2 | P3 | P4 | P5 | P6 |
| EN | 111 | 86 | 137 | 97 | 107 | 109 |
| AA | 97 | 86 | 98 | 96 | 107 | 86 |
| CH | 99 | 148 | 155 | 167 | 116 | 150 |
| SI | 104 | 90 | 114 | 119 | 98 | 115 |
| TD | 104 | 110 | 82 | 143 | 163 | 109 |
| TS | 107 | 117 | 98 | 77 | 109 | 62 |
| QS | 113 | 150 | 93 | 87 | 111 | 120 |
| TI | 190 | 160 | 107 | 120 | 109 | 121 |
| BI | 99 | 78 | 130 | 118 | 160 | 129 |
| Group 5 | ||||||
| POI/Objective | P1 | P2 | P3 | P4 | P5 | P6 |
| EN | 115 | 125 | 140 | 137 | 114 | 132 |
| AA | 100 | 147 | 198 | 88 | 118 | 87 |
| CH | 73 | 74 | 79 | 93 | 120 | 84 |
| SI | 112 | 89 | 101 | 183 | 114 | 56 |
| TD | 81 | 84 | 103 | 86 | 84 | 125 |
| TS | 141 | 70 | 218 | 81 | 78 | 152 |
| QS | 191 | 70 | 92 | 126 | 130 | 178 |
| TI | 141 | 56 | 90 | 85 | 205 | 56 |
| BI | 165 | 92 | 164 | 109 | 120 | 95 |
| POI | P1 | P2 | P3 | P4 | P5 | P6 |
| P1 | 0 | 25 | 37 | 25 | 16 | 7 |
| P2 | 25 | 0 | 55 | 37 | 48 | 1 |
| P3 | 37 | 55 | 0 | 14 | 57 | 47 |
| P4 | 25 | 37 | 14 | 0 | 9 | 36 |
| P5 | 16 | 48 | 57 | 9 | 0 | 13 |
| P6 | 7 | 1 | 47 | 36 | 13 | 0 |
| Algorithm | Time Optimizations (s) | Number of Alterations | Number of Clusters |
|---|---|---|---|
| Enhancing k-means algorithm | 0.01 | 5 | 5 |
| Traditional k-means algorithm | 0.2 | 8 | 5 |
| EM algorithm | 0.27 | 22 | 5 |
| Hierarchical cluster algorithm | 0.70 | 9 | 5 |
Disclaimer/Publisher’s Note: The statements, opinions and data contained in all publications are solely those of the individual author(s) and contributor(s) and not of MDPI and/or the editor(s). MDPI and/or the editor(s) disclaim responsibility for any injury to people or property resulting from any ideas, methods, instructions or products referred to in the content. |
© 2024 by the authors. Licensee MDPI, Basel, Switzerland. This article is an open access article distributed under the terms and conditions of the Creative Commons Attribution (CC BY) license (https://creativecommons.org/licenses/by/4.0/).
Share and Cite
Damos, M.A.; Zhu, J.; Li, W.; Khalifa, E.; Hassan, A.; Elhabob, R.; Hm, A.; Ei, E. Enhancing the K-Means Algorithm through a Genetic Algorithm Based on Survey and Social Media Tourism Objectives for Tourism Path Recommendations. ISPRS Int. J. Geo-Inf. 2024, 13, 40. https://doi.org/10.3390/ijgi13020040
Damos MA, Zhu J, Li W, Khalifa E, Hassan A, Elhabob R, Hm A, Ei E. Enhancing the K-Means Algorithm through a Genetic Algorithm Based on Survey and Social Media Tourism Objectives for Tourism Path Recommendations. ISPRS International Journal of Geo-Information. 2024; 13(2):40. https://doi.org/10.3390/ijgi13020040
Chicago/Turabian StyleDamos, Mohamed A., Jun Zhu, Weilian Li, Elhadi Khalifa, Abubakr Hassan, Rashad Elhabob, Alaa Hm, and Esra Ei. 2024. "Enhancing the K-Means Algorithm through a Genetic Algorithm Based on Survey and Social Media Tourism Objectives for Tourism Path Recommendations" ISPRS International Journal of Geo-Information 13, no. 2: 40. https://doi.org/10.3390/ijgi13020040
APA StyleDamos, M. A., Zhu, J., Li, W., Khalifa, E., Hassan, A., Elhabob, R., Hm, A., & Ei, E. (2024). Enhancing the K-Means Algorithm through a Genetic Algorithm Based on Survey and Social Media Tourism Objectives for Tourism Path Recommendations. ISPRS International Journal of Geo-Information, 13(2), 40. https://doi.org/10.3390/ijgi13020040