Abstract
The Galactic X-ray transient EXO 1846-031 was first discovered during an outburst in 1985 by the EXOSAT mission. The source remained in a quiescent state for nearly 34 years after the first outburst. The source started its second outburst on 23 July 2019. We studied the accretion flow properties using the Two Component Advective Flow (TCAF) paradigm of this 2019 outburst. During the outburst, the source went through all the four spectral states, though, due to data constraints, it was not possible to define the date of the state transitions during the declining intermediate states. During this outburst, the black hole candidate (BHC) exhibited significant jet activity. In the TCAF solution, the model normalization is expected to remain constant for a given source. Therefore, any need for a significantly different normalization to achieve a better spectral fit suggests the presence of additional X-ray contributions from components not accounted for in the current TCAF model fit’s file. By comparing with the expected normalization, we estimate the X-ray contribution originating from jets and outflows. We further analyze the origin of the jet. Our analysis shows that, on some days, up to of the total X-ray flux originates from the base of the jet itself.
Keywords:
X-rays; binaries; EXO 1846-031; black holes; accretion; accretion discs; jets and outflows 1. Introduction
Black holes (BHs) are the final evolutionary products of stars. Stellar-mass black hole candidates are mainly found in binary systems. A black hole binary system consists of a compact object, i.e., the BH and a companion star. Due to immense gravitational pull, matter accretes from the companion towards the BH via Roche–Lobe overflow and wind accretion. The accreting matter forms a disk-like structure around the BH, commonly known as the accretion disk. Transient BHs exhibit outbursts of variable duration ranging from a few weeks to months. In between two outbursts, transient BHs remain in the quiescence phase, i.e., the phase of inactivity. In the quiescence phase, matter accumulates at the pile-up region [1,2]. When the viscosity of the disk rises above the critical value, matter rushes towards the black hole and triggers an outburst. During an outburst, electromagnetic radiation is emitted from the accretion disk surrounding the BH, spanning frequencies from radio to -rays. The observed spectrum from a BH generally comprises of two components, a soft multi-color disk blackbody and a hard power-law component. The soft component originates from an optically thick, geometrically thin Keplerian disk, commonly modeled by the Shakura–Sunyaev standard disk [3], whereas the hard component is thought to arise from a hot Comptonizing region or corona.
Over the years, several models have been proposed to interpret BH spectra. The two-component advective flow (TCAF) model was introduced by Chakrabarti and his collaborators in the mid-1990s [4,5]. The TCAF model is derived from viscous transonic flow solutions that incorporate radiative processes. The TCAF model includes two distinct accretion components; a high-viscosity Keplerian disk with high angular momentum and low radial velocity, and a low-viscosity sub-Keplerian halo with lower angular momentum but higher radial velocity. In this model, the corona is identified as the centrifugal pressure-supported boundary layer (CENBOL), which forms behind the centrifugal barrier due to the accumulation of the sub-Keplerian matter. Soft photons emitted from the Keplerian disk undergo multiple inverse-Compton scatterings with the hot electrons in the CENBOL, and produces hard photons, which contribute to the power-law component of the BH spectra.
During an outburst, BHs can be found in different spectral states (see Debnath et al., 2015, 2017 [6,7] and references therein). Typically, during a complete outburst, the BH goes through four spectral states: hard state (HS), hard intermediate state (HIMS), soft intermediate state (SIMS), and soft state (SS) [8,9,10]. In the rising phase, the source evolves from HS to SS via HIMS and SIMS and reverses this path in the declining phase. An outburst is known as a ‘failed’ outburst if one or more softer states are missing [7].
Jets and outflows are significant features of BHs [11,12]. Astrophysical jets expel ionized matter along the rotational axis, channeling mass, energy, and momentum from both stellar and supermassive BHs [13]. These jets are typically narrow and conical in shape. The most powerful jets are associated with active galactic nuclei (AGNs). Observationally, the jet morphologies in case of AGNs and stellar massive BHs are remarkably similar [14,15]. Initially, compact jets in BHCs were discovered through radio observations [16,17,18], though subsequent studies revealed that jets can emit radiation across a broad spectrum from radio to -rays [19,20]. Notable examples include compact radio jets in Cyg X-1 [21] and GRS1915+105 [22], and high-energy -ray jets observed in Cyg X-1 [19,23] and V404 Cyg [24].
Despite ongoing debates about their origin, numerous models have been proposed to explain the formation, acceleration, and collimation of jets. These include the de Laval nozzle model [25], Blandford-Znajek mechanism [26], the electrodynamic acceleration model [27], and the the centrifugally driven wind model [28]. In the TCAF paradigm, the CENBOL region is considered as the origin of the jets and outflows [12,29]. Jets can be categorized into compact (continuous) and discrete (blobby) types (Chakrabarti & Nandi 2000 [30] and references therein). In HS, when the CENBOL is large and hot [31], compact jets are typically observed. In intermediate states (HIMS or SIMS), blobby jets may form [32]. In SS, jet formation ceases as CENBOL is cooled and quenched [30,33].
The correlation between radio and X-ray emissions in compact jets was first observed in the low hard state (LHS) of the BHC GX339-4 [34]. This was further confirmed by detailed studies [35,36,37], which established a correlation of the form , where and are the radio and X-ray fluxes, respectively. The standard value of b is ∼0.7 in the low hard state [37].
The Galactic X-ray transient source EXO 1846-031 was first discovered by EXOSAT during an outburst in 1985 [38]. Based on the detection of an ultrasoft spectral component during this event, Parmar et al. (1993) [39] classified EXO 1846-031 as a BHC. Following this initial outburst, the source remained in a quiescent state for nearly 34 years. The source re-entered an active phase on 23 July 2019, as reported by MAXI [40]. Strong reflection features detected in the NuSTAR spectrum led Draghis et al. (2020) to suggest that EXO 1846-031 hosts a nearly maximally spinning black hole, with a dimensionless spin parameter and a disk inclination angle of [41]. An analysis of data from Insight-HXMT and NuSTAR by Wang et al. (2021) revealed the presence of an ionized disk wind with velocities reaching up to [42]. They proposed a lower inclination angle of for the system. Evidence for a pair of high-frequency QPOs in a 3:2 frequency ratio was identified, allowing for Strohmayer & the NICER Observatory Science Working Group (2020) to estimate the black hole mass to be [43]. Based on spectral fitting using the TCAF model, the estimated mass of the source is approximately , with a possible range between and [44]. Based on radio data from MeerKAT, VLA, and AMI-LA, Williams et al. (2022) constrained the source distance to the range of 2.4–7.5 kpc and estimated a jet speed of [45].
In Nath et al., 2024 (hereafter Paper I) [44], a comprehensive analysis was conducted on the spectral and temporal behavior of the source during its 2019 outburst, for a period of ∼10 months from 9 July 2019 (MJD 58673) to 10 April 2020 (MJD 58949). The TCAF model fit’s file was used to analyze the spectra and extract the accretion flow parameters throughout the outburst. Based on the variations in the physical flow parameters derived from the TCAF model and the observed QPO frequencies, the outburst was categorized into different spectral states. The source was in the rising HS from the start of the outburst upto 2 August 2019 (MJD 58697). Then the source entered the rising HIMS and remained in that state until 8 August 2019 (MJD 58703). The source entered the rising SIMS after that and the SIMS continued upto 31 August 2019 (MJD 58726). After MJD 58726, the BHC entered SS. Following November 2019, no spectral data were available for approximately four months due to the source becoming Sun-constrained [45]. As a result, it was not possible to determine the duration of the source’s presence in the SS. Spectral analysis resumed after 26 February 2020 (MJD 58905). The observations indicated that the source had already entered the declining HS.
According to the TCAF model, the model normalization N depends on intrinsic system parameters, such as distance, mass, and inclination angle, and should remain constant for a given BHC across its spectral states, unless there are physical changes like disk precession or significant jet or outflow activity. As noted in Paper I, substantial deviations in the value of N were observed during certain epochs of the outburst. Here, we followed the method presented in Debnath et al., 2021 (hereafter DCC21) [13], where an additional power-law (PL) component, representing the jet contribution, was added alongside the TCAF model with a fixed normalization (representing the disk) to fit the black hole spectra. To investigate the nature of the emitted jets, we also examined the correlation between radio and X-ray emissions.
The structure of the paper is as follows: The Section 2 provides a brief overview of the disk–jet relationship. The Section 3 outlines the method used to estimate the jet flux from the total X-ray flux. In Section 4, the observation and results are presented. The Section 5 represents brief discussion and concluding remarks.
2. Disk–Jet Connection and Spectral States
In the TCAF model, six parameters are essential for fitting observational data. Among these, four describe the accretion flow properties, one represents the mass of the black hole, and the last accounts for some intrinsic source properties and the instrument characteristics used in observation. These parameters include the Keplerian disk accretion rate (), the sub-Keplerian halo rate (), the shock location (), the compression ratio (R), the black hole mass (), and the model normalization (N). The normalization factor (N) depends on intrinsic source parameters like the black hole mass (), distance to the source (D), and the disk inclination angle (i). Therefore, for a given source, TCAF assumes a fixed N across all spectral states. However, if a significantly varying N is needed to fit an outburst dataset, it could imply the presence of a jet [13,46]. This is because TCAF deliberately omits X-ray contributions from the jet base, given the lack of a unique jet configuration for a specific accretion setup. In the presence of a jet, a higher N is required to achieve a good fit, compensating for the additional X-ray flux from the jet base.
Chakrabarti (1998) [47] demonstrated through hydrodynamic analysis that jets are thermally launched from the CENBOL region. The outflow rate () relates to the inflow rate () as a function of the compression ratio (R), expressed by
Here, and are the solid angles of the outflow and inflow cones, respectively. The compression ratio , where and are the post- and pre-shock matter densities, typically ranges from ∼1 to 4. In the soft state (SS), , while in the hard state (HS), , and it takes intermediate values in the hard-intermediate (HIMS) and soft-intermediate (SIMS) states. The compression ratio R is also influenced by other flow parameters, such as and . According to this model, the jet initially moves subsonically up to the sonic surface, roughly 2.5 times the CENBOL size (), beyond which it accelerates to supersonic speeds [12,32,46]. The jet X-ray flux () results from two main processes, upscattering of photons from the Keplerian disk and downscattering of CENBOL photons, both occurring in the subsonic jet region where the optical depth is maximum. does not account for X-rays produced by interactions between the jet and the surrounding medium. In the HS, the CENBOL is large due to a strong shock and is hotter than the incoming flow, leading to a high R. In the HIMS, the CENBOL moves closer to the black hole with an intermediate strong shock. It remains hot (though less than the HS), and R decreases, causing the outflow rate to increase slightly. In the SIMS, as the shock advances nearer to the black hole and the Keplerian disk dominates over the sub-Keplerian matter, the CENBOL cools more rapidly than in the HS or HIMS. The outflow reaches a maximum in this state, characterized by moderate R and the possible appearance of blobby jets. In the SS, complete cooling of the CENBOL by inverse-Comptonization of seed photons and the absence of shocks prevent jet/outflow formation, unless the inflow rate exceeds the Eddington limit and radiation pressure drives the outflows instead of thermal pressure. Figure 3a of Chakrabarti (1999a) [12] illustrates the variation in with R, showing that the outflow rate is initially low in the HS, then increases through the HIMS to peak in the SIMS, and finally drops to zero in the SS.
3. Estimation of Jet X-Ray Flux
Although jets predominantly emit in the radio band, they also radiate across a broad range of the electromagnetic spectrum. High-energy X-ray emission is observed from the base of the jet [48]. As the jet propagates outward, adiabatic expansion leads to a decrease in matter density and temperature, resulting in lower-energy emissions spanning the UV, optical, infrared (IR), and radio bands. During a jet-dominated phase of a black hole, the observed X-ray emission consists of two components: one originating from the accretion disk and the other from the jet itself [49]. Jana et al., 2017 [46] (hereafter JCD17) attempted to disentangle these two contributions to the total observed X-ray flux using the TCAF model with a constant normalization approach. An alternative method was introduced in DCC21, where disk and jet fluxes were disentangled by performing spectral fitting with a combined TCAF and power-law (PL) model. In this paper, we analyzed using the method mentioned in DCC21.
TCAF with an Additional Power-Law Model
During observations where the jet is active, an excess X-ray flux is often observed in addition to the emission from the accretion disk. It is well-known that the X-ray continuum from the disk comprises two principal components, a thermal one, resembling a multicolor blackbody (disk blackbody or DBB), and a nonthermal one, represented by a power-law (PL) component. The nonthermal PL emission is primarily due to inverse-Comptonization of soft photons by the hot electrons in the Comptonizing region, also known as the CENBOL [4,50]. Similar to Comptonization, synchrotron processes are also believed to be responsible for generating the X-ray emission from the base of the jet up to the sonic surface, which is approximately (JCD17). Hence, it is reasonable to model the jet X-ray contribution using a PL component, though with a slope that may differ from that of the disk PL component. From the variations in normalization (N) and radio flux (), it can be inferred that on the day with the lowest observed N, assuming is also at its minimum, the jet contribution to the observed X-ray spectrum is negligible. As the method explained in DCC21, we fitted all the spectra by adding a separate PL component to the TCAF model. We kept the TCAF normalization fixed at its lowest value to model the disk contribution, while the added PL component accounted for the jet-related X-rays. Notably, we found that the TCAF model parameters remained mostly consistent with those obtained from fits using only the TCAF model with all parameters free (see Table 2 of Paper I and Table 1 of the present study). Once we achieved the best fits using the combined TCAF+PL model, we used the XSPEC command ‘flux err’ to estimate the total X-ray flux (). The same command, in conjunction with the convolution model cflux, was applied separately to the TCAF and PL components to compute the disk inflow flux () and jet outflow flux (), respectively.
4. Observation and Results
The 2019–2020 outburst of EXO 1846-031 continued for almost 10 months, from 23 July 2019 (MJD 58687) to 10 April 2020 (MJD 58949). We analyzed eleven observations of Swift/XRT (1–10 keV) and eight observations of NICER/XTI (1–11 keV). To examine the broadband spectral properties, we also incorporated simultaneous data from MAXI/GSC (7–20 keV) with the NICER and Swift data.
To calculate the contribution of jet in X-ray, we fitted the observations with TCAF+PL model. We calculated both the inflow () and the outflow flux () in 1–11 keV energy range for all of the outbursts. We also calculated the correlation in between the radio and the X-ray flux to understand the nature of the emitting jet.
4.1. Evolution of Jet X-Rays
The variation in the MAXI/GSC X-ray flux in 2–10 keV energy band is shown in Figure 1a. There are two strong peaks in the flux around MJD 58705 and MJD 58736. The different states are separated with the vertical lines according to Paper I.
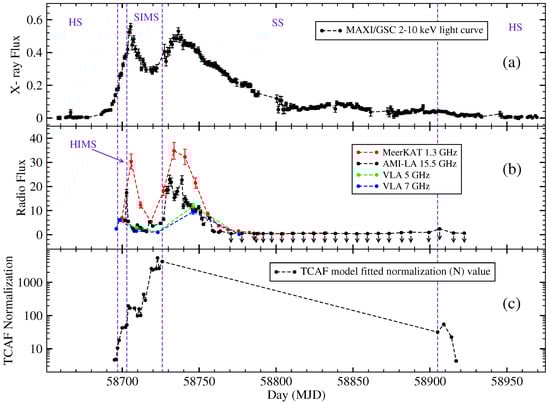
Figure 1.
Variations in (a) MAXI/GSC (2–10 keV) X-ray flux in units of Crab, (b) radio flux in different energy bands in units of mJy beam−1, and (c) TCAF model fitted normalization (N) when the spectra were fitted with TCAF model only, keeping all the parameters free.
The variations in radio flux of EXO 1846-031 during its 2019 outburst, in four different frequency bands, such as AMI-LA (15.5 GHz), MeerKAT (1.3 GHz), VLA (5 GHz), and VLA (7 GHz), are shown in Figure 1b. The data of the radio fluxes are adopted from the radio light curve of Williams et al. (2022) [45]. In the VLA band, the radio was first observed on MJD 58696, and the source was in the HS during this time. After that very day, the source entered into the rising HIMS. In the AMI-LA (15.5 GHz) energy band, the radio data peaked around MJD 58702 when the source was in rising SIMS. In the MeerKAT energy band, it can be observed that the radio data peaked around MJD 58706, when the source was in rising SIMS. In the AMI-LA band, the peak flux was 5–6 mJy beam−1 on MJD 58701, and on MJD 58702, the peak flux was 17 ± 1.4. According to Williams et al., 2022, this fast rise is labeled as the ‘first radio flare’. After that, the fluxes decreased in both the energy bands (AMI-LA and MeerKAT) and again peaked between MJD 58731 and MJD 58739 when the source was in the SS. In the AMI-LA energy band, the peak flux increased from on MJD 58724.811 to mJy beam−1 on MJD 58730.811. This is labeled as the ‘second radio flare’. Such radio-flaring activity is atypical for soft states, which are generally considered as radio-quiet. From the VLA observations, the authors observed an approaching jet ejected from the black hole at MJD 58709.330 (during which the source was in rising SIMS). Observations during MJD 58723.147 and 58746.082 showed faint jet emission (during which the source was in SS) [45]. The origin of these jet emissions may be unconventional; possibly, these jets were not launched from the CENBOL region. The underlying physical explanation for these findings is discussed in Section 5.
In Paper I, we analyzed the variation in the accretion flow properties during the outburst using TCAF model. During the analysis, a wide range of the normalization parameter N (4.31–5433) was necessary to obtain the best spectral fits, indicating a significant contribution of X-ray emission from the jet. The variation in N is shown in the Figure 1c. Here, we can see that the value of N increases initially and attains a peak at around MJD 58705. During this time, we can also see a peak in the radio data. After MJD 58705, the value of N decreases up to MJD 58712 and again starts to increase. We do not have the value of N in between MJD 58726 and MJD 58905. Although XRT and NICER spectra were available for some days during this time, TCAF fitting failed to provide statistically acceptable results, indicating a breakdown of the standard two-component accretion flow. A detailed discussion is provided in Section 4 in Paper I. Furthermore, no spectral data were available for about four months after MJD 58726 due to Sun constraints on the source [45]. After MJD 58905, there was a decreasing trend in the value of N.
During the fitting of the observations with the TCAF model, we observed that the minimum value of N was 4.31, and on that very day, the value of radio flux was also minimum. So, we froze the value of N at its minimum observed value, i.e., 4.31 for all the observations, and added an additional PL model. We calculated the value of flux contributions from the TCAF and the PL models. The flux contribution of the TCAF model gives the inflow flux (), and the contribution of the PL model gives the outflow flux (). The variation in the total flux () is shown in Figure 2a. The variation in the and are shown in Figure 2b and Figure 2c, respectively. In Figure 2c, we can see that the value of peaks around MJD 58705, during which there is also a peak in the radio data (Figure 1b). After MJD 58705, the value of decreases a little and again starts to increase. During our analysis period, it had a maximum value around MJD 58726. We do not have any data in between MJD 58726 and 58905. After MJD 58905, had very low value.
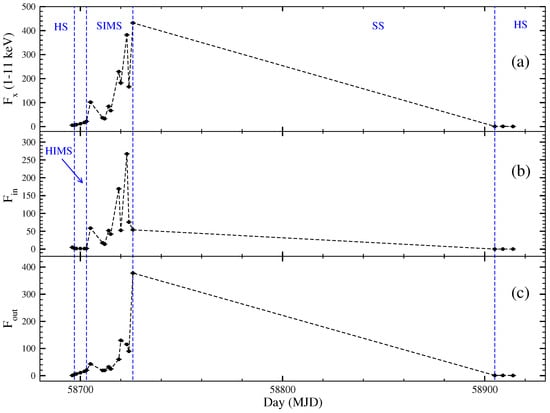
Figure 2.
Variations in the TCAF+PL model fitted: (a) total X-ray flux in 1–11 keV (), (b) inflow X-ray flux (), and (c) outflow X-ray flux (). All the X-ray fluxes () are plotted in units of erg cm−2 s−1.
We calculated the ratio of the to the and calculated the percentage of the for all the observations (Column 16 of Table 1). The maximum value of percentage of the was ∼92% and was found during MJD 58703. The average contribution of the was found to be ∼62% during this outburst.
4.2. Correlation Between the X-Ray and Radio
Figure 3 shows the correlation between radio flux () and various X-ray flux components (, , ). These correlations are modeled using the relation , where is radio flux, and is X-ray flux. The equation , with a as a proportionality constant, is used for the fitting. For all analyses, we use the AMI-LA 15.5 GHz radio data from Williams et al. (2022) [45] for the .
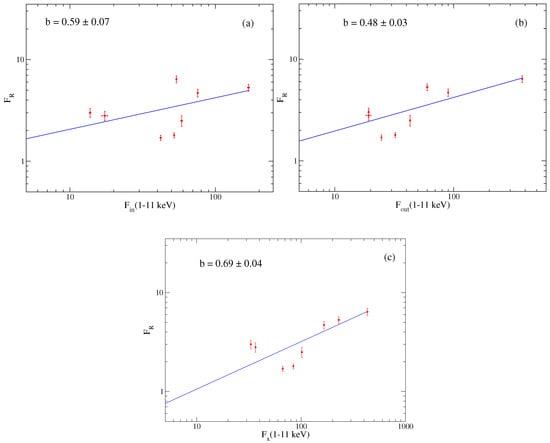
Figure 3.
Correlation plots of (a) radio flux () with inflow flux in 1–11 keV ( (1–11 keV)), (b) radio flux () with outflow flux in 1–11 keV ( (1–11 keV)), and (c) radio flux () with total X-ray flux in 1–11 keV ( (1–11 keV)). Both the axes are plotted in log scale. The radio data is taken from Williams et al. (2022), and the radio flux () is plotted in units of mJy beam−1. The X-ray fluxes, (1–11 keV), (1–11 keV), and (1–11 keV), are estimated using TCAF+Pl model where the value of TCAF normalization (N) is fixed at its minimum. The X-ray fluxes are plotted in units of erg cm−2 s−1.
Figure 3a presents the correlation between radio flux () and inflow X-ray flux in 1–11 keV (, 1–11 keV), and the obtained value of the correlation index is . The value of the Pearson correlation coefficient is , with a p-value of .
Figure 3b shows the correlation of radio flux () with outflow X-ray flux in 1–11 (, 1–11 keV). The value of the correlation index is . The value of the Pearson correlation coefficient is , with a p-value of .
Figure 3c shows the correlation of radio flux () with 1–11 keV total X-ray flux (, 1–11 keV). We find the correlation index for this is . The value of the Pearson correlation coefficient is , with a p-value of .

Table 1.
TCAF model parameters and jet properties using TCAF (with N fixed at minimum) plus PL model.
Table 1.
TCAF model parameters and jet properties using TCAF (with N fixed at minimum) plus PL model.
| Obs. ID (1) | Satellite/ Instrument (2) | Date a of Obs. (3) | Day (MJD) (4) | N b (5) |
c (6) | c (7) |
c (8) |
c (9) | R c (10) | c (11) | c (12) | d (13) | d (14) | d (15) | Percentage (16) |
|---|---|---|---|---|---|---|---|---|---|---|---|---|---|---|---|
| 2200760102 | Nicer | 2019-08-01 | 58696 | 4.82±0.04 | 0.294±0.007 | 0.995±0.008 | 9.90±0.08 | 386.27±1.50 | 1.46±0.02 | 5.97±0.34 | 844/879 | 5.84±0.47 | 5.04±0.41 | 0.80±0.06 | 13.70 |
| 00011500002 | XRT+GSC | 2019-08-02 | 58697 | 10.52±0.06 | 0.346±0.008 | 0.710±0.015 | 8.29±0.11 | 325.42±1.70 | 1.52±0.06 | 6.18±0.90 | 611/590 | 6.25±0.33 | 2.31±0.12 | 3.94±0.21 | 63.00 |
| 2200760104 | Nicer | 2019-08-03 | 58698 | 18.01±0.03 | 0.396±0.010 | 0.523±0.007 | 8.02±0.04 | 272.39±1.80 | 1.50±0.01 | 5.81±0.48 | 932/916 | 8.05±0.11 | 1.65±0.23 | 6.40±0.10 | 79.49 |
| 00011500003 | XRT+GSC | 2019-08-05 | 58700 | 42.53±0.16 | 0.577±0.012 | 0.358±0.011 | 6.95±0.08 | 182.27±2.44 | 1.22±0.03 | 6.89±1.00 | 743/634 | 12.04±0.46 | 1.46±0.56 | 10.58±0.41 | 87.85 |
| 2200760108 | Nicer+GSC | 2019-08-07 | 58702 | 44.65±0.06 | 0.766±0.015 | 0.236±0.013 | 10.22±0.08 | 91.69±1.80 | 1.08±0.02 | 6.55±0.39 | 990/907 | 17.36±0.20 | 1.56±0.20 | 15.81±0.21 | 91.04 |
| 00011500006 | XRT+GSC | 2019-08-08 | 58703 | 51.92±0.06 | 0.769±0.024 | 0.237±0.011 | 9.18±0.07 | 87.33±2.05 | 1.09±0.04 | 8.00±0.33 | 665/583 | 21.56±0.30 | 1.75±0.21 | 19.81±0.24 | 91.88 |
| 00011500008 | XRT+GSC | 2019-08-10 | 58705 | 168.42±0.22 | 0.610±0.015 | 0.092±0.009 | 7.44±0.04 | 25.29±1.50 | 1.05±0.05 | 10.14±1.10 | 694/615 | 101.71±1.50 | 58.66±0.78 | 43.05±0.57 | 42.33 |
| 2200760117 | Nicer | 2019-08-16 | 58711 | 158.32±0.07 | 0.350±0.014 | 0.117±0.019 | 11.54±0.10 | 23.37±2.10 | 1.05±0.04 | 7.74±0.09 | 894/983 | 36.61±0.40 | 17.38±0.80 | 19.23±0.89 | 52.52 |
| 2200760118 | Nicer | 2019-08-17 | 58712 | 101.21±0.13 | 0.400±0.012 | 0.111±0.007 | 11.10±0.09 | 26.82±1.90 | 1.10±0.06 | 7.66±2.02 | 884/965 | 33.02±0.40 | 13.77±0.18 | 19.25±0.25 | 58.29 |
| 2200760120 | Nicer | 2019-08-19 | 58714 | 434.09±0.29 | 0.360±0.011 | 0.060±0.018 | 11.90±0.16 | 20.10±2.20 | 1.10±0.05 | 8.94±1.02 | 1041/941 | 84.34±0.57 | 52.08±0.35 | 32.26±0.22 | 38.25 |
| 00011500016 | XRT+GSC | 2019-08-20 | 58715 | 289.29±0.35 | 0.454±0.013 | 0.074±0.009 | 7.88±0.07 | 23.26±1.90 | 1.05±0.03 | 9.59±0.78 | 622/574 | 66.76±0.82 | 42.07±0.52 | 24.69±0.30 | 36.99 |
| 00011500017 | XRT+GSC | 2019-08-23 | 58719 | 2601.40±0.44 | 0.342±0.016 | 0.050±0.011 | 11.59±0.19 | 16.23±2.50 | 1.05±0.03 | 7.89±0.64 | 571/499 | 229.31±3.86 | 169.31±2.85 | 60.00±1.00 | 26.17 |
| 2200760126 | Nicer | 2019-08-25 | 58720 | 2376.86±0.36 | 0.410±0.030 | 0.052±0.012 | 11.95±0.18 | 27.44±2.30 | 1.05±0.02 | 9.83±0.24 | 864/756 | 182.18±3.00 | 52.62±0.80 | 129.56±1.97 | 71.12 |
| 00088981001 | XRT+GSC | 2019-08-27 | 58723 | 5433.06±0.39 | 0.376±0.005 | 0.050±0.011 | 12.00±0.07 | 15.89±1.40 | 1.10±0.05 | 7.86±1.21 | 548/500 | 382.29±2.72 | 267.43±1.9 | 114.86±5.16 | 30.05 |
| 2200760130 | Nicer | 2019-08-29 | 58724 | 2613.99±0.26 | 0.350±0.025 | 0.044±0.017 | 11.50±0.30 | 20.00±3.100 | 1.05±0.03 | 7.04±1.02 | 655/473 | 165.62±1.67 | 75.72±0.76 | 89.90±0.91 | 54.28 |
| 2200760132 | Nicer | 2019-08-31 | 58726 | 4243.69±0.37 | 0.380±0.018 | 0.050±0.011 | 8.51±0.14 | 27.47±2.90 | 1.05±0.05 | 7.27±0.53 | 815/638 | 432.13±3.75 | 53.97±0.47 | 378.17±3.28 | 87.51 |
| 00011500030 | XRT+GSC | 2020-02-26 | 58905 | 31.75±0.23 | 0.058±0.005 | 0.220±0.004 | 7.31±0.15 | 272.47±5.40 | 2.31±0.04 | 4.79±0.42 | 195/175 | 0.91±0.09 | 0.13±0.01 | 0.78±0.01 | 85.75 |
| 00011500031 | XRT+GSC | 2020-03-01 | 58909 | 55.86±0.13 | 0.075±0.002 | 0.200±0.003 | 9.57±0.25 | 263.36±8.50 | 1.89±0.05 | 5.73±2.30 | 140/158 | 0.94±0.09 | 0.09±0.01 | 0.85±0.09 | 90.29 |
| 00011500032 | XRT+GSC | 2020-03-05 | 58914 | 22.48±0.06 | 0.031±0.002 | 0.230±0.006 | 11.47±0.13 | 241.26±9.50 | 2.78±0.07 | 5.06±2.12 | 103/123 | 0.53±0.05 | 0.10±0.01 | 0.43±0.02 | 81.32 |
| 00011500033 * | XRT+GSC | 2020-03-09 | 58917 | 4.31±0.05 | — | — | — | — | — | — | — | — | — | — | — |
* The OBSID 00011500033 is not fitted with TCAF plus PL model. The lowest value of N (=4.31) was observed during this observation. a Dates are mentioned in YYYY-MM-DD format. b N shows the values of the TCAF normalization when the spectra were fitted with TCAF model only keeping all the parameters free. c TCAF+PL model fitted spectral parameters are shown in columns (6)–(11) when TCAF normalization is fixed at its minimum i.e., 4.31. values are in atoms cm−2. d 1–11 keV X-ray fluxes (in 10 −9 erg cm−2 s−1) using TCAF+PL model when TCAF normalization is fixed at its minimum (columns (13)–(15)). Column (12) shows the values and degrees of freedom (dof) of the TCAF+PL spectral model fits with TCAF normalization fixed at its minimum. Notes. Superscripts on the parameter values represent average error values obtained using the err task in XSPEC with 90% confidence.
5. Discussion and Conclusions
In Paper I, we examined the accretion flow characteristics of the Galactic BHC EXO 1846-031 during its 2019 outburst by analyzing spectral and timing data of Swift/XRT, Swift/BAT, MAXI/GSC, NICER/XTI, and NuSTAR/FPM. The spectra were fitted using the TCAF model. Throughout the outburst, including the softer states, such as SIMS and SS, the source exhibited strong radio activity, indicating significant jet presence. This motivated us to estimate the jet or outflow contributions from the observed total X-ray flux using the approach described in DCC21. To separate the jet contribution in the X-ray spectra, we introduced an additional PL component while keeping the TCAF model normalization (N) fixed at its minimum observed value. This minimum N is obtained from Paper I, where all the spectra were fitted, keeping all TCAF parameters free. Unlike built-in models in XSPEC, the TCAF normalization is not adjusted for each observation but remains constant across spectral states for a specific source. However, in the presence of jets or outflows, significant deviations in N can occur because the current version of the TCAF model does not include X-ray emission from the jet base. During the 2019 outburst of EXO 1846-031, N varied from 4.31 to 5433. The lowest N value (=4.31) was recorded on 9 March 2020 (MJD 58917), when was also minimal, indicating that the observed X-ray flux () on that day likely originated purely from the accretion inflow (see JCD17 for more details). This allowed us to estimate the inflow X-ray flux () by re-fitting the spectra using this lowest N value. The jet contribution () was then derived for each observation. Overall, we found that the jet contributed up to 92% of the total X-ray flux, with an average contribution of about 62%, indicating a jet-dominated nature during intermediate and soft spectral states.
As shown in Figure 1, there were two peaks in the radio () data. The peaks were at around MJD 58702 and MJD 58730 (from AMI-LA data). During our analysis period, reached its maximum value around MJD 58726. It can also be seen that there is a small peak in the value of at MJD 58703. We could not fit the data beyond MJD 58726 upto MJD 58905. We believe that if the data could be fitted, we would also have the maximum value of around MJD 58730. On the day MJD 58917, both the and had minimum values.
We also examined the correlation between the radio flux () and three types of X-ray fluxes, total (), inflow (), and outflow (), expressed in the form . Although a moderate positive correlation was found () between and , the result was not statistically significant (). However, we found a strong positive correlation between the and (, ), and the power index was found to be . The power index does not fall within the ‘standard’ index range of 0.6–0.7. In the current study, the jet was observed when the source was in the rising intermediates states and in the SS. Due to lack of X-ray data availability, we could analyze the correlation between the radio and X-ray during the rising intermediate states only. In Gallo et al., 2003 [37], it is mentioned that the power index is observed during the low hard state. In the current study, we do not have the data during hard state. This may explain the deviation of the observed correlation index from the standard value. A strong positive correlation was also found between and (, ), with a correlation index value of .
The launching of the jets or outflows can be primarily explained by two fundamental mechanisms, the Blandford–Znajek (BZ) process and the Blandford–Payne (BP) mechanism [26,28,51]. In the Blandford & Znajek (1977) model [26], the rotational energy of a spinning (Kerr) black hole powers relativistic jets. An electric potential is created when a rotating black hole is threaded by magnetic field lines that are anchored in an equatorial accretion disc. A force-free magnetosphere is created when the field is strong enough to trigger the production of electron–positron pairs. In these circumstances, collimated, relativistic outflows are launched when the angular momentum and energy are extracted by electromagnetic (Poynting) flux. This condition is most effectively satisfied in magnetically dominated, low-accretion-rate environments, such as the hard state in X-ray binaries, when the inner accretion flow is geometrically thick, optically thin, and capable of sustaining strong magnetic fields near the event horizon. Blandford and Payne (1982) [28] showed that when the poloidal component of the magnetic field is inclined at an angle less than 60°, with respect to the disk surface, an accretion disk can initiate a centrifugally driven outflow. The toroidal component of the magnetic field becomes more prominent at larger distances from the disk, collimating the outflow into two oppositely directed jets perpendicular to the disk plane. In the inner region near the disk, the outflow may additionally be supported by gas pressure arising from a hot, magnetically dominated corona. Such conditions are generally associated with geometrically thick, magnetically active disks, which can be seen during the hard or intermediate accretion states in X-ray binaries. In the soft spectral state, however, the accretion disk becomes geometrically thin and optically thick, reducing the vertical magnetic flux and weakening the magnetic coupling between the disk and the outflow region. Consequently, the Blandford–Payne centrifugal mechanism becomes inefficient or suppressed in the soft state. Chakrabarti 1999 [12] explained that the CENBOL region is the origin of the jet or outflows. In the soft state, the CENBOL region disappears, and thus, the jets produced in the soft state cannot be explained by this model.
Generally, outflows are absent in the soft state (SS). However, in this outburst, significant outflows are observed even in SS, suggesting that the jet-launching mechanisms in this state differ from those in hard or intermediate states. In this case, the jet-launching region may not be the CENBOL, as is typically expected. These discrete jets observed in the SS are likely radiation-pressure-driven. During SS, the accretion disk may become magnetically dominated due to the high accretion rate, which brings in a large amount of stochastic magnetic field from the companion star. The azimuthal motion in the disk leads to the formation of toroidal magnetic flux tubes, which experience strong magnetic tension. When the magnetic field is sufficiently strong, this tension becomes dominant and causes the flux tubes to collapse. As a result, large amounts of matter may be expelled perpendicularly to the disk, a phenomenon referred to as the ‘magnetic rubber band effect’ [52]. This expulsion of matter can produce blobby jet components or outflows, which may also manifest as soft X-ray dips or flares. The disk likely became magnetically dominated, and the jet was possibly launched from its outer region. In these soft states, the high accretion rate in the Keplerian disk likely led to the ejection of a large amount of matter along magnetic field lines, allowing the system to shed angular momentum efficiently [28]. The same type of jet was also observed in the case of the BHC XTE J1752-22 during its 2009–2010 outburst (DCC21).
Author Contributions
Conceptualization, R.B. and D.D.; methodology, R.B., S.K.N., and D.D.; software, R.B. and D.D.; validation, D.D. and H.-K.C.; formal analysis, R.B.; data curation, R.B. and S.K.N.; writing—original draft preparation, R.B.; writing—review and editing, R.B., D.D., H.-K.C., and S.K.N.; supervision, D.D. and H.-K.C. All authors have read and agreed to the published version of the manuscript.
Funding
This research received no external funding.
Data Availability Statement
This work used the data of Swift/XRT, Swift/BAT, NICER/XTI, and NuSTAR/FPM data supplied by the UK Swift Science Data Centre at the University of Leicester. MAXI/GSC data were provided by RIKEN, JAXA, and the MAXI team.
Acknowledgments
R.B. acknowledges support from the CSIR-UGC fellowship (June 2018). S.K.N. acknowledges support from the SVMCM fellowship, the Govt. of West Bengal, India and the visiting research grant of National Tsing Hua University, Taiwan. D.D. acknowledges support from the Govt. of West Bengal, India and visiting research grant of National Tsing Hua University, Taiwan (NSTC 113-2811-M-007-010). H.-K.C. is supported by NSTC of Taiwan under grant 114-2112-M-007-042.
Conflicts of Interest
The authors declare no conflicts of interest.
References
- Chakrabarti, S.K.; Debnath, D.; Nagarkoti, S. Delayed outburst of H 1743-322 in 2003 and relation with its other outbursts. Adv. Space Res. 2019, 63, 3749–3759. [Google Scholar] [CrossRef]
- Bhowmick, R.; Debnath, D.; Chatterjee, K.; Nagarkoti, S.; Chakrabarti, S.K.; Sarkar, R.; Chatterjee, D.; Jana, A. Relation Between Quiescence and Outbursting Properties of GX 339-4. Astrophys. J. 2021, 910, 138. [Google Scholar] [CrossRef]
- Shakura, N.I.; Sunyaev, R.A. Black holes in binary systems. Observational appearance. Astron. Astrophys. 1973, 24, 337–355. [Google Scholar]
- Chakrabarti, S.K.; Titarchuk, L.G. Spectral Properties of Accretion Disks around Galactic and Extragalactic Black Holes. Astrophys. J. 1995, 455, 623–639. [Google Scholar] [CrossRef]
- Chakrabarti, S.K. Spectral Properties of Accretion Disks around Black Holes. II. Sub-Keplerian Flows with and without Shocks. Astrophys. J. 1997, 484, 313–322. [Google Scholar] [CrossRef][Green Version]
- Debnath, D.; Mondal, S.; Chakrabarti, S.K. Characterization of GX 339-4 outburst of 2010–11: Analysis by xspec using two component advective flow model. Mon. Not. R. Astron. Soc. 2015, 447, 1984–1995. [Google Scholar] [CrossRef][Green Version]
- Debnath, D.; Jana, A.; Chakrabarti, S.K.; Chatterjee, D.; Mondal, S. Accretion Flow Properties of Swift J1753.5-0127 during Its 2005 Outburst. Astrophys. J. 2017, 850, 92. [Google Scholar] [CrossRef]
- Homan, J.; Belloni, T. The Evolution of Black Hole States. Astrophys. Space Sci. 2005, 300, 107–117. [Google Scholar] [CrossRef]
- Nandi, A.; Debnath, D.; Mandal, S.; Chakrabarti, S.K. Accretion Flow Dynamics during the Evolution of Timing and Spectral Properties of GX 339-4 during its 2010–11 Outburst. Astron. Astrophys. 2012, 542, A56. [Google Scholar] [CrossRef]
- Motta, S.; Belloni, T.; Homan, J. The Evolution of the High-Energy Cut-Off in the X-ray Spectrum of GX 339-4 across a Hard-to-Soft Transition. Mon. Not. R. Astron. Soc. 2009, 400, 1603–1612. [Google Scholar] [CrossRef]
- Fender, R.P.; Gallo, E. An Overview of Jets and Outflows in Stellar Mass Black Holes. Space Sci. Rev. 2014, 183, 323–337. [Google Scholar] [CrossRef]
- Chakrabarti, S.K. Estimation and effects of the mass outflow from shock compressed flow around compact objects. Astron. Astrophys. 1999, 351, 185. [Google Scholar]
- Debnath, D.; Chatterjee, K.; Chatterjee, D.; Jana, A.; Chakrabarti, S.K. Jet properties of XTE J1752-223 during its 2009–2010 outburst. Mon. Not. R. Astron. Soc. 2021, 504, 4242–4251. [Google Scholar] [CrossRef]
- Merloni, A.; Heinz, S.; Di Matteo, T. A Fundamental Plane of black hole activity. Mon. Not. R. Astron. Soc. 2003, 345, 1057–1076. [Google Scholar] [CrossRef]
- Körding, E.; Jester, S.; Fender, R. Accretion states and radio loudness in active galactic nuclei: Analogies with X-ray binaries. Mon. Not. R. Astron. Soc. 2006, 372, 1366–1378. [Google Scholar] [CrossRef]
- Corbel, S.; Coriat, M.; Brocksopp, C.; Tzioumis, A.K.; Fender, R.P.; Tomsick, J.A.; Buxton, M.M.; Bailyn, C.D. Formation of the Compact Jets in the Black Hole GX 339-4. Mon. Not. R. Astron. Soc. Lett. 2013, 431, L107–L111. [Google Scholar] [CrossRef]
- Hjellming, R.M.; Gibson, D.M.; Owen, F.N. Another Major Change in the Radio Source Associated with Cyg X-1. Nature 1975, 256, 111–112. [Google Scholar] [CrossRef]
- Mirabel, I.F.; Rodriguez, L.F.; Cordier, B.; Paul, J.; Lebrun, F. A Double-Sided Radio Jet from the Compact Galactic Centre Annihilator 1E1740.7-2942. Nature 1992, 358, 215–217. [Google Scholar] [CrossRef]
- Laurent, P.; Rodriguez, J.; Wilms, J.; Cadolle Bel, M.; Pottschmidt, K.; Grinberg, V. Polarized Gamma-Ray Emission from the Galactic Black Hole Cygnus X-1. Science 2011, 332, 438–439. [Google Scholar] [CrossRef]
- Corbel, S.; Dubus, G.; Tomsick, J.A.; Szostek, A.; Coriat, M.; Fender, R.P.; Tzioumis, A.K.; Brocksopp, C.; Sivakoff, G.R.; Smith, R.J.; et al. A Giant Radio Flare from Cygnus X-3 with Associated γ-Ray Emission. Mon. Not. R. Astron. Soc. 2012, 421, 2947–2955. [Google Scholar] [CrossRef]
- Stirling, A.M.; Spencer, R.E.; De La Force, C.J.; Garrett, M.A.; Fender, R.P.; Ogley, R.N. A relativistic jet from Cygnus X-1 in the low/hard X-ray state. Mon. Not. R. Astron. Soc. 2001, 327, 1273–1278. [Google Scholar] [CrossRef]
- Dhawan, V.; Mirabel, I.F.; Rodriguez, L.F. AU-Scale Synchrotron Jets and Superluminal Ejecta in GRS 1915+105. Astrophys. J. 2000, 543, 373. [Google Scholar] [CrossRef]
- Jourdain, E.; Roques, J.P.; Chauvin, M.; Clark, D.J. Separation of Two Contributions to the High Energy Emission of Cygnus X-1: Polarization Measurements with INTEGRAL SPI. Astrophys. J. 2012, 761, 27. [Google Scholar] [CrossRef]
- Loh, A.; Corbel, S.; Dubus, G.; Rodriguez, J.; Grenier, I.; Hovatta, T.; Pearson, T.; Readhead, A.; Fender, R.; Mooley, K. High-energy gamma-ray observations of the accreting black hole V404 Cygni during its 2015 June outburst. Mon. Not. R. Astron. Soc. 2016, 462, L111–L115. [Google Scholar] [CrossRef]
- Blandford, R.D.; Rees, M.J. A ‘Twin-Exhaust’ Model for Double Radio Sources. Mon. Not. R. Astron. Soc. 1974, 169, 395–415. [Google Scholar] [CrossRef]
- Blandford, R.D.; Znajek, R.L. Electromagnetic extraction of energy from Kerr black holes. Mon. Not. R. Astron. Soc. 1977, 179, 433–456. [Google Scholar] [CrossRef]
- Znajek, R.L. The electric and magnetic conductivity of a Kerr hole. Mon. Not. R. Astron. Soc. 1978, 185, 833–840. [Google Scholar] [CrossRef]
- Blandford, R.D.; Payne, D.G. Hydromagnetic flows from accretion discs and the production of radio jets. Mon. Not. R. Astron. Soc. 1982, 199, 883–903. [Google Scholar] [CrossRef]
- Das, T.; Chakrabarti, S.K. Mass outflow rate from accretion discs around compact objects. Class. Quantum Gravity 1999, 16, 3879. [Google Scholar] [CrossRef][Green Version]
- Chakrabarti, S.K.; Nandi, A. Fundamental States of Accretion/Jet Configuration and the Black Hole Candidate GRS1915+105. Indian J. Phys. 2000, 75, 1. [Google Scholar]
- Chakrabarti, S.K. Jets, Disks and Spectral States of Black Holes. AIP Conf. Proc. 2001, 558, 831–840. [Google Scholar] [CrossRef]
- Chakrabarti, S.K. Latest trends in the study of accretion and outflows around compact objects. Indian J. Phys. 1999, 73B, 931. [Google Scholar]
- Fender, R.P.; Belloni, T.M.; Gallo, E. Towards a Unified Model for Black Hole X-ray Binary Jets. Mon. Not. R. Astron. Soc. 2004, 355, 1105–1118. [Google Scholar] [CrossRef]
- Hannikainen, D.C.; Hunstead, R.W.; Campbell-Wilson, D.; Sood, R.K. MOST Radio Monitoring of GX 339-4. Astron. Astrophys. 1998, 337, 460. [Google Scholar]
- Corbel, S.; Nowak, M.A.; Fender, R.P.; Fender, R.P.; Tzioumis, A.K.; Markoff, S. Radio/X-ray correlation in the low/hard state of GX 339-4. Astron. Astrophys. 2003, 400, 1007–1012. [Google Scholar] [CrossRef]
- Corbel, S.; Coriat, M.; Brocksopp, C.; Brocksopp, C.; Tzioumis, A.K.; Fender, R.P.; Tomsick, J.A.; Buxton, M.M.; Bailyn, C.D. The ‘universal’ radio/X-ray flux correlation: The case study of the black hole GX 339-4. Mon. Not. R. Astron. Soc. 2013, 428, 2500–2515. [Google Scholar] [CrossRef]
- Gallo, E.; Fender, R.; Pooley, G. A Universal Radio-X-ray Correlation in Low/Hard State Black Hole Binaries. Mon. Not. R. Astron. Soc. 2003, 344, 60–72. [Google Scholar] [CrossRef]
- Parmar, A.N.; White, N.E. EXO 1846-031. IAU Circ. 1985, 4051, 1. [Google Scholar]
- Parmar, A.N.; Angelini, L.; Roche, P.; White, N.E. The discovery and properties of the ultra-soft X-ray transient EXO 1846-031. Astron. Astrophys. 1993, 279, 179–187. [Google Scholar]
- Negoro, H.; Nakajima, M.; Sugita, S.; Sasaki, R.; Mihara, W.I.T.; Maruyama, W.; Aoki, M.; Kobayashi, K.; Tamagawa, T.; Matsuoka, M.; et al. MAXI/GSC detection of renewed activity of the black hole candidate EXO 1846-031 after 34 years. Astron. Telegr. 2019, 12968, 1. [Google Scholar]
- Draghis, P.A.; Miller, J.M.; Cackett, E.M.; Kammoun, E.S.; Reynolds, M.T.; Tomsick, J.A.; Zoghbi, A. A New Spin on an Old Black Hole: NuSTAR Spectroscopy of EXO 1846-031. Astrophys. J. 2020, 900, 78. [Google Scholar] [CrossRef]
- Wang, Y.; Ji, L.; García, J.A.; Dauser, T.; Mendez, M.; Mao, J.; Tao, L.; Altamirano, D.; Maggi, P.; Zhang, S.N.; et al. A Variable Ionized Disk Wind in the Black Hole Candidate EXO 1846-031. Astrophys. J. 2021, 906, 11. [Google Scholar] [CrossRef]
- Strohmayer, T.E.; NICER Observatory Science Working Group. Evidence for High Frequency QPOs in the Black Hole Candidate EXO 1846-031. Am. Astron. Soc. Meet. Abstr. 2020, 235, 159.02. [Google Scholar]
- Nath, S.K.; Debnath, D.; Chatterjee, K.; Bhowmick, R.; Chang, H.K.; Chakrabarti, S.K. (Paper I) Accretion Flow Properties of EXO 1846-031 During its Multi-Peaked Outburst After Long Quiescence. Astrophys. J. 2024, 960, 5. [Google Scholar] [CrossRef]
- Williams, D.R.A.; Motta, S.E.; Fender, R.; Miller-Jones, J.C.A.; Neilsen, J.; Allison, J.R.; Bright, J.; Heywood, I.; Jacob, P.F.L.; Rhodes, L.; et al. Radio observations of the Black Hole X-ray Binary EXO 1846-031 re-awakening from a 34-year slumber. Mon. Not. R. Astron. Soc. 2022, 517, 2801–2817. [Google Scholar] [CrossRef]
- Jana, A.; Chakrabarti, S.K.; Debnath, D. Properties of X-Ray Flux of Jets during the 2005 Outburst of Swift J1753.5-0127 Using the TCAF Solution. Astrophys. J. 2017, 850, 91. [Google Scholar] [CrossRef]
- Chakrabarti, S.K. Spectral softening due to winds in accretion disks. Indian J. Phys. B 1998, 72, 565. [Google Scholar]
- Markoff, S.; Nowak, M.A.; Wilms, J. Going with the flow: Can the base of jets subsume the role of compact accretion disk coronae? Astrophys. J. 2005, 635, 1203–1216. [Google Scholar] [CrossRef]
- Russell, D.M.; Maitra, D.; Dunn, R.J.H.; Markoff, S. Evidence for a compact jet dominating the broad-band spectrum of the black hole accretor XTE J1550-564. Mon. Not. R. Astron. Soc. 2010, 402, 267–277. [Google Scholar] [CrossRef]
- Chakrabarti, S.K. Generalized Accretion Flow Configuration: Rationale and Observational Evidences. AIP Conf. Proc. 2010, 1206, 244–262. [Google Scholar]
- Dihingia, I.K.; Vaidya, B. Properties of the Accretion Disc, Jet and Disc-Wind around Kerr Black Hole. J. Astrophys. Astron. 2022, 43, 23. [Google Scholar] [CrossRef]
- Nandi, A.; Chakrabarti, S.K.; Vadawale, S.V.; Rao, A.R. Ejection of the inner accretion disk in GRS 1915+105: The magnetic rubber-band effect. Astron. Astrophys. 2001, 380, 245–250. [Google Scholar] [CrossRef][Green Version]


Disclaimer/Publisher’s Note: The statements, opinions and data contained in all publications are solely those of the individual author(s) and contributor(s) and not of MDPI and/or the editor(s). MDPI and/or the editor(s) disclaim responsibility for any injury to people or property resulting from any ideas, methods, instructions or products referred to in the content. |
© 2025 by the authors. Licensee MDPI, Basel, Switzerland. This article is an open access article distributed under the terms and conditions of the Creative Commons Attribution (CC BY) license (https://creativecommons.org/licenses/by/4.0/).