General Guidelines for Sample Preparation Strategies in HR-µMAS NMR-based Metabolomics of Microscopic Specimens

Abstract
1. Introduction
2. HR-µMAS Sample Preparation
2.1. µg Sampling
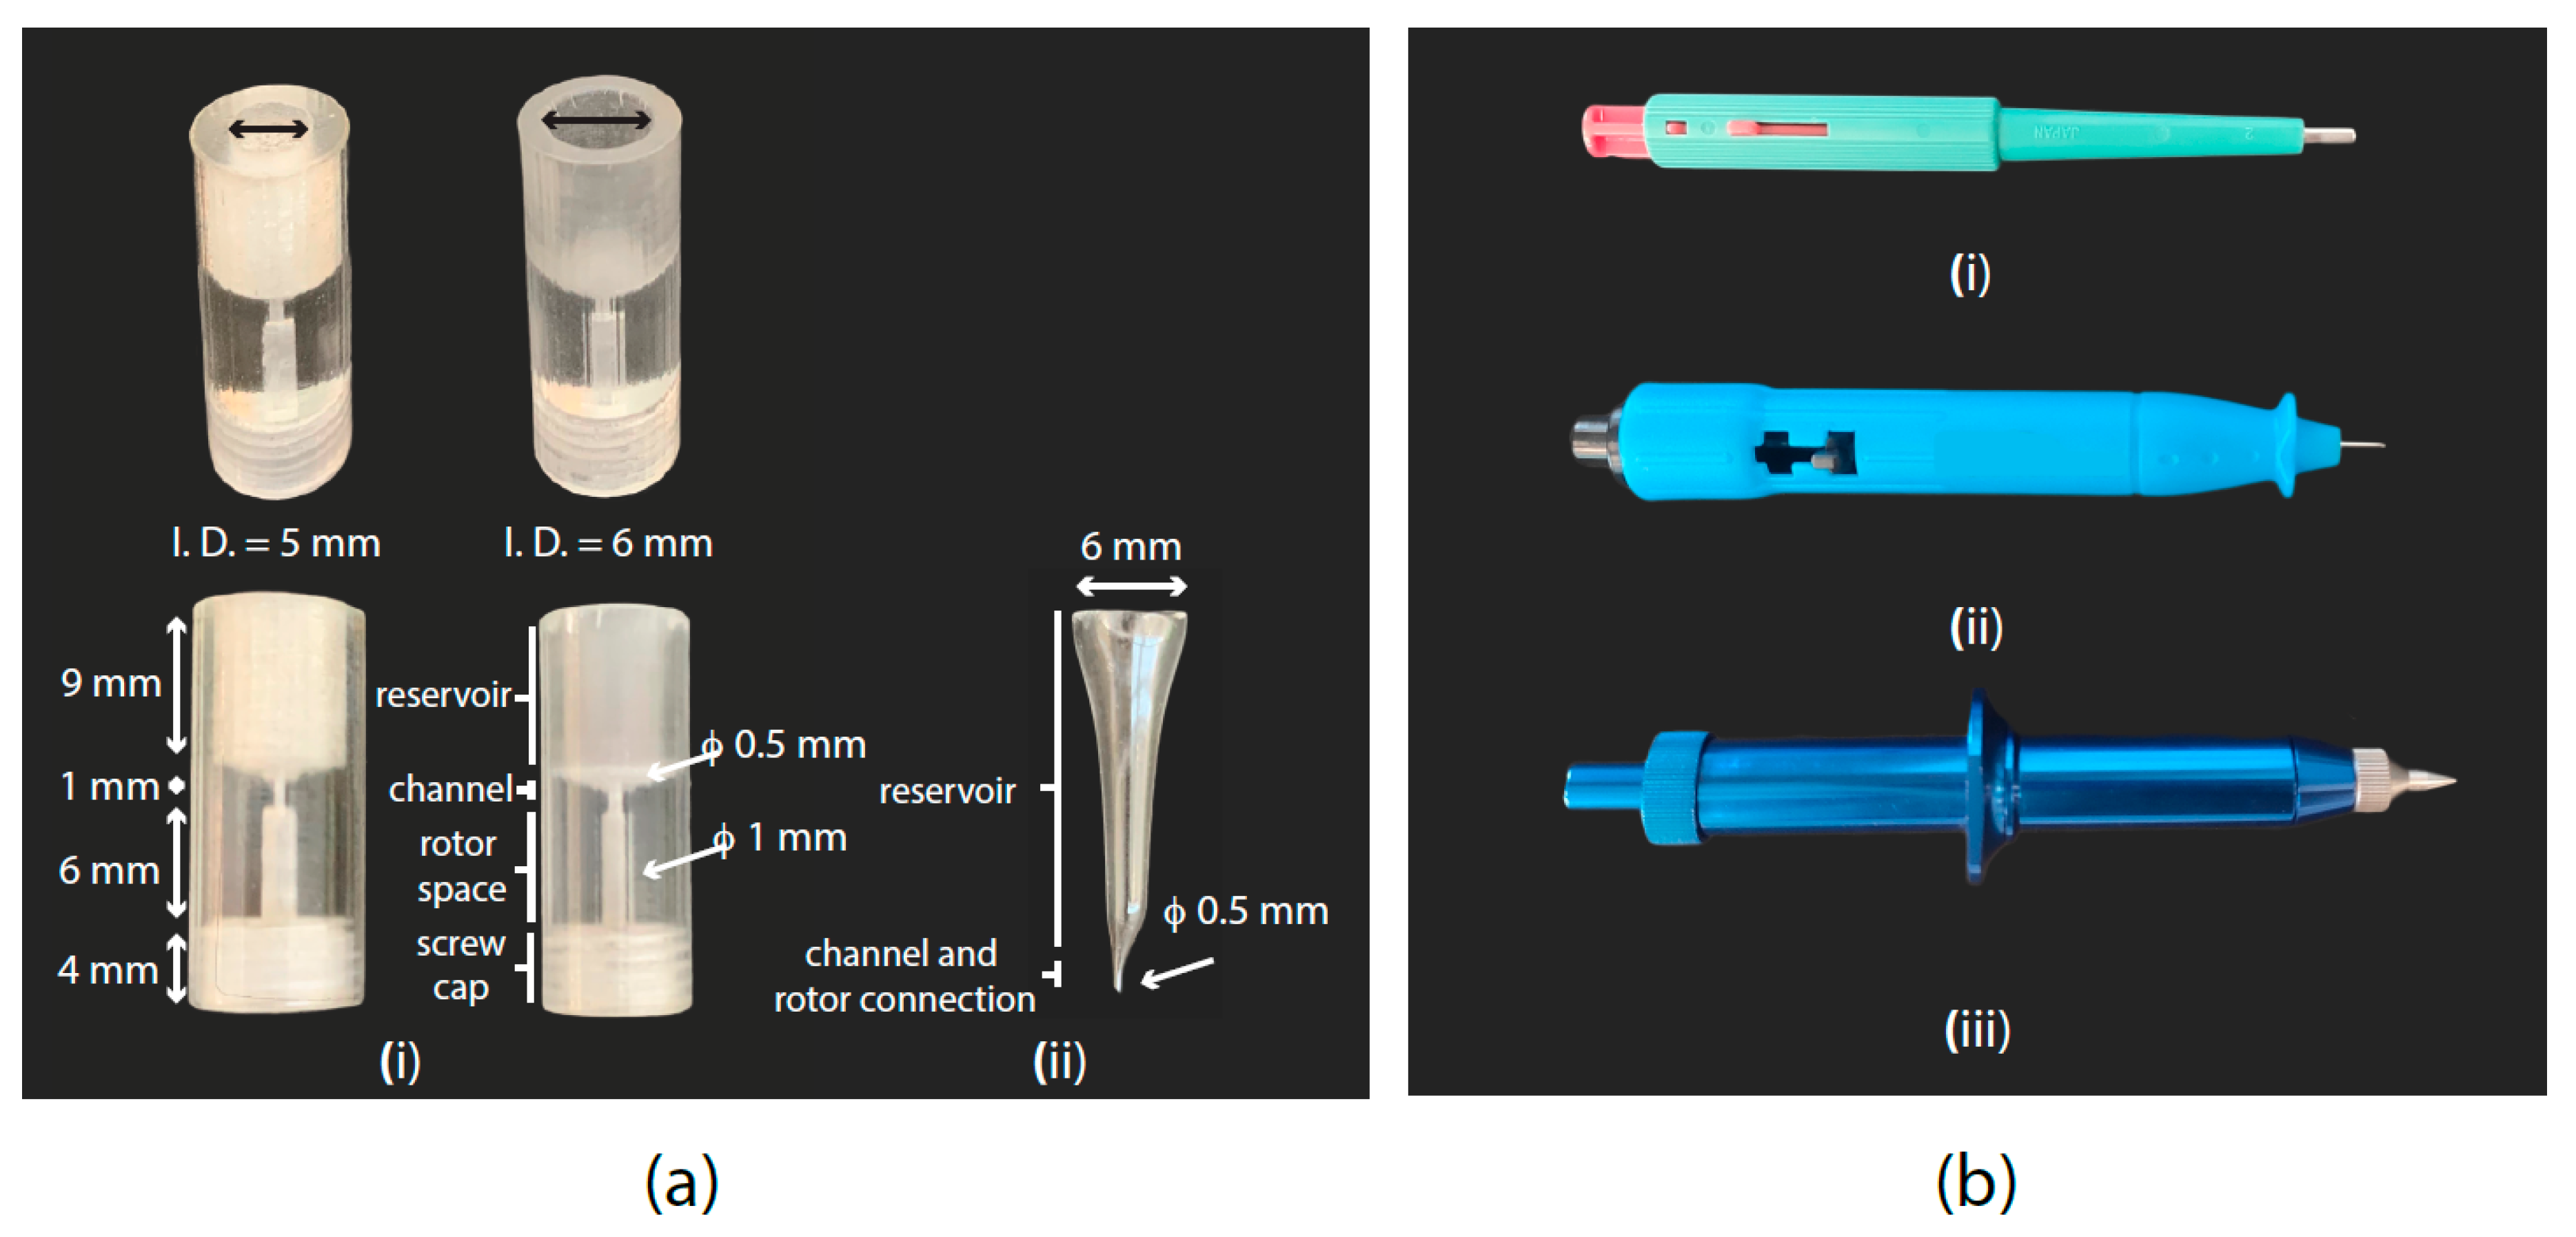
2.2. Sample Filling
2.2.1. Micropipette or Microsyringe
- ○
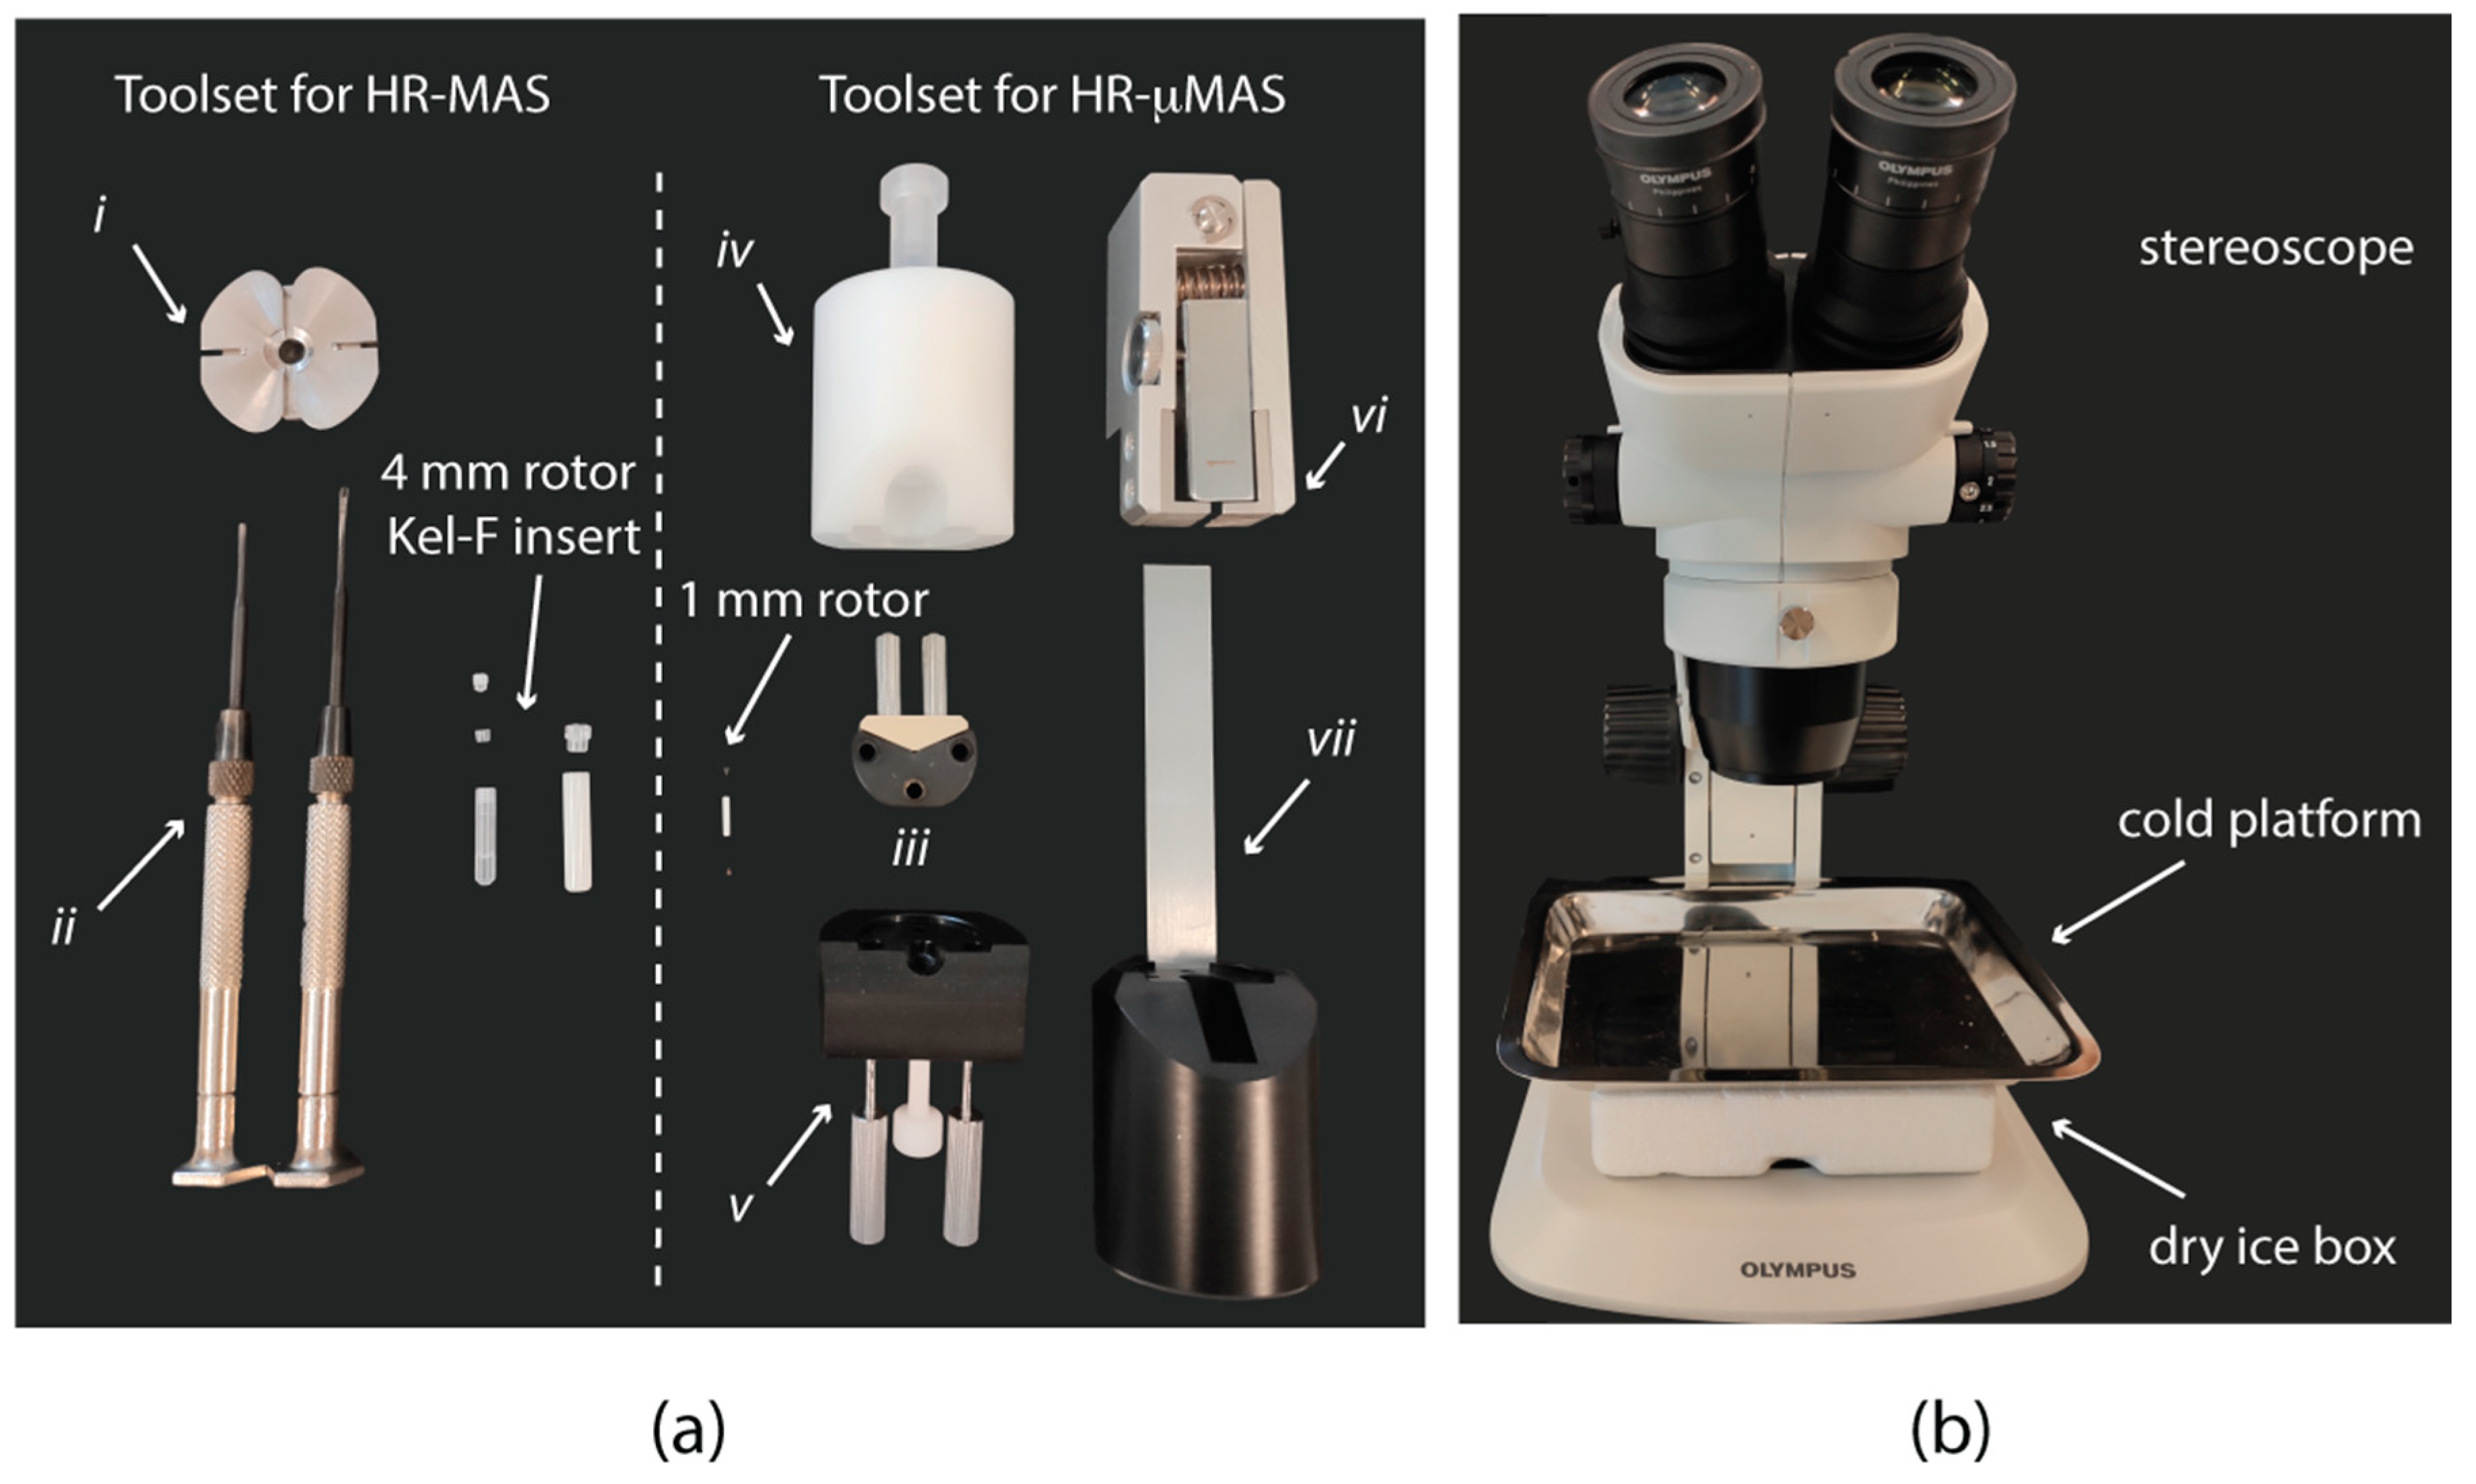
- Convey 1–2 µL of fluid inside the µ-rotor by placing the tip (or needle) at the bottom. Tip: the µ-rotor is placed in the holder (Figure 1a, iii) to facilitate the handling.
- ○
- Release the fluid slowly while moving upwards to avoid air bubbles.
- ○
- Centrifuge (~3000 rpm, ~30 s; recommended at 4 °C) the filled μ-rotor to ensure the exclusion of air bubbles.
- ○
- Seal the µ-rotor with a designated µ-rotor cap using the dedicated toolset (e.g., Figure 1a). Caution: Ensure a sufficient space for the sealing; if not, the sealing would be impossible.
2.2.2. Centrifugal Microfunnel
- ○
- Place the µ-rotor inside the designated space in the funnel.
- ○
- Convey (by either pipette or glass syringe) the matrix into the funnel reservoir.
- ○
- Centrifuge at 4 °C. The speed and time depend on the funnel materials (polymers such as Kel-F and Teflon allow for faster centrifugation, while glass will only tolerate a gentle centrifugation).
- ○
- Close the µ-rotor.
2.2.3. Microbiopsy Punch
- ○
- Extract µg sample by punching. Tip: Frozen samples facilitate a clean excision.
- ○
- Fast transfer of the excised sample into the µ-rotor (placed in a holder).
- ○
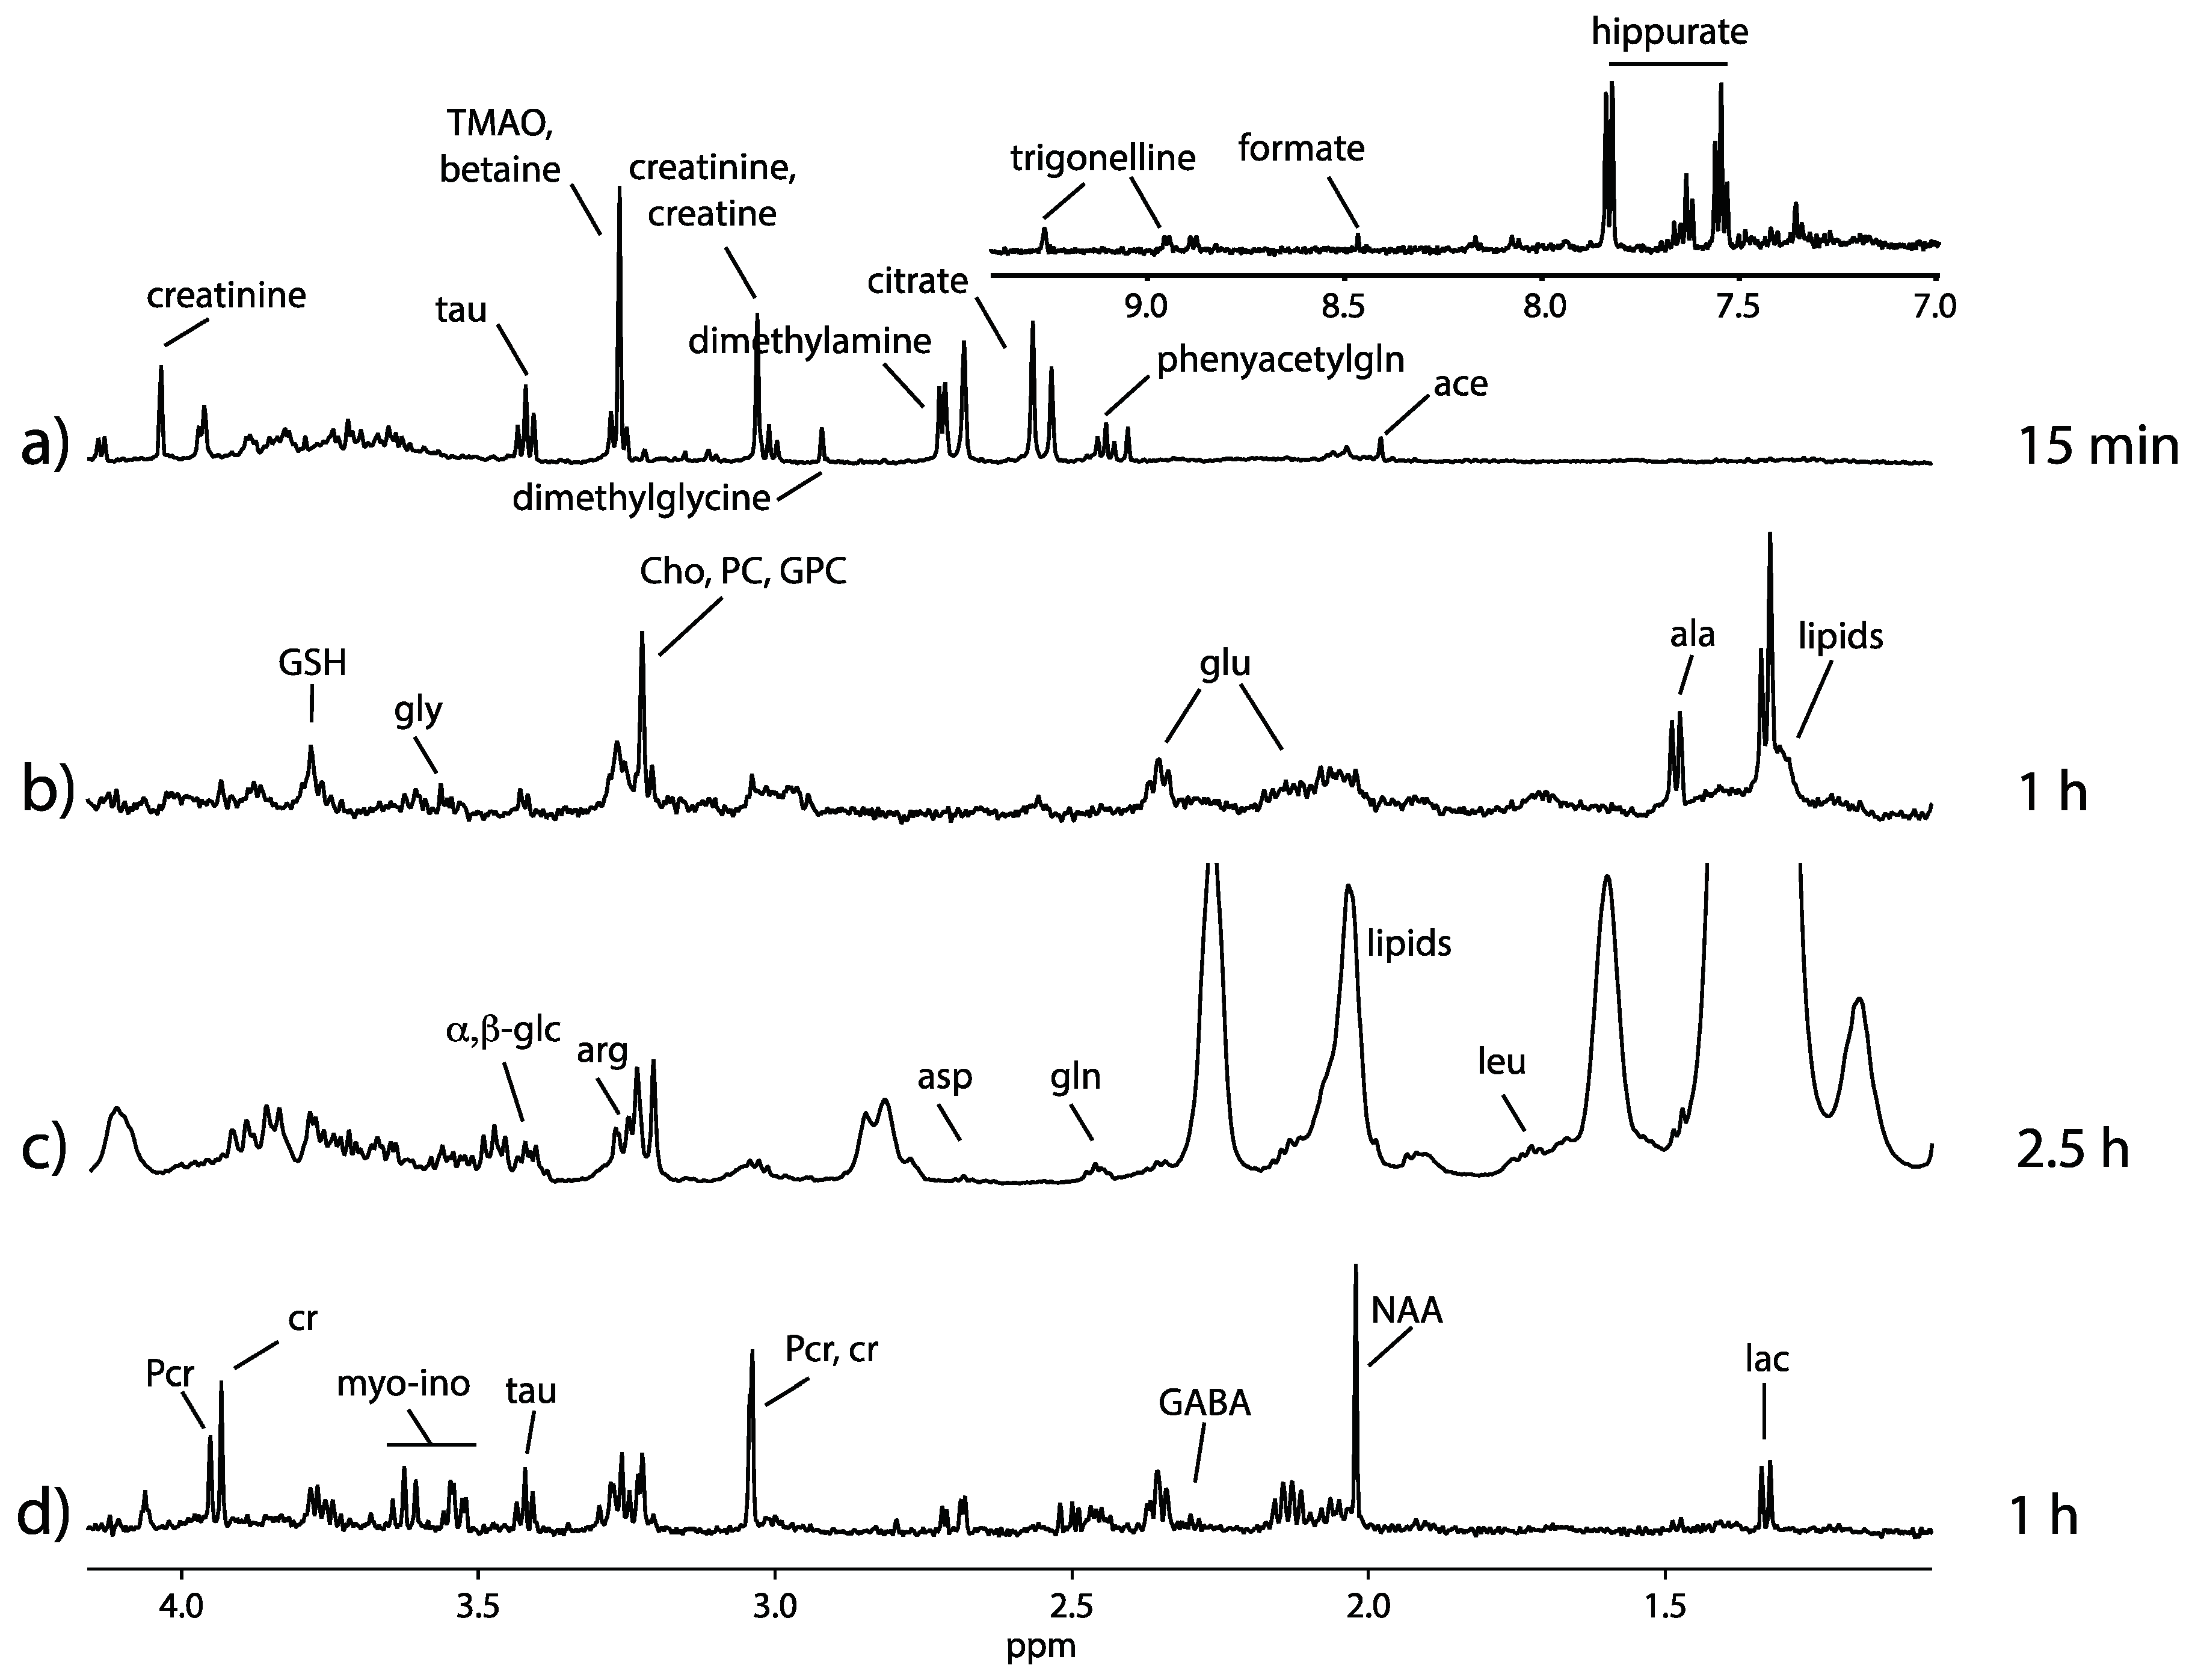
- Follow by adding a drop of D2O (or buffer) into the sample to homogenize and to avoid dehydration. Note: Water content in the sample can have a large effect on the spectral quality (Supplementary Materials Figure S2).
- ○
- Close one end of the µ-rotor followed by a gentle centrifugation (~1500 rpm, ~30 s, at 4 °C) for sample positioning and releasing air bubbles.
- ○
- Fill the remaining µ-rotor volume with D2O or buffer. Tip: Use the holder.
- ○
- A second centrifugation should be applied to further homogenize the sample.
- ○
- Close the µ-rotor.
2.3. Pre-Acquisition Considerations
3. Final Remarks
Supplementary Materials
Author Contributions
Funding
Acknowledgments
Conflicts of Interest
References
- Dunn, W.B.; Ellis, D.I. Metabolomics: Current analytical platforms and methodologies. Trends Anal. Chem. 2005, 24, 285–294. [Google Scholar] [CrossRef]
- Moco, S.; Bino, R.J.; de Vos, R.C.H.; Vervoort, J. Metabolomics technologies and metabolite identification. Trends Anal. Chem. 2007, 26, 855–866. [Google Scholar] [CrossRef]
- Dunn, W.B.; Broadhurst, D.; Begley, P.; Zelena, E.; Francis-Mcintyre, S.; Anderson, N.; Brown, M.; Knowles, J.D.; Halsall, A.; Haselden, J.N.; et al. Procedures for large-scale metabolic profiling of serum and plasma using gas chromatography and liquid chromatography coupled to mass spectrometry. Nat. Protoc. 2011, 6, 1060–1083. [Google Scholar] [CrossRef] [PubMed]
- Martano, G.; Delmotte, N.; Kiefer, P.; Christen, P.; Kentner, D.; Bumann, D.; Vorholt, J.A. Fast sampling method for mammalian cell metabolic analyses using liquid chromatography-mass spectrometry. Nat. Protoc. 2015, 10, 1–11. [Google Scholar] [CrossRef]
- Rubakhin, S.S.; Sweedler, J.V. Characterizing peptides in individual mammalian cells using mass spectrometry. Nat. Protoc. 2007, 2, 1987–1997. [Google Scholar] [CrossRef]
- Vuckovic, D. Current trends and challenges in sample preparation for global metabolomics using liquid chromatography-mass spectrometry. Anal. Bioanal. Chem. 2012, 403, 1523–1548. [Google Scholar] [CrossRef]
- Beckonert, O.; Keun, H.C.; Ebbels, T.M.D.; Bundy, J.; Holmes, E.; Lindon, J.C.; Nicholson, J.K. Metabolic profiling, metabolomic and metabonomic procedures for NMR spectroscopy of urine, plasma, serum and tissue extracts. Nat. Protoc. 2007, 2, 2692–2703. [Google Scholar] [CrossRef]
- Pontes, J.G.M.; Brasil, A.J.M.; Cruz, G.C.F.; de Souza, R.N.; Tasic, L. NMR-based metabolomics strategies: Plants, animals and humans. Anal. Methods 2017, 9, 1078–1096. [Google Scholar] [CrossRef]
- Álvarez-Sánchez, B.; Priego-Capote, F.; Luque de Castro, M.D. Metabolomics analysis I. Selection of biological samples and practical aspects preceding sample preparation. Trends Anal. Chem. 2010, 29, 111–119. [Google Scholar] [CrossRef]
- Álvarez-Sánchez, B.; Priego-Capote, F.; Luque de Castro, M.D. de Metabolomics analysis II. Preparation of biological samples prior to detection. Trends Anal. Chem. 2010, 29, 120–127. [Google Scholar] [CrossRef]
- Beckonert, O.; Coen, M.; Keun, H.C.; Wang, Y.; Ebbels, T.M.D.; Holmes, E.; Lindon, J.C.; Nicholson, J.K. High-resolution magic-angle-spinning NMR spectroscopy for metabolic profiling of intact tissues. Nat. Protoc. 2010, 5, 1019–1032. [Google Scholar] [CrossRef]
- Mirnezami, R.; Jiménez, B.; Li, J.V.; Kinross, J.M.; Veselkov, K.; Goldin, R.D.; Holmes, E.; Nicholson, J.K.; Darzi, A. Rapid diagnosis and staging of colorectal cancer via high-resolution magic angle spinning nuclear magnetic resonance (HR-MAS NMR) spectroscopy of intact tissue biopsies. Ann. Surg. 2014, 259, 1138–1149. [Google Scholar] [CrossRef]
- Choi, J.S.; Baek, H.-M.; Kim, S.; Kim, M.J.; Youk, J.H.; Moon, H.J.; Kim, E.-K.; Han, K.H.; Kim, D.; Kim, S.I.; et al. HR-MAS MR Spectroscopy of Breast Cancer Tissue Obtained with Core Needle Biopsy: Correlation with Prognostic Factors. PLoS ONE 2012, 7, e51712. [Google Scholar] [CrossRef] [PubMed]
- Farooq, H.; Courtier-Murias, D.; Soong, R.; Bermel, W.; Kingery, W.; Simpson, A. HR-MAS NMR Spectroscopy: A Practical Guide for Natural Samples. Curr. Org. Chem. 2013, 17, 3013–3031. [Google Scholar] [CrossRef]
- Blaise, B.J.; Giacomotto, J.; Triba, M.N.; Toulhoat, P.; Piotto, M.; Emsley, L.; Ségalat, L.; Dumas, M.E.; Elena, B. Metabolic profiling strategy of caenorhabditis elegans by whole-organism nuclear magnetic resonance. J. Proteome Res. 2009, 8, 2542–2550. [Google Scholar] [CrossRef] [PubMed]
- Nishiyama, Y.; Endo, Y.; Nemoto, T.; Bouzier-Sore, A.-K.; Wong, A. High-resolution NMR-based metabolic detection of microgram biopsies using a 1 mm HRμMAS probe. Analyst 2015, 140, 8097–8100. [Google Scholar] [CrossRef]
- Duong, N.T.; Endo, Y.; Nemoto, T.; Kato, H.; Bouzier-Sore, A.-K.; Nishiyama, Y.; Wong, A. Evaluation of a high-resolution micro-sized magic angle spinning (HRμMAS) probe for NMR-based metabolomic studies of nanoliter samples. Anal. Methods 2016, 8, 6815–6820. [Google Scholar] [CrossRef]
- Lucas-Torres, C.; Huber, G.; Ichikawa, A.; Nishiyama, Y.; Wong, A. HR-μMAS NMR-Based Metabolomics: Localized Metabolic Profiling of a Garlic Clove with μg Tissues. Anal. Chem. 2018, 90, 13736–13743. [Google Scholar] [CrossRef]
- Lucas-Torres, C.; Wong, A. Current developments in µMAS NMR analysis for metabolomics. Metabolites 2019, 9, 29. [Google Scholar] [CrossRef]
- Duong, N.T.; Yamato, M.; Nakano, M.; Kume, S.; Tamura, Y.; Kataoka, Y.; Wong, A.; Nishiyama, Y. Capillary-inserted rotor design for HRμMAS NMR-based metabolomics on mass-limited neurospheres. Molecules 2017, 22, 1289. [Google Scholar] [CrossRef]
- Feng, J.; Hu, J.; Burton, S.D.; Hoyt, D.W. High Resolution Magic Angle Spinning 1H NMR metabolic profiling of nanoliter biological tissues at high magnetic field. Chinese J. Magn. Reson. 2013, 30, 1–11. [Google Scholar]
- Wong, A.; Li, X.; Molin, L.; Solari, F.; Elena-Herrmann, B.; Sakellariou, D. µHR-MAS NMR Spectroscopy for Metabolic Phenotyping of Caenorhabditis Elegans. Anal. Chem. 2014, 86, 6064–6070. [Google Scholar] [CrossRef] [PubMed]
- León, Z.; García-Cañaveras, J.C.; Donato, M.T.; Lahoz, A. Mammalian cell metabolomics: Experimental design and sample preparation. Electrophoresis 2013, 34, 2762–2775. [Google Scholar] [CrossRef] [PubMed]
- Lu, W.; Su, X.; Klein, M.S.; Lewis, I.A.; Fiehn, O.; Rabinowitz, J.D. Metabolite Measurement: Pitfalls to Avoid and Practices to Follow. Annu. Rev. Biochem. 2017, 86, 277–304. [Google Scholar] [CrossRef] [PubMed]
- Mashego, M.R.; Rumbold, K.; de Mey, M.; Vandamme, E.; Soetaert, W.; Heijnen, J.J. Microbial metabolomics: Past, present and future methodologies. Biotechnol. Lett. 2007, 29, 1–16. [Google Scholar] [CrossRef] [PubMed]
- Piotto, M.; Elbayed, K.; Wieruszeski, J.M.; Lippens, G. Practical aspects of shimming a high resolution magic angle spinning probe. J. Magn. Reson. 2005, 173, 84–89. [Google Scholar] [CrossRef]


© 2020 by the authors. Licensee MDPI, Basel, Switzerland. This article is an open access article distributed under the terms and conditions of the Creative Commons Attribution (CC BY) license (http://creativecommons.org/licenses/by/4.0/).
Share and Cite
Lucas-Torres, C.; Bernard, T.; Huber, G.; Berthault, P.; Nishiyama, Y.; Kandiyal, P.S.; Elena-Herrmann, B.; Molin, L.; Solari, F.; Bouzier-Sore, A.-K.; et al. General Guidelines for Sample Preparation Strategies in HR-µMAS NMR-based Metabolomics of Microscopic Specimens. Metabolites 2020, 10, 54. https://doi.org/10.3390/metabo10020054
Lucas-Torres C, Bernard T, Huber G, Berthault P, Nishiyama Y, Kandiyal PS, Elena-Herrmann B, Molin L, Solari F, Bouzier-Sore A-K, et al. General Guidelines for Sample Preparation Strategies in HR-µMAS NMR-based Metabolomics of Microscopic Specimens. Metabolites. 2020; 10(2):54. https://doi.org/10.3390/metabo10020054
Chicago/Turabian StyleLucas-Torres, Covadonga, Thierry Bernard, Gaspard Huber, Patrick Berthault, Yusuke Nishiyama, Pancham S. Kandiyal, Bénédicte Elena-Herrmann, Laurent Molin, Florence Solari, Anne-Karine Bouzier-Sore, and et al. 2020. "General Guidelines for Sample Preparation Strategies in HR-µMAS NMR-based Metabolomics of Microscopic Specimens" Metabolites 10, no. 2: 54. https://doi.org/10.3390/metabo10020054
APA StyleLucas-Torres, C., Bernard, T., Huber, G., Berthault, P., Nishiyama, Y., Kandiyal, P. S., Elena-Herrmann, B., Molin, L., Solari, F., Bouzier-Sore, A.-K., & Wong, A. (2020). General Guidelines for Sample Preparation Strategies in HR-µMAS NMR-based Metabolomics of Microscopic Specimens. Metabolites, 10(2), 54. https://doi.org/10.3390/metabo10020054