Abstract
The proliferation of artificial intelligence (AI) and online services has significantly escalated the demand for computing and storage resources, which are fundamentally enabled by cloud computing infrastructure. As the backbone of cloud computing services, data centers have undergone continuous expansion in scale, consequently leading to significant energy consumption and a significant carbon footprint. To effectively mitigate the environmental impact, the strategy should prioritize the integration of renewable energy, while simultaneously minimizing other contributing factors such as energy consumption. Achieving both objectives simultaneously requires a fine-grained, dynamic approach to workload management. To this end, this study proposes a comprehensive container placement strategy that integrates a dynamic priority-based container selection algorithm with a multi-factor single-objective container placement algorithm based on the Dream Optimization Algorithm (DOA). The placement algorithm converts multiple factors—including load balancing in multi-data center environments, energy consumption, renewable energy utilization rate, carbon emissions, Service Level Agreement Violation (SLAV), and container migration costs—into a comprehensive fitness metric. Experimental results on Google and Alibaba datasets show our method consistently achieves the highest renewable energy utilization rates (up to 92.08%) and the lowest carbon emissions. Furthermore, our integrated strategy demonstrates a superior trade-off, reducing migration counts by up to 16.3% and SLAV by 12.4% compared to baselines, while maintaining excellent green performance. This establishes our method as a practical and effective solution for sustainable cloud computing.
1. Introduction
With the rapid growth of the global digital economy, emerging technologies such as large-scale AI models and autonomous intelligent systems are driving an unprecedented surge in computing demand. By the end of 2024, China’s total computing capacity had reached 280 EFLOPS (Exa Floating Point Operations Per Second), with an average annual growth rate of nearly 30% over the past five years [1]. This surge in computational capacity has brought about significant operational and environmental implications, most notably the escalating energy demands of large-scale data centers.
This direct link between computing power and electricity consumption means that as data centers operate to meet ever-increasing demand, their carbon footprints inevitably grow. According to the International Energy Agency (IEA), global data centers consumed 415 TWh of electricity in 2024, representing 1.5% of the world’s total electricity consumption—approximately equivalent to the annual electricity usage of the United Kingdom. This consumption is projected to reach 945 TWh by 2030 [2]. If the current trend continues, global data center carbon emissions are expected to rise from 180 million tons in 2024 to 300 million tons by 2035. These figures highlight the urgent need to improve the energy efficiency of data centers.
In response to the dual challenge of meeting growing computing demand while reducing carbon emissions, China has launched the national “East Data, West Computing” initiative under its “Carbon Peaking and Carbon Neutrality Goals” strategy. Similar to other large-scale green computing initiatives worldwide, this strategy leverages geographical diversity to match computing demand with regions of abundant renewable energy. This initiative includes eight computing hubs and ten clusters to channel eastern computing demand westward, where advanced data centers—acting as adjustable loads in the new power system—can achieve renewable energy utilization rates of up to 80% through direct renewable power supply [3]. However, the geographic diversity, periodicity, intermittency, and instability of renewable energy sources pose significant challenges for maintaining stable operations and maximizing renewable energy usage.
To address these challenges, researchers have investigated methods to increase renewable energy utilization while reducing reliance on supplementary fossil-based energy [4]. Specifically, one promising approach involves dynamically migrating workloads between data centers to take advantage of regions with higher renewable energy availability or lower energy costs. This migration capability enables real-time adaptation to supply variations—such as those from wind and solar—thereby improving renewable energy utilization and reducing overall carbon emissions.
Implementing rapid and flexible workload migration requires an underlying virtualization technology that is lightweight, portable, and efficient. Containerization has emerged as a widely adopted approach for deploying diverse applications across clusters and private or public cloud environments. Its advantages include high efficiency in storage, resource utilization, performance, cost-effectiveness, portability, energy efficiency, and rapid start-up times [5,6]. Compared with virtual machines, which require full hardware environment simulation, containers share the host operating system kernel, thereby reducing resource consumption while maintaining process isolation, independent operation, and ease of deployment [7].
For latency-sensitive and continuous-service scenarios, such as multi-data center workload scheduling, container migration typically adopts live migration techniques, which most commonly include the pre-copy and post-copy approaches [8], in order to minimize service downtime while maintaining a low total migration time.
Given the need for real-time and energy-aware workload relocation across multiple data centers, determining optimal migration timing and placement is a complex decision-making task involving large-scale search spaces, non-linear objectives, and dynamic constraints. These challenges are further compounded by fluctuating workloads, variable renewable energy generation, and the need to balance service quality with operational costs. The main contributions of this work, which collectively address these challenges, are as follows:
- Propose a renewable-energy-aware container migration strategy that integrates a Dynamic Priority-Based Algorithm (DPA) for container selection with a Multi-Factor Dream Optimization Algorithm (MF-DOA) for container placement, aiming to optimize renewable energy utilization, service quality, and operational costs.
- Validate the proposed approach through CloudSim-based simulations under realistic workload and renewable energy scenarios.
- Demonstrate that the approach increases renewable energy usage and reduces carbon emissions, while maintaining low Service Level Agreement Violation (SLAV)and migration costs.
The remainder of this paper is structured as follows. Section 2 reviews the related work in the fields of container migration and renewable energy-aware scheduling. Section 3 presents the problem formulation and system modeling. Section 4 details the proposed container migration strategy for renewable energy consumption. Section 5 provides comprehensive experimental results and analysis. Finally, Section 6 concludes the paper with a summary of our findings and outlines future research directions.
2. Related Work
Since a considerable fraction of computational workloads exhibits flexibility in both execution time and location, data centers can contribute to carbon emissions reduction by effectively managing their loads [9]. In containerized environments, where workloads are encapsulated, optimizing for renewable energy utilization necessitates the strategic placement and migration of containers across geographically diverse data centers.
The architecture of the multi-data center container migration model is illustrated in Figure 1.
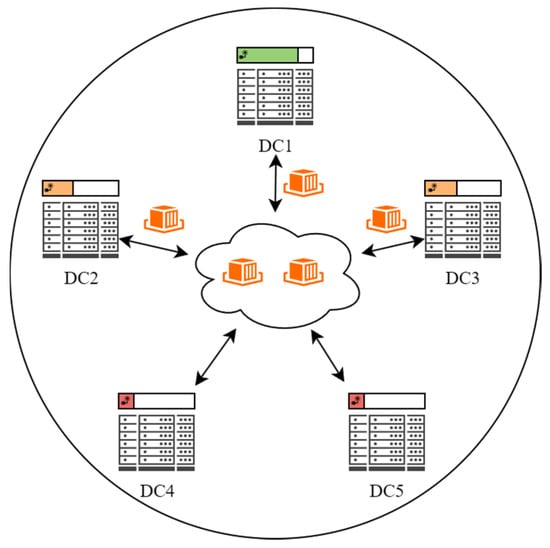
Figure 1.
Architecture of the Multi-Data Center Container Migration Model. The color coding of each data center (DC) header indicates its current renewable energy availability, with green (DC1) denoting the highest, orange (DC2 and DC3) representing medium, and red (DC4 and DC5) indicating the lowest availability. Arrows denote the migration paths of containers, which are migrated to maximize renewable energy utilization across geographically dispersed data centers.
Research on virtual machine or container placement and migration has traditionally centered on single-factor optimization. However, as user requirements become increasingly diverse, optimizing a single resource dimension is no longer sufficient [10]. Integrating multiple factors into a unified objective function introduces complexity because factors often conflict, making trade-offs essential in decision-making. From a technical perspective, existing approaches can be broadly categorized into heuristic algorithms, machine learning-based algorithms, and metaheuristic algorithms.
Heuristic algorithms, particularly greedy strategies, are widely adopted for virtual machine (VM) placement in large-scale cloud environments due to their computational efficiency and scalability. These methods typically employ rule-based decisions to rapidly find near-optimal solutions. Jing, Y et al. [11] developed a greedy-based VM placement scheme that filters and scores physical hosts based on a comprehensive set of metrics affecting SLAV. Wang, J et al. [12] proposed a greedy algorithm aimed at minimizing total energy consumption and resource wastage. A primary limitation of such heuristic approaches is their inherent tendency to converge to local optima. This myopic nature often leads to suboptimal resource allocation, hindering the achievement of global optimization objectives.
More recent work has explored machine learning and reinforcement learning for container placement, aiming to capture complex workload patterns and adapt decisions over time. Li, J et al. [13] proposed an improved Q-Learning approach that introduces ε-greedy strategy and qualification traces similar to simulated annealing to optimize container placement for energy and service quality. Yang, Z et al. [14] developed a unified Deep Reinforcement Learning model that integrates both initial VM placement and migration processes, achieving higher physical machine utilization through Proximal Policy Optimization. D’Souza, M et al. [15] designed an MLP-LSTM hybrid model optimized by Sheep Flock Optimization algorithm to enhance workload predictions and resource allocation, significantly reducing energy with balanced resources. While these methods can learn effective policies, they often require large volumes of training data and may struggle with generalization to unseen workload distributions.
Metaheuristics have been extensively investigated for container migration because of their versatility and global search capability. For instance, Wu, G et al. [10] develop a two-level node container migration strategy based on the Ant Colony Optimization (ACO) algorithm to balance edge node workloads. Similarly, Durgaprasad, S et al. [16] present an Adaptive Dragonfly Optimization (ADrO) algorithm, incorporating a Lévy flight strategy to avoids local optima and preserves diversity during data migration. Li et al. [17] propose an Energy-efficient Online Service Migration (EOSM) strategy combined with an improved metaheuristic approach, which outperforms baseline methods in terms of energy consumption. Feng, H et al. [18] introduce the Adaptive Boundary Grey Wolf Optimizer (ABGWO) to minimize active servers, outperforming five other intelligent algorithms in solution quality and stability. These approaches often incur increased computational complexity and require meticulous parameter tuning, significantly impacting convergence speed. Moreover, effectively defining and solving the unified optimization problem, limiting their practical applicability in complex cloud environments.
Existing research inadequately addresses carbon emissions and renewable energy considerations in container migration strategies. To address these challenges, we propose a renewable-energy-aware container migration strategy that integrates the DPA with the MF-DOA. The DPA leverages renewable energy forecasts to dynamically select containers for migration, effectively reducing SLAV. Meanwhile, the MF-DOA utilizes a dream optimization metaheuristic approach that demonstrates superior convergence performance compared to traditional methods, while incorporating multiple critical factors including energy consumption, carbon emissions, SLAV, and load balancing into a unified, aggregated objective function.
3. Problem Formulation and Modeling
3.1. Energy Consumption Model
IT equipment constitutes the primary source of energy consumption in data center hosts, typically accounting for 40–60% of the total. This study therefore focuses on the energy consumed by IT equipment during operation. Host resource utilization rate is characterized by four key metrics: CPU utilization rate (), memory utilization rate (), disk utilization rate (), and bandwidth utilization rate ().
The upper bounds of the available resources in a data center are defined as follows:
denotes the upper limit of resource on the host, and denotes the upper limit of resource in data center .
The resource constraints of host for container are defined as follows:
where denotes the amount of resource utilized by container . Containers whose resource demands exceed these constraints cannot be allocated to the corresponding host.
The formula for calculating the power consumption of a host is given by Equation (3):
where denotes the idle power consumption of the host , denotes the peak (full-load) power consumption of and denotes the proportion of total power consumption attributable to resource type .
Based on Equation (3), the total power consumption of a data center can be expressed as Equation (4):
where denotes the additional power consumption of data center for supporting server operation.
Similarly, the power consumption of containers within a host can be estimated from the host’s power consumption, as shown in Equation (5):
where denotes the total number of containers on host , and denotes the utilization rate of resource type by container .
3.2. Container Migration Model
The cost of container migration depends on the migration technology employed. Common container migration approaches include cold migration (migration with downtime) and live migration (migration with minimal downtime). Live migration techniques comprise pre-copy migration, post-copy migration, hybrid migration, and real-time migration. Since live migration maintains service continuity and minimizes or eliminates downtime, it is adopted as the standard approach for the calculations in this study.
For container during its live migration, let denote the total amount of data that needs to be transmitted at the beginning of the -th pre-copy iteration. This value consists of the memory pages dirtied since the last transfer. The amount of data for the -th iteration is calculated as shown in Equation (6):
where denotes the amount of data to be transmitted for container during its -th migration iteration, denotes the dirty page generation rate of container , denotes the bandwidth available during container migration.
The migration time of a container, which is determined by the sum of all data transmitted throughout the entire migration process, from the initial full memory copy to the final stop-and-copy phase, can be calculated as shown in Equation (7):
To comprehensively evaluate the overhead of container migration, we define a unified cost metric, , that quantifies the total energy penalty incurred during the migration of container. This metric integrates the migration duration with the incremental power consumption on both the source and destination hosts, as well as the performance degradation experienced by the co-located containers. The migration cost of a single container is computed as shown in Equation (8):
where denotes the peak power of the most energy-intensive container on the source host, representing the worst-case performance impact; denotes the peak power on the destination host, which is scaled by to quantify the performance degradation cost; denotes the instantaneous power consumption of the migration network traffic.
Based on Equation (8), the total migration cost of containers in a data center is calculated as shown in Equation (9):
3.3. Data Center Renewable Energy Consumption Model
For data centers, the types of energy sources vary with geographical location. These energy sources can be categorized into brown (non-renewable) energy, including coal () and natural gas (), and renewable energy, including solar (), wind (), hydro (), and other renewable sources () such as geothermal energy.
The proportion of renewable energy that can be utilized by a data center is calculated as shown in Equation (10):
where denotes the amount of energy available to data center .
The carbon emissions generated by a data center can be calculated as given in Equation (11):
where denotes the carbon emission factors (in kg CO2 per kWh) for the corresponding energy source.
When the current energy consumption of a data center exceeds its available renewable energy capacity, the data center is considered to experience renewable energy overload. In this case, container migration to data centers with surplus renewable energy is required to increase the overall proportion of renewable energy consumption and reduce carbon emissions. The energy consumption constraint of a data center is expressed in Equation (12):
The primary objective is to maximize the utilization of renewable energy across all data centers. This optimization is performed subject to the simultaneous minimization of several key operational costs, including total energy consumption, migration costs, load balancing and SLAV penalties.
4. Container Migration Strategy for Renewable Energy Consumption
In a multi-data center environment, container migration is executed through two sequential and interdependent decision-making modules: container selection and container placement. The container selection module determines which containers should be migrated from source data centers that satisfy predefined migration criteria. Subsequently, the container placement module allocates the selected containers to destination data centers that meet the placement constraints.
4.1. Dynamic Priority-Based Algorithm (DPA) for Container Selection
During operation, when a data center experiences renewable energy capacity exceedance, container migration is triggered to achieve the dual objectives of maximizing renewable energy utilization rate and reducing carbon emissions.
To ensure that the renewable energy consumption of a data center does not exceed its available capacity, containers are migrated until the current energy consumption is less than or equal to the available renewable energy supply. The container selection algorithm identifies a sufficient number of containers for migration from overloaded data centers. The selected containers constitute the input set for the container placement algorithm.
If migration decisions are made solely based on the current energy state, it can lead to unnecessary migrations when energy supply subsequently increases, or to repeated migrations when it decreases.
To mitigate unnecessary or repeated migrations caused by such fluctuations, day-ahead renewable energy forecasts are combined with recent historical measurements to predict the short-term trend of renewable energy availability. This prediction guides the determination of the migration target. Considering both the real-time requirements and computational overhead, the weighted moving average (WMA) method is adopted for trend prediction.
For a prediction time , the predicted renewable energy availability is calculated as follows:
where denotes the renewable energy availability at time step on the current day, denotes the renewable energy availability at time step on the previous day, denotes the weight assigned to the renewable energy value at time step on the current day, denotes the weight assigned to the renewable energy value at time step on the previous day, and denotes the size of the prediction window.
The correction term is updated using an exponential decay method to capture the cumulative deviation of the prediction residuals from the previous time step, as shown in Equation (14):
This approach mitigates prediction errors arising from sudden fluctuations or system lag. In this formulation, (where ) is the smoothing coefficient that governs the weight of the residual correction. To determine the optimal value for , we conducted experiments using the renewable energy dataset described in Section 5. A one-week data segment was selected, with the first five days used for parameter tuning and the remaining two days for out-of-sample prediction. The prediction performance was evaluated using the Mean Absolute Percentage Error (MAPE) and the Root Mean Square Error (RMSE) for various values of . The results indicated that yielded the best performance. The detailed outcomes are illustrated in Figure 2.
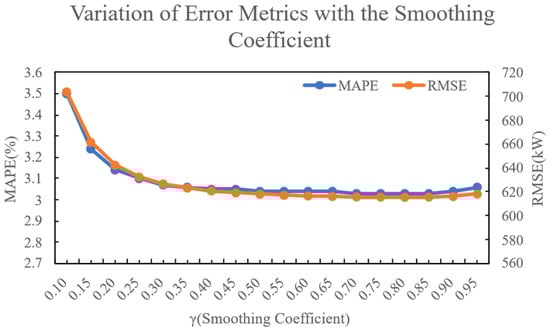
Figure 2.
Variation in Error Metrics with the Smoothing Coefficient.
To validate our method’s effectiveness, we performed an independent backtest using the same renewable energy dataset. The experimental setup mirrored the previous one: five days for parameter updating and two days for rolling prediction on a 7-day dataset (approx. 2016 points at 5 min resolution). We compared our Improved WMA (with residual correction ) against two benchmarks: a traditional WMA and an MiniLSTM model. As shown in Table 1, the Improved WMA achieves significantly lower MAPE and RMSE than the traditional WMA. Notably, during periods of sharp power changes (>30%), our method reduced the maximum instantaneous error by 48.87%, showcasing its excellent robustness and adaptability.

Table 1.
Comparison of the effects of prediction algorithms.
By forecasting the renewable energy availability for the next time steps, a set of predicted values is obtained. The migration target of the current renewable energy-overloaded data center is then updated to . It is critical to note that this prediction-based approach serves as an anti-oscillation mechanism. By forecasting the short-term trend rather than reacting to instantaneous fluctuations, the algorithm can distinguish between transient dips and sustained changes, thereby avoiding unnecessary migrations and promoting system stability.
After determining the migration target, the next step is to select appropriate containers for migration. Since data centers host diverse cloud workloads, containers differ in their resource usage patterns, leading to varying migration costs and impacts. Broadly, containers can be categorized into CPU-intensive and I/O-intensive types.
CPU-intensive containers typically execute workloads such as video processing and deep learning, characterized by high CPU and memory utilization. In contrast, I/O-intensive containers handle workloads such as web-based services and database management services, which exhibit high disk I/O and network bandwidth utilization. The migration of I/O-intensive containers may incur additional energy consumption due to data transfer over networks or disks. Moreover, I/O-intensive containers generally have a lower impact on the overall energy consumption of a data center. Consequently, achieving the same optimization objective may require migrating a larger number of I/O-intensive containers than CPU-intensive ones. Therefore, CPU intensity should be considered as one of the key factors in container selection.
The CPU intensity of container is calculated as shown in Equation (15):
When selecting containers for migration, key factors to consider are the container’s energy consumption, CPU intensity, migration cost, and SLAV value.
A SLAV is simulated as a complete container shutdown for a duration of t minutes, representing a period during which the container is unresponsive to user requests.
where and denote the total downtime duration and total observation time of container, respectively.
The SLAV for a single data center is calculated as shown in Equation (17):
To eliminate the impact of varying scales among different variables, we normalize all raw variables. For any raw variable , its normalized value is defined as:
where and represent the theoretical lower and upper bounds of the variable, respectively. This approach ensures the stability and consistency of the normalization process, preventing model performance fluctuations caused by new data points that fall outside the historical range.
The selection priority of containers is calculated as shown in Equation (19):
where and are the weights for power consumption and CPU intensity, respectively, representing the potential benefits of migration. Conversely, and denotes the weight of the SLAV and migration cost, representing the associated risks. For our baseline configuration, these weights are set to , , , . This specific assignment yields a scoring function that prioritizes containers with the highest benefit-to-risk ratio. By assigning a relatively high weight to , the algorithm is incentivized to target the most energy-intensive containers. Simultaneously, the significant weight on ensures that any container with a high risk of violating its service agreement is heavily penalized, thus being deprioritized.
This paper proposes a Dynamic Priority-Based Algorithm (DPA), whose main idea is to first predict future renewable energy availability based on historical renewable energy data from various data centers that are overloaded in terms of renewable energy, and then use the predicted values to determine the migration target. Subsequently, containers in the overloaded data centers are sorted in descending order of their priority. Containers are then selected sequentially until the migration target () is satisfied.
The pseudocode for the DPA is presented as follows (Algorithm 1):
| Algorithm 1. DPA Container Selection | |
| Input: DC—Data center for container migration | |
| X—Today’s renewable energy collection | |
| H—Day-ahead renewable energy collection | |
| Output: CList- List of containers for migration | |
| 1: | CList = empty list |
| 2: | calculate using Equation (13) |
| 3: | |
| 4: | if do |
| 5: | return CList |
| 6: | end if |
| 7: | while DC is overutilized do |
| 8: | = 0 |
| 9: | C = null |
| 10: | for each container in DC do |
| 11: | calculate using Equation (5) |
| 12: | calculate using Equation (16) |
| 13: | calculate using Equation (8) |
| 14: | calculate using Equation (15) |
| 15: | calculate using Equation (19) |
| 16: | if do |
| 17: | |
| 18: | C = container |
| 19: | end if |
| 20: | end for |
| 21: | add C to CList |
| 22: | remove C from DC |
| 23: | end while |
| 24: | return CList |
4.2. Multi-Factor Dream Optimization Algorithm (MF-DOA) for Container Placement
After the container selection algorithm identifies the containers for migration, the container placement algorithm is designed to place each container in its most suitable data center according to the defined optimization objectives.
This paper presents the MF-DOA, which is developed based on the original metaheuristic Dream Optimization Algorithm (DOA) [19]. The DOA is inspired by the human dreaming process, which exhibits characteristics such as partial retention of memory, forgetting, and logical self-organization, and resembles the optimization process in metaheuristic algorithms. It integrates the fundamental memory procedure, the forgetting and supplementation procedure to balance exploration and exploitation, and the dream sharing procedure to enhance escape from local optima.
Specifically, an individual in the dream represents a container placement plan. In this plan, each position corresponds to a container to be migrated, and its value indicates the destination data center.
The proposed MF-DOA introduces several key innovations compared to the original DOA:
- (1)
- Proposed a multiplicative penalty fitness function with non-linear power terms to prevent compensation effects and heavily penalize severe constraint violations, ensuring a baseline operational level for all data centers while balancing migration cost, carbon emissions, and SLAV.
- (2)
- Introduces a feasibility-guided dream sharing mechanism where individuals preferentially share solutions that satisfy capacity constraints.
- (3)
- Employs a five-tier hierarchical structure with different exploration strategies for each tier, enhancing convergence speed while maintaining diversity.
- (4)
- The forgetting rate dynamically adjusts based on the iteration progress and population diversity, preventing premature convergence in early stages and intensifying search in later stages.
Prior to executing the MF-DOA, several parameters must be initialized, including the population size (popSize), the maximum number of iterations (Tmax), the maximum number of iterations for the exploration phase (Td), and the proportion of the dream sharing procedure (u). During the initialization phase, a random population is generated within the search space to serve as the initial population.
In data center environments, since different data centers have varying available capacities at different times, not every randomly generated individual is feasible. Therefore, if a container cannot be placed on the target data center, its placement is abandoned, and the corresponding position in the individual is assigned a value of −1.
The pseudocode for population initialization is as follows (Algorithm 2):
| Algorithm 2. Population Initialization | |
| Input: DCList—List of data centers overloaded by renewable energy consumption | |
| CList—Containers to migrate list | |
| cSize—Amount of containers in CList | |
| popSize—Amount of individual in Population | |
| Output: population—Individual list | |
| 1: | population[popSize][cSize] = new array |
| 2: | for i = 0 to popSize-1 do |
| 3: | for j = 0 to CSize-1 do |
| 4: | if can migrate to random(DC) do |
| 5: | population[i][j] = random(DC) |
| 6: | else population[i][j] = −1 |
| 7: | end if |
| 8: | end for |
| 9: | end for |
| 10: | return population |
After population initialization, the algorithm enters the main loop, which iterates for several iterations. In each iteration, the algorithm evaluates all individuals to identify the best solution of the current population. The evaluation criteria include renewable energy utilization rate, load balancing, SLAV, migration cost, and carbon emissions.
The load balancing among multiple data centers is calculated as shown in Equation (20):
To effectively balance green energy utilization and system constraints, a fitness function with multiplicative penalty structure and non-linear power terms is proposed. The overall fitness of an individual is calculated as shown in Equation (21):
where denotes the load imbalance penalty exponent, denotes the data center constraint penalty exponent. Through systematic parameter sensitivity analysis, we evaluated the performance of the fitness function across 144 parameter combinations. The experimental design incorporated 10 representative scenarios, encompassing a comprehensive range of scheduling conditions from optimal to worst-case scenarios. A grid search was conducted for parameters and within the range [0.1, 4.0], wherein each parameter combination was utilized to rank the scenarios. Comprehensive scores were calculated based on the deviation between ranking results and ideal outcomes, as well as the degree of discrimination among superior scenarios. The results demonstrate that when = 2.5 and = 0.8, the fitness function effectively distinguishes between superior and inferior solutions, with a tenfold separation in fitness values between optimal and worst-case scenarios. This finding validates that the identified parameter combination can proficiently guide the algorithm toward correct scheduling decisions. The Heatmap of Parameter Sensitivity Analysis for the Fitness Function is presented in Figure 3.
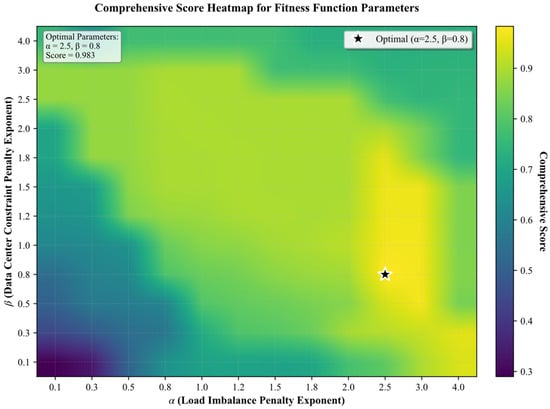
Figure 3.
The Heatmap of Parameter Sensitivity Analysis for the Fitness Function.
In contrast to traditional weighted-sum approaches, this multiplicative formulation inherently prevents the compensation effect, where performance in one data center could offset deficiencies in another, thereby guaranteeing a baseline operational level for all. Furthermore, the non-linear power terms model the escalating marginal cost of constraint violations, ensuring that severe breaches are penalized more heavily than minor ones.
The pseudocode for individual evaluation is as follows (Algorithm 3):
| Algorithm 3. Individual Evaluation | |
| Input: individual—Individual array | |
| DCList—Data Center List | |
| CList—Container List | |
| Indsize—Individual size | |
| Output: fitness—Individual fitness | |
| 1: | for i = 0 to Indsize-1 do |
| 2: | Migrate CList[i] to DCList[individual[i]] |
| 3: | end for |
| 4: | calculate using Equation (21) |
| 5: | for i = 0 to Indsize-1 do |
| 6: | Remove CList[i] from DCList[individual[i]] |
| 7: | end for |
| 8: | return fitness |
After evaluating the fitness of all individuals, the population is evenly divided into five groups, and the best individual in each group is retained as an elite for the subsequent exploration and development phases.
MF-DOA first performs iterations of the exploration phase. During this phase, the five groups of individuals are updated separately to maintain population diversity. Each iteration of the exploration phase is regarded as a dreaming process. Before dreaming, each individual stores the positional information of the best individual in its group and resets its own data according to that individual. During dreaming, individuals randomly select a subset of their data for adjustment. The selected data may either be forgotten or shared with the dreams of other individuals. If the forgetting operation is applied, the selected data is replaced with random values. In the dream sharing operation, the selected dimension of the current individual is replaced by the corresponding dimension value from a randomly selected individual within the same group, facilitating information exchange and maintaining population diversity.
The number of dimensions to be forgotten in the forgetting phase is calculated as shown in Equations (22)–(24):
where denotes the current iteration number, denotes the total number of iterations, denotes the value of the dimension for an individual, and denotes the current group index of the individual, enables dynamic balance between exploration and exploitation throughout the optimization process. This approach prevents premature convergence in early stages while intensifying local search in later stages. The selection between forgetting and dream sharing operations is governed by the dream-sharing operation portion parameter, denotes as .
To determine the optimal value of the proportion parameter for the forgetting and replenishment strategy versus the dream sharing strategy in the MF-DOA, the parameter was systematically varied from 0.0 to 1.0 with an increment of 0.05. For each value, 10 independent experimental trials were performed, and the mean values were calculated to mitigate random errors. An optimal parameter setting should not only yield a high mean fitness but also demonstrate robustness against stochastic variations. To assess this robustness, we quantified the consistency of the solution quality by first calculating the variance σ2 of the fitness values across the 10 trials. For better interpretability and to create a normalized score where a higher value indicates greater stability, we defined the Stability Index as shown in Equations (25) and (26):
where denotes the number of trials. The experimental results are presented in Figure 4.
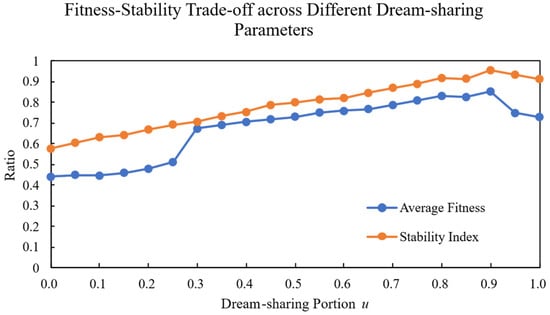
Figure 4.
Fitness–stability trade-off across different dream-sharing parameters.
Experimental results demonstrate that the optimal value for the MF-DOA is 0.90, achieving an average fitness of 85.2%. When is set too low, the dream sharing strategy dominates, leading to local optima convergence. Conversely, when is excessively high, the aggressive forgetting supplementation strategy compromises algorithmic stability. The optimal range of values between 0.85–0.95 effectively balances exploration and exploitation, enabling the algorithm to escape local optima while maintaining stable convergence performance. In practice, we recommend setting to 0.90 for the MF-DOA, with minor adjustments as needed for different scenarios.
After the exploration phase, the development phase is executed. In this phase, all individuals apply the memory procedure to reset their data according to the globally best individual and randomly replace a subset of their data with random values to further explore the search space.
The pseudocode for the main loop is as follows (Algorithm 4):
| Algorithm 4. MF-DOA Container Placement | |
| Input: population—Population array | |
| Tmax—Total number of iterations | |
| Td—Explore rounds | |
| u—Dream-sharing operation portion | |
| patience—Early stopping patience | |
| Output: bestindividual—Best Individual | |
| 1: | Population Initialization using Algorithm 2 |
| 2: | for t from 0 to Tmax do |
| 3: | for each individual in population do |
| 4: | Calculate group index |
| 5: | Individual Evaluation using Algorithm 3 |
| 6: | Update group best and global best if improved |
| 7: | end for |
| 8: | if t < Td do |
| 9: | for each group in groups do |
| 10: | Calculate forgetDims using Equation (22) |
| 11: | for each individual in group do |
| 12: | copy group best individual |
| 13: | Select random dimensions |
| 14: | for each dim in dimension do |
| 15: | if random() < u do |
| 16: | Individual[dim] = random() |
| 17: | else do |
| 18: | Individual[dim] = value shared from random individual |
| 19: | end if |
| 20: | end for |
| 21: | Update bestindividual if improved |
| 22: | end for |
| 23: | else do |
| 24: | calculate forgetDims |
| 25: | for each individual in population do |
| 26: | copy bestindividual |
| 27: | Select random dimensions |
| 28: | for each dim in dimension do |
| 29: | if random() < u do |
| 30: | Individual[dim] = random value |
| 31: | end if |
| 32: | end for |
| 33: | Update bestindividual best if improved |
| 34: | end for |
| 35: | end if |
| 36: | if not improved for patience times do |
| 37: | break |
| 38: | end if |
| 39: | end for |
| 40: | return bestindividual |
The best individual returned by the MF-DOA container placement algorithm corresponds to the optimal container placement plan, according to which containers are allocated to their respective target data centers.
The computational complexity of the proposed MF-DOA is analyzed as follows:
- Initialization Phase: The algorithm initializes a population of individuals. For each of the containers in an individual, a feasibility check is performed against a randomly selected data center from . This results in a time complexity of .
- Per-Iteration Cost: The computational cost within each generation of the main loop consists of two primary parts:
- ○
- Fitness Evaluation: Evaluating a single individual, which includes migration simulation and fitness calculation, has a complexity of . For the entire population, this amounts to .
- ○
- Individual Updates: In both the exploration and development phases, updating an individual involves modifying dimensions. This operation for the entire population has a complexity of .
- Overall Time Complexity: The total cost per iteration is the sum of the evaluation and update costs: . Since the algorithm runs for a maximum of iterations, the overall time complexity is . It is noteworthy that is a dynamic parameter that decreases over time, and the algorithm incorporates an early stopping mechanism. Consequently, the practical computational cost is often significantly lower than this theoretical worst-case bound. The space complexity is for population storage.
To validate MF-DOA for cloud resource scheduling, we compared it with three metaheuristics—standard DOA, Particle Swarm Optimization (PSO) and Firefly Algorithm (FF)—across small (10 containers, 20 DCs), medium (50 containers, 50 DCs), and large (100 containers, 100 DCs) problem instances. All algorithms used a population of 50 for a maximum of 25 iterations, with each run repeated 30 times to ensure statistical significance. Performance was evaluated with metrics including average fitness, standard deviation, best fitness, execution time, and convergence iterations. The detailed results for average fitness, standard deviation, best fitness, and convergence iterations are presented in Table 2.
Table 2.
Algorithm Performance Metrics Analysis for Different Problem Scales.
The results in Table 2 demonstrate the performance characteristics of each algorithm across different scales. At the small scale, it achieved convergence in 0 iterations (avg. fitness: 0.001175). At the medium scale, it maintained a competitive average fitness (0.000878) with a low standard deviation (0.000059). At the large scale, MF-DOA recorded the lowest standard deviation (0.000027) among all algorithms, while also achieving a better average fitness (0.000776) than most competitors and a convergence speed of 13.8 iterations. In comparison, standard DOA was susceptible to local optima (best fitness: 0.000876), PSO showed slower convergence (21.1 iterations) and FF exhibited instability (std. dev.: 0.000167). These findings indicate that MF-DOA’s multi-strategy mechanism provides an effective balance between solution quality, convergence speed, and stability, suggesting its applicability to large-scale cloud resource allocation.
5. Experimental Results
Multi-data center container migration simulation experiments are conducted using the CloudSim simulator. Five major data centers of Amazon Web Services (AWS), located across five U.S. states—California, Texas, Virginia, Ohio, and Oregon—are selected for the experiments. Detailed information on the states hosting the simulated data centers, along with the sources of renewable energy data, is presented in Table 3:
Table 3.
Renewable energy supply data source by state.
After obtaining the data, it is converted into the amount of renewable energy generated every five minutes, as shown in Figure 5. where each time node corresponds to a five-minute interval.
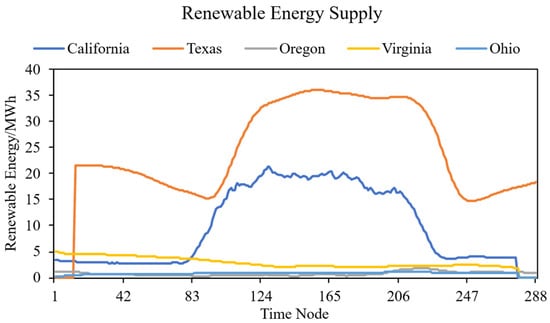
Figure 5.
Trend chart of new single-day renewable energy output in the five main locations of AWS data centers.
In this study, we incorporate the dynamic carbon emissions of the electrical grid to enhance the realism of our model. Traditional approaches often rely on static, annual average emission factors, which fail to capture the significant temporal variations in grid carbon intensity. To address this limitation, we utilize with a fine-grained temporal resolution.
The carbon emission factors were derived from the U.S. Environmental Protection Agency’s (EPA) Clean Air Markets Program Data (CAMPD) dataset [24], which provides comprehensive carbon emission data for various states in the United States. The calculation process involved two steps. First, for each state, we computed the instantaneous carbon intensity for every five-minute interval by dividing the total carbon emissions by the corresponding energy generation during that period. Second, these calculated, time-stamped carbon emission factors were used as a direct input in our simulation experiments. This allows the model to calculate the instantaneous carbon emission rate based on the actual carbon intensity of the grid at any given moment, leading to a more accurate and environmentally conscious evaluation.
The datasets for cloud tasks are obtained from the cluster workload datasets of Google and Alibaba. The Google Cluster Workload Traces 2019 [25] include workload traces from eight Borg computer clusters up to May 2019, recording each job submission, scheduling decision, and the resource usage of jobs running on these clusters. The dataset provides resource usage data aggregated over five-minute intervals. The Alibaba Cluster Trace v2018 [26] contains workload data from approximately 4000 machines over an eight-day period, covering a mix of online services and batch processing tasks. It includes the resource usage of machines and containers, among other metrics, with timestamps in seconds from the start of the sampling cycle, and all values normalized to the range [0, 100]. Both datasets are converted into corresponding resource utilization rates for use in the simulation experiments.
Experiments are conducted using the algorithms provided by CloudSim, as well as algorithms from previous studies, to evaluate the effectiveness of the proposed methods via comparative experiments. The container selection algorithms used for comparison include the Maximum Correlation (MC) algorithm, the Minimum Utilization (MU) algorithm, and the Minimum Migration Time (MMT) algorithm. The container placement algorithms used for comparison include the Minimum Energy Difference (MED) algorithm, the Quantum Particle Swarm Optimization placement (QPSO-MOVMP) algorithm [27], and the Multi-Objective Group Intelligence Algorithm (MO-KASIA) [28].
To perform a thorough evaluation, we adopt a full factorial design where each of the four selection algorithms (including our proposed DPA) is combined with each of the four placement algorithms. This results in a total of 16 distinct migration schemes, allowing for a comprehensive analysis of the performance of each algorithmic component and their synergistic effects.
The experimental environment consists of five data centers, each containing 100 hosts, with a total of 1000 cloud tasks. Figure 6 presents the simulation results of renewable energy generation and energy consumption for the data center located in Oregon, where the x-axis represents time nodes corresponding to five-minute intervals:
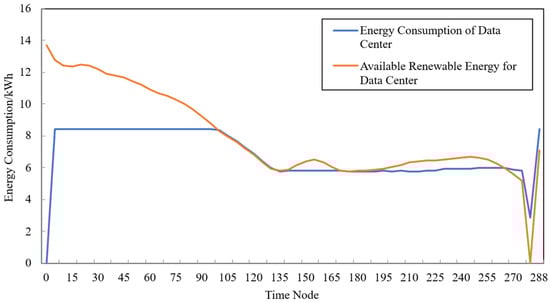
Figure 6.
Trend chart of simulated energy consumption and renewable energy output for the data center in Oregon.
As shown in Figure 6, when the renewable energy output decreases, the data center migrates its containers to other data centers; conversely, when the renewable energy output increases, containers are migrated back. This behavior demonstrates that the proposed strategy can effectively improve the utilization of renewable energy through container migration.
The comparative experimental results between the proposed algorithm and the other algorithms are presented as follows.
Based on the experimental results, the proposed renewable-energy-aware container migration strategy—comprising the DPA and MF-DOA—demonstrates consistently superior performance on both the Google and Alibaba datasets. This superiority is reflected in the detailed simulation results, which validate the effectiveness of our approach across both datasets.
On the Google dataset (Figure 7, Figure 8, Figure 9, Figure 10 and Figure 11), the MF-DOA placement algorithm consistently achieved the highest renewable energy utilization rate (ranging from 89.17% to 89.22%, Figure 7) and the lowest carbon emissions (approximately 1232.26 kg CO2 to 1237.45 kg CO2, Figure 8) across all tested container selection policies. This striking performance underscores the significant advantage of MF-DOA in terms of multi-data center resource integration and renewable energy preference. Furthermore, the DPA selection strategy effectively reduced the number of migrations when combined with most placement algorithms, yielding a 7.2% to 16.2% reduction in migration count (Figure 9), with the exception of the combination with the MED algorithm, where the effect was marginal. The proposed MF-DOA + DPA combination, while not achieving the absolute highest renewable energy utilization or lowest carbon emissions, demonstrated a superior trade-off in migration count and SLAV. Specifically, compared to MF-DOA + MMT, the migration count was reduced by 16.3% (607 vs. 508, Figure 9), and the SLAV was reduced by 12.4% (from 29.1% to 25.5%, Figure 10). Although the aggressive green strategy of MF-DOA resulted in slightly higher overall energy consumption (9595.58 kWh, Figure 11) compared to the energy-optimal QPSO-MOVMP + MMT algorithm (9585.42 kWh, Figure 11), this difference remains within an acceptable range for practical deployment.
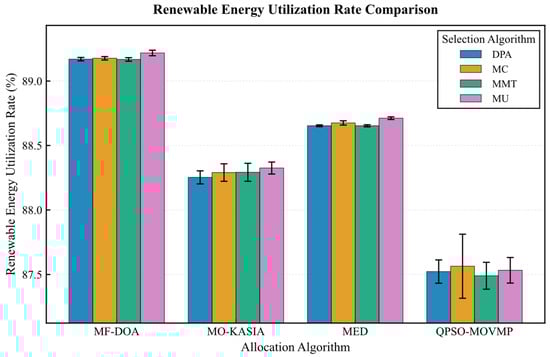
Figure 7.
Google dataset: renewable energy utilization rate comparison.
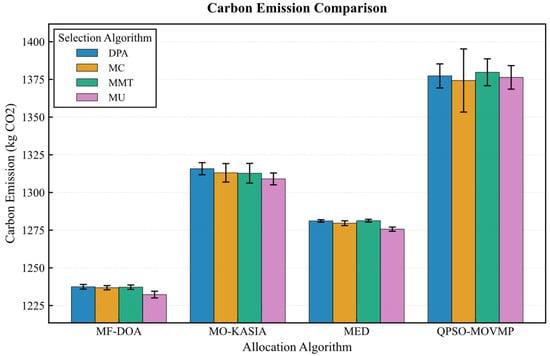
Figure 8.
Google dataset: carbon emission comparison.
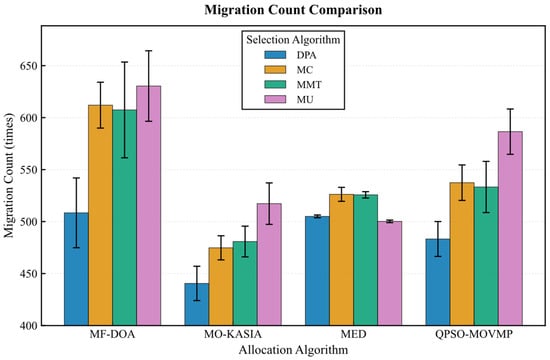
Figure 9.
Google dataset: migration count comparison.
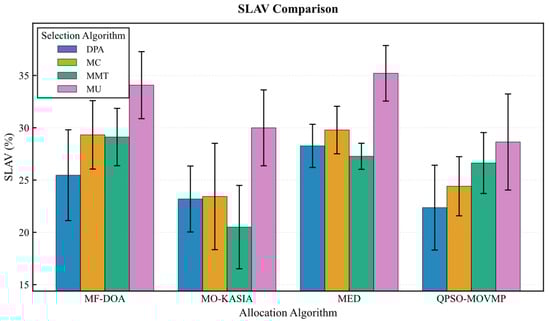
Figure 10.
Google dataset: SLAV comparison.
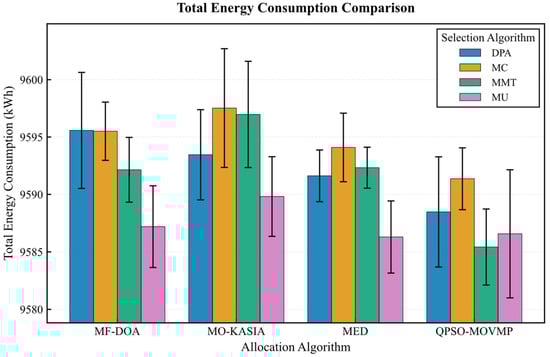
Figure 11.
Google dataset: energy consumption comparison.
The results from the Alibaba dataset further corroborate the absolute advantage of the MF-DOA placement algorithm concerning green objectives (Figure 12, Figure 13, Figure 14, Figure 15 and Figure 16). Regardless of the container selection strategy employed, the MF-DOA combinations consistently maintained the highest renewable energy utilization rate (approximately 92.05% to 92.08%, Figure 12) and the lowest carbon emissions (approximately 923.41 kg CO2 to 929.06 kg CO2, Figure 13). Within each placement algorithm group, the DPA nearly always achieved the shortest migration time. For instance, within the MF-DOA group, the migration count of DPA (817) was substantially lower than that of MC (932) and MU (967) (Figure 14). The proposed MF-DOA + DPA combination presented a highly balanced and green-focused solution. With a renewable energy utilization rate only 0.02% lower than the MF-DOA + MMT combination, it achieved lower SLAV (31.6% vs. 32.3%, Figure 15), lower energy consumption (8962.54 kWh vs. 8964.70 kWh, Figure 16), and a 13.9% reduction in the number of migrations (817 vs. 949, Figure 14). This clearly demonstrates DPA’s capability to effectively reduce unnecessary migrations through predictive mechanisms, thus establishing MF-DOA + DPA as an excellent, well-balanced solution prioritizing green objectives.
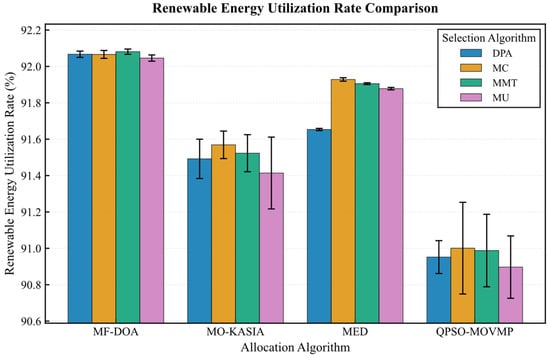
Figure 12.
Alibaba dataset: renewable energy utilization rate comparison.
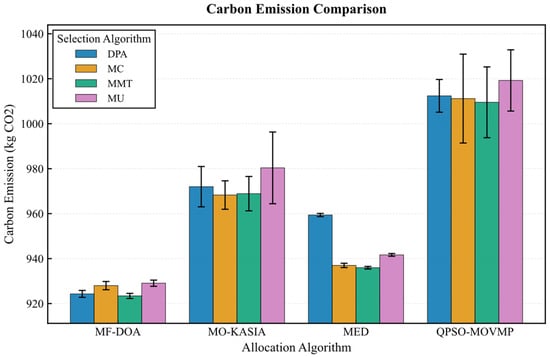
Figure 13.
Alibaba dataset: carbon emission comparison.
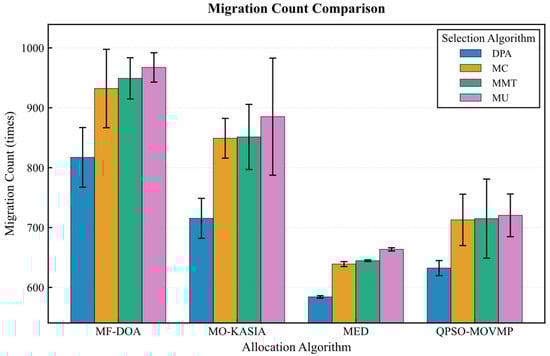
Figure 14.
Alibaba dataset: migration count comparison.
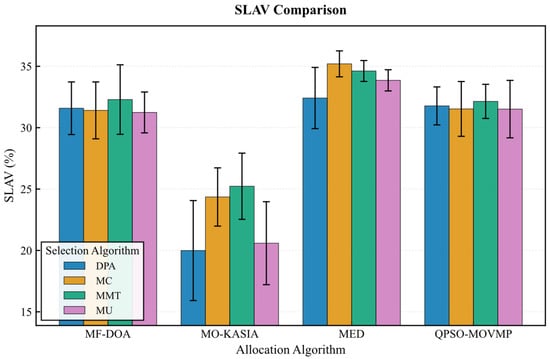
Figure 15.
Alibaba dataset: SLAV comparison.
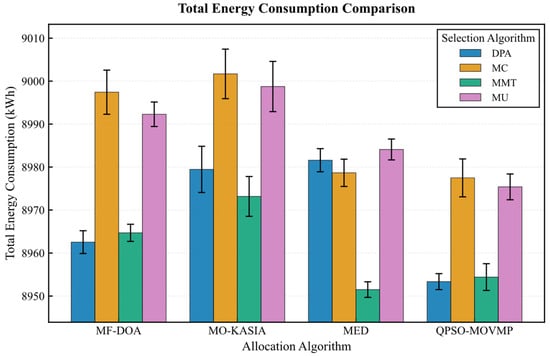
Figure 16.
Alibaba dataset: energy consumption comparison.
The balanced optimization across all five objectives—renewable energy utilization, power efficiency, load balance, carbon emission and SLAV—demonstrates that MF-DOA effectively addresses the intricate the multi-factor single-objective optimization landscape. By consistently leveraging the synergistic strengths of the MF-DOA allocation strategy and the DPA selection mechanism, the proposed method delivers competitive and practical solutions for real-world cloud environments.
6. Conclusions
This study addressed the critical challenge of maximizing renewable energy utilization across geographically distributed data centers by proposing a novel, two-stage container migration strategy. Our strategy, which integrates the Dynamic Priority-Based Algorithm (DPA) and the multi-factor single-objective container placement algorithm based on the Dream Optimization Algorithm (MF-DOA), has been demonstrated to be a highly effective solution.
In the container selection phase, DPA considers container characteristics and renewable energy availability trends to identify migration candidates from energy-deficient data centers. This approach effectively reduces the number of container migrations and SLAV compared with baseline selection algorithms, while maintaining comparable performance in terms of total energy consumption and renewable energy utilization rate.
In the placement phase, MF-DOA simultaneously optimizes load balancing, renewable energy utilization, carbon emissions, SLAV, and migration costs. Compared with other placement algorithms, MF-DOA achieves significantly lower total energy consumption and a higher renewable energy utilization rate, thereby meeting the objectives of renewable energy adoption and energy saving.
Overall, the integration of DPA and MF-DOA outperforms the compared approaches in achieving energy efficiency and renewable energy utilization goals, while mitigating migration overhead and SLAV.
Despite these promising results, our study has several limitations. The experiments were conducted in a simulated environment, which may not fully capture the complexities and unpredictability of real-world network conditions and workload fluctuations. Furthermore, the computational overhead of the MF-DOA, while acceptable, could become a bottleneck for systems with an extremely large number of containers. Future work will focus on addressing these limitations.
In conclusion, the migration-based strategy presented in this paper offers a practical and efficient pathway for data centers to enhance their sustainability. By intelligently orchestrating container workloads, it is possible to significantly reduce the carbon footprint of cloud computing infrastructure while maintaining high service quality.
Author Contributions
Conceptualization, X.F.; methodology, Z.M. and X.S.; software, G.C.; validation, Z.M.; formal analysis, Z.M.; investigation, Z.M. and X.S.; resources, J.Q.; data curation, X.S.; writing—original draft preparation, Z.M.; writing—review and editing, X.F.; visualization, G.C.; supervision, X.F.; project administration, J.Q.; funding acquisition, J.Q. All authors have read and agreed to the published version of the manuscript.
Funding
Suzhou Key Core Technology ‘open competition mechanism for selecting the best candidates’ Project: SYG2024109.
Data Availability Statement
Dataset available on request from the authors.
Acknowledgments
The authors are grateful to the anonymous reviewers for their insightful comments and valuable suggestions.
Conflicts of Interest
Author Ji Qi was employed by the company China Mobile (Suzhou) Software Technology Co., Ltd. The remaining authors declare that the research was conducted in the absence of any commercial or financial relationships that could be construed as a potential conflict of interest.
References
- China Academy of Information and Communications (CAICT). China Green Computing Power Development Research Report 2025. Available online: https://www.caict.ac.cn/kxyj/qwfb/ztbg/202507/t20250724_686833.htm (accessed on 24 July 2025).
- International Energy Agency (IEA). Energy and AI. Available online: https://www.iea.org/reports/energy-and-ai (accessed on 24 July 2025).
- China National Data Administration. East Data West Calculation’ Project Makes Positive Progress. Available online: http://finance.people.com.cn/n1/2024/0722/c1004-40282879.html (accessed on 22 July 2024).
- Song, J.; Zhu, P.; Zhang, Y.; Yu, G. CloudSimPer: Simulating Geo-Distributed Datacenters Powered by Renewable Energy Mix. IEEE Trans. Parallel Distrib. Syst. 2024, 35, 531–547. [Google Scholar] [CrossRef]
- Bhardwaj, A.; Krishna, C.R. Virtualization in Cloud Computing: Moving from Hypervisor to Containerization—A Survey. Arab. J. Sci. Eng. 2021, 46, 8585–8601. [Google Scholar] [CrossRef]
- Katal, A.; Dahiya, S.; Choudhury, T. Energy Efficiency in Cloud Computing Data Centers: A Survey on Software Technologies. Clust. Comput. 2023, 26, 1845–1875. [Google Scholar] [CrossRef] [PubMed]
- Yade, L.; Gueye, A.D. Remote Practical Work Environment Based on Containers to Replace Virtual Machines. In Proceedings of the 2022 IEEE Global Engineering Education Conference (EDUCON), Tunis, Tunisia, 28–31 March 2022; pp. 1285–1290. [Google Scholar] [CrossRef]
- Lohumi, Y.; Srivastava, P.; Gangodkar, D.; Tripathi, V. Recent Trends, Issues and Challenges in Container and VM Migration. In Proceedings of the 2023 International Conference on Computer Science and Emerging Technologies, Bangalore, India, 10–12 October 2023; pp. 1–5. [Google Scholar] [CrossRef]
- Radovanović, A.; Koningstein, R.; Schneider, I.; Chen, B.; Duarte, A.; Roy, B.; Xiao, D.; Haridasan, M.; Hung, P.; Care, N.; et al. Carbon-Aware Computing for Datacenters. IEEE Trans. Power Syst. 2022, 38, 1270–1280. [Google Scholar] [CrossRef]
- Wu, G.; Li, X.; Li, C. A Load Balancing-Based Container Migration Mechanism in the Smart Grid Cloud Platform. In Proceedings of the 2024 9th International Conference on Computer and Communication Systems (ICCCS), Xi’an, China, 19–22 April 2024; pp. 1100–1104. [Google Scholar] [CrossRef]
- Jing, Y.; Shen, L.; Yao, C.; Fan, F.; Wang, X. HLEM-VMP: An Effective Virtual Machine Placement Algorithm for Minimizing SLA Violations in Cloud Data Centers. IEEE Syst. J. 2024, 18, 1963–1974. [Google Scholar] [CrossRef]
- Wang, J.; Yu, J.; Zhai, R.; He, X.; Song, Y. GMPR: A Two-Phase Heuristic Algorithm for Virtual Machine Placement in Large-Scale Cloud Data Centers. IEEE Syst. J. 2023, 17, 1419–1430. [Google Scholar] [CrossRef]
- Li, J.; Dong, J.; Li, F.; Xu, H. Reinforcement Learning Based Container Placement Strategies. In Proceedings of the 4th International Conference on Electronic Information Engineering and Computer, Shenzhen, China, 15–17 November 2024; pp. 170–174. [Google Scholar] [CrossRef]
- Yang, Z.; Islam, M.T.; Harwood, A. A Unified Approach to Virtual Machine Placement and Migration in the Cloud using Deep Reinforcement Learning. In Proceedings of the IEEE/ACM 17th International Conference on Utility and Cloud Computing, Sharjah, United Arab Emirates, 16–19 December 2024; pp. 148–157. [Google Scholar] [CrossRef]
- D’Souza, M.; Sreenivasa, B.L.; Nagalavi, D.; Khan, S.A.; Sathyanarayana, S.; Dhaaraani, R. Optimized Virtual Machine Scheduling for Green Cloud Computing Using MLP-LSTM with Sheep Flock Optimization. In Proceedings of the International Conference on Communication, Control, and Intelligent Systems, Mathura, India, 6–7 December 2024; pp. 1–6. [Google Scholar] [CrossRef]
- Durgaprasad, S.; Abdul, A.M. Multi-objective data migration in container-based heterogeneous cloud environments using deep adaptive dragonfly optimization. Int. J. Inf. Technol. 2025, 17, 3579–3588. [Google Scholar] [CrossRef]
- Li, J.; Zhou, Z.; Zhao, D.; Shi, Z.; Meng, L.; Gaaloul, W. Energy-Aware Service Migration in End-Edge-Cloud Collaborative Networks. In Proceedings of the 2024 IEEE International Conference on Web Services (ICWS), Shenzhen, China, 7–13 July 2024; pp. 974–979. [Google Scholar] [CrossRef]
- Feng, H.; Li, H.; Liu, Y.; Cao, K.; Zhou, X. A novel virtual machine placement algorithm based on grey wolf optimization. J. Cloud Comput. 2025, 14, 7. [Google Scholar] [CrossRef]
- Lang, Y.; Gao, Y. Dream Optimization Algorithm (DOA): A novel metaheuristic optimization algorithm inspired by human dreams and its applications to real-world engineering problems. Comput. Methods Appl. Mech. Eng. 2025, 436, 117718. [Google Scholar] [CrossRef]
- California ISO. Today’s Outlook—Renewables Trend. Available online: https://www.caiso.com/library/daily-renewable-reports (accessed on 24 July 2025).
- U.S. Energy Information Administration. Hourly Electric Grid Monitor. Available online: https://www.eia.gov/electricity/gridmonitor/dashboard/electric_overview/regional/REG-TEX (accessed on 24 July 2025).
- PJM Interconnection. Wind Gen. Available online: https://dataminer2.pjm.com/feed/wind_gen/definition (accessed on 24 July 2025).
- Bonneville Power Administration. Wind Generation & Total Load in the BPA Balancing Authority. Available online: https://transmission.bpa.gov/business/operations/wind/twndbspt.aspx (accessed on 24 July 2025).
- U.S. Environmental Protection Agency. Clean Air Markets Program Data. Available online: https://campd.epa.gov/data/custom-data-download (accessed on 27 October 2025).
- Google Research. ClusterData2019. Available online: https://github.com/google/cluster-data (accessed on 24 July 2025).
- Alibaba Group. Cluster-Trace-v2018. Available online: https://github.com/alibaba/clusterdata (accessed on 24 July 2025).
- Elsedimy, E.I.; Herajy, M.; Abohashish, S.M.M. Energy and QoS-aware virtual machine placement approach for IaaS cloud datacenter. Neural Comput. Appl. 2025, 37, 2211–2237. [Google Scholar] [CrossRef]
- Maldonado Carrascosa, F.J.; Seddiki, D.; Jiménez Sánchez, A.; Galán, S.G.; Ibáñez, M.V.; Marchewka, A. Multi-objective optimization of virtual machine migration among cloud data centers. Soft Comput. 2024, 28, 12043–12060. [Google Scholar] [CrossRef]


Disclaimer/Publisher’s Note: The statements, opinions and data contained in all publications are solely those of the individual author(s) and contributor(s) and not of MDPI and/or the editor(s). MDPI and/or the editor(s) disclaim responsibility for any injury to people or property resulting from any ideas, methods, instructions or products referred to in the content. |
© 2025 by the authors. Licensee MDPI, Basel, Switzerland. This article is an open access article distributed under the terms and conditions of the Creative Commons Attribution (CC BY) license (https://creativecommons.org/licenses/by/4.0/).