Abstract
An integrated ESP32-based measurement system called PV-Scope is presented for real-time photovoltaic (PV) module efficiency characterization and small off-grid system testing under field conditions. The system includes pyranometer-calibrated irradiance sensors using a solar simulator, maximum power point tracking, and comprehensive environmental monitoring to enable accurate performance assessment of PV modules across diverse technologies, manufacturers and installation conditions. Unlike standard test condition (STC) measurements at cell temperatures of 25 °C, this system captures the interactions between efficiency and environmental variables that significantly impact real-world efficiency. In particular, measurement of temperature-dependent efficiency under local conditions and validation of temperature-dependent models for extending the results to other environmental conditions are enabled with cell temperature monitoring in addition to ambient temperature, humidity, and wind speed. PV-Scope is designed for integrated sensing versatility, portable outdoor testing, and order-of-magnitude cost savings compared to commercial equipment to meet measurement needs across research, education, and practical PV innovation, including bifacial module testing, assessment of cooling techniques, tandem and multi-junction testing, and agrivoltaics.
1. Introduction
While decades of research have gone into improving the efficiency of photovoltaic (PV) cells and modules, the loss in efficiency when operating at higher temperatures than the reported efficiency under standard test conditions (STC) is equivalent to wiping out decades of efficiency improvements. STC for photovoltaic modules require 1000 W/m2 irradiance, 25 °C cell temperature, and a reference solar spectrum (AM1.5G). Neither the STC temperature nor irradiance is representative of average values for real-world operating conditions, but instead represent “peak” efficiency conditions. The temperature coefficient of efficiency results in efficiency reductions of 0.3–0.5% per degree Celsius above 25 °C for crystalline silicon modules and other PV technologies [1]. The mounting type also impacts the temperature [2,3]. Studies show efficiency decreases of 3.8–6.5% due to mounting-related temperature increases of 10–15 °C [4]. Additionally, irradiance variations, humidity levels, and wind conditions significantly impact the cell operating temperature and thus efficiency, as noted in [5], and are important to measure during outdoor testing.
Recent work [6] using nine years of weather data for three locations has shown that annual temperature variations produce significant seasonal efficiency reductions during the hottest months, and the average may be reduced by 3% relative to STC for hotter climates. Basic temperature models include wind speed, operating temperature relative to ambient temperature, and plane of array (POA) irradiance [7]. A model such as the Faiman model [8] or Sandia model [4] is used to estimate the PV cell operating temperature based on weather data that may not reflect the module’s microclimate conditions. Electrical, thermal, and optical module characteristics are discussed in [4].
Energy rating requires a matrix of measurements over a range of irradiances from 100 to 1100 W/m2 and module temperatures from 15 °C to 75 °C, as described in the IEC 61853 [9], reflecting real-world operating conditions. Specific values for laboratory testing of irradiance are 100, 200, 400, 600, 800, 1000, and 1100 W/m2, and specific module temperatures are 15, 25, 50, and 75 °C. The efficacy of different models to calculate the module power over the range of expected operating conditions is an active research topic. Example models include the six-parameter single-diode model proposed by Dobos et al. [10] and a nonparametric, data-driven model by Blailif et al. [11].
For module efficiency, it is important to measure the irradiance in the plane of array (POA) of the module. A more generic measurement is global tilt irradiance (GTI), whereby the irradiance is measured for any tilt angle, not just for the PV module’s tilt. The POA irradiance is different from global horizontal irradiance (GHI) that is typically reported with weather datasets. The direct normal irradiance (DNI) from the sun that is detected by the module will depend on the sun’s position relative to the modules’ elevation, or tilt, and azimuth of the module’s surface normal. The diffuse irradiance detected by a tilted module is expected to differ from that detected by a horizontal surface as well. Thus, it is important to measure the POA irradiance directly.
Given that ambient temperature and mounting conditions can drastically change the expected efficiency for PV modules relative to measurements at STC, the evaluation of PV module efficiency and comparisons to model efficiency predictions are critical. The aim of this work was to demonstrate an open-source hardware solution for characterizing the critical parameters so that the module performance can be tested and simulated over a range of conditions and mounting deployments. Many techniques have been proposed to cool PV modules and thereby increase their operating efficiency. The PV-Scope test system will measure the efficacy of these techniques over a range of environmental conditions under field conditions. The test system is also helpful for education purposes to demonstrate the factors involved in PV module efficiency.
Prior work on low-cost PV monitoring systems includes the use of the Arduino platform and data logging to a local SD card [12,13] and Internet of Things (IoT) web-based data logging [14,15]. An IoT-based system using an ESP32 microprocessor has also been demonstrated [16]. Overall, many data acquisition and monitoring systems for PV panels and arrays have been demonstrated with various wireless communication technologies [17], but they are typically focused on remote system monitoring. In this work, we focus on multi-sensor integration for an adaptive monitoring system that can capture transient behavior and calibration techniques for increasing the number of sensors, particularly for irradiance, with minimal added cost.
2. Measurement System Design
The required system functionality is measuring the incoming solar irradiance, the outgoing electrical maximum power from the PV module under test, and the critical environmental parameters, including temperature and wind speed. The system should enable data logging and analysis via software running on a laptop computer. The goal is to design a modular, compact, and relatively low-cost system that is easy to program and whose functionality can be extended for different needs in research, development, and education. Figure 1a illustrates the test system components and interconnections. Our main configuration uses a solar controller for MPP tracking and an external power sensor to evaluate the PV module, battery, and load separately. The second configuration replaces the solar controller, battery, and load with an IV curve tracer to measure the maximum power. The range of the module under test powers impacts the system components. Our system demonstration is for 100 W modules, while the design goal is to enable testing up to 400 W modules.
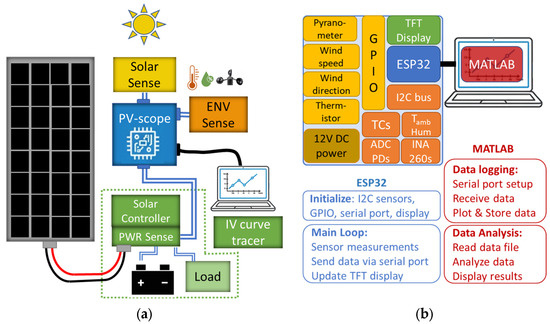
Figure 1.
(a) Measurement system consisting of a PV module under test, the PV-Scope unit, irradiance sensors (Solar Sense), environmental sensors (ENV Sense), and a solar controller integrated with power sensors (PWR Sense) or an IV curve tracer. (b) The ESP32 interfaces with measurement devices through the I2C bus and GPIO pins and via serial port with MATLAB. The main software processes are summarized for the ESP32 and MATLAB.
An open-source hardware (OSHW) approach was taken for system design to achieve substantially lower cost compared to more expensive commercial equipment. For research, education, and rapid prototyping, an OSHW approach offers greater flexibility and economy compared to relying primarily on commercial test equipment. The ESP32 microprocessor (manufactured by Espressif Systems Co., Ltd., Shanghai, China) was chosen for its low cost and ease of programming using the Arduino IDE. It features a dual-core processing (up to 240 MHz), 16 MB memory, integrated Wi-Fi and Bluetooth low energy (BLE), and standard communication interfaces (SPI and I2C) to support complex, real-time data acquisition and IoT scenarios at a price point that appears unmatched among comparable microcontrollers. The ESP32 distinguishes itself as a modern contender over older technologies such as the Arduino Uno and Mega. The value proposition is amplified further with modular “breakout” printed circuit boards (PCBs) from Adafruit with ready-to-use software examples using the Arduino IDE. MATLAB (version R2025a) by Mathworks, Inc. was used for interfacing over a serial port (USB or Bluetooth) to the ESP32.
The critical parameters for measuring PV module efficiency are the incoming solar irradiance detected by the module and the maximum output power of the module. We address these two aspects of the design first. Next, we summarize the environment-related measurements and then address the data acquisition and analysis aspects.
2.1. Irradiance Measurements
Pyranometers are designed to detect direct and diffuse solar irradiation over a 180 angular range. Pyranometers based on thermal sensors cover the largest wavelength range; however, they are relatively expensive compared to photodiode-based ones. For lower cost, we used a photodiode-based pyranometer as our reference standard.
The Apogee SP-212-SS is a silicon-cell pyranometer classified as ISO 9060:2018 [18] Class C (fast response) [19], designed for cost-effective solar irradiance measurements. Apogee SP-212-SS units were calibrated through side-by-side comparison with ISO-classified reference pyranometers under controlled laboratory conditions. The Apogee pyranometer incorporates a silicon photodiode detector with amplified voltage output and a domed housing, making it suitable for various outdoor monitoring applications. It has a calibration factor of 0.8 W/m2 per mV, a 180 field of view, a 1 ms response time, and less than 3% uncertainty and 1% repeatability. The deviation from the cosine response is ±5% at a solar zenith angle of 75°. The cost is currently in the USD 330 range.
For our test system, an Apogee pyranometer is a good investment to support one or more PV-Scope test systems by using it as the calibration standard for custom-built silicon photodiode pyranometers assembled from off-the-shelf components, a custom PCB, and 3D-printed parts. As an example, the Vishay BPW46 and BPW34S provide a packaged silicon photodiode with a radiant-sensitive area of 7.5 mm2. The angular acceptance range at half sensitivity is ±65. The cosine dependence is within 0.1 on a relative sensitivity scale, as shown in Figure 2a, based on the datasheet. The error specification for the Apogee is also shown at 75.
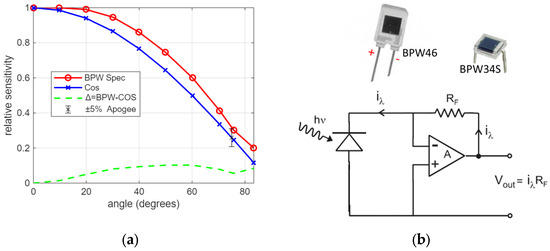
Figure 2.
(a) Vishay BPW photodiode relative angular sensitivity from the datasheet compared to a cosine response and their difference (Δ) as well as the Apogee spec at 75. (b) Transimpedance amplifier circuit with no bias voltage. Photodiodes from the Vishay BPW series for side-coupling and top-coupling.
A basic transimpedance amplifier (TIA) circuit with no reverse bias voltage is used as a preamplifier before the analog-to-digital converter (ADC) for sampling the amplified output voltage. An operational amplifier that works well is the MCP607, in a two-channel 8-DIP package with low input offset voltage (250 μV maximum), low-input-bias current (80 pA maximum) and a supply voltage range of 2.5 V to 6 V. The photocurrent is converted to an output voltage with gain proportional to the feedback resistance. For measuring peak solar irradiance (1000 W/m2) with a safety margin, we must keep the output voltage in the range of the ADC. Given the photodiode radiant-sensitivity area, a photocurrent estimate of = 4 mA results, assuming an average responsivity of 0.5 mA/mV for the solar spectrum. Therefore, we chose a feedback resistance of = 300 Ω, which would yield = 1.5 V at = 0.5 mA without a diffuser in the path. With a diffuser, we chose a larger resistance of = 900 Ω.
While the ESP32 offers multiple ADC inputs, a separate Adafruit breakout board for the ADS1115 is preferred. It provides 16-bit conversion on four single-ended inputs, or two differential inputs, and a programmable gain amplifier with six gain settings capable of measuring input voltages from ±0.256 V to ±6.144 V. The breakout board functionality includes a variable-gain amplifier and sampling rates from 8 sps to 860 sps that are software-controlled.
2.2. Maximum Power Measurements
Maximum power measurements for the PV module are critical. While the easiest points to measure with a multimeter are the open-circuit voltage and short-circuit current, neither point represents any power flow. Two methods for measuring the maximum power point (MPP) of the PV module under test were developed for the PV-Scope: (1) a custom IV curve tracer and (2) an MPP tracking (MPPT) solar controller with a custom external power monitoring circuit. Commercial IV-curve tracers are available, including less expensive handheld solar panel testers. Some low-cost IoT curve tracers have also been demonstrated [20,21,22]. Since we needed to incorporate the MPP measurement with the PV-Scope so that the data could be logged and analyzed in detail, a custom IV-curve tracer was designed.
A custom IV-curve tracer was designed using MOSFETs as variable resistance paths, attached to a small load resistor for when the MOSFET is fully “on.” Parallel MOSFETs are used to divide the current so that PV module powers up to 400 W are safely handled. A thermistor is used to monitor the MOSFET temperature to identify any overheating condition as early as possible.
While measuring the maximum power point by sweeping the IV curve yields the desired information, considerable time is spent at non-optimum operating points that can impact the operating temperature of the module and does not mimic actual use. A solar controller attached to a battery and/or load may be used to approximate operating conditions more closely by operating continuously near the maximum power point (MPP). The Victron MPPT solar controller 75/15 that handles up to 75 V and 15 A was chosen. It has three external circuit connections: (1) from the PV module, (2) to/from the battery, and (3) to the load. The solar controller performs MPPT for the PV module and handles battery charging for different battery types and load cutoff conditions to prevent over-discharging of the battery.
A custom power monitoring board was made to monitor the voltage, current, and power through each connection, as shown in Figure 3. An Adafruit breakout board for the INA260 monitors each connection, reporting the voltage and current. A load relay is incorporated to control power to the load circuit via a digital output from the microprocessor. Victron provides a Bluetooth interface and smartphone application to check the operating and setup parameters, and was used to confirm the detected voltage, current, and power.
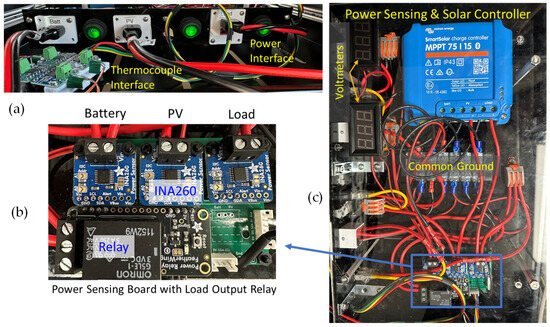
Figure 3.
(a) Power sensing interface with Anderson pole connectors to the battery, PV module and load, and on/off switches for each circuit. The thermocouple interface consisting of four MCP9600 breakout boards connected to T-type thermocouples taped to the back of the PV module under testing is shown in the left foreground. (b) Power sensing board with a relay for control of the load output. (c) Top view of the solar controller and power sensing unit.
2.3. Environmental Parameter Measurements
Measuring ambient and module temperature is the next critical parameter. Ambient temperatures may be measured with a local digital thermometer. We use an Adafruit breakout board for the AHT20, which includes both the ambient temperature and relative humidity over the I2C interface.
For the module temperature, as per the IEC guidelines, we use four T-type thermocouples [23] with adhesive backing taped to the backside of the module so that we can reuse them on other modules. The Adafruit MCP9600 and MCP9601 breakout boards provide low noise amplification for each thermocouple and provides the digitized results over the I2C interface. The MCP9600 is preferred, as it offers a lower uncertainty of ±0.5 °C. A PCB was designed for four Adafruit MCP9600 breakout boards, each set to a different I2C address so that only one I2C cable is needed going to the PV-Scope module. Holders were 3D-printed to support the thermocouples’ connection to each breakout board to reduce pullout and loss of connection.
A wind vane with a resistor network switch is used to measure the wind direction based on a lookup table providing 8 directions. A switch-based anemometer is used for wind speed, where one switch closure represents 2.4 km/h.
A summary of measured parameters is provided in Table 1. The range for each sensor measurement is given along with specific hardware and implementation notes.

Table 1.
Summary of measurements by type.
2.4. PV-Scope Electronic Unit Design
The main PCB for PV-Scope is shown in Figure 4. The ESP32-S3 feather board manufactured by Adafruit (Brooklyn, NY, USA) is used with a reverse TFT display to provide real-time information from the measurements. Three buttons on the board allow programming the ESP32 for real-time user input, such as starting and stopping a measurement. Several Adafruit breakout boards are incorporated on the main PCB, including a 12 V-to-5 V DC/DC converter (MPM3610), a temperature and humidity sensor (AHT20), ADC (ADS1115), and an I2C extender (LTC4311). A separate interface board allows different cable types to be connected, including the RJ11 from the anemometer and USB-C to the ESP32 board. A regulated 12 V DC power supply is used as the input to the board, and a switch is provided to run the ESP32 from either the USB-C or from the 5 V converter output.
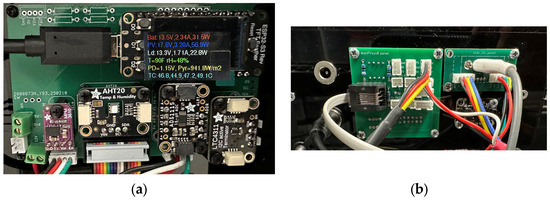
Figure 4.
PV-Scope: (a) populated PCB showing real-time measurement status and (b) custom laser-cut acrylic box sideview of interface panel with PCBs and socket for 12 V power input.
3. Subsystem Testing and Verification
To calculate the possible error in the efficiency, we need to estimate the uncertainty in measuring the incoming solar irradiance and the outgoing maximum power for the module. These measurements are made continuously during the test, and efficiency is calculated as an instantaneous efficiency. Both the solar irradiance and MPP measurements were calibrated against commercial devices to verify their performance, as discussed next.
3.1. Photodiode Calibration
For each photodiode pyranometer, we calibrated it against the Apogee pyranometer using a solar simulator with an air mass AM1.5G filter (from Newport Corporation in Irvine, CA, USA, model 92250A-1000) as a source under laboratory conditions. The pyranometers were gathered under the beam as shown in Figure 5. A 0.5 mm-thick Teflon disk was place on top of photodiodes PD2 and PD3. The transmission for the Teflon disk at normal incidence was estimated to be 53% and 47% for PD2 and PD3, respectively.
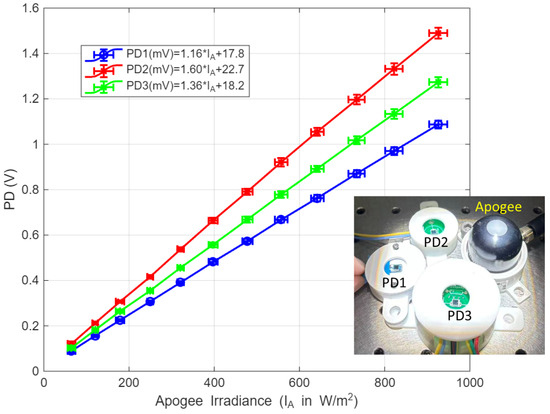
Figure 5.
Photodiode calibration against Apogee pyranometer under a solar simulator. PD2 and PD3 were measured with diffusers. (inset) Photodiodes (without diffusers) and Apogee pyranometer placement in the solar simulator beam.
Outdoor measurements were made using the Apogee pyranometer and calibrated photodiode located on the same plane of incidence facing south over a range of tilt angles. The cosine dependence, , was calculated for each tilt angle and a sun position of 53.7 elevation and 138.8 azimuth. Figure 6 shows the results for irradiance versus tilt angle and a quadratic fit for the irradiance over tilt angles. The measured irradiance from the calibrated PD is within 3% of the Apogee irradiance. Given the variation in the solar simulator beam uniformity of 5%, the outdoor measurements are expected to have better irradiance uniformity for calibrating the linear scaling factor, which changes it from 1.16 to 1.12 . The worst-case relative difference between the PD and Apogee irradiance is then 2% at the largest angles instead of 5% for the simulator calibration. The RMSE between the PD and Apogee using the outdoor calibration factor is 1.3%.
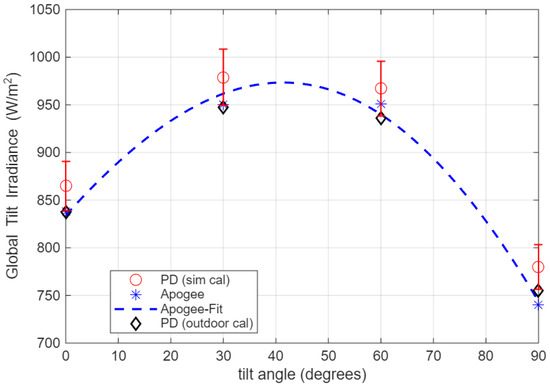
Figure 6.
Outdoor measurements for photodiode (PD) and Apogee POA irradiance versus the PV module tilt angle from horizontal, and a quadratic curve fit for each. Two calibration factors are shown for the PD, using the solar simulator and outdoor fit to the Apogee results. Error bars of +/−3% are shown on the PD (sim cal) measurement, representing the simulator beam nonuniformity.
3.2. Outdoor Test Setup
For outdoor testing when equipment portability is required, a working cart is a necessity. A standard-size equipment rack was mounted on a rolling base for portability, as shown in Figure 7. The rack height was chosen to accommodate the module height so the module can be folded (vertical) or extended to any tilt up to horizontal (0 tilt). Multiple shelves on the rack allow space for the equipment to be protected from the direct sun and storage for auxiliary (e.g., handheld) test equipment. A folding shelf was attached to one side for a laptop stand. The anemometer is attached on the other side. The top surface has a small optics bench for other test components to be conveniently attached.
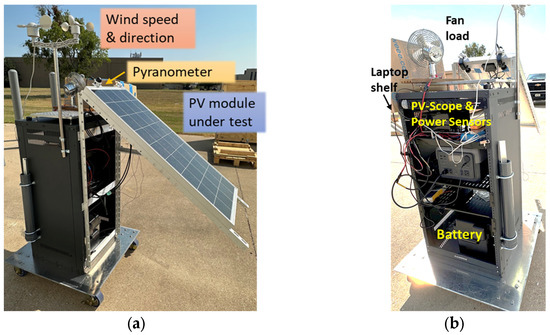
Figure 7.
(a) PV-Scope test system with mounted PV module under test that can be set at different tilt angles. The anemometer is mounted on the side. (b) PV-Scope, thermocouples (T/Cs), and solar controller with power sensors are mounted on the top shelf with the battery on the bottom shelf.
3.3. Maximum Power Point (MPP) Testing
For an experimental module under test, we chose the Eco-worthy 100 W monofacial silicon panel for its relatively low cost (USD 0.5/W) and good efficiency (23%-efficient PERC cells). It has a nominal maximum power voltage of 20 V and maximum power current of 5 A. For STC, the calculated module efficiency is 21.5% based on the specified 100 W module power and area of 0.465 m2. While we did not have the manufacturer’s direct specification on the module for the temperature coefficient, an estimate is −0.35%/.
The maximum power operating point for the PV panel was measured using the solar controller and an external power monitoring circuit between the PV panel and solar controller using an INA260 breakout board. In addition, the results were compared to a handheld solar power meter, the FROGBRO EY1600W. We had one EY1600W unit fail from thermal conditions, even though temperature overload sensors are built into the device. Figure 8 shows a comparison of MPP measurements between our PV-Scope system using the INA260, the Victron controller via its Bluetooth interface, and the EY1600W (handheld) meter. The linear fits show excellent behavior, with R2 values of 0.998 and 0.993 and RMSE = 0.86 W and 1.58 W for the Victron and EY1600W, respectively. The EY1600W meter reading was taken sequentially, requiring a manual disconnect from the solar controller circuit, while the Victron reading was taken concurrently with the PV-Scope measurement.
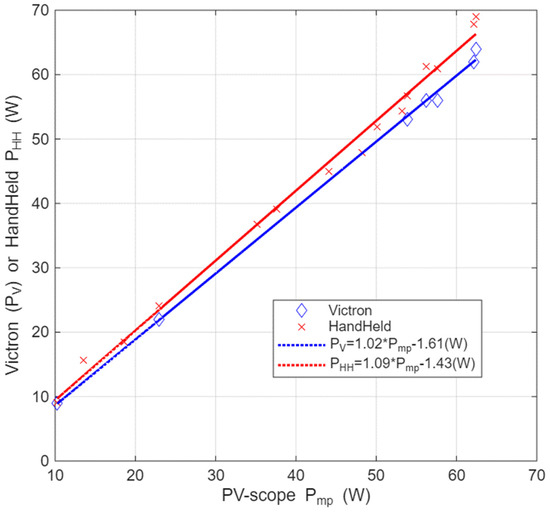
Figure 8.
Comparison of maximum power point measurements with respect to our PV-Scope measurement (Pmp) for the handheld (HH) Frogbro EY1600W and Victron (V) solar controller. The fit parameters are shown in the legend.
For the solar controller, care must be taken that the battery and load can consume the input power from the PV module. We chose a JITA LiFePO4 battery for our setup with 12 V and 100 Ah for its expected 10-year life, integrated battery monitoring system (BMS), and lighter weight compared to a sealed lead acid (SLA) battery with the same capacity. For DC loads, we have a heater element (about 50 W) and small fan (25 W).
3.4. IV-Curve Tracer Design
An IV-curve tracer was designed using four IRF3205PBF MOSFETs in parallel. A top-down view is shown in Figure 9. For a 100 W PV panel, each MOSFET will only need to handle 25 W for a short period of time, i.e., near the MPP of the IV trace scan. The MOSFETS are attached to a CPU heatsink with a 12 V fan, rated at 95 W. For continuous IV curve tracing of a 100 W PV panel, the average dissipated power should be 50 W or less, approximating the IV curve as a triangle. A 10 kΩ thermistor (B3950 NTC) capable of operating up to 125 °C is used to track the temperature of the heat sink so that rising temperatures can flag thermal issues sooner than later, e.g., if all current were to be diverted through a single MOSFET. The thermistor resistance change is monitored via a voltage divider with an ADC input on the ESP32 and converted to temperature using the Steinhart–Hart equation and fit parameters from the datasheet. An example IV trace measurement for a shaded PV module is shown in Figure 10. The IV trace provides substantially more information, particularly for troubleshooting modules, than just the MPP.
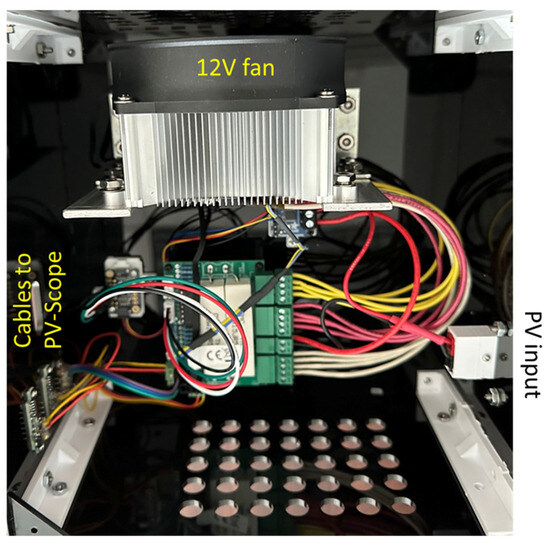
Figure 9.
MOSFET IV-curve tracer unit showing the PCB with load resistors and plug-in connectors to the MOSFETs, mounted on the heat sink. DAC and INA260 breakout boards are included, along with an Anderson pole connector interface to the PV module.
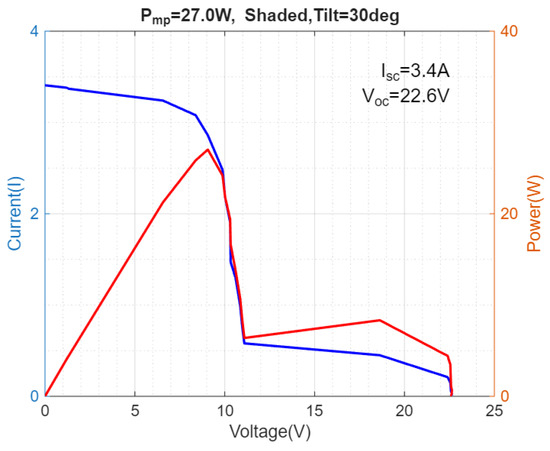
Figure 10.
Example I-V (blue line) and P-V (red line) curves for a shaded 100 W module tilted at 30 degrees with the GHI = 870 W/m2.
Each MOSFET is capable of handling 55 V and 98 A and has a threshold voltage of 2 to 4 volts on the gate-to-source. The source outputs were connected in pairs to a 0.56 Ω load resistor capable of handling 15 W or about 5.2 A. An operational amplifier (LM324) is used to supply voltage from an Adafruit digital-to-analog converter (DAC) to the gate inputs of four MOSFETS in parallel. Since two MOSFETs share the same power resistor output, their gate voltages are driven from a common input as well. Two DAC outputs are followed by an opamp circuit with a gain of 3 to drive the gate voltages of each pair of MOSFETs. For example, a 1 V DAC setting causes a 3 V output that drives the MOSFETs’ gate voltage. Given a maximum MOSFET junction temperature of 175C and estimating the total thermal resistance to be 2.5 °C/W yields a maximum power limit per MOSFET of around 60 W. Derating to 40 W for a safety margin implies power handling for a panel size up to 160 W continuous, or 320 W for an average power equal to half the MPP, assuming a triangular power scan. For smaller duty cycles, even larger PV panels could be measured with this system. For string-level powers, an insulated gate bipolar transistor (IGBT) electronic load capable of 1500 V DC and 20 A [24] is recommended instead of a MOSFET-based solution.
An Adafruit INA260 board’s Vin+ is connected to the positive output of the PV panel. The Vin- is connected to the MOSFET inputs (drain). A fan (12 V) is used to maximize the cooling capacity of the heat sink. MATLAB code reads serial data sent from the ESP32 and performs data analysis and graphing.
4. PV Module and Small Off-Grid System Testing
A 100 W PV module was tested with the Victron solar controller and a 12 V battery. A load consisting of a DC fan was also used, consuming approximately 23 W. An example set of data taken with the Victron solar controller is shown in Figure 11 and a tilt angle of 60°. There are periodic fluctuations in the power, about every 10 min, associated with the controller. Gaussian smoothing was employed over a 7-sample window.
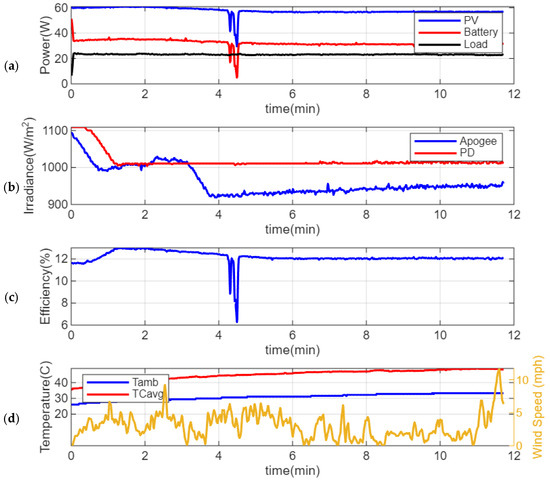
Figure 11.
Testing of 100 W PV monofacial module with Victron solar controller and battery. (a) Power for the PV, battery, and load circuits. (b) POA irradiance using a calibrated PD without a diffuser and the Apogee. (c) Calculated efficiency and (d) ambient temperature, the average thermocouple temperature, and the wind speed.
The POA irradiance ( in W/m2), ambient temperature (), and wind speed (v in m/s) can be used in Faiman’s model to predict the cell temperature as follows:
where U0 in W/(m2·°C) and U1 in W/(m2·°C·(m/s)) are heat loss coefficients. The Faiman model neglects thermal mass and thereby neglects transients [25]. To compare to the measured temperature rise, we use the average value for , , and v. The average POA irradiance is 962 W/m2 from the Apogee and 1018 W/m2 from the PD, a 5.5% difference, which is on the high side due to increasing uncertainties at the larger tilt angles. The average wind speed over the measurement period is 1.34 m/s (3.0 mph). From [6], the estimated coefficient values are U0 = 26.88 and U1 = 8.88, respectively. The Faiman model predicts while the thermocouple average yields . The cell temperature predicted by the Sandia model for an open rack mount is 30.6 , close to the Faiman model temperature prediction. The impact on efficiency depends on the module. An example is shown in Figure 12 assuming 21.5% at STC and an estimated temperature coefficient of −0.39%/°C that fits the steady-state asymptotic trend and compares well to the expected range of −0.35% to −0.4% for PERC cells. For an independent temperature measurement, the module temperature was measured separately with a handheld thermometer (with fixed emissivity) to be 47C on the front side and 50C or greater on the back side.
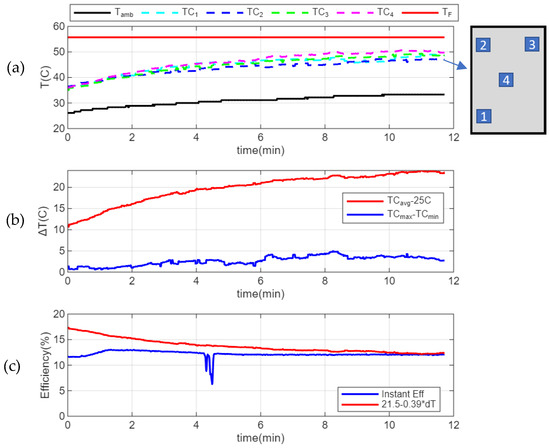
Figure 12.
(a) Temperature measurements for each thermocouple (TC1–TC4) are shown in addition to the ambient temperature and calculated Faiman model cell temperature. The thermocouple placement on the module backside is shown in the inset. (b) The temperature difference for the average thermocouple data relative to 25 °C (STC). (c) Instantaneous efficiency is calculated from the POA irradiance and Pmp and compared to an estimated temperature coefficient for an asymptotic fit and STC efficiency of 21.5%.
Figure 13a shows the time series data for cloud cover changing to sunny conditions with no load. Two cycles of the Victron solar controller testing are shown. Figure 13b analyzes the first cycle, showing the extracted time series and corresponding I-V and P-V curves.
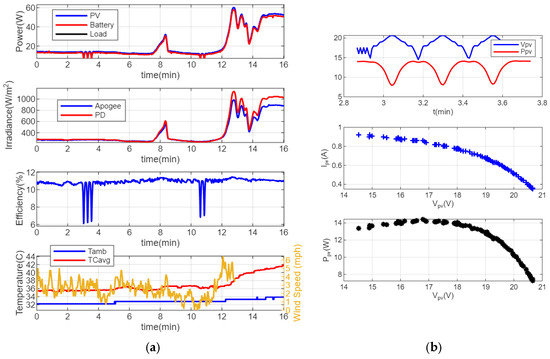
Figure 13.
(a) Time series with cloud cover to sunny conditions showing maximum power, irradiance, efficiency, temperature, and wind speed data. (b) Time series around first solar controller testing interval and resulting I-V and P-V plots.
5. Discussion
5.1. Measurement Uncertainty, Drift, and Error Analysis
Measurement uncertainty arises from many sources, including environmental sensitivity such as temperature dependence, drift, and aging over time. To estimate the uncertainty in the efficiency (), we focus on uncertainty in the irradiance () and maximum power () measurements, assuming that the manufacturer provides accurate information on the module area or that we can measure it accurately enough so that the contributed error is negligible.
The dominant source of uncertainty in the irradiance arises from the absolute uncertainty of the Apogee pyranometer relative to a standard, quoted as less than ±3% from the manufacturer. Other uncertainty sources include calibration of our photodiode pyranometers to the Apogee (±2%), repeatability (<±1%), and temperature-dependent drift (±0.4%), which uses the manufacturer’s data of 0.04% per °C and assumes a temperature offset of 10 °C. Neglecting the increasing uncertainty for large incidence angles due to the cosine dependence, the total irradiance uncertainty, calculated as the root mean square of the contributing sources, is . For large-incidence angles such as 75°, the total irradiance uncertainty increases to 6%. By using the Apogee in the same setup as the photodiode pyranometers, a comparison can be done at any time by placing them on the same plane. Apogee recommends recalibration every two years for their pyranometer, and they provide a website for comparing to a clear sky calculator [26] that is estimated to be accurate to within ±4% for all climates and locations worldwide.
The error in the power measurement using the INA260’s is calculated from the uncertainty in the power measurement at the module’s maximum power operating point, which is 0.15% at 100 W. When compared to the Victron, the ratio of the RMSE = 0.86 W to the larger measured powers, around 60 W, is 1.4%. So, the total uncertainty in the power is estimated to be ±1.4%. The overall efficiency uncertainty, given by Equation (2) using and , is .
The uncertainty in the temperature measurements will impact the temperature-dependent efficiency modeling. For T-type thermocouples, the uncertainty is ±0.5 °C. The amplifier (MCP9600) contributes an additional ±0.5 °C of uncertainty, including the cold junction compensating uncertainty. The uncertainty in the thermal contact resistance is estimated to be ±1 °C due to the adhesive mounting. Thus, the overall uncertainty in the temperature measurement is the RMS value of these contributions, or .
5.2. Applications
Accurate experimental data are essential for developing, calibrating, and validating transient models of PV module temperature and efficiency. Unlike steady-state approaches, transient models must capture the time-dependent response of modules to rapidly changing environmental conditions—including irradiance, wind, and ambient temperature—which requires high-resolution time series data covering both stable and dynamic periods. Without such experimental measurements, model parameters like thermal mass, heat capacity, and system-specific time constants cannot be reliably determined, and the resulting models risk underestimating temperature lags and efficiency losses during real-world transients. Furthermore, well-designed experimental datasets enable the identification of model limitations and sources of error, ultimately facilitating improvements in both module technology and system-level energy yield prediction under variable operating conditions.
Portable PV monitoring systems are needed in agrivoltaics to address the unique challenges of field-based solar–agriculture integration. An autonomous solar-powered climate station with wireless communication [27] has been demonstrated using an Arduino and open-source designs. Because agrivoltaic sites frequently involve distributed, mobile, and mixed-use installations, research and operation depend on monitoring systems that can be quickly deployed and reconfigured to measure PV module temperature, electrical performance, solar irradiance, and microclimatic conditions at multiple points within the field [28]. In addition to environmental monitoring, factors related to irrigation and soil monitoring are critical [29], and photosynthetically active radiation (PAR) must be measured for plants. Portable solutions enable direct validation of transient thermal and electrical models, facilitate studies of shading, crop-canopy effects, and energy–food yield interactions. Lightweight, robust, and cost-effective portable systems thus play a critical role in both experimental research and ongoing operation for maximizing the value and reliability of agrivoltaic projects.
Bifacial PV modules require specialized monitoring [30,31]. Unlike monofacial modules, bifacial modules absorb light from both the front and rear sides, making it essential to monitor both the front-side and rear-side irradiance, which may vary with albedo, ground cover, and system geometry. This necessitates multiple irradiance sensors with careful placement and continuous measurement of environmental parameters such as albedo, temperature, tilt, and shading conditions to capture dynamic variations. Accurate energy yield and bifacial gain calculations depend on integrating these multidirectional irradiance data streams, as well as robust procedures to account for rapidly changing ground reflectivity and sky conditions. As bifacial module adoption increases, advanced, high-frequency monitoring systems are critical for optimizing system performance, validating simulation models, and enabling precise comparisons between different configurations and environmental settings [32].
Perovskite PV cells [33,34] and tandem perovskite–Si PV modules [35] share similar needs to Si PV modules, but have unique test requirements related to environmental stressors, degradation mechanisms, encapsulation testing, and transient effects related to mobile ions [36]. Other applications include testing of hybrid PV–thermal systems [37,38] that share similar needs to incorporate monitoring of water flow and temperature to agrivoltaics involving irrigation and some PV cooling technologies [39,40].
5.3. Future Work
Future work will incorporate a radiation shield for the ambient temperature and humidity [41] and improve the weather resistance of the components. Additional irradiance sensors will be incorporated for bifacial module testing, separating diffuse and direct irradiance components, as well as cloud cover and radiative sky cooling testing [42].
A contributing factor to uncertainty is the spectral distribution of the solar radiation, which would be great to integrate into PV-Scope in a cost-effective manner. Spectral correction functions include average photon energy and water absorption, which have been used to improve the spectral modeling [43,44]. Spectrometers are comparatively expensive, so AM1.5G is usually the reference spectra for PV measurements. Bifacial systems and locations with diffuse fractions above 35% need spectral corrections [45].
PV-Scope is designed to be portable with an emphasis on experimental research and development applications. We have demonstrated measurements capturing temperature and irradiance transients. Typical sampling for steady-state models for temperature-dependent power and efficiency sample at 5 min intervals or longer. Data processing for outdoor measurements sometimes requires throwing away data that is not taken under near “steady-state” conditions, which may “discard” up to 70% of the data [25]. Ongoing research aims to incorporate transient behavior into the models.
Our ESP32-based system can be programmed to transmit data via Wi-Fi over the internet to an IoT service such as ThingSpeakTM. One restriction to incorporate in the design is that the ESP32’s GPIO pins attached to the second ADC (ADC2) will not work for analog reading during Wi-Fi use. To provide more localized functionality, the ESP32 could be interfaced to a Raspberry Pi or low-cost equivalent server that can retrieve the data, store it locally, and upload it to a web-based application.
5.4. Cost Comparison
PV-Scope offers substantial cost advantages compared to commercial PV and weather monitoring equipment designed for research, field deployment, or educational use. Commercial monitoring systems such as the Fluke Corporation (Everett, WA, USA) SMFT-1000 PV tester kit, which includes a temperature sensor, an irradiance measurement, IV-trace and maximum power point tracking, and data logging cost around USD 7000 per unit [46]. A PV-Scope built from open-source electronics and off-the-shelf sensor modules can deliver multi-sensor environmental, irradiance, and electrical data through an integrated interface for around USD 700 per unit. This cost advantage allows researchers and educators to deploy multiple units for less than the price of a single commercial kit, supporting hands-on learning and distributed experimentation. While commercial hardware may offer higher accuracy and long-term reliability, PV-Scope’s affordability, customizability, and rapid prototyping capacity make it a uniquely accessible solution for innovation and hands-on training.
5.5. PV Education
PV-Scope enhances laboratory- and field-based PV education, broadening academic and student engagement in renewable energy and electronics. Learning outcomes include practical instrumentation experience enabling students to use real sensor circuits, gaining skills in data acquisition, calibration, and troubleshooting as well as measurement uncertainty and error analysis. Systems-level thinking, like overall energy yield impacts, and sensor data fusion scale to large systems and cross disciplines, including solar, environmental, data science and analytics, and electronic and power systems. Capstone projects employing solar energy can be well supported using the PV-Scope test system. Prototyping skills are developed that empower creativity and active participation in research and industry innovation. We have used the PV-Scope test system for an undergraduate and graduate level course on solar energy as part of the laboratory work for measuring irradiance and characterizing both silicon PV modules and concentrating multijunction PV cells.
6. Conclusions
PV-Scope offers a versatile platform for education, research, and development. For educators, PV-Scope provides an instrumented system allowing students to directly observe and measure the interplay between irradiance, module temperature, and electrical output—enhancing understanding of renewable energy principles, system behavior, and data analysis. In research and development, PV-Scope supports outdoor experimentation with novel components, configurations, and monitoring strategies, yielding datasets essential for validating models and advancing PV science. Its portability and modular design make PV-Scope ideal for rapid prototyping, field testing, and comparative studies across diverse settings, bridging the gap between research, education, and real-world PV innovation.
Author Contributions
Conceptualization, C.K.M.; investigation, data curation, methodology, software, formal analysis, validation, C.K.M. and B.J.; writing—original draft preparation, writing—review and editing, resources, visualization, supervision, project administration, C.K.M. All authors have read and agreed to the published version of the manuscript.
Funding
This research received no external funding.
Data Availability Statement
The original contributions presented in this study are included in the article. Further inquiries can be directed to the corresponding author.
Acknowledgments
We are thankful to Robert Atkins for his mechanical skills and knowledge applied to integrating the test system on a cart, modifying the CPU heat sink, and mounting the MOSFETs. We thank Haitian Liu for early hardware and software testing for the academic lab and the College of Architecture at Texas A&M University for providing excellent service on the 3D-printed and laser-cut parts. The authors used AI for language editing and refinement.
Conflicts of Interest
C.K. Madsen is the owner of the small business Sunstirke Optics LLC, which provided only direct funding to support this research. No commercial or financial interests outside of this research project are involved. The remaining author declares no conflicts of interest.
Abbreviations
The following abbreviations are used in this manuscript.
| AM1.5G | air mass = 1.5, G = global |
| DNI | direct normal irradiance |
| GHI | global horizontal irradiance |
| GPIO | general purpose input output |
| GTI | global tilt irradiance |
| I2C | inter-integrated circuit for serial communication |
| MOSFET | metal oxide semiconductor field-effect transistor |
| MPP | maximum power point |
| MPPT | maximum power point tracking |
| PERC | passivated emitter and rear cell |
| POA | plane of array |
| PD | photodiode |
| PV | photovoltaic |
| RAM | random access memory |
| RMSE | root mean square error |
| SPI | serial peripheral interface |
| STC | standard test conditions |
| TC | thermocouple |
| TFT | thin-film transistor |
| TIA | transimpedance amplifier |
References
- Paudyal, B.R.; Imenes, A.G. Investigation of Temperature Coefficients of PV Modules through Field Measured Data. Sol. Energy 2021, 224, 425–439. [Google Scholar] [CrossRef]
- Xing, W.; Zhou, J.; Feng, Z. Effects of Mounting Geometries on Photovoltaic Module Performance Using CFD and Single-Diode Model. Sol. Energy 2014, 103, 541–549. [Google Scholar] [CrossRef]
- Boccalatte, A.; Thebault, M.; Paolini, R.; Fossa, M.; Ramousse, J.; Ménézo, C.; Santamouris, M. Assessing the Combined Effects of Local Climate and Mounting Configuration on the Electrical and Thermal Performance of Photovoltaic Systems. Application to the Greater Sydney Area. Renew. Energy 2023, 219, 119478. [Google Scholar] [CrossRef]
- Kratochvil, J.; Boyson, W.; King, D. Photovoltaic Array Performance Model; SAND2004-3535; Sandia National Laboratories (SNL): Albuquerque, NM, USA; Livermore, CA, USA, 2004; p. 919131. [Google Scholar]
- Sarmah, P.; Das, D.; Saikia, M.; Kumar, V.; Yadav, S.K.; Paramasivam, P.; Dhanasekaran, S. Comprehensive Analysis of Solar Panel Performance and Correlations with Meteorological Parameters. ACS Omega 2023, 8, 47897–47904. [Google Scholar] [CrossRef]
- Jiang, B.; Madsen, C.K. Multi-Climate Simulation of Temperature-Driven Efficiency Losses in Crystalline Silicon PV Modules with Cost–Benefit Thresholds for Evaluating Cooling Strategies. Energies 2025, 18, 3609. [Google Scholar] [CrossRef]
- Dubey, S.; Sarvaiya, J.N.; Seshadri, B. Temperature Dependent Photovoltaic (PV) Efficiency and Its Effect on PV Production in the World—A Review. Energy Procedia 2013, 33, 311–321. [Google Scholar] [CrossRef]
- Faiman, D. Assessing the Outdoor Operating Temperature of Photovoltaic Modules. Prog. Photovolt. Res. Appl. 2008, 16, 307–315. [Google Scholar] [CrossRef]
- IEC 61853-2:2016; Photovoltaic (PV) Module Performance Testing and Energy Rating—Part 2: Spectral Responsivity, Incidence Angle and Module Operating Temperature Measurements. International Electrotechnical Commission: Geneva, Switzerland, 2016.
- Dobos, A.P.; Freeman, J.M. Significant Improvement in PV Module Performance Prediction Accuracy Using a New Model Based on IEC-61853 Data: Preprint; National Renewable Energy Laboratory: Golden, CO, USA, 2019. [Google Scholar]
- Blaifi, S.; Mellit, A.; Taghezouit, B.; Moulahoum, S.; Hafdaoui, H. A Simple Non-Parametric Model for Photovoltaic Output Power Prediction. Renew. Energy 2025, 240, 122183. [Google Scholar] [CrossRef]
- López-Vargas, A.; Fuentes, M.; García, M.V.; Muñoz-Rodríguez, F.J. Low-Cost Datalogger Intended for Remote Monitoring of Solar Photovoltaic Standalone Systems Based on ArduinoTM. IEEE Sens. J. 2019, 19, 4308–4320. [Google Scholar] [CrossRef]
- Agustira, Y.M.; Ismail, N.; Rachmildha, T.D.; Fadilla, R.M.; Sartika, N.; Muharja, D. Data Logger System of Hybrid Renewable Energy System at Home-Scale. In Proceedings of the 2022 8th International Conference on Wireless and Telematics (ICWT), Yogyakarta, Indonesia, 21–22 July 2022; pp. 1–5. [Google Scholar]
- Hamied, A.; Mellit, A.; Benghanem, M.; Boubaker, S. IoT-Based Low-Cost Photovoltaic Monitoring for a Greenhouse Farm in an Arid Region. Energies 2023, 16, 3860. [Google Scholar] [CrossRef]
- Saranya, J.; Divya, V. An Implementation of Photovoltaic Solar Panel Monitoring System Based on Internet of Things. In Proceedings of the 2024 Third International Conference on Distributed Computing and Electrical Circuits and Electronics (ICDCECE), Ballari, India, 26–27 April 2024; pp. 1–5. [Google Scholar]
- Sarkar, S.A.; Nimbalkar, A.D.; More, S.K.; Kesarkar, O.S.; Patil, A.S. Design of Solar Panel Monitoring System Using ESP32& IOT. In Proceedings of the 2024 IEEE International Conference on Smart Power Control and Renewable Energy (ICSPCRE), Rourkela, India, 19–21 July 2024; pp. 1–6. [Google Scholar]
- Kalay, M.S.; Kilic, B.; Saglam, S. Systematic Review of the Data Acquisition and Monitoring Systems of Photovoltaic Panels and Arrays. Sol. Energy 2022, 244, 47–64. [Google Scholar] [CrossRef]
- ISO 9060:2018; Solar Energy—Specification and Classification of Instruments for Measuring Hemispherical Solar and Direct Solar Radiation. ISO: Geneva, Switzerland, 2018.
- SP-212-SS: Amplified 0–2.5 Volt Pyranometer. Available online: https://www.apogeeinstruments.com/sp-212-ss-amplified-0-2-5-volt-pyranometer/ (accessed on 24 September 2025).
- Muñoz, S.R.; Sánchez Prisco, A.F.; Castro García, L.F.; Gómez Múnera, J.A.; Aristizábal, S.G.; Cano Quintero, J.B.; Hernández, E.V. Implementation of IoT Curve Tracer Based on Programmable Electronic Load Using Linear Mosfet. In Proceedings of the 2025 IEEE Colombian Conference on Communications and Computing (COLCOM), Popayan, Colombia, 13–15 August 2025; pp. 1–6. [Google Scholar]
- De Riso, M.; Dhimish, M.; Guerriero, P.; Daliento, S. Design of a Portable Low-Cost I-V Curve Tracer for On-Line and In Situ Inspection of PV Modules. Micromachines 2024, 15, 896. [Google Scholar] [CrossRef] [PubMed]
- Machado, P.L.O.; Fachini, L.V.G.; Tiuman, E.T.; Barchi, T.M.; Stevan, S.L.; Siqueira, H.V.; Szmoski, R.M.; Antonini Alves, T. A Low-Cost Arduino-Based I–V Curve Tracer with Automated Load Switching for PV Panel Characterization. Appl. Sci. 2025, 15, 8186. [Google Scholar] [CrossRef]
- TC-SA Type K/T Surface Thermocouple with Adhesive Backing. Available online: https://www.iothrifty.com/products/tc-sa-k-type-surface-thermocouple (accessed on 20 September 2025).
- Suresh, A.N.; Naveen, B.; Dusarlapudi, K. Design and Implementation of Cost-Effective PV String I-V and P-V Curve Tracer by Using IGBT as a Power Electronic Load. In Proceedings of the 2024 6th International Conference on Energy, Power and Environment (ICEPE), Shillong, India, 20–22 June 2024; pp. 1–7. [Google Scholar]
- Goodfriend, W.; Pieters, E.B.; Tsvetelina, M.; Solomon, A.; Ezema, F.; Rau, U. Development and Improvement of a Transient Temperature Model of PV Modules: Concept of Trailing Data. Prog. Photovolt. Res. Appl. 2024, 32, 399–405. [Google Scholar] [CrossRef]
- Clear Sky Calculator|Apogee Instruments Inc. Available online: https://www.clearskycalculator.com/ (accessed on 17 October 2025).
- Botero-Valencia, J.S.; Mejia-Herrera, M.; Pearce, J.M. Low Cost Climate Station for Smart Agriculture Applications with Photovoltaic Energy and Wireless Communication. HardwareX 2022, 11, e00296. [Google Scholar] [CrossRef]
- Toledo, C.; Scognamiglio, A. Agrivoltaic Systems Design and Assessment: A Critical Review, and a Descriptive Model Towards a Sustainable Landscape Vision (Three-Dimensional Agrivoltaic Patterns). Available online: https://www.mdpi.com/2071-1050/13/12/6871 (accessed on 23 September 2025).
- De Francesco, C.; Centorame, L.; Toscano, G.; Duca, D. Opportunities, Technological Challenges and Monitoring Approaches in Agrivoltaic Systems for Sustainable Management. Sustainability 2025, 17, 634. [Google Scholar] [CrossRef]
- Xu, S.-J.; Wu, S.-Y.; Xiao, L.; Ruan, P.-T.; Gao, S.; Chen, Z.-L. Experimental Validation and Application of an Improved Performance Evaluation Model for Bifacial Photovoltaic System. Appl. Energy 2025, 399, 126541. [Google Scholar] [CrossRef]
- Deline, C.; Ovaitt, S.; Gostein, M.; Braid, J.; Newmiller, J.; Suez, I. Irradiance Monitoring for Bifacial PV Systems’ Performance and Capacity Testing. IEEE J. Photovolt. 2024, 14, 803–814. [Google Scholar] [CrossRef]
- Leon-Rodriguez, N.; Sanchez-Juarez, A.; Ortega-Cruz, J.; Arancibia Bulnes, C.A.; Leon-Rodriguez, H. Bifacial Solar Modules Under Real Operating Conditions: Insights into Rear Irradiance, Installation Type and Model Accuracy. Eng 2025, 6, 233. [Google Scholar] [CrossRef]
- Meheretu, G.M.; Worku, A.K.; Yihunie, M.T.; Koech, R.K.; Wubetu, G.A. The Recent Advancement of Outdoor Performance of Perovskite Photovoltaic Cells Technology. Heliyon 2024, 10, e36710. [Google Scholar] [CrossRef]
- Gupta, R.K.; Kumar, D.K.; Sudhakar, V.; Beckedahl, J.M.; Abate, A.; Katz, E.A.; Visoly-Fisher, I. Seasonal Effects on Outdoor Stability of Perovskite Solar Cells. Adv. Energy Mater. 2025, 15, 2403844. [Google Scholar] [CrossRef]
- Babics, M.; De Bastiani, M.; Ugur, E.; Xu, L.; Bristow, H.; Toniolo, F.; Raja, W.; Subbiah, A.S.; Liu, J.; Torres Merino, L.V.; et al. One-Year Outdoor Operation of Monolithic Perovskite/Silicon Tandem Solar Cells. Cell Rep. Phys. Sci. 2023, 4, 101280. [Google Scholar] [CrossRef]
- Ali, M.U.; Mo, H.; Li, Y.; Djurišić, A.B. Outdoor Stability Testing of Perovskite Solar Cells: Necessary Step toward Real-Life Applications. APL Energy 2023, 1, 020903. [Google Scholar] [CrossRef]
- Guarracino, I.; Freeman, J.; Ramos, A.; Kalogirou, S.A.; Ekins-Daukes, N.J.; Markides, C.N. Systematic Testing of Hybrid PV-Thermal (PVT) Solar Collectors in Steady-State and Dynamic Outdoor Conditions. Appl. Energy 2019, 240, 1014–1030. [Google Scholar] [CrossRef]
- Habchi, C.; Bou-Mosleh, C.; Khaled, M. An Experimental Analysis of a Hybrid Photovoltaic Thermal System through Parallel Water Pipe Integration. Int. J. Thermofluids 2024, 21, 100538. [Google Scholar] [CrossRef]
- Kozak-Jagieła, E.; Cisek, P.; Ocłoń, P. Cooling Techniques for PV Panels: A Review. Sci. Radices 2023, 2, 47–68. [Google Scholar] [CrossRef]
- Zhao, Y.; Wang, F.; Xu, Z.; Cheng, C.; Gao, D.; Zhang, H.; Wang, Y. Experimental and Numerical Investigation of Spray Cooling Based Photovoltaic/Thermal System: Achieving High Performance, Low Cost, and Lightweight Design. Energy 2025, 323, 135671. [Google Scholar] [CrossRef]
- Design and Implementation of 3-D Printed Radiation Shields for Environmental Sensors—HardwareX. Available online: https://www.hardware-x.com/article/S2468-0672(22)00012-8/fulltext (accessed on 20 September 2025).
- Zhao, D.; Aili, A.; Zhai, Y.; Xu, S.; Tan, G.; Yin, X.; Yang, R. Radiative Sky Cooling: Fundamental Principles, Materials, and Applications. Appl. Phys. Rev. 2019, 6, 021306. [Google Scholar] [CrossRef]
- Daxini, R.; Wilson, R.; Wu, Y. Modelling the Spectral Influence on Photovoltaic Device Performance Using the Average Photon Energy and the Depth of a Water Absorption Band for Improved Forecasting. Energy 2023, 284, 129046. [Google Scholar] [CrossRef]
- Sang, W.; Ma, Y.; Li, S.; Xue, P.; Li, B.; Peng, J.; Fan, M. Spectral Correction of Photovoltaic Module Electrical Properties. Renew. Energy 2024, 237, 121907. [Google Scholar] [CrossRef]
- Lewis, M.; Jancowski, V.; Valdivia, C.E.; Hinzer, K. Spectral Irradiance Correction of Photovoltaic Energy Yield Predictions in Six High-Latitude Locations with Measured Spectra. Sol. Energy 2025, 300, 113816. [Google Scholar] [CrossRef]
- Fluke SMFT-1000/FPC—Multifunctional PV Tester and Performance Analyzer Kit with 1-Year Premium Care Standard Plan|Tequipment. Available online: https://www.tequipment.net/Fluke/SMFT-1000/FPC/Solar-Curve-Tracers/ (accessed on 23 September 2025).


Disclaimer/Publisher’s Note: The statements, opinions and data contained in all publications are solely those of the individual author(s) and contributor(s) and not of MDPI and/or the editor(s). MDPI and/or the editor(s) disclaim responsibility for any injury to people or property resulting from any ideas, methods, instructions or products referred to in the content. |
© 2025 by the authors. Licensee MDPI, Basel, Switzerland. This article is an open access article distributed under the terms and conditions of the Creative Commons Attribution (CC BY) license (https://creativecommons.org/licenses/by/4.0/).