Abstract
Surface-mounted devices (SMDs) are essential components that enable the miniaturization and enhanced performance in electronic products, significantly impacting both circuit performance and reliability. In this study, we propose a non-destructive evaluation method for cracks in SMD capacitors using the artificial intelligence of impedance spectra. To achieve this, cracks were induced in 132 specimens through incremental displacement using a shear module of a bond tester. At each crack level, frequency-domain spectra were acquired for 14 parameters using an impedance analyzer. Meaningful changes in parameter patterns corresponding to each crack stage were observed, confirming impedance spectroscopy as an effective tool for crack assessment. Through data augmentation, we generated 87,800 datasets representing various crack stages, which were used to train AI models that output crack stages from input impedance spectra. Based on this dataset, six AI models, ConvNeXt, LSTM, Transformer, Logistic Regression, SVM, and Random Forest, were developed to classify crack severity into nine stages. Model-wise, the Random Forest classifier consistently outperformed the other approaches. When trained with single parameters, it achieved its best performance using the dissipation factor, reaching 98.5% accuracy. Furthermore, when the dissipation factor was combined with any of the remaining impedance parameters, the Random Forest model achieved perfect diagnostic performance (100%) across all combinations, highlighting both its robustness and its suitability for multi-parameter learning. These results provide practical guidance for selecting effective parameters and model architectures for impedance spectrum-based crack diagnostics.
1. Introduction
SMDs underpin the ongoing miniaturization and high-density integration of modern electronic packages, enabling smaller form factors and improved performance across consumer, industrial, and defense systems [1,2,3]. In these assemblies, passive SMDs such as multilayer ceramic capacitors are densely populated on printed circuit boards (PCBs) and directly affect signal integrity, power quality, and system reliability. Even seemingly minor defects—such as micro-cracks in components or their solder interconnects—can perturb impedance paths, induce intermittency, and precipitate progressive failures that compromise the entire system [4,5,6]. This reality heightens the need for reliable, non-destructive defect detection and classification methods that are sensitive to early-stage damage while remaining practical for on-site use in production and field environments.
Conventional fault diagnosis methods include a wide range of destructive and non-destructive techniques. Electrical checks, such as resistance measurements with a digital multimeter, are inexpensive and fast but often lack sensitivity to incipient, progressive defects that remain within typical tolerance bands until late in life [7]. Optical automated inspection (AOI) can detect gross geometry and wetting issues but struggles with hidden joints and subtle sub-surface features; X-ray, computed tomography (CT) and scanning acoustic microscopy (SAM) offer deeper visibility at the expense of cost, throughput, and on-line deployability [8,9]. High-frequency signal methods, including time-domain reflectometry (TDR), frequency-domain reflectometry (FDR), spread-spectrum time-domain reflectometry (SSTDR), and S-parameter analysis, can detect interconnect degradation and intermittency; however, they may be susceptible to noise, require careful de-embedding around resonances, and often rely on costly vector network analyzers (VNAs), which limits large-scale or in situ monitoring [10,11,12,13,14,15,16,17,18,19].
Motivated by these gaps, this study proposes impedance spectroscopy as a practical and sensitive basis for SMD crack diagnosis. Unlike narrowband or point-parameter checks, impedance spectra capture frequency-dependent changes in resistive and reactive pathways that arise from crack initiation and growth, offering richer signatures than scalar resistance values [7,20]. Importantly, spectra can be acquired with compact impedance analyzers that are generally more cost-effective and field-friendly than VNAs, easing on-site and potentially on-line deployment. Moreover, by emphasizing bands less affected by resonant artifacts, impedance-spectrum features can be comparatively robust to measurement noise that challenges high-frequency methods [17,18]. Although impedance-based diagnostics have been explored in adjacent domains (e.g., motors, cables, batteries, and interconnect health monitoring) [12,20,21], to the best of our knowledge, impedance spectra collected across controlled crack progression in SMD capacitors have not been systematically assembled and exploited with AI models for crack diagnosis. We therefore couple impedance spectroscopy with a data-driven approach to address early, mid, and late state crack detection in SMD components.
Artificial intelligence (AI) models can learn discriminative, frequency-domain patterns from raw spectra beyond hand-crafted features, improving sensitivity to subtle and progressive damage. This approach inherits several practical advantages: (i) lower instrumentation cost and simpler fixtures compared with radio frequency (RF) network analysis; (ii) greater noise robustness by leveraging full-spectrum patterns rather than focusing on narrowband or specific measurement points; (iii) no need for off-site equipment such as X-ray, CT, or SAM, enabling on-site and potentially on-line monitoring without any disassembly of systems; and (iv) a framework extensible to different components and packages [7,17,19,20].
The contributions of this work are threefold. First, we design a controlled crack-progression experiment on SMD capacitors and acquire impedance spectra spanning 14 electrical quantities over a wide frequency range. Second, we develop a data augmentation scheme to expand the dataset while preserving spectral patterns, thereby addressing device-to-device variability, mitigating measurement noise, and reducing the risk of overfitting. Third, we systematically compare deep learning (DL) architectures and machine learning (ML) classifiers using both single-parameter and multi-parameter learning. This comparative analysis provides practical guidelines for selecting suitable models and identifying effective combinations of impedance parameters for crack diagnosis in SMDs.
2. Related Works
The non-destructive and quantitative detection of cracks and defects inside electronic packages is essential for ensuring safety and reliability in the electronics industry. Conventional non-destructive diagnostic methods, such as X-ray imaging [22], CT [8], and SAM [9], often lack the resolution or contrast necessary to detect fine cracks in sealed components within electronic packages. To address these limitations, recent studies have focused on electrical signal-based fault detection techniques. Traditional approaches utilizing electrical signals include DC resistance measurements [7,23,24], TDR [11,12,13,14,15], RF impedance [7,20,21], S-parameter pattern analysis [6,16,17,25,26], digital signal monitoring [27,28], and Smith chart-based methods [19]. Among these, DC resistance measurement is not well suited for the continuous monitoring of progressive degradation, as the resistance remains relatively constant within the range of standard deviation until severe degradation causes a sudden increase, which significantly impacts system performance. In contrast, high-frequency signal-based methods, such as RF impedance measurement, leverage the skin effect—where the current is concentrated near the surface at higher frequencies—to effectively detect surface-initiated defects in interconnects. However, these methods are susceptible to noise and may exhibit inconsistent correlations between defect severity and measurement parameters near resonance points [18]. To overcome the vulnerabilities to noise and resonance, S-parameter pattern analysis has been proposed, utilizing the full frequency spectrum. Although promising, S-parameter measurements are more challenging to perform and tend to be sensitive to external disturbances such as mechanical stress and ambient noise. Smith chart analysis, which considers both the magnitude and phase of the S-parameters, has been introduced as a way to improve robustness against such interference. Nevertheless, this method still inherits the fundamental limitations of S-parameter analysis, including costly and complex measurement setups.
Recently, research on applying AI techniques for fault detection in electronic devices has been actively conducted. Previous research has utilized the electrical characteristics of Permanent Magnet Synchronous Motors (PMSMs), such as the switching voltage, PWM signals, and phase angle, and applied models including Artificial Neural Networks (ANNs), Decision Trees, and Support Vector Machines (SVMs) to detect open-circuit and short-circuit faults in motors [29]. In the field of electronic packaging, deep learning models based on image processing, such as YOLO and CNN algorithms, have been widely used to analyze X-ray images for automatic solder defect detection. These approaches have significantly improved the speed and accuracy of fault diagnosis by automating conventional manual inspection processes [30,31,32]. However, previous studies have mainly focused on identifying the presence or type of defects and therefore have limitations in quantitatively evaluating the severity of faults. Meanwhile, as a direction for further improving the performance of AI models, the importance of data-loading strategies such as selective embedding has recently been emphasized, as these methods contribute to enhancing model generalization and training efficiency [33,34].
In contrast, impedance spectroscopy offers several distinct advantages. The measurement process is relatively simple, it can be readily applied to small electronic components, and it demonstrates comparative robustness against external environmental influences. More importantly, impedance is highly sensitive to the presence of early-stage defects, making it possible to detect subtle degradation processes at an incipient stage. Consequently, when impedance spectra are employed as input features and crack severity levels are employed as output labels, DL models can be trained to predict the internal condition of electronic packages solely from impedance data. Furthermore, impedance analyzers are relatively low cost and can be miniaturized, which makes them more suitable for on-site real-time monitoring compared with traditional high-cost and bulky instruments. Building on these advantages, the present study combines impedance spectroscopy with DL, highlighting its potential extension toward prognostics and health management (PHM) technologies for electronic packaging.
3. Proposed Method
When physical defects such as cracks occur in SMDs, they lead to changes in electrical characteristics which are particularly observable under alternating current (AC) conditions as variations in impedance properties. As cracks propagate within a component, they alter the impedance profile. Specifically, cracks reduce the effective cross-sectional area of solder joints and increase contact resistance, thereby impeding current flow, increasing the real part of impedance (resistive component), and altering parasitics that affect reactance. Consequently, frequency-dependent impedance spectra deviate from the pristine state; the effect is pronounced in bands where conduction paths change and the skin effect is amplified. Hence, impedance spectroscopy can effectively evaluate the extent and progression of cracks. In this study, 14 impedance-related parameters—Impedance, Admittance, Reactance, Conductance, Susceptance, Quality factor, Dissipation factor, Phase, Equivalent Series Resistance, Equivalent Parallel Resistance, Equivalent Series Inductance, Equivalent Parallel Inductance, Equivalent Series Capacitance, and Equivalent Parallel Capacitance—obtained from an impedance analyzer were used to analyze crack progression. Their definitions are summarized in Table 1. Once spectra reflecting cracks are acquired, AI models can be trained to map quantitative signal features to severity labels. Because responses vary within a severity level depending on the locations and shapes of cracks, proper preprocessing and augmentation are required. To this end, we augmented the measured data based on the observed signal patterns, enhancing the robustness and accuracy of the AI models.

Table 1.
Parameters obtained from the impedance analyzer.
We then constructed AI models such as ConvNeXt, LSTM, Transformer, Logistic Regression, Support Vector Machine, and Random Forest, using impedance spectra as input and severity levels as output. The models were then compared in terms of diagnostic accuracy across each parameter. Furthermore, rather than relying on a single parameter, combining multiple impedance-derived parameters provides richer representations of defect evolution, leading to improved diagnostic performance and reduced training time [25]. Specifically, the parameter with the highest diagnostic accuracy was first selected for each model, and this served as the basis for developing a multi-parameter learning approach by progressively combining it with additional parameters.
4. Data Collection and Augmentation
4.1. Material
4.1.1. Specimen Preparation
To observe changes in impedance spectra resulting from cracks in components, SMD capacitors were selected as the test subjects. Although these components share identical package dimensions, their internal structures and electrical operating characteristics may lead to varying responses to cracks, making them suitable for a comparative analysis of impedance characteristics during crack propagation. Additionally, the solder joints of the capacitors were formed using SAC305 alloy, which is a widely adopted lead-free solder (96.5% Sn, 3% Ag, and 0.5% Cu) in commercial electronic packaging processes. For the experiment, capacitors (100 nF, CL21B104KCFNNNE) with dimensions of 2 mm × 1.25 mm × 1.35 mm were mounted on a 100 mm × 100 mm test PCB in a 14 × 8 array, as depicted in Figure 1. Subsequently, mechanical cracks were introduced to the components across 112 experimental specimens.
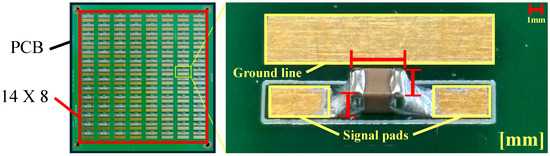
Figure 1.
Test vehicle and specimen used in the experiments.
4.1.2. Inducing Crack Propagation and Labeling Data
Mechanical damage was incrementally applied to the SMD capacitors to experimentally reproduce the crack initiation and propagation process. The cracks were introduced using a shear module attached to a bond tester (Condor Sigma, XYZTEC), as illustrated in Figure 2. The shear module, shown in Figure 3, is designed to apply horizontal shear forces to the side of the component, making it suitable for simulating mechanical stresses [21,35].
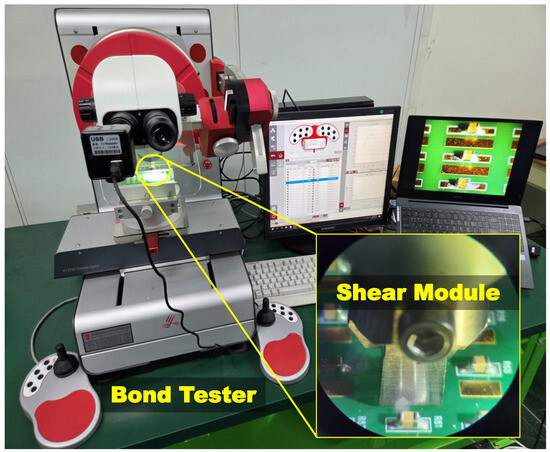
Figure 2.
Experimental setup for inducing crack propagation in SMD capacitors.
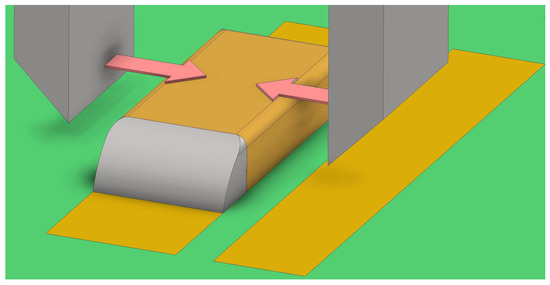
Figure 3.
Scheme for inducing crack propagation in SMD capacitors.
In the experiment, a displacement of 150 µm was repeatedly applied to the SMD capacitors to induce cracks step by step. Both the magnitude of displacement and the number of repetitions were controlled according to predefined criteria, and crack progression was divided into a total of nine stages. Each stage represented a different level of crack severity, with stage 0 indicating the normal state and stage 8 representing severe crack propagation, just prior to component failure. All specimens were uniformly arranged on identical boards and treated consistently before and after crack application and impedance spectrum measurement to ensure the reliability of the collected data. The presence and severity of cracks were confirmed through scanning electron microscopy (SEM), as shown in Figure 4. SEM images clearly demonstrated crack formation on the surface and within the interior of the capacitors, which was found to be consistent with the typical crack patterns observed in SMD capacitors [27].
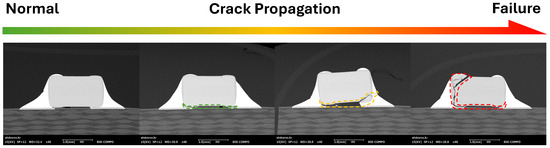
Figure 4.
Observation of crack in SMD capacitors after crack-inducing testing.
4.2. Impedance Spectrum Measurements
4.2.1. Measurement Setup
To non-destructively diagnose the condition of SMD capacitors subjected to progressive crack levels, impedance spectra were measured for each specimen. Impedance spectroscopy serves as an effective diagnostic tool by analyzing the electrical responses of components across various frequency ranges, enabling the assessment of electrical property changes caused by cracks in the components. In this experiment, data were collected using an impedance analyzer (IM3570, HIOKI, Nagano, Japan). The measurement frequency range of the impedance analyzer was set from 5 kHz to 5 MHz, which was divided uniformly into 801 data points across the frequency interval. As illustrated in Figure 5, the measurements were conducted by directly contacting probes to both solder joints of the passive SMD capacitor.
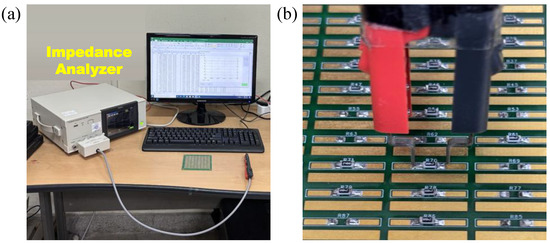
Figure 5.
(a) Impedance spectrum measurement setup, (b) Example of measurement using a probe.
4.2.2. Impedance Spectrum According to Crack Propagation
The measured dataset comprises 14 impedance-derived parameters, namely impedance magnitude, phase, series resistance, series reactance, admittance magnitude, conductance, susceptance, parallel capacitance, series capacitance, series inductance, parallel inductance, parallel resistance, dissipation factor, and quality factor. All fourteen parameters exhibit distinctive, frequency-dependent signatures that evolve with crack propagation in the solder joints and the SMD capacitor (Figure 6). Mechanistically, crack growth reduces the effective current-carrying cross-section and introduces oxide-mediated micro-contacts in solder ligaments, increasing series loss and path inductance. It also severs or delaminates ceramic and electrode layers in the multilayer ceramic capacitor, reducing the effective electrode overlap and permittivity, thereby lowering effective capacitance and increasing dielectric loss. These changes shift the self-resonant frequency, rotate the phase, and alter slopes, offsets, and peak amplitudes across the spectra. The effects are especially pronounced at high frequency, where the skin effect and current crowding amplify small defects. Consequently, the complete set of 14 impedance parameters provides physically meaningful features for AI-based crack-severity classification.
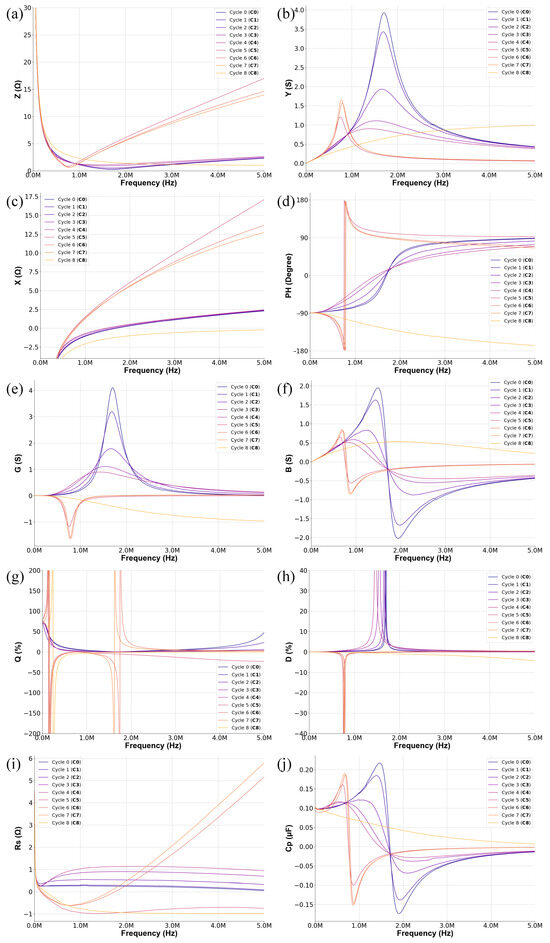
Figure 6.
Variations in frequency-domain impedance spectra of capacitors at different crack levels: (a) Z, (b) Y, (c) X, (d) , (e) G, (f) B, (g) Q, (h) D, (i) Rs, (j) Cp.
5. Experimental Protocol for Learning Models
5.1. Data Preprocessing and Augmentation
In this study, we constructed a dataset based on impedance spectrum data to quantitatively predict crack severity in SMD capacitors using AI models. As shown in Table 2, it was confirmed that training either did not proceed properly or underfitting occurred in models other than the Random Forest model. In addition, it was confirmed that overfitting occurred in the Random Forest model. To overcome this issue, data augmentation of the impedance spectrum data was performed. As illustrated in Figure 7a, even data measured at the same crack stage may exhibit varying patterns. Therefore, data exhibiting similar patterns at each crack stage were identified, and data augmentation was conducted through linear interpolation within these patterns. The data augmentation method proposed in this study differs from conventional approaches in that it can augment data while preserving the inherent patterns of measurement data containing physical information. As shown in Figure 7b, the proposed method maintains the pattern of the original data while exhibiting clear differences from it. This allows the generation of diverse data that closely resemble real measurements. Consequently, as shown in Figure 7b, 87,800 impedance spectrum data samples resembling the measured patterns were obtained. The augmented samples can preserve the original spectral distribution without introducing artificial patterns, thereby improving model generalization and reducing overfitting. Subsequently, the training dataset was created by combining 90% of the original data with 70% of the augmented data, while the validation dataset was constructed using 90% of the original data combined with 30% of the augmented data. The remaining 10% of the original data, unused in training and validation, was utilized as the test dataset to complete the overall dataset structure.
Table 2.
Model performance trained on original data only (accuracy %).
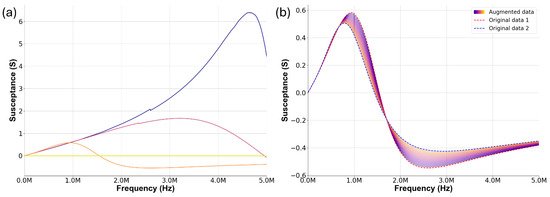
Figure 7.
Data augmentation for the impedance specta: (a) data patterns in the same severity of cracks, (b) data augmentation within the same pattern.
5.2. Model Descriptions
In this study, crack severity classification is formulated as a supervised learning problem that uses impedance spectra as input features and severity levels as outputs. We benchmark six classification models, which included three DL models (ConvNeXt, LSTM, Transformer) and three ML models (Logistic Regression, Support Vector Machine, Random Forest). For DL, ConvNeXt serves as a modern convolutional backbone that, compared with conventional CNNs, more efficiently learns local and multi-scale patterns from structured representations; when the spectra are arranged on a frequency–parameter plane, ConvNeXt effectively captures image-like regularities. LSTM treats the impedance spectrum as a frequency-ordered sequence, modeling continuous pattern changes and short-/long-range dependencies across the band. Transformer employs self-attention to capture global interactions across frequencies, enabling the model to account for cross-band correlations that arise as cracks evolve. For ML, Logistic Regression provides a concise and interpretable baseline, which is useful for quickly assessing aggregate trends across parameter combinations. SVM leverages kernels to form nonlinear decision boundaries, offering stable performance when discriminative cues are intertwined across frequency bands. Random Forest is a bagging-based ensemble that is robust to noise and outliers, captures nonlinearities and feature interactions, and provides feature-importance measures that aid interpretation.
We evaluate both single-parameter and multi-parameter inputs. Single-parameter training quantifies the individual discriminative power of each electrical parameter. In practice, however, crack progression couples resistive, reactive, and phase/admittance behaviors; consequently, combining parameters yields richer representations, which in turn improves diagnostic performance and training efficiency. Accordingly, we (i) identify the best single parameter per model and (ii) expand around that parameter with complementary combinations to compare performance across models. This comparative design distills model/feature configurations that best exploit the frequency-dependent patterns of impedance spectra for stage-wise crack severity assessment.
5.3. Implementation Detail
Hyperparameter optimization for each model resulted in the selection of Adam as the common optimizer. The input layer was configured with impedance data consisting of 801 frequency points. The number of epochs and the learning rate were set to 100 and 0.001, respectively, with a batch size of 64. For LSTM, a dropout rate of 0.2 was set to prevent overfitting. In the ConvNeXt model, the kernel size was set to 3 for training.
6. Results and Discussion
6.1. Diagnostic Results with Single Parameters
In this study, six AI models—ConvNeXt, LSTM, Transformer, Logistic Regression, SVM, and Random Forest—were developed to classify the crack progression stages of SMD capacitors into nine distinct categories using impedance spectrum data, and their classification performances were evaluated.
Model performance was assessed by independently analyzing 14 individual parameters measured from the impedance spectra with metrics such as accuracy. The learning outcomes by component and model are summarized in Table 3 and Figure 8.
Table 3.
Model-wise single parameters learning results (accuracy %).
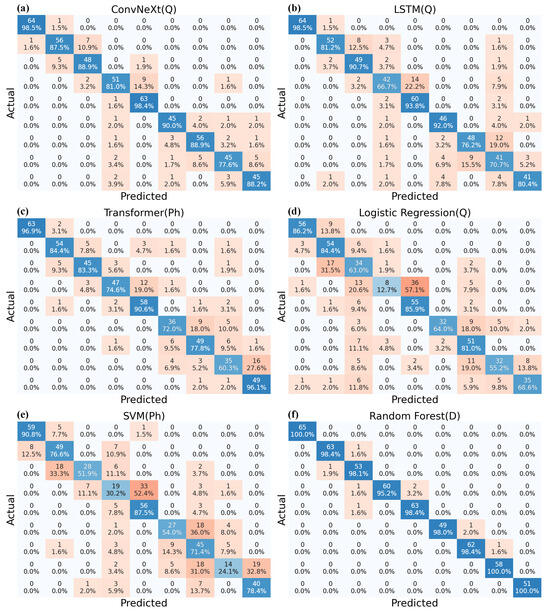
Figure 8.
Comparsion of diagnostic performance for crack severity classification using machine learning models: (a) ConvNeXt with Q, (b) LSTM with Q, (c) Transformer with , (d) Logistic Regression with Q, (e) SVM with , (f) Random Forest with D.
For the ConvNeXt model, parameter Q again achieved the highest average accuracy of 88.9%, which was followed by parameters D and Rs with accuracies of 88.5% and 86.1%, respectively. ConvNeXt showed exceptional performance for parameter Q in the intermediate (C4–C6) stages, achieving accuracies of 98.4%, 90.0%, and 88.9%, respectively. In the advanced stages (C7–C8), parameter Q showed high accuracies of 77.6% and 88.2%. In the LSTM model, parameter Q showed the highest overall average accuracy of 83.3%, followed by Rp, D, and Rs, with accuracies of 81.6% 78.0%, and 75.0%, respectively. Parameter Q demonstrated the most stable performance across crack progression stages, including early (C0–C3) and intermediate stages, maintaining consistently high accuracy. In the Transformer model, the parameter achieved the highest single-parameter accuracy at 82.0%, which was followed by D (80.8%), B (78.0%), and G (77.4%). By contrast, most other parameters yielded considerably lower accuracies, indicating that Transformer is comparatively more sensitive to phase and loss-related spectral variations. For Logistic Regression, Q delivered the best performance at 67.1% with G (59.0%), (57.1%), B (56.4%), and D (56.2%) trailing behind. This pattern suggests that the linear decision boundary primarily benefits parameters exhibiting more linearly separable distributions. In the SVM results, attained the highest accuracy at 63.3%, which was followed by Cp (61.5%), G (61.1%), D (60.3%), and B (59.0%). While kernel-based nonlinear separation offered moderate gains, particularly for and Y-related features, the overall top-end performance remained below that of the deep learning models. From a parameter-centric perspective of the single-parameter experiments, Q and D emerged as the most informative descriptors across models, while Rs consistently reflected early-stage changes with relatively stable separability. Overall, Q, D, and Rs formed the primary axes of discriminative power with and Y related features providing complementary cues. These results suggest that future crack prediction models could benefit from utilizing combinations of multiple parameters rather than relying solely on individual parameters, thereby achieving more effective diagnostic outcomes. From a model-wise perspective, LSTM leveraged the continuity of frequency-ordered sequences and exhibited stable predictive behavior in the early-to-late stages, whereas ConvNeXt captured structured spectral patterns and showed its strongest performance in the intermediate regime. Transformer was comparatively more sensitive to phase- and loss-related variations, performing well with - and D-centered signals. Logistic Regression served as a concise baseline when parameter distributions were approximately linearly separable, while SVM’s kernel-based decision boundaries provided moderate gains for features such as and Cp. In contrast, the Random Forest model initially suffered from overfitting when trained without augmented data, which was effectively mitigated through data augmentation. In addition, the model exhibited consistently high accuracies across various single-parameter inputs, demonstrating the robustness of this bagging-based ensemble method in impedance spectrum classification. These analytical insights provide valuable guidance for selecting optimal parameter combinations and models for stage-wise crack prediction using impedance spectra.
6.2. Diagnostic Results with Multi Parameters
In this study, the purpose of adopting multi-parameter learning is to capture the coupled nature of impedance responses to physical defects. Since defect-related signals arise from the interaction of resistive, reactive, phase, and admittance components, relying on a single parameter often fails to fully represent the underlying variations. By combining parameters, the learning process provides richer representations of defect evolution, leading to improved diagnostic accuracy and allowing the identification of optimal parameter sets within impedance spectra.
To this end, the best-performing single parameter for each model was first identified, and then it was used as a baseline to construct combinations by adding one additional parameter at a time. Specifically, Q was selected as the baseline for ConvNeXt, LSTM, and Logistic Regression; was selected as the baseline for Transformer and SVM; and D was selected as the baseline for Random Forest. This systematic approach enabled a comprehensive assessment of how parameter combinations influence classification performance. The learning outcomes by component and model are summarized in Table 4 and Figure 9.
Table 4.
Model-wise multi-parameters learning results (accuracy %).
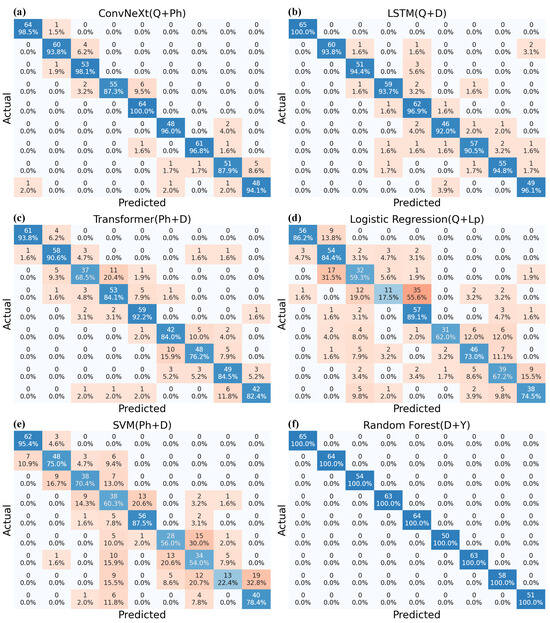
Figure 9.
Comparsion of diagnostic performance for crack severity classification using machine learning models: (a) ConvNeXt with Q + , (b) LSTM with Q + D, (c) Transformer with + D, (d) Logistic Regression with Q + Lp, (e) SVM with + D, (f) Random Forest with D + Y.
When summarizing the results of parameter combinations, Random Forest demonstrated the highest performance, achieving 100% accuracy across all combinations when D served as the baseline parameter. Following this, ConvNeXt with the Q + D combination achieved 97.0%, while LSTM with Q + D reached 94.7%. The Transformer with + D obtained 84.4%, Logistic Regression with Q + D achieved 71.4%, and SVM with + D attained 67.1%. Overall, the addition of D consistently produced the strongest improvements across models, underscoring its role as a highly discriminative parameter.
From a model-wise perspective, the advantages of multi-parameter learning are clearly reflected. For ConvNeXt (Q + D, 97.0%), the strong separability observed in the intermediate stages was preserved, while boundaries in the early and late stages became more distinct, leading to a uniformly enhanced diagonal structure. LSTM (Q + D, 94.7%) retained its ability to exploit sequential frequency continuity, providing stable predictions in early and late stages while also reducing misclassifications in the intermediate regime. The Transformer ( + D, 84.4%) maintained its sensitivity to phase- and loss-related variations, and with the addition of D, it showed notable improvements in mid-to-late stage discrimination. Logistic Regression (Q + D, 71.4%) benefited from the linear separability of Q, while D supplemented this by reducing boundary ambiguities between adjacent stages. Similarly, SVM ( + D, 67.1%) exhibited strengthened nonlinear separation, particularly in the mid-stage classes, where classification cohesion improved. Compared with single-parameter learning, multi-parameter training enhanced the clarity of stage boundaries and provided more consistent improvements across different models. The benefit was most pronounced when D was included, while even linear and kernel-based models showed meaningful reductions in misclassification for phase- and loss-related parameters. These findings underscore the practical value of multi-parameter approaches in achieving robust and stage-resilient crack diagnostics based on impedance spectra. Building upon these results, the Random Forest model (D-based combination, 100%) achieved perfect classification across all stages, demonstrating its ability to fully exploit the robustness of bagging-based ensembles and the advantages of parameter combination. Furthermore, among the AI models that exhibited diagnostic accuracy higher than 90%, such as ConvNeXt and LSTM, Random Forest required the lowest computational cost. This result verifies that the Random Forest model achieves the most optimized performance for crack diagnosis in terms of both diagnostic accuracy and computational efficiency.
6.3. Discussion
In this study, six AI classification models were developed and evaluated to classify crack severity into nine levels. From the single-parameter training results, Q and D were identified as the most reliable indicators reflecting electrical signal variations associated with crack progression, forming the basis for designing the multi-parameter learning framework. The inclusion of D consistently enhanced diagnosis performance across most models with Random Forest achieving 100% accuracy in all D-based parameter combinations. ConvNeXt (Q + D) and LSTM (Q + D) improved discrimination in the early and late stages, while Transformer ( + D) and SVM ( + D) enhanced mid-to-late stage classification by capturing phase- and loss-related features. Logistic Regression (Q + D) also alleviated boundary ambiguities, and overall, the multi-parameter learning approach reinforced each model’s inherent strengths and improved the separability among the crack severity stages.
The impedance–AI framework proposed herein can also be extended to packaging degradation diagnostics in power electronics and other interconnect systems within PHM frameworks. Furthermore, future research will focus on integrating physics-based diagnostic methods [36,37] with the proposed AI framework to establish a physically grounded interpretation of impedance features. This approach will enhance the explainability of AI decisions and strengthen the linkage between electrical responses and underlying physical damage mechanisms. Although primarily data-driven, the impedance parameters inherently encode physical effects of resistive, reactive, and dielectric changes, and future physics-guided AI integration will further enhance interpretability.
In addition, to apply the proposed approach to electronic device monitoring, it is essential not only to perform non-destructive fault inspection but also to enable online fault detection, prediction, and continuous monitoring. To this end, future work will focus on developing an AI-based fault diagnosis methodology utilizing online measurement data, which is expected to contribute to the reliability assessment of electronic packages.
7. Conclusions
In this study, we propose an impedance spectrum-based AI diagnostic framework designed to non-destructively diagnose cracks in SMD components and evaluate their severity. To achieve this, cracks were incrementally applied to specimens using a bond tester, and impedance analyzers were used to collect 14 different types of impedance spectrum data. Additionally, to ensure data diversity and capture possible variations encountered in practical environments, we performed linear interpolation-based data augmentation, resulting in a comprehensive dataset containing 87,800 samples. Although the present research classifies SMD cracks into discrete severity levels, it has inherent limitations arising from variations in actual crack severity caused by differences in soldering quality among specimens. To address this issue, future work will involve quantifying crack severity explicitly during data acquisition for improved data labeling and quantitative evaluation using regression models. Additionally, quantitative crack metrics such as crack length or damaged area will be incorporated in future datasets to enable more precise and quantitative crack diagnosis by using AI regression models.
Nevertheless, the methodology proposed herein—combining impedance spectrum analysis with AI-based models—offers significant advantages, enabling the non-destructive diagnosis of internal conditions of electronic packages without the need for product disassembly. From an industrial perspective, this method is also beneficial in reducing the cost and time required for signal acquisition compared to conventional electronic signal-based fault diagnosis techniques. To this end, we plan to propose a framework for crack diagnosis based on online measurement data in future work. Therefore, the proposed method can be practically applied in condition monitoring and maintenance strategies for electronic devices featuring expensive packages or critical systems, facilitating system failure prediction and preventive maintenance through early crack detection. Ultimately, this research contributes to enhancing the reliability and stability of electronic packaging technologies, and it is expected to serve as foundational technology for PHM in the electronics industry.
Author Contributions
Conceptualization, M.K., N.K. and T.Y.K.; Methodology, M.K., N.K., H.N., Y.-S.L. and T.Y.K.; Data curation, M.K., N.K., H.N. and T.Y.K.; Writing—original draft, M.K., N.K., Y.-S.L., H.-J.L. and T.Y.K.; Writing—review & editing, M.K., N.K., Y.-S.L., H.-J.L. and T.Y.K.; Supervision, H.-J.L. and T.Y.K.; Project administration, H.-J.L. and T.Y.K.; Funding acquisition, H.-J.L. All authors have read and agreed to the published version of the manuscript.
Funding
This study conducted with the support of the Korea Institute of Industrial Technology root advanced technology devlopment project “Development of Hybrid Bonding Technologies for Ultra-Fine Pitch Vertically Stacked Chip Fabrication (kietch EH-25-089)”.
Data Availability Statement
The raw data supporting the conclusions of this article will be made available by the authors on request.
Conflicts of Interest
The authors declare no conflicts of interest.
References
- Gómez, P.; Elduque, D.; Sarasa, J.; Pina, C.; Javierre, C. Influence of the material composition on the environmental impact of surface-mount device (SMD) transistors. J. Clean. Prod. 2015, 107, 722–730. [Google Scholar] [CrossRef]
- Straubinger, D.; Hurtony, T.; Géczy, A. Impact of electromigration and isothermal ageing on lead-free solder joints of chip-sized SMD components. J. Mater. Res. Technol. 2022, 21, 308–318. [Google Scholar] [CrossRef]
- Asmanis, A.; Stepins, D.; Asmanis, G.; Ribickis, L. 3D modelling and analysis of parasitic couplings between surface-mount components of EMI filters. In Proceedings of the 2018 IEEE International Symposium on Electromagnetic Compatibility and 2018 IEEE Asia-Pacific Symposium on Electromagnetic Compatibility (EMC/APEMC), Singapore, 14–17 May 2018; IEEE: New York, NY, USA, 2018; pp. 496–501. [Google Scholar]
- Zhou, S.; Lin, Z.; Qiu, B.; Wang, H.; Xiong, J.; He, C.; Zhou, B.; Pan, Y.; Huang, R.; Bao, Y.; et al. Evaluation of solder joint reliability in 3D packaging memory devices under thermal shock. Electronics 2022, 11, 2556. [Google Scholar] [CrossRef]
- Ma, L.; Xie, W.; Zhang, Y.; Feng, X. Extreme Learning Machine Based Defect Detection for Solder Joints. J. Internet Technol. 2020, 21, 1535–1543. [Google Scholar] [CrossRef]
- Kang, T.Y.; Seo, D.; Min, J.; Kim, T.S. Quantification of Performance Variation and Crack Evolution of Bond-Wire Interconnects Under Harsh Temperature Environments by S-Parameter Analysis. IEEE Trans. Components Packag. Manuf. Technol. 2021, 11, 990–998. [Google Scholar] [CrossRef]
- Varga, D.; Szabo, P.J.; Szlancsik, A. A review of the electric measurements and their failure criteria for solder joint degradation. Mater. Sci. Semicond. Process. 2025, 185, 108863. [Google Scholar] [CrossRef]
- Yung, L.C. Investigation of the Solder Void Defect in IC Semiconductor Packaging by 3D Computed Tomography Analysis. In Proceedings of the 2018 20th Electronics Packaging Technology Conference (EPTC), Singapore, 4–7 December 2018; IEEE: New York, NY, USA, 2018; pp. 886–889. [Google Scholar] [CrossRef]
- Mehr, M.Y.; Bahrami, A.; Fischer, H.; Gielen, S.; Corbeij, R.; van Driel, W.D.; Zhang, G.Q. An Overview of Scanning Acoustic Microscope, A Reliable Method for Non-Destructive Failure Analysis of Microelectronic Components. In Proceedings of the 2015 16th International Conference on Thermal, Mechanical and Multi-Physics Simulation and Experiments in Microelectronics and Microsystems (EuroSimE), Budapest, Hungary, 19–22 April 2025; IEEE: New York, NY, USA, 2015; pp. 1–4. [Google Scholar] [CrossRef]
- Ma, X.; Yin, Z. Cable fault detection based on enhanced spread spectrum time domain reflectometry. AIP Adv. 2025, 15, 025123. [Google Scholar] [CrossRef]
- Hoai, L.T.; Duong, A.H. Fault Detection on the Transmission Lines Using the Time Domain Reflectometry Method Basing on the Analysis of Reflected Waveform. In Proceedings of the 2016 International Conference on Sustainable Energy Technologies (ICSET), Hanoi, Vietnam, 14–16 November 2016; IEEE: New York, NY, USA, 2016; pp. 241–245. [Google Scholar] [CrossRef]
- Roy, S.; Alam, M.K.; Johnson, J.; Flicker, J. An Irradiance-Independent, Robust Ground-Fault Detection Scheme for PV Arrays Based on Spread Spectrum Time-Domain Reflectometry (SSTDR). IEEE Trans. Power Electron. 2018, 33, 7046–7057. [Google Scholar] [CrossRef]
- Auzanneau, F.; Ravot, N.; Incarbone, L. Chaos Time Domain Reflectometry for Online Defect Detection in Noisy Wired Networks. IEEE Sens. J. 2016, 16, 8027–8034. [Google Scholar] [CrossRef]
- Wu, I.C.; Wang, M.H.; Jang, L.S. Experimental location of damage in microelectronic solder joints after a board level reliability evaluation. Eng. Fail. Anal. 2018, 83, 131–140. [Google Scholar] [CrossRef]
- Xiao, H.; Guo, X.; Chen, F.; Zhang, W.; Liu, H.; Chen, Z.; Liu, J. A failure location technology for SiP devices based on TDR nondestructive testing method. Microelectron. Int. 2023, 40, 152–158. [Google Scholar] [CrossRef]
- Wang, Z.; Wang, L.; Yu, K.; Liu, S.; Wang, C. Equivalent circuit based performance coupling analysis method for lead wire interconnection with defects. Electronics 2020, 9, 642. [Google Scholar] [CrossRef]
- Kang, T.Y.; Lee, H.; Suh, S. Non-Destructive Fault Diagnosis of Electronic Interconnects by Learning Signal Patterns of Reflection Coefficient in the Frequency Domain. Microelectron. Reliab. 2024, 162, 115518. [Google Scholar] [CrossRef]
- Choe, B.; Kang, T.Y. Reliability Assessment of Solder Joints Using Electrical Model on Cracking and S-Parameter Pattern Analysis. J. Appl. Reliab. 2023, 23, 32–42. [Google Scholar] [CrossRef]
- Kang, M.; Kim, N.; Nam, H.; Kang, T.Y. Nondestructive Quantification of Corrosion in Cu Interconnects Using Smith Charts. J. Microelectron. Packag. Soc. 2024, 31, 28–35. [Google Scholar]
- Jameson, N.J.; Azarian, M.H.; Pecht, M. Impedance-Based Condition Monitoring for Insulation Systems Used in Low-Voltage Electromagnetic Coils. IEEE Trans. Ind. Electron. 2017, 64, 3748–3757. [Google Scholar] [CrossRef]
- Kwon, D.; Azarian, M.H.; Pecht, M.G. Remaining-Life Prediction of Solder Joints Using RF Impedance Analysis and Gaussian Process Regression. IEEE Trans. Components Packag. Manuf. Technol. 2015, 5, 1602–1609. [Google Scholar] [CrossRef]
- Weiss, E. Preventing Corrosion-Related Failures in Electronic Assembly: A Multicase Study Analysis. IEEE Trans. Components Packag. Manuf. Technol. 2023, 13, 743–749. [Google Scholar] [CrossRef]
- Liu, Q.; Huang, C. A Fault Diagnosis Method Based on Transfer Convolutional Neural Networks. IEEE Access 2019, 7, 171423–171430. [Google Scholar] [CrossRef]
- Saufi, S.R.; Ahmad, Z.A.B.; Leong, M.S.; Lim, M.H. Challenges and Opportunities of Deep Learning Models for Machinery Fault Detection and Diagnosis: A Review. IEEE Access 2019, 7, 122644–122662. [Google Scholar] [CrossRef]
- Kang, T.Y.; Hong, S. Non-Invasive Quantification of Corrosion in Cu Interconnects Using Regression Models with S-Parameters. IEEE Access 2025, 13, 26157–26170. [Google Scholar] [CrossRef]
- Obeng, Y.S.; Amoah, P. Evaluating solder joint failures and solder joint reliability: A side-by-side comparison of Direct Current and Microwave Based Monitoring Techniques. In Proceedings of the 2021 IPC Apex Expo Technical Conference, San Diego, CA, USA, 6–11 March 2021. [Google Scholar]
- Lee, J.; Kwon, D. A Digital Technique for Diagnosing Interconnect Degradation by Using Digital Signal Characteristics. Microelectron. J. 2017, 60, 87–93. [Google Scholar] [CrossRef]
- Shin, I.; Koo, K.; Kwon, D. Development of a Non-Invasive On-Chip Interconnect Health Sensing Method Based on Bit Error Rates. Sensors 2018, 18, 3234. [Google Scholar] [CrossRef] [PubMed]
- Mahafzah, K.A.; Obeidat, M.A.; Mansour, A.M.; Al-Shetwi, A.Q.; Ustun, T.S. Artificial-intelligence-based open-circuit fault diagnosis in VSI-Fed PMSMs and a novel fault recovery method. Sustainability 2022, 14, 16504. [Google Scholar] [CrossRef]
- Kong, D.; Hu, X.; Gong, Z.; Zhang, D. X-Ray Void Defect Detection in Chip Solder Joints Based on PCB-DeepLabV3 Algorithm; Springer: Berlin/Heidelberg, Germany, 2023. [Google Scholar]
- Zhang, Q.; Zhang, M.; Gamanayake, C.; Yuen, C.; Geng, Z.; Jayasekara, H.; Woo, C.; Low, J.; Liu, X.; Guan, Y. Deep learning based solder joint defect detection on industrial printed circuit board X-ray images. Complex Intell. Syst. 2022, 8, 1525–1537. [Google Scholar] [CrossRef]
- Zhan, D.; Lin, J.; Yang, X.; Huang, R.; Yi, K.; Liu, M.; Zheng, H.; Xiong, J.; Cai, N.; Wang, H.; et al. A lightweight method for detecting IC wire bonding defects in x-ray images. Micromachines 2023, 14, 1119. [Google Scholar] [CrossRef]
- Sehri, M.; Hua, Z.; de Assis Boldt, F.; Dumond, P. Selective Embedding for Deep Learning. Knowl.-Based Syst. 2025, 330, 114535. [Google Scholar] [CrossRef]
- Sehri, M.; Varejão, I.; Hua, Z.; Bonella, V.; Santos, A.; Boldt, F.d.A.; Dumond, P.; Varejão, F.M. Towards a Universal Vibration Analysis Dataset: A Framework for Transfer Learning in Predictive Maintenance and Structural Health Monitoring. arXiv 2025, arXiv:2504.11581. [Google Scholar] [CrossRef]
- Bani Hani, D.; Al Athamneh, R.; Abueed, M.; Hamasha, S. Reliability modeling of the fatigue life of lead-free solder joints at different testing temperatures and load levels using the Arrhenius model. Sci. Rep. 2023, 13, 2493. [Google Scholar] [CrossRef]
- Wu, X.; Yang, X.; Ye, J.; Liu, G. Novel Prognostics for IGBTs Using Wire-Bond Contact Degradation Model Considering On-Chip Temperature Distribution. IEEE Trans. Power Electron. 2025, 40, 4411–4424. [Google Scholar] [CrossRef]
- Kwon, D.; Yoon, J. A model-based prognostic approach to predict interconnect failure using impedance analysis. J. Mech. Sci. Technol. 2016, 30, 4447–4452. [Google Scholar] [CrossRef]


Disclaimer/Publisher’s Note: The statements, opinions and data contained in all publications are solely those of the individual author(s) and contributor(s) and not of MDPI and/or the editor(s). MDPI and/or the editor(s) disclaim responsibility for any injury to people or property resulting from any ideas, methods, instructions or products referred to in the content. |
© 2025 by the authors. Licensee MDPI, Basel, Switzerland. This article is an open access article distributed under the terms and conditions of the Creative Commons Attribution (CC BY) license (https://creativecommons.org/licenses/by/4.0/).