Abstract
Earth-moving vehicles (EMVs) are vital in numerous industries, including construction, forestry, mining, cleaning, and agriculture. The changing nature of the off-road environment in which they operate makes situational awareness for readiness and, consequently, mental stress crucial for drivers and requires a high level of controllability. Therefore, the monitoring of drivers’ acute stress patterns may be used as an input in identifying various levels of attentiveness. This research presents an experimental evaluation of a physiological-based system that can be useful to evaluate the readiness of a driver in different conditions. For the experimental validation, physiological signals such as electrocardiogram (ECG), galvanic skin response (GSR) and speech data were collected from nine participants throughout driving experiments of increasing complexity on a specific simulator. The experimental results show that the identified parameters derived from the acquired physiological signals can help us understand the driver status when performing different tasks, the engagement of which is related to different road environments. This multi-parameter approach can provide more reliable information compared to single parameter approaches (e.g., eye monitoring with a camera) and identify driver status variations, from relaxed to stressed or drowsy. The use of these signals allows for the development of a smart driving cockpit, which could communicate to the vehicle the driver’s status, to set up an innovative protection system aiming to increase road safety.
1. Introduction
Driving a vehicle represents, in general, a complex task that requires different and particular skills, especially when this is not performed in a standard environment, such as on a road or highway, or when the vehicle itself is not a standard one, such as a car or a motorbike. Moreover, in working environments, the difficulty increases due to both many distracting factors and to the use of more complex vehicles, such as earth-moving vehicles (EMV). To limit the risks in these situations, specialized personnel must be carefully instructed regarding the use of EMVs, and these can be equipped with specific safety systems that can help in hazardous situations. The International Organization for Standardization (ISO) has defined functional safety standards (e.g., ISO 19014-1) for EMV [1], such as the Articulated Dump Truck (ADT). According to ISO 19014-1, the concept of controllability is related to the ability of the driver to avoid harm being caused to people through the timely reactions of the operator, possibly with the support of alternative controls [1].
Because the off-road environment in which EMVs are deployed (e.g., mining environments or quarry sites) is not uniform, situational awareness (i.e., the perception and understanding of information that enables an individual to predict future courses of action needed to respond to a dynamic environment) is very important [2]. Georg et al. define the term readiness as the driver’s ability to engage in driving by starting with a non-driving-related activity (NDRT), such as tuning the radio volume or having a mobile phone conversation [3]. Many models have been proposed for monitoring driver status based on monitoring the driver’s behavioral or physiological signals [4]. In more detail, these methods (especially those based on physiology) often rely on the use of a single technology. However, the use of a combined set of parameters, as proposed in this paper, can provide higher performance in terms of detection accuracy while maintaining low intrusiveness and ensuring usability. Moreover, while in the case of dynamic tasks it is generally more appropriate to use kinematic sensors to detect different behaviors [5,6], it has been widely shown that the use of physiological parameters in specific tasks can be a valuable indicator for subjects’ adaptation to new conditions [7]. In fact, as observed in [8], to achieve higher controllability, the smart vehicle should be equipped with sensors for monitoring the drivers’ situational awareness. In the literature, the link between alertness and mental stress has been assessed by measuring human physiological features [2,9]. To this aim, muscle activity, heartbeat, sweating, respiration rate, speech, and blood pressure have been exploited to estimate the user’s acute stress [10,11,12].
In this paper, we analyze a specific situation in which the state of the driver may change several times during operations. In a previous work, we proposed a physiology-based human situational awareness model for road vehicles [8]. In this work, the model is tested and validated on an ADT simulation driving environment. The tests were divided into three phases: (1) driver identification, (2) awareness definition, and (3) voice interaction.
In the first phase, the driver is identified and an enrollment procedure is performed. In this phase, the user’s physiological signals are collected under resting or non-stressful driving conditions. Data can be stored locally to take advantage of edge-based computing architectures.
Next, changes in drivers’ physiological signals, such as heart rate variability (HRV), galvanic skin response (GSR) and speech, are monitored to estimate the driver’s state of stress or drowsiness. These data can be used to inform the driver and the vehicle managing system about the current awareness condition. In the third phase, speech analysis is performed through voice interaction between the vehicle managing system and the driver, and data are used to support the situation awareness condition.
To complete the model definition, a vehicle task demand phase could be added. In this phase, the computational cost necessary to a semi-autonomous vehicle to avoid a potential danger or the cognitive engagement overload of the driver during a hazardous situation must be analyzed and assessed [13].
The proposed assessment system is validated through an off-road driving environment. The validation of the model in [8] was limited to whether the selected sensors could be used to acquire physiological signals in a potential stress situation, that is, completing the Stroop test and some arithmetic calculations.
Here, we go further by implementing the whole system in a complex scenario and validating it in an ADT simulator driving environment. The validation is based on real-time non-invasive acquisition and processing of the heart activity and galvanic skin response signals, together with speech data.
The rest of the paper is organized as follows. In Section 2, we recall essential background information. In Section 3, we describe the materials and the methods used in the performed experiments. In Section 3.4, we describe the performed analysis. In Section 4, we present and discuss the experimental analysis. Finally, in Section 5, conclusions are drawn.
2. Background
As mentioned in Section 1, to obtain higher controllability, it is important to monitor the drivers’ situational awareness for readiness. Such situational awareness depends on the drivers’ acute stress pattern. Hence, understanding the relationship between situational awareness for alertness and the human nervous system is significant. To this purpose, in the following, essential information on the situation awareness for readiness and on the human nervous system and stress are reported.
2.1. Situation Awareness for Readiness
According to ISO 19014-1, the driver has an important role in the overall control loop [1]. That is, the driver must be fully aware of the surrounding environment [14]. In general, humans perform their tasks in a similarly closed-loop control system manner. In this case, most of the input comes from the environment through the elements of human perception (i.e., sight, hearing, touch, smell, taste, etc.).
To achieve situational awareness, the driver goes through three stages: perception of the current situation, understanding of the current situation, and projection of the future state [2]. With good situational awareness, the driver can make appropriate decisions. Situational awareness for readiness depends on mental stress. Continuous monitoring of drivers’ acute stress pattern from the vehicle itself or from the control room can lead to the mitigation of unexpected risks.
2.2. Human Nervous System and Stress
Stress can, in general, be associated with a chemical change within the human body. It can be regarded as defensive behavior while trying to cope with difficult situations at work, relationships, the environment, etc. According to the American Physiological Association (APA), stress is classified into three stages, namely acute, episodic acute, and chronic [15]. Acute is considered as a short-term stress [16]. Longer survival of acute stress leads to episodic and chronic stress [16]. A sharp drop in acute stress can be identified through biomedical signals that are controlled by the Central Nervous System (CNS). In general, CNS can be broadly classified into the Somatic and Autonomic Nervous System (ANS) [17]. ANS is further classified as the Sympathetic Nervous System (SNS) and Para-Sympathetic Nervous system (PSN).
Acute stress situations stimulate the SNS, thus modifying the heart rate, sweat secretion, speech variation, etc. [18].
In contrast, when acute stress decreases, the PNS attenuates the elevated energetic function caused by the SNS through a decrease in heart rate and sweat secretion, achieving normal speech, etc. [19]. Summarizing, the sympathetic and parasympathetic nervous systems lead to various changes in body organs (i.e., heart, pupil, sweat gland, lungs, blood vessels, liver, etc.). These variations can be exploited for stress detection purposes.
2.2.1. Heart Rate Variability and Acute Stress
Since the ANS has a direct influence on the heart, measuring the cardiac activity can be a valid non-invasive technique for evaluating the state of the ANS itself. The electrocardiogram (ECG) is the signal associated to the electrical activity generated by the heart over a specified period. It is a multi-component, non-stationary signal and is characterized by the repetition of a similar pattern that includes a maximum peak usually referred to as an R wave, at ventricular depolarization [20]. From this signal, the R-R intervals, each one representing the time interval between two consecutive R peaks, can be extracted.
The obtained signal is called tachogram and its frequency components can provide relevant information on the ANS status.
The analysis of the QRS complex, to extract the R time location, is based on the evaluation of its slope, amplitude, and by exploiting the Pan–Tompkins algorithm [21]. To understand the ANS state, the percentage of involvement of SNS and PNS can be estimated by spectral analysis of the tachogram [9]. Vincente et al. [22] proposed an episode estimator by analyzing the driver’s ECG data every minute. Through their experiment, it was shown that the HRV is influenced by the stress/drowsy state, although the results were hypothetical (as shown in Figure 1). In these situations, other physiological signals, such as those related to GSR and speech, must be exploited to improve the accuracy of estimation.
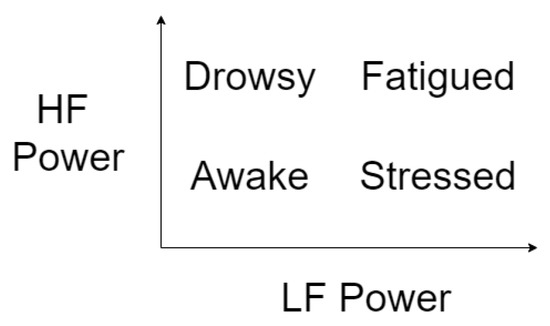
Figure 1.
Hypothetical situation as a function of LF and HF power of HRV [22].
2.2.2. Galvanic Skin Response and Acute Stress
GSR refers to the electrical resistance of the skin that may reflect the intensity of emotional state or arousal [23]. An increase in skin conductance is proportional to the sweat secretion. The level of emotional arousal varies depending on the situation. For example, when an individual is in a frightening, threatening, or emotionally relevant situation, due to the impact of ANS, the SNS the activity of the sweat glands is more intense and the conductance of the skin increases. Therefore, the skin conductance can also be an indicator of sympathetic activity due to acute stress reaction. The number of sweat glands varies throughout the body, while the highest amount of sweat glands are found in the region of the hands and feet (200–600 sweat glands per cm ) [24]. Skin conductance, measured in the units of micro-Siemens (μS), is captured using skin electrodes placed on the hand’s palm.
2.2.3. Speech and Acute Stress
Acute stress detection based on lack of articulation in speech production is considered an effective approach. It is well known that when a speaker experiences acute stress, the contraction of the crycothyroid muscles causes higher tension, while the activity of thyroarytenoid muscle becomes relatively low. This decrease of activity causes a lack of articulation in speech production [25]. Murray et al. [26] showed that during a stressful situation, a change in speech is observable due to the consolidation of unconscious response and/or conscious control.
The speech signal undergoes four stages [27]:
- Actuation for the speech output initiates from the lungs by generating enough air.
- Next, in the vibrator, the generated air pressurizes the vocal fold from the lower surface and causes the vocal folds to open from the upper side. As it passes through the vocal folds, the pressurized air produces a vibrating sound due to the momentary closure of the glottis (i.e., the space between the vocal folds).
- In the resonator, the vocal track emphasizes by amplifying the sound.
- The sound is shaped and a meaningful unit is achieved using tough and lip radiation.
3. Materials and Methods
To collect signals used for evaluating the driver status, a specific setup has been studied aiming to minimizing the invasiveness of the sensors while being used during EMV driving simulations. The adopted solutions can be easily integrated in a driving environment by including sensors in the steering wheel or in the dashboard of the vehicle. Moreover, a specific experimental protocol has been designed and implemented to validate the use of adopted sensors and methodology.
In this section, the data acquisition sensors and the experimental protocol adopted for validating the system are described.
3.1. Data Acquisition Devices
In this study, subjective experiments were conducted in order to collect the physiological and the voice signals by using a commercial sensor kit (i.e., e-Health platform) interfaced with a shield connected to an Arduino Uno board. The E-Health sensor shield allows the acquisition of nine biomedical signals. For our purposes, only two signals have acquired: ECG and GSR [28]. Since we are interested in identifying the QRS peaks from the ECG signal, this was band-limited using a low pass anti-aliasing filter with a cut-off frequency components of 100 Hz and data were recorded at 325 Hz. To guarantee a proper synchronization with signal recordings, the same setup was used for the GSR signal. The disposable ECG sensor electrodes (Figure 2) were placed on the body in the classical lead configuration considering the Right Arm (RA), the Left Arm (LA), and the Left Leg (LL). The skin conductance was measured at the base of two fingers (see Figure 3) of the left hand by measuring the electrical current that flowed as a result of applying a constant voltage. A preliminary recording was made of the ECG and GSR signals under resting conditions to obtain a baseline signal used during processing as a reference for the signals recorded in the different minutes of the tests.
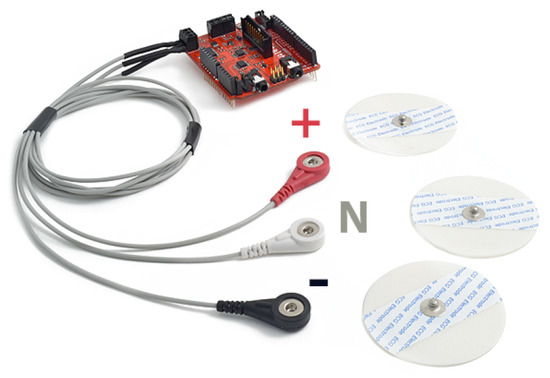
Figure 2.
ECG electrode connected to e-Health sensor shield.
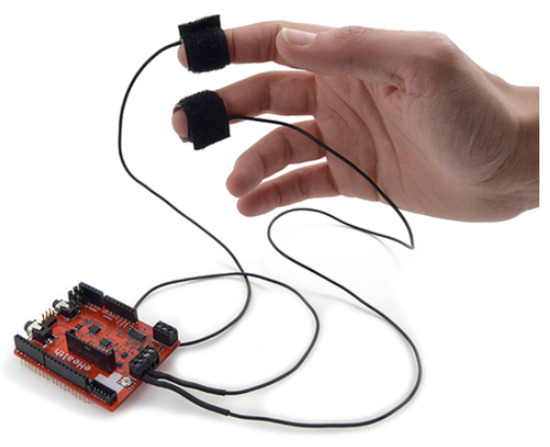
Figure 3.
GSR electrode connected to e-Health sensor shield.
To collect a homogeneous voice signal among participants, drivers were asked during the tests to explain each action they performed while driving (e.g., “I want to increase the gas pedal because I have a good road to drive” or “I want to take left because this track is not comfortable”, etc.). In the meanwhile, they were asked to provide dashboard information on demand every minute (such as km, engine rpm, loaded vehicle information, etc.). To record the voice signal, a sampling rate of 22 kHz has been set. This rate was selected because it helps in achieving higher accuracy on the acquired signal. To standardize all voice recordings, an external microphone was placed at a distance of 5 cm from the volunteer’s mouth. To synchronize the acquisitions by both e-health sensors and the microphone, data were recorded using a custom interface developed in LabView (@National Instruments).
3.2. Driving Simulator
Aiming to stimulate the acute stress for the driver, in these experiments we put the driver into some challenging virtual environments subjected to a time constraint. In more detail, challenging situations refers to the demand for drivers’ complete attention to avoid physical or mental harm. As the ADTS machine works under two Degrees of Freedom (DOF), which could bring a physical palpitation for the driver while the machine runs in a muddy deep slope, marshland, etc. (see Figure 4).
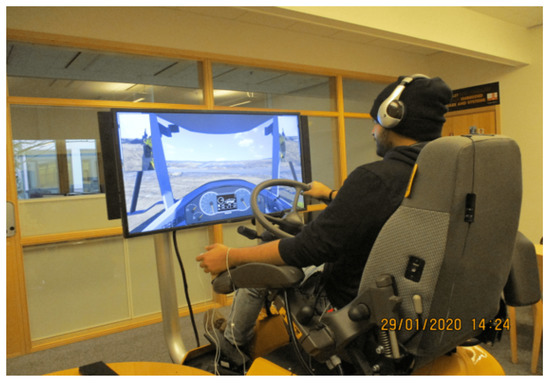
Figure 4.
Articulated dump truck simulator.
In such a situation, the driver may feel as if he or she is falling out of the simulator even when the seat belt is fastened. Similarly, the driver’s long-term presence in a virtual environment can cause mental discomfort such as vomiting, headaches, etc. The presence of acute stress could be analyzed through ANS-controlled physiological organs, i.e., ECG, GSR, and speech. The experiment was divided into three stages; each part was designed with some challenging virtual environment situations with the aim of inducing acute stress (as shown in Table 1). The interval between each experiment was 3 min. Our hypothesis is that HRV, GSR, and speech data, properly combined, are good indicators for estimating the subject status variation. If the HRV power and GSR levels are high, compared to the normal ones, then the subject might be under acute stress; similarly, low levels could indicate drowsiness. Additionally, the HRV power and GSR levels also pave the road to a hypothetical situation (Figure 1), and the use of speech helps in giving a significant interpretation to the driver status, for better estimation.

Table 1.
Experiment situation and levels of toughness with regard to time (minute).
3.3. Experimental Protocol
Nine male volunteers were monitored, gathered from students of Mälardalen University, Västerås, Sweden. Each volunteer holds a driving license with a minimum of two years of driving experience. During the test, volunteers demonstrated their ability to use the driving simulator to conduct EMV simulations in the virtual environment, even with a short preliminary familiarization test (without data recording). An informed consensus was signed by each volunteer. The following driving instructions were provided: description of the setup, shifting procedures, and availability of information in virtual reality (e.g., vehicle speed, vehicle load, stopwatch for completing the activity, and overview of the route map). In addition, safety instructions such as fastening the seat belt, precautions regarding the electrodes, and the microphone were provided to the volunteers. An ADTS driving practice phase was allowed to enable the volunteer to become accustomed to the driving system. The experiment was conducted in a room with a temperature of about 20 °C–22 °C.
To generate acute stress in the volunteer, three experiments have been designed each one structured in three parts of different engagement and difficulty (Table 1).
- Experiment 1: In this experiment, the driver is asked to drive the unloaded ADTS on the assigned track. This activity must be completed in 5 m, which requires the user to drive fast. However, due to the size of the vehicle, to avoid accidents (e.g., collision with vehicles, obstacles or vehicle rollover), it is necessary to maintain control of the vehicle.In the following, the peculiarities of the path are described:
- During the 1st minute, the driver runs the vehicle in a smooth landscape.
- During the 2nd minute, the road becomes muddy and bumpy.
- At the end of the muddy road, the driver reaches a muddy deep slope (around the 3rd minute).
- Driving in these road conditions requires more control of the ADTS. Reaching the end of the muddy slope, the driver must turn right 180° and drive along a flat stretch of road, approximately during the 4th minute.
- Later, approximately during the 5th minute, the user drives the ADTS on a marshland road.
- The interval between the 1st and the 2nd experiment is set to 5 m.
- Experiment 2: In this simulation, the user drives the ADTS in the same mining field used in experiment 1. However, before proceeding on, the driver must load the ADTS. The time limit to complete the simulation is 5 m.
- In the 1st minute, the driver must reverse the ADTS on a narrow path to reach the position set for the loading procedure. Once the ADTS is correctly positioned, a sound is generated and the excavator proceeds to load the vehicle.
- During the next few minutes, the user drives the fully loaded ADTS (40 tons) on a muddy road. The ADTS reaches the muddy road during the 3rd minute of the experiment.
- Thereafter, the flat road is reached during the 4th minute, and then the deep steep muddy road during the 5th minute of the experiment.
- The interval between the two experiments is set to 3 m.
- Experiment 3: The driver drives the ADTS in the same mining field but during the night. Both the duration and the execution of the simulation follow the previous simulation. Experiment 3 will end by driving him into a swamp, that is, during the 5th minute.
3.4. Data Analysis
3.4.1. Feature Extraction
The data have been analyzed with a 60s frame window. This length allows an effective update of drivers’ psychological condition [29,30]. The growth rate was used to compare the results obtained in the different minutes of the tests with the preliminary registration of ECG and GSR signals performed in resting conditions, used as baseline. The growth rate has been calculated as the ratio between the measured parameter in each minute and the baseline one.
HRV Analysis
The HRV analysis consists in the evaluation of the natural irregularity of the heart rhythm that can be achieved extracting a derived from ECG time signal and evaluating its frequency features. In the time domain analysis, the RR intervals (mean heart rate (mean HR): i.e., the distance between two consecutive R peaks of the QRS complex of a cardiac cyclic activity), the mean heart rate and the standard deviation of RR-intervals are extracted from the acquired ECG signals using a specific algorithm [21]. Then, a spectral analysis of the RR series is conducted to evaluate ANS functioning, considering different frequency intervals:
- Low frequency (LF), defined in the range 0.04–0.15 Hz, represents the component mainly associated with the involvement of the SNS;
- High Frequency (HF) defined in the range 0.15–0.4 Hz represent the component mainly associated to the involvement of the PNS.
A useful parameter to evaluate the changing from the rest to the attention status is the HRV power, that is defined as the LF/HF ratio and is used as an index of autonomic balance.
In this work, each set of data has been segmented with 1m time window. Salahuddin et al. [29] claimed that ultra short term analysis in the spectral domain is feasible for features such as HF, LF, LF/HF with 50 s of data. In addition, Takahshi et al. [30] proved that spectrum analysis for the above mentioned HF and LF based on HRV analysis, the results of recording ECG of 30 s to 1 m are still comparable to the 5 m ECG.
GSR Analysis
GSR is used for measuring sympathetic activation related to acute stress. As the skin conductance varies, the GSR can detect small changes [31]. The signal is processed according to the scheme reported in Figure 5.
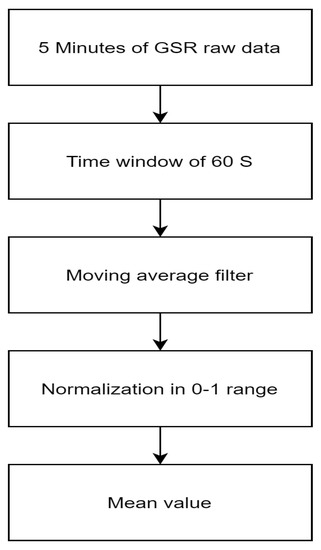
Figure 5.
Algorithm used for GSR analysis.
For a fast estimation of sympathetic activity each of the raw GSR signal is time-windowed for 60 s. Then, the signal is filtered using a moving mean technique with a window size of 400 samples. Finally, the filtered signal is normalized in the range of as follows:
where x = (, ..., ) is the filtered data and is the i-th normalized data [32,33]. The increase in the average value compared to the norm confirms the involvement of the SNS. Conversely, the decrease in value demonstrates the induction of the PNS.
Speech Analysis
To obtain different time interval estimations, the speech signal, which was sampled at 22 kHz, is discretized into 5 s time windows. Next, the silent zone is removed using an amplitude threshold of 0.01. To understand if the signal is either voiced or unvoiced, the pitch value is computed. To this aim, the resulting speech signal is further segmented into frames by using a Hamming window with a size of 660 samples (30 ms) and with an overlap of 110 samples (5 ms). After windowing and computing the autocorrelation over the range of lags, the peak is located. The pitch value is computed using the sampling frequency value over the position of the first positive peak lag. The periodicity of the signal waveform and also the uniform delay difference between the peaks of the autocorrelation function explain whether the incoming speech signal is voice or non-voice. In addition, for the voice signal, the pitch (or) fundamental frequency is searched in the range [70–450] Hz. Similarly, for the spectral slope estimation, the voiced signal is isolated for the fundamental frequency (i.e., 70–450 Hz). The unvoiced areas were excluded from our analysis.
Air pressure generated by the lungs, which initially pressurizes the vocal folds into vibration, causes the glottal pulsation that serves to excite the speech production mechanism. This greatly influences analyzing the role of glottal flow from the speech signal. Inverse filtration is a widely used technique for estimating glottal excitation, which still suffers from problems such as: (i) the result of inverse filtration depends on the quality of the input signal, with a long closed phase of glottal source, (ii) while the vocal track identification is manually performed, the estimation of the glottal source depends on subjective criteria, and (iii) the results also depend on the quality of input signal [34].
To overcome these issues, in order to estimate the glottal source signal, we adopt the Iterative Adaptive Inverse Filtration (IAIF) method [34] using the linear prediction for the estimation of vocal track response. The vocal track effects are removed using IAIF in an iterative manner to achieve the appropriate estimation of the glottal source signal. To obtain the spectral envelope for the voiced speech and its glottal waveform, Linear Predictive Coding (LPC) estimation was performed. LPC estimation is used to construct the LPC coefficient for the inverse transfer function of the vocal track [35]. For better estimation of the LPC coefficient, the input signal should be stationary/vocal; this greatly reduces error signals (i.e., LPC analysis) [35]. Similarly, the size of the LPC coefficient vector depends on the order, which is computed by (/(2*)). The magnitude spectrum envelop is computed using the Fast Fourier Transform (FFT). Finally, to obtain the spectral envelop, linear regression is applied to the spectral tilt line. The non-parametric Probability Density Function (PDF) histogram was computed for the input time windowed signal. The number of bins used in the histogram is 20. The same procedure was repeated for all voiced segments and their glottal waveform. To perform statistical comparison among the non-normally distributed data, the Wilcoxon signed-rank test was used [36]. The glottal and voiced spectral slopes of the neutral signal are compared to the spectral slope of varied voiced and its glottal signal. The individual difference of the distributions is statistically significant if the p < 0.10. Thus, we obtain two sets of data, i.e., the p-value for the voiced and the glottal. Table 2, Table 3 and Table 4 are obtained from the average between the p-values of voiced and glottal. The data population in Table 2, Table 3 and Table 4 is not uniform because of the fact when the involvement of the driver increases the probability of his/her speech might be limited unless the speech is integrated within the experimental protocol [8]. Since the population of voice data is not uniform, it was not possible to perform a statistical comparison similar to that of other physiological data (e.g., HRV and GSR).
Table 2.
Average p-value for speech signal with regard to time (minute) for Experiment 1 (p-value below the threshold of 0.10 is marked using *).
Table 3.
Average p-value for speech signal with regard to time (minute) for Experiment 2 (p-value below the threshold of 0.10 is marked using *).
Table 4.
Average p-value for speech signal with regard to time (minute) for Experiment 3 (p-value below the threshold of 0.10 is marked using *).
4. Experimental Results and Discussion
4.1. Experiment 1
Considering the results of experiment 1, during the 1st minute of the drive (i.e., refer Table 1, smooth road drive) the growth rate of HRV power and GSR (i.e., refer Figure 6 and Figure 7), with respect to the normal driving situation, do not show significant variations.
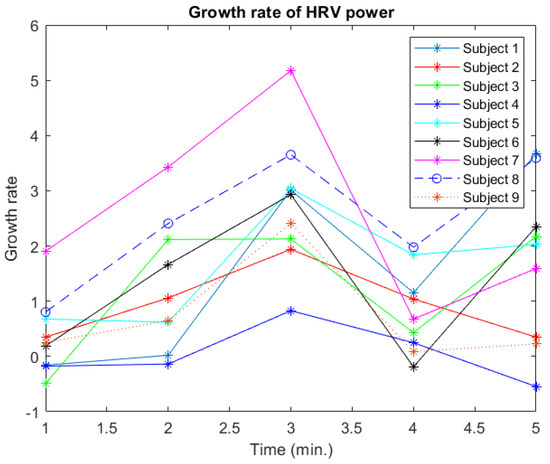
Figure 6.
Experiment 1 growth rate of HRV power.
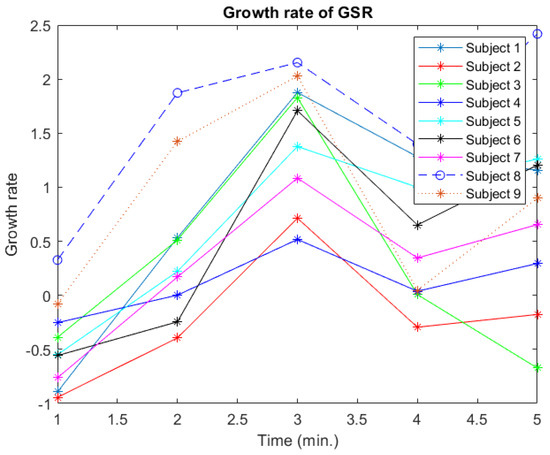
Figure 7.
Experiment 1 growth rate of GSR.
In the following minutes, the increasing engagement of the required driving tasks (i.e., refer to Table 1, muddy road drive) results in different trends of the driver’s physiological signals. According to experiment 1, both indicators reveal higher values of the grow rate during the 3rd minute of the drive, i.e., driving the ADTS in a deep muddy slope, thus indicating a higher effective engagement of the driver in the requested task. In this situation, the demand of situational awareness for readiness escalates, and consequently a phase of acute stress seems to be revealed. On the other hand, the increase in heart rate and sweat might also be interpreted as the induction of activeness [22]. In this specific context, the use of the driver speech variation could help to confirm the stress or activeness.
While incorporating the speech signal during such a hypothetical situation, according to speech Table 2, drivers 3, 5, and 9 are in a stressful state while the others are under active condition. Similarly, driver 9 seems to have a relevant variation in the physiological signal from the initial minute until the end of the experiment.
On the other hand, in the 4th minute of experiment 1, due to higher controllability over the vehicle, the virtual environment starts becoming comfortable for many drivers accordingly the growth rate values of HRV power and GSR that initiate to plummet (refer: Figure 6 and Figure 7). Finally, the last minute of the same experiment (i.e., driving in the marshland, which is as arduous as the 3rd minute of experiment 1) again shows an overall increase in values.
From this first experiment, it is possible to notice that the variation of driving conditions induces noticeable physiological effects on all the tested drivers: the third minute of the test reveals an “awake” of each subject from the almost-drowsy situation of the first minute. Moreover, when a less demanding road condition is presented, the physiological situation comes back to what was revealed in the initial phase of the test. Both HRV and GSR are in agreement with this result, and the speech signal confirms this in most of the cases.
4.2. Experiment 2
The results for the analysis of experiment 2 are reported in Figure 8 and Figure 9: the initial parts for both experiments 1 and 2 are similar, so no significant variations can be observed in the signal data related to the driver’s physiology.
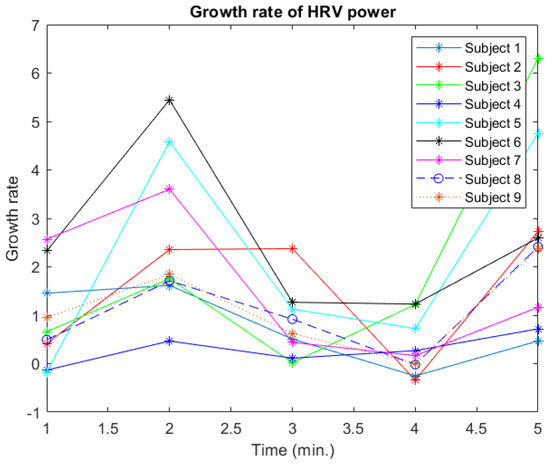
Figure 8.
Experiment 2 growth rate of HRV power.
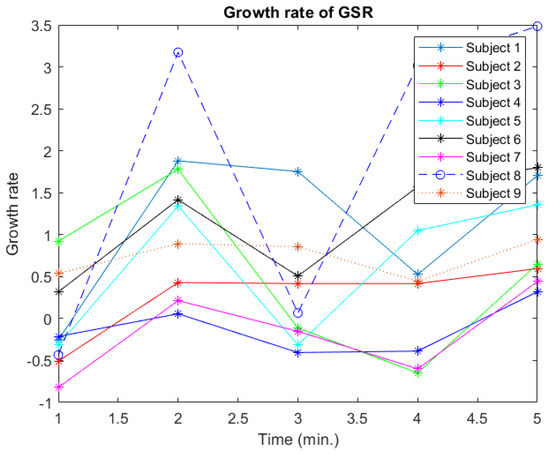
Figure 9.
Experiment 2 growth rate of GSR.
During the initial part of this experiment, the driver reverses the vehicle in a smooth road, and similarly, experiment 1 was conducted in a forward track (refer Table 3). When the task becomes more challenging, once again variations of the parameters related to driver’s physiology are visible.
The variations appear for most drivers during the 2nd minute (i.e., driving 360 the 40 tons loaded truck in a traffic muddy road) with an increase of the HRV and GSR growth rate values. Once again, these changes can be associated to increased awareness or stress.
The analysis of the speech signal (reported in Table 3) shows that drivers 8, and 9 can be considered as stressed, while the others can be considered as higher situation awareness. In the following minutes (i.e., 3rd and 4th minute) due to the less challenging task, the values associated to HRV and GSR show lower values (Figure 8 and Figure 9).
During the final phase of the experiment 2, the loaded truck must be driven in a marshland, which influences again the drivers physiological data, as consequence of an higher and more challenging situation. Results show an unstable situation among subjects: data related to HRV and GSR are different with respect to the previous minute for most of the subjects do not showing neither a stressful or a normal driving common trend. This behavior could be due to each subject’s different experience of using a simulator.
4.3. Experiment 3
Similar to the others, the results of Experiment 3 show significant changes in volunteers’ physiological performance in each specific situation. As can be noticed in Figure 10 and Figure 11, during the first minute of experiment 3, the growth rate of HRV and GSR power is very similar to that of the initial minutes of experiments 1 and 2.
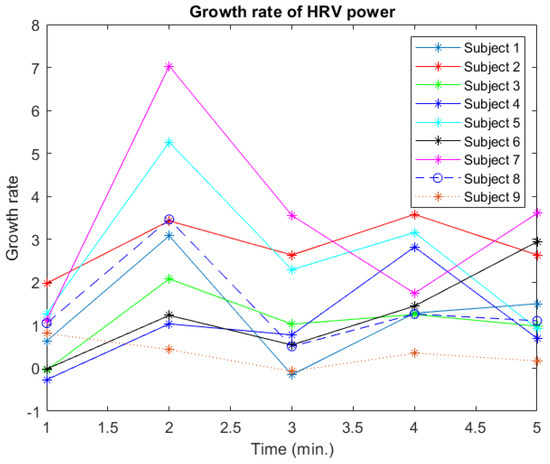
Figure 10.
Experiment 3 growth rate of HRV power.
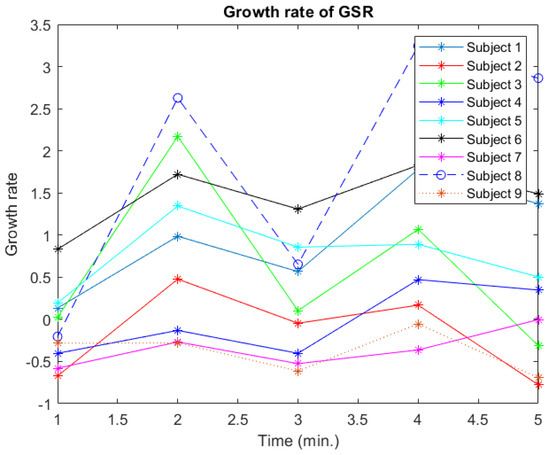
Figure 11.
Experiment 3 growth rate of GSR.
This is due to the fact that during this situation, the task handled by the driver is in effect less engaging. Then, considering the 2nd minute (i.e., driving a 40 metric ton-loaded truck in a traffic muddy road with a dark virtual environment) a consistent increase of the growth rate values of HRV power and GSR is shown.
Also in this case, the speech analysis results, reported in Table 4, contributes to assessing the presence or absence of acute stress in each driver. When the driving difficulty in the experiment decreases (i.e., refer Table 1) physiological data show once again (i.e., during 3rd and 4th minutes) a decrease in both trends (i.e., refer Figure 10 and Figure 11). Meanwhile, for the same period in the speech Table 4 found to have the average p-value greater than the threshold of 0.10. Finally, considering the 5th minute, the increase in the difficulty level of the experiment is reflected in the growth rate of HRV and GSR. However, in this time frame (i.e., 5th minute of this experiment), from the Table 4 it is clear that no acute stress situation occurred in any driver. This experiment shows that a change in driving conditions induces a change in physiological signal in all drivers tested: as in experiment 2, the most demanding situations are presented in minutes 2 and 5, and in both cases the responses of HRV and GSR are very similar and close to the demanding situation presented in the 3rd minute of experiment 1. In addition, in these cases, the speech signal produces result similar to what was revealed by HRV and GSR in most of the cases.
4.4. Statistical Comparison
4.4.1. Experiment 1
The results for both HRV and GSR values have been grouped and represented in five different boxplot (i.e., for each minute of a test), for all the performed experiments.
Considering the box plot of experiment 1 (Figure 12), during the 1st minute of the experiment almost three quartiles of growth rate for HRV power and GSR are closer to the normal drive situation with lower mean values (i.e., refer to Table 5). Meanwhile, a significant increase of mean values is visible during the 2nd and the 3rd minute of experiment 1. Similarly in Figure 12, during the 4th minute of experiment 1, a significantly lower shift appears in all quartiles, which is due to the diminished challenging task. The increased engaging in the 5th minute is reflected in the parameters’ mean value (i.e., Table 5). To understand if different minutes reveal significant differences in the driver status, using the described HRV and GSR growth rate values, a one-way ANOVA analysis [37] has been performed considering five different coupled situations, depending on the experiment.
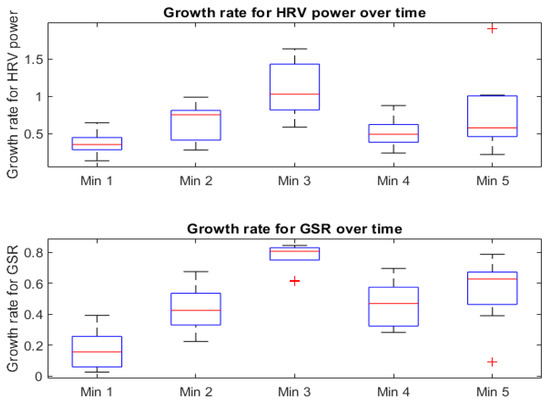
Figure 12.
Experiment 1 Box plot for Growth rate HRV power and GSR.
Table 5.
Mean and standard deviation of Experiment 1 with respect to time (minutes).
For the Experiment 1, accordingly to what shown in Table 6, the significant differences in the growth rate for HRV power and GSR have been tested for minutes 1vs3, 3vs4, 1vs4 and 1vs5.
Table 6.
Experiment 1 p-values. (p-value below the threshold of 0.05 is marked using *).
Data show that values are significantly different for minutes 1 and 3, thus confirming the different status of subjects in the two driving conditions, due to the fact that during the 3rd minute of the experiment the drives face an higher demanding situation compared to the initial phase of the experiment. Similarly, comparing minutes 3 and 4, and minutes 1 and 5, different situations are significantly highlighted. While considering the differences between the 1st and 4th minute, the p-value turns out to be higher than 0.05, so the null hypothesis is considered to be true for the growth rate of HRV (and not for the GSR). Since the driving situation in this case is similar, the GSR value reveal apparently a different that is not present, but this can be due to an higher sweat on the finger in the previous phase that leads to a lower update for the new condition. In addition, the global difference for both the parameters show p-values lower than 0.05, so the null hypothesis is rejected confirming a global difference for driving situations and validating the effectiveness of this objective assessment methodology.
4.4.2. Experiment 2
By observing the box plot for experiment 2, i.e., Figure 13, the 1st minute quartiles for the growth rate of HRV and the GSR were found to be lower than the other stages of the experiment with a lower mean value (i.e., Table 7).
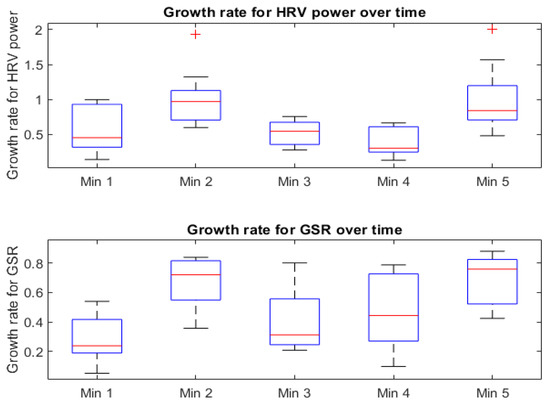
Figure 13.
Experiment 2 Box plot for growth rate of HRV power and GSR.
Table 7.
Mean and standard deviation of experiment 2.
Afterwards, due to increasing in situational challenges, a significant increase in mean values (i.e., Table 7) appears.
For this experiment, accordingly to what is shown in Table 8, the significant differences in the growth rate for HRV power and GSR have been tested for minutes 1vs2, 2vs3, 1vs3 and 1vs5.
Table 8.
Experiment 2 p-values (p-value below the threshold of 0.05 is marked using *).
Considering minutes 2 and 5 compared to minute 1 of the test, there is a significant difference between the situations described, thus confirming the fact that, during minutes 2 and 5 of the experiment, drivers face higher situational challenges than during the initial phase. Meanwhile, considering the 1st and 3rd minute, a similar situation is demonstrated from the physiological parameters, in agreement with the similar experiment phase conditions.
In addition, once again the global difference for both the parameters show p-values lower than 0.05, so the null hypothesis is rejected confirming a global difference for driving situations and validating the effectiveness of this objective assessment methodology.
4.4.3. Experiment 3
Finally, considering the experiment 3, in the results analysis is important to remember that tests were performed simulating a driving condition of the ADTS in a dark virtual environment. According to Figure 14, in contrast to the 1st minute, a significant variation during the 2nd and 4th minutes of the box plot can be noticed.
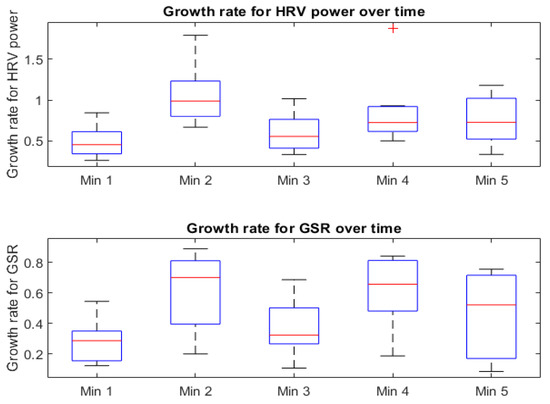
Figure 14.
Experiment 3 Box plot for Growth rate of HRV power and GSR.
In addition, the mean value for the growth rate of HRV and the GSR (i.e., Table 9) raises due to the increase in situational challenges.
Table 9.
Mean and standard deviation of experiment 3.
Similarly to other experiments, the significant differences in the growth rate for HRV power and GSR have been tested for minutes 1vs2, 2vs3, 1vs, 1vs4 and 1vs5. (i.e., refer Table 10).
Table 10.
Experiment 3 p-values (p-value below the threshold of 0.05 is marked with *).
The statistical comparison during minutes 2 and 4, with respect to the 1st one, show a significant difference among parameter values, confirming once again that the physiological values can reveal a difference in the driver status when facing different demanding conditions. This is still valid for all the other coupled tested situations and even in the 3rd minute a similar condition to the 1st one is confirmed.
5. Conclusions and Future Work
In this paper, an experimental evaluation of a system based on physiological signal to evaluate the driver status of workers using EMV is presented. The analysis aims at the possible definition of a physiology-based situation awareness model for readiness. The results obtained from different driving situations are promising in the direction of also discriminating the opposite state while driving under normal or challenging conditions.
For the experimental validation, physiological signals such as ECG, GSR, and Speech data were collected from nine participants in driving experiments with increasing level of complexity. Experimental results show that the selected physiological signals can be used for assessing the driver status.
From the preliminary analysis performed in this study, some useful insights can be drawn. As previously mentioned, the selected physiological signals, can be used to assess, as a first approximation, the state of the driver. Thus, the proposed framework can be used as input to a monitoring and alerting system. However, in order to design an effective monitoring system, characterized by miss-detection and false-alarm probabilities required by the specific application scenario, further and more accurate testing campaigns are needed. To this aim, future investigations include the use of more complex voice interactions with the system, the use of a sensorized steering wheel for GSR data acquisition, a seat belt equipped with ECG sensors, and posture analysis modules. Aspects of psychophysiology will also be considered.
Author Contributions
Conceptualization, D.B., M.M., B.G. and M.C.; methodology, D.B., B.G. and M.C.; validation, D.B., M.M. and M.C.; analysis, D.B., M.M. and M.C.; data curation, D.B. and M.C.; writing—original draft preparation, D.B., M.M., B.G. and M.C.; writing—review and editing, D.B. and M.C.; supervision, D.B. and M.C.; project administration, M.C.; funding acquisition, M.C. All authors have read and agreed to the published version of the manuscript.
Funding
This research has received funding from the European Union’s Horizon 2020 research and innovation program under the Marie Sklodawska-Curie grant agreement No. 764951.
Institutional Review Board Statement
The study was conducted according to the guidelines of the Declaration of Helsinki, and approved by the Institutional Review Board (or Ethics Committee) of University of Roma Tre July 2019.
Informed Consent Statement
Informed consent was obtained from all subjects involved in the study.
Data Availability Statement
Not applicable.
Acknowledgments
We gratefully acknowledge the support of Volvo Group Arena at Mälardalen University for the assistance with collecting the data used in this paper. Specifically, we thank Anas Fattouh for his assistance with the simulator.
Conflicts of Interest
The authors declare no conflict of interest.
Abbreviations
The following abbreviations are used in this manuscript:
| ADT | Articulated Dump Truck |
| ISO | International Organization for Standardization |
| NDRT | Non-Driving Related Task |
| HRV | Heart Rate Variability |
| GSR | Galvanic Skin Response |
| APA | American Physiological Association |
| CNS | Central Nervous System |
| ANS | Autonomic Nervous System |
| SNS | Sympathetic Nervous System |
| PSN | Para-Sympathetic Nervous system |
| ECG | Electrocardiogram |
| RA | Right Arm |
| LA | Left Arm |
| LL | Left Leg |
| SDNN | Standard Deviation of RR-intervals between Normal beats |
| Mean RR | Mean heartbeat intervals |
| Mean HR | mean heart rate |
| LF | Low Frequency |
| HF | High Frequency |
| FFT | Fast Fourier Transform |
| Probability Density Function | |
| IAIF | Iterative Adaptive Inverse Filtration |
| LPC | Linear Predictive Coding |
| DOF | Degree of Freedom |
References
- ISO-19014-1:2018. Earth-Moving Machinery—Functional Safety—Part 1: Methodology to Determine Safety-Related Parts of the Control System and Performance Requirements. 2018. Available online: https://www.iso.org/obp/ui/#iso:std:iso:19014:-1:ed-1:v2:en (accessed on 10 October 2022).
- Endsley, M. Toward a Theory of Situation Awareness in Dynamic Systems. Hum. Factors J. Hum. Factors Ergon. Soc. 1995, 37, 32–64. [Google Scholar] [CrossRef]
- Georg, J.M.; Hecht, T.; Lienkamp, M.; Wang, C. Development of a human driver model during highly automated driving for the ASIL controllability classification. Comput. Sci. 2017. Available online: https://www.semanticscholar.org/paper/Development-of-a-human-driver-model-during-highly-Georg-Hecht/f26f3c73cd5b24633a7250bb6f7a8c950e8f0cd9 (accessed on 1 November 2022).
- Doudou, M.; Bouabdallah, A.; Berge-Cherfaoui, V. Driver Drowsiness Measurement Technologies: Current Research, Market Solutions, and Challenges. Int. J. Intell. Transp. Syst. Res. 2020, 18, 297–319. [Google Scholar] [CrossRef]
- Fida, B.; Proto, A.; Bibbo, D.; Conforto, S.; Bernabucci, I.; Schmid, M. Real time event-based segmentation to classify locomotion activities through a single inertial sensor. In Proceedings of the 5th EAI International Conference on Wireless Mobile Communication and Healthcare, London, UK, 14–16 October 2015; pp. 104–107. [Google Scholar]
- Fida, B.; Bernabucci, I.; Bibbo, D.; Conforto, S.; Proto, A.; Schmid, M. The effect of window length on the classification of dynamic activities through a single accelerometer. In Proceedings of the 11th IASTED International Conference on Biomedical Engineering (BioMed 2014), Zürich, Switzerland, 23–25 June 2014; pp. 123–127. [Google Scholar] [CrossRef]
- Castronovo, A.; De Marchis, C.; Bibbo, D.; Conforto, S.; Schmid, M.; D’Alessio, T. Neuromuscular adaptations during submaximal prolonged cycling. Annu. Int. Conf. IEEE Eng. Med. Biol. Soc. 2012, 2012, 3612–3615. [Google Scholar] [CrossRef] [PubMed]
- Mariajoseph, M.; Gallina, B.; Carli, M.; Bibbo, D. A Physiology-based Driver Readiness Estimation Model for Tuning ISO 26262 Controllability. In Proceedings of the 2020 IEEE 91st Vehicular Technology Conference (VTC2020-Spring), Virtual, 25–28 May 2020; pp. 1–5. [Google Scholar]
- Clifford, G.D.; Azuaje, F.; McSharry, P. Advanced Methods and Tools for ECG Data Analysis; Artech House, Inc.: Norwood, MA, USA, 2006. [Google Scholar]
- Sun, F.T.; Kuo, C.; Cheng, H.T.; Buthpitiya, S.; Collins, P.; Griss, M. Activity-aware mental stress detection using physiological sensors. In Mobile Computing, Applications, and Services. MobiCASE 2010; Springer: Berlin/Heidelberg, Germany, 2010; Volume 76, pp. 282–301. [Google Scholar]
- Hidaka, O.; Yanagi, M.; Takada, K. Mental stress-induced physiological changes in the human masseter muscle. J. Dent. Res. 2004, 83, 227–231. [Google Scholar] [CrossRef]
- Kurniawan, H.; Maslov, A.V.; Pechenizkiy, M. Stress detection from speech and galvanic skin response signals. In Proceedings of the 26th IEEE International Symposium on Computer-Based Medical Systems, Porto, Portugal, 20–22 June 2013; pp. 209–214. [Google Scholar]
- Ito, M. Controllability in ISO-26262 and Driver Model. In Systems, Software and Services Process Improvement. EuroSPI 2015; O’Connor, R., Umay Akkaya, M., Kemaneci, K., Yilmaz, M., Poth, A., Messnarz, R., Eds.; Communications in Computer and Information Science Series; Springer: Cham, Switzerland, 2015; pp. 313–321. [Google Scholar]
- Monkhouse, H.; Habli, I.; Mcdermid, J. The Notion of Controllability in an Autonomous Vehicle Context. In Proceedings of the CARS 2015—CARS Workshop Critical Automotive Applications: Robustness & Safety, Paris, France, 8 September 2015. [Google Scholar]
- Ehrenfeld, T. The Three Types of Stress. 2018. Available online: https://www.psychologytoday.com/us/blog/open-gently/201812/the-three-types-stress (accessed on 10 October 2022).
- Svorc, P. Introductory Chapter: Autonomic Nervous System—What We Know about It. In Autonomic Nervous System; Svorc, P., Ed.; IntechOpen: Rijeka, Croatia, 2018; Chapter 1. [Google Scholar] [CrossRef]
- Ackerknecht, E.H. The history of the discovery of the vegetative (autonomic) nervous system. Med. Hist. 1974, 18, 1–8. [Google Scholar] [CrossRef]
- Ulrich-Lai, Y.; Herman, J. Neural regulation of endocrine and autonomic stress responses. Nat. Rev. Neurosci. 2009, 10, 397–409. [Google Scholar] [CrossRef]
- Fletcher, G.F.; Ades, P.A.; Kligfield, P.; Arena, R.; Balady, G.J.; Bittner, V.A.; Coke, L.A.; Fleg, J.L.; Forman, D.E.; Gerber, T.C.; et al. Exercise standards for testing and training: A scientific statement from the American Heart Association. Circulation 2013, 128, 873–934. [Google Scholar] [CrossRef]
- Jafarnia-Dabanloo, N.; McLernon, D.; Zhang, H.; Ayatollahi, A.; Johari-Majd, V. A modified Zeeman model for producing HRV signals and its application to ECG signal generation. J. Theor. Biol. 2007, 244, 180–189. [Google Scholar] [CrossRef]
- Pan, J.; Tompkins, W.J. A Real-Time QRS Detection Algorithm. IEEE Trans. Biomed. Eng. 1985, BME-32, 230–236. [Google Scholar] [CrossRef]
- Vicente, J.; Laguna, P.; Bartra, A.; Bailón, R. Drowsiness detection using heart rate variability. Med. Biol. Eng. Comput. 2016, 54, 927–937. [Google Scholar] [CrossRef]
- Darrow, C.W. The rationale for treating the change in galvanic skin response as a change in conductance. Psychophysiology 1964, 1, 31–38. [Google Scholar] [CrossRef] [PubMed]
- Gray, H.; Clemente, C. The organs of the senses and the common integument. In Anatomy of the Human Body, 20th ed.; Lea & Febiger: Philadelphia, PA, USA, 1918. [Google Scholar]
- Yin, J.; Zhang, Z. The influence of thyroarytenoid and cricothyroid muscle activation on vocal fold stiffness and eigenfrequencies. J. Acoust. Soc. Am. 2013, 133, 2972–2983. [Google Scholar] [CrossRef] [PubMed]
- Murray, I.R.; Baber, C.; South, A. Towards a definition and working model of stress and its effects on speech. Speech Commun. 1996, 20, 3–12. [Google Scholar] [CrossRef]
- Bentley, R.B. The Emerging Adult Voice: A Search for Functional Freedom. In The Modern Singing Master: Essays in Honor of Cornelius L. Reid; Scarecrow Press Inc.: Lanham, MD, USA, 2002; p. 131. [Google Scholar]
- Libelium Comunicaciones Distribuidas, S.L. Cooking Hacks e-Health Sensor Platform V2.0 for Arduino. 2013. Available online: https://bit.ly/2Xa20x0 (accessed on 10 October 2022).
- Salahuddin, L.; Cho, J.; Jeong, M.G.; Kim, D. Ultra short term analysis of heart rate variability for monitoring mental stress in mobile settings. In Proceedings of the 2007 29th Annual International Conference of the IEEE Engineering in Medicine and Biology Society, Lyon, France, 22–26 August 2007; pp. 4656–4659. [Google Scholar]
- Takahashi, N.; Kuriyama, A.; Kanazawa, H.; Takahashi, Y.; Nakayama, T. Validity of spectral analysis based on heart rate variability from 1-minute or less ECG recordings. Pacing Clin. Electrophysiol. 2017, 40, 1004–1009. [Google Scholar] [CrossRef]
- Tarvainen, M.P.; Koistinen, A.S.; Valkonen-Korhonen, M.; Partanen, J.; Karjalainen, P.A. Analysis of galvanic skin responses with principal components and clustering techniques. IEEE Trans. Biomed. Eng. 2001, 48, 1071–1079. [Google Scholar] [CrossRef]
- Yimen, N.; Dagbasi, M. Multi-attribute decision-making: Applying a modified Brown–Gibson model and RETScreen software to the optimal location process of utility-scale photovoltaic plants. Processes 2019, 7, 505. [Google Scholar] [CrossRef]
- Yimen, N.; Tchotang, T.; Kanmogne, A.; Adamu, Y.; Fon, F.L.; Dagbasi, M. Brown–Gibson Model as a Multi-criteria Decision Analysis (MCDA) Method: Theoretical and Mathematical Formulations, Literature Review, and Applications. Mult. Criteria Decis. Mak. 2022, 407, 169–191. [Google Scholar]
- Alku, P. Glottal wave analysis with pitch synchronous iterative adaptive inverse filtering. Speech Commun. 1992, 11, 109–118. [Google Scholar] [CrossRef]
- Paliwal, K.; Kleijn, W. Quantization of LPC parameters. Speech Coding Synth. 1995, 1, 433–466. [Google Scholar]
- Wilcoxon, F.; Katti, S.; Wilcox, R.A. Critical values and probability levels for the Wilcoxon rank sum test and the Wilcoxon signed rank test. Sel. Tables Math. Stat. 1970, 1, 171–259. [Google Scholar]
- Buckless, F.A.; Ravenscroft, S.P. Contrast coding: A refinement of ANOVA in behavioral analysis. Account. Rev. 1990, 65, 933–945. [Google Scholar]
Publisher’s Note: MDPI stays neutral with regard to jurisdictional claims in published maps and institutional affiliations. |
© 2022 by the authors. Licensee MDPI, Basel, Switzerland. This article is an open access article distributed under the terms and conditions of the Creative Commons Attribution (CC BY) license (https://creativecommons.org/licenses/by/4.0/).