Abstract
Recently, many disasters have occurred in indoor places. In order to rescue or detect victims within disaster scenes, vital information regarding their existence and location is needed. To provide such information, some studies simply employ indoor positioning systems to identify each mobile device of victims. However, their schemes may be unreliable, since people sometimes drop their mobile devices or put them on a desk. In other words, their methods may find a mobile device, not a victim. To solve this problem, this paper proposes a novel individual monitoring system based on edge intelligence. The proposed system monitors coexisting states with a user and a smart mobile device through a user state detection mechanism, which could allow tracking through the monitoring of continuous user state switching. Then, a fine-grained localization scheme is employed to perceive the precise location of a user who is with a mobile device. Hence, the proposed system is developed as a proof-of-concept relying on off-the-shelf WiFi devices and reusing pervasive signals. The smart mobile devices of users interact with hierarchical edge computing resources to quickly and safely collect and manage sensing data of user behaviors with encryption by cipher-block chaining, and user behaviors are analyzed via the ensemble paradigm of three machine learning technologies. The proposed system shows 98.82% prevision for user activity recognition, and 96.5% accuracy for user localization accuracy is achieved.
1. Introduction
Smart mobile applications mainly provide user-customized recommendations or information services in a wide variety of places related to our daily lives [1,2]. Cyber-physical interactivity is becoming one of the core technologies for newly-driven smart applications based on smart mobile devices, augmented reality devices, and virtual devices. Recognition of user information related to on-site cyber and physical environments, such as user position, user status, user identification and so on, should be achieved for smart applications. Recently, many disasters have happened, such as fires, pandemics, etc. In particular, indoor fires are one of the disasters which have frequently occurred. In case of fires, it is important for firefighters to be able to detect the existence and location of victims, as this helps firefighters conduct effective rescue without wasting time. In case of a pandemic, people who contracted the contagious disease should be discovered as soon as possible in order to minimize infection spread. Thus, it is very crucial that infected people, as well as people who have been in contact with them, are identified, and that the flow of their interactions also be identified.
Recent studies have been based on search-and-rescue (SAR) with unmanned aerial vehicles (UAVs) [3,4,5]. Prior to rescue, victim searching is achieved by using photo/video data obtained from UAV camera and radio signal data, i.e., WiFi from the smartphone of a victim. Meanwhile, indoor applications, such as smart buildings, provide energy-saving and personalized automation services based on the existence of people [6,7,8,9]. In these applications, personal location information is essential. In addition, the location information requires high accuracy for reliable services. For this, traditionally, an indoor positioning system (IPS) utilizes short-range wireless communication technologies, e.g., WiFi and Bluetooth, not a global positioning system (GPS) signal transmitted from satellites. For example, IPS decides a user’s location using signal information, such as a received signal strength indicator (RSSI). RSSI could be easily obtained through analysis of beacon signals when a user’s smartphone receives radio signals propagated from stationary beacon devices around itself. However, this RSSI value fluctuates every time, despite measurement in identical environments. This is because the RSSI value is influenced by elements such as the existence of a person and obstacles [10]. Thus, as the amount of the measured RSSI value increases, IPS could provide more reliable, highly precise localization.
Nevertheless, location detection methods which use only IPS technologies may not work well in a practical situation. The IPS technologies consider the location of a smartphone as the location of a person. However, in an emergency, it does not guarantee that victims always possess their smartphones. For example, people often leave their own mobile devices, i.e., smartphones, when they move from their office desk to other places, e.g., seminar rooms, restrooms, etc., within their workplace. Thus, this makes localization methods focused on mobile devices less reliable, even though current IPS technologies support a high accuracy of location data for mobile devices. Furthermore, previous IPS technologies may not support highly reliable and continuous individual monitoring without additional construction of localization-dedicated infrastructures.
This paper proposes a novel individual monitoring system based on edge intelligence called the edge-based individual monitoring system (E-IMS). The ideal concept has been briefly introduced as an extended abstract [11]. First of all, the design of E-IMS incorporates a user state awareness algorithm that diagnoses whether a user possesses his/her own smart mobile devices or not. For this, mobile sensing is performed by a smart mobile device, and analysis of sensing data is fulfilled with three machine learning algorithms, i.e.,a support-vector machine (SVM), a multilayer perceptron (MLP), and a convolutional neural network (CNN). Finally, a fine-grained and low-cost localization scheme is also presented. The localization scheme relies on off-the-shelf WiFi access points (APs) and stations (STAs) without additional equipment to gather wireless signal data. All the information related to a user, i.e., states and location, should be encrypted using cipher-block chaining (CBC) of block cipher modes for privacy and security. The proof-of-concept prototype of the E-IMS is implemented to prove service performances. Based on our real testbed experiments, the user activity recognition shows a precision of , and the user localization shows an accuracy of .
2. Related Work
Recently, a number of studies have proposed schemes to detect occupancy and user activities [12,13,14,15,16,17,18,19]. In [12], the authors have proposed an intelligent occupancy-sensing mechanism capable of sensing occupancy using smart IoT devices, i.e., smartphones and wearable devices. This is achieved by signaling among WiFi APs and analysis of channel state information (CSI) from them. However, the CSI can be acquired via dedicated devices only. EyeLight has presented a user occupancy detection scheme based on networked LED light bulbs with photosensors deployed on the ceiling [13]. The light bulb transmits the modulated light and detects the light signals through photodetectors. Each light bulb measures the light power of light signals received from other light bulbs. Then, based on measured light power levels, the proposed algorithms in EyeLight detect occupancy of a room as well as localize indoor users. SADHealth has been proposed in order to monitor health data for a person every season [14]. The SADHealth system periodically measures the light level and the activity level based on a recognition of user activity, such as running, walking, biking, and sitting. For this, it uses the light sensor, accelerometer, etc. embedded in smartphones. Other studies have provided evaluation results regarding simple user activity detection, such as walking, running, and so on [15,16,17,18]. In addition, these studies are merely fulfilled analysis based on a statically provided data set via an SVM or MLP algorithm. In [19], the proposed system performs a user sensing sequence to understand the current status of users and recommend the next service or information.
Beacon frame-based positioning is a mechanism by which the station (STA) obtains WiFi signals of a number of APs which are advertising the beacon frame periodically [20,21,22]. The mechanism necessary to achieve this requires an additional cost, as a dedicated software program for scanning WiFi signals has to be installed on the STA. Additionally, the STA has a limited capacity to obtain WiFi signals. To get a high accuracy for localization, it needs a large number of signals. Thus, the STA should collect as many signals as possible. However, this mechanism is inefficient for signal acquisition; this is because collision and interference must occur due to the nature of the wireless medium, and, furthermore, the scan interval of the STA is slower than the advertisement interval of the AP [9]. Meanwhile, there is probe request-based positioning, which uses WiFi active network scanning in indoor/outdoor places [10,23,24,25]. The STA advertises a probe request frame periodically, and it requires the existence of APs to be discovered. In this environment, the probe request mechanism may be suitable for obtaining RSSIs for indoor positioning. Additionally, this mechanism does not need to set up the software program, unlike beacon frame-based positioning. However, it does not support consecutive positioning, since STA only advertises a probe request frame while it conducts network scanning.
As explained previously, we have investigated works related to information sensing, i.e., user activity and location, for individual monitoring. The relevant studies are summarized in Table 1. They are mainly divided into user activity sensing and localization. The related works to user activity sensing are divided by type of activity sensing, such as occupancy, activity, and user statements. Most of them have in common the fact that they exploit the sensors, e.g., accelerometer, gyroscope, etc., embedded in smartphones. Additionally, the works related to localization are sorted by service type, such as positioning method. Commonly, they exploit the Wi-Fi communication channels of smartphones.

Table 1.
Comparison between related works.
3. Edge-Based Individual Monitoring System
This section introduces the edge-based individual monitoring system (E-IMS). The E-IMS exploits the user’s smartphone to collect data, including sensory data on the smartphone and RSSI of APs.
3.1. E-IMS Design
3.1.1. System Architecture and Components
Figure 1 illustrates the E-IMS architecture. The E-IMS consists of the mobile device, access points (AP), and an edge server. The mobile device collects data required to detect the activity and location of indoor users. Then, the mobile device delivers data collected from APs and its own sensors to the edge server over a cellular network and local area network (LAN). The AP advertises wireless signal data used to decide the location of users. Additionally, the AP may support the connection between the mobile device and the edge server. In the edge server, the user’s activity and indoor location are decided based on the data received from the mobile device of the user.
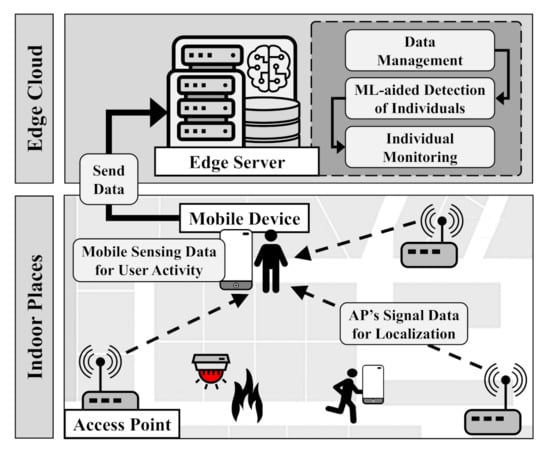
Figure 1.
E-IMS Architecture.
The process of the system architecture is as follows. The smartphone periodically collects sensory data from its various sensors and collects wireless signal information from surrounding APs. The user activity is largely classified into six activities: walking, running, sitting down, standing up, putting on and falling down. The sensors embedded in smartphones that are used in E-IMS are the accelerometer, gyroscope, and orientation and magnetic sensors. These four sensors are not only representative sensors that can sense the movement of a smartphone user in the field of human activity recognition (HAR) through smart devices but are also sensitive to the user’s movements. The user’s smart mobile device listens to advertising signals disseminated from APs around its own. Then, it extracts the RSSI value and identification for the advertiser from the received signal. Next, the smart mobile device delivers these data to the edge server. In the edge server, these data are used to predict the user’s activity and location. Figure 2, Figure 3 and Figure 4 illustrate that smartphone sensors sense a given user’s activity change. The figures show the change of each value is definite whenever the activity of the user is changed. E-IMS learns RSSI and sensory data by machine learning, and then detects the current user state via prediction of the user activity and location based on the data.
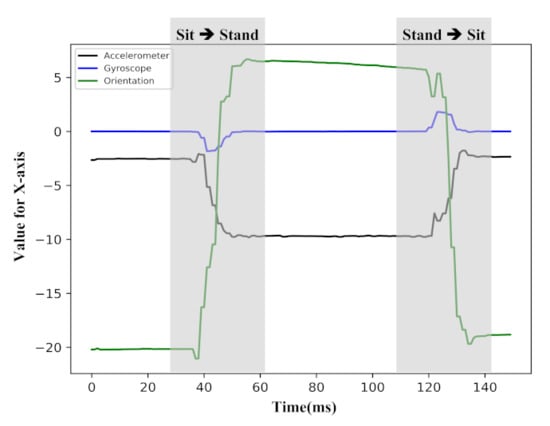
Figure 2.
Change in the X-axis for each type of sensory data.
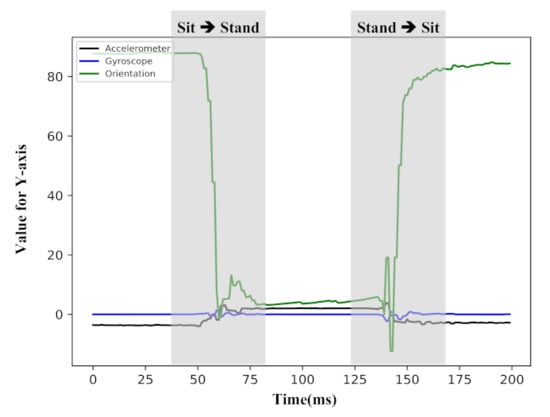
Figure 3.
Change in the Y-axis for each type of sensory data.
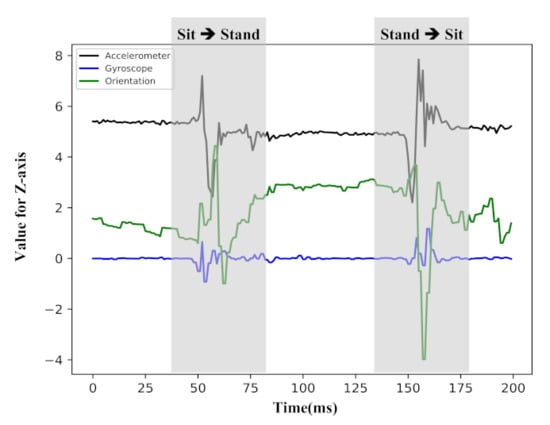
Figure 4.
Change in the Z-axis for each type of sensory data.
3.1.2. Framework and Operational Steps
Figure 5 describes the E-IMS framework in the edge server. The process of the E-IMS framework consists of three main parts, as follows: a data management part, a user detection part, and an individual monitoring part.
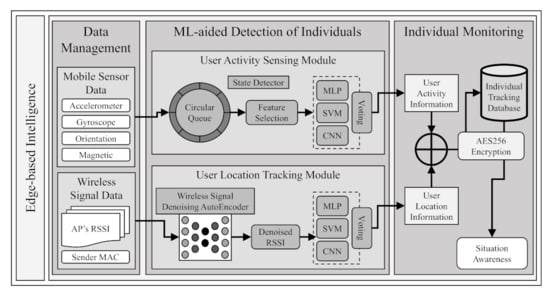
Figure 5.
E-IMS framework in an edge server.
As a first step, in the data management (DM) part, the user collects sensory data from a smartphone for a specific activity performed by the user. The smartphone collects X-, Y-, and Z-axis values of each sensor, including an accelerometer, a gyroscope, an orientation sensor, and a magnetic sensor. Additionally, the smartphone collects RSSI and the MAC address included in radio signals of surrounding APs. The collected sensory data and wireless signal data are transmitted to the edge server to predict the user’s activity and location.
As a second step, in the ML-aided detection of individuals (MLaDI) part, sensory data and wireless signal data are processed by two different modules: a user activity-sensing module and a user location-tracking module. The user activity sensing module processes the sensory data collected from smartphones. This module reconstructs data through feature selection from the collected data. The reconstructed data is entered to the pre-trained MLP, SVM, and CNN models to predict user activities. The user activity-sensing module (UASM) determines the user’s current activities through a hard voting process based on the results predicted by the pre-trained models. The user location-tracking module (ULTM) processes a number of wireless signal data collected from mobile devices. In this module, wireless signal data is entered to the pre-trained DAE (denoising auto-encoder) model to filter out the noise present in the wireless signal data. Denoised RSSI data generated through the DAE is entered to the pre-trained MLP, SVM, and CNN model to predict user location. The user location-tracking module determines the user’s current location through hard voting on the results predicted by the pre-trained models.
As a final step, inthe individual monitoring (IM) part, the user’s activity and location information are stored in the Individual Tracking Database implemented in the edge server. Since the user information is a user’s personal information, it needs to be encrypted and stored. In this part, user activity information and location information are encrypted and stored using AES-256-CBC mode. E-IMS recognizes the user’s current situation through user activity and location information.
3.1.3. Detector and Discriminator of User Activities
The detector is a module that detects a user’s activity change through predicted activity using the collected sensory data. The detector stores sensory data collected in real time from the user smartphone in a circular queue structure buffer to predict user activity. Sensory data stored in the buffer has noise due to minute vibrations that occur naturally when the user performs a specific activity. The noise can degrade the performance of the trained model. Therefore, before using sensory data stored in the buffer as the input data of the model, it is necessary to filter the noise present in the data. The detector performs a feature selection through the Pearson correlation coefficient on the collected data to find a meaningful feature among the input data features. The Pearson correlation coefficient is a measure of the linear correlation between the variables X and Y. The Pearson correlation coefficient is distributed between [−1, 1], and when the correlation coefficient is 0, it means that there is no correlation between features. The larger the absolute value of correlation, the stronger the correlation between features.
Figure 6 shows the correlation coefficient between training data and test data. The training data and test data are composed of X-, Y-, and Z axis values from four sensors: the accelerometer, gyroscope, orientation sensor, and magnetic sensor. The X-axis in Figure 6 represents 12 features (axis values for each sensor). The Y-axis represents the correlation score and indicates a measure of the correlation between axis values for each sensor. In Figure 6, the correlation coefficient values are different from each other in terms of features. Meanwhile, the correlation coefficient values between training data and test data in each feature are similar to each other. In other words, it can be interpreted that each feature of the train data and test data has a similar distribution. The detector finds meaningful data through the feature selection process using the Pearson correlation coefficient, and the meaningful data are generated as input data of machine learning. The detector predicts user activity by entering the reconstructed data into the pre-trained model. To detect a change of activity, the detector compares a user’s previous activity with their current activity.
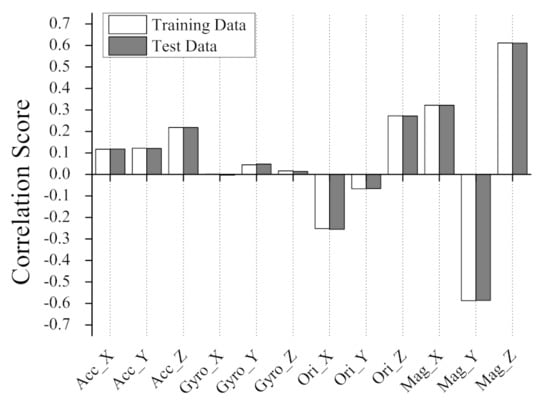
Figure 6.
Correlation graph of sensor axes.
Figure 7 illustrates the state diagram to detect the coexistence of both a person and their mobile device, i.e.,a smartphone, smart tablet, etc. The states are divided into two groups: and . Each group includes predefined user activities. As an activity group related to when the mobile device is possessed by a person, the group consists of four activities such as walking (W), running (R), sitting down(D), and standing up (U). consists of two activities, e.g., putting on (P) and falling down (F) as an activity group indicating when the mobile device is not possessed by a person. Furthermore, the user activities in each state group can be divided into continuous and discontinuous activities according to the cycle of activity occurrence. For example, walking and running in are continuous activities. These activities mean a person is moving without stopping while the person still has his/her own smartphone. On the other hand, sitting down and standing up in are discontinuous activities. These activities mean a person maintains a stationary state after a short movement from their previous activity. Putting on and falling down in are also discontinuous activities, but these mean a person does not possess his/her own smartphone. The way to distinguish between and among discontinuous activities is to find out whether the user possesses a smartphone or not. For this, the detector compares the previous activity with the current activity to detect state changes between continuous and discontinuous activities. If a discontinuous activity occurs after a continuous activity, the user’s state is determined according to the next action predicted by the detector. This can be classified into three cases that can determine the user’s state. Case 1 means the user’s state maintains while possessing their smartphone. Case 2 means the user’s state returns to after the state changed from to previously. Unlike Case 2, Case 3 means the user’s state does not return to from . These three cases can also determine whether the user has a smartphone or not. In the E-IMS, if a user’s state is Case 1 or Case 2, it is determined that the user’s final state is , and the algorithm decides that the user has a smartphone. In case of Case 3, the final state of the user is determined as , and the algorithm decides that the user doesn’t have a smartphone.
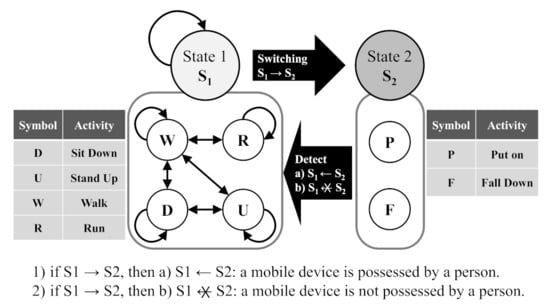
Figure 7.
State switching to detect mobile-person coexistence.
3.1.4. Localization in User Areas
The localization scheme consists of two steps. In the first step, it identifies a station and acquires its RSSI values. In the next step, the prediction for the indoor positioning is performed using SVM and MLP. The monitor devices sniff IEEE 802.11 frames through IEEE 802.11 monitor mode. The monitor devices check STAs using the MAC address of the sniffed IEEE 802.11 frame. In other words, to detect a new STA, the ARP and ICMP operations on WLAN are utilized. The monitor devices collect ARP or ICMP messages from the STA. The IP address of the STA, which is included in the messages, is used to request the MAC address. The MAC address of the STA is put into the Ethernet destination address field, and any IP address among the available addresses within the network prefix assigned to WLAN is added into the field target protocol address field of the ARP packet format. Then, when a node matches up to its own IP address with the IP address in the ARP request message, it relays the IP address to the STA. Thus, the monitor devices catch this reply message, and it means the presence of the STA is confirmed. The monitor device then sends ARP or ICMP request messages to the STA. Finally, the STA receives the request message sent from the monitor device, and STA re-sends ARP or ICMP reply messages to the monitor device.
4. Machine-Learning-Aided and Edge-Based User Monitoring
4.1. Activity Sensing
We use the detector to predict the user’s activity. The detector analyzes users’ activity using MLP, SVM, and CNN models. The MLP model’s hidden layer consists of three layers, and the activation function is used in each hidden layer. The loss function shows a metric to evaluate the performance of the deep learning classification model. In the MLP model, the function is used to output the loss value. We use the optimizer to update weights and optimize. For the SVM model, the linear kernel SVM is implemented to efficiently classify 12-dimensional sensory data.
The CNN model is implemented as a 1D CNN model. A 1D convolution layer is implemented as the input layer. 128 filters are used in the convolution layer, and the size per filter is four. Stride size is one to perform the convolution operation. Depending on the value of the stride size, feature map size from the convolution layer is determined. The size of the feature map, which is the result of the calculation of the convolution layer, is smaller than the size of the input data. Padding is applied before the convolution operation to prevent the loss of data by adjusting the size of the feature map to the same size as the input data. The final feature map is generated by applying the activation function to the feature map. In the pooling layer, the size of two max pooling two is used. The result of the pooling layer is entered to the output layer(fully-connected layer) and dropout is applied to prevent over-fitting before entering the output layer. is used as an activation function in the output layer.
4.2. Localization
The RSSI sent to the edge contains some fluctuated values due to the nature of the wireless medium. Figure 8 shows RSSI obtained from three monitors in rooms 1, 2 and 6. Fluctuate values are not clustered and are scattered. These values are filtered through DAE. Figure 9 shows the result of the DAE, and most of the fluctuated values has disappeared. In order to attain indoor localization, SVM and MLP are performed using the RSSI. SVM uses the RBF kernel and MLP has three hidden layers. Finally, the scheme predicts the indoor position of the STA by hard voting the results.
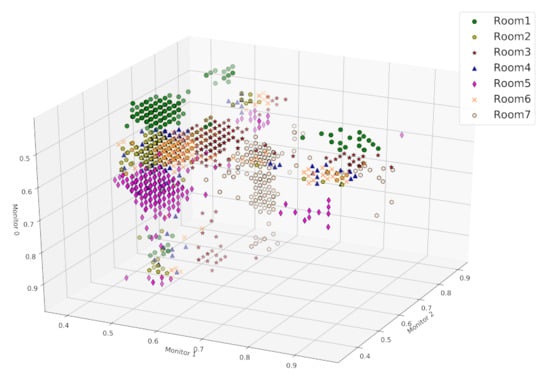
Figure 8.
Raw RSSI data.
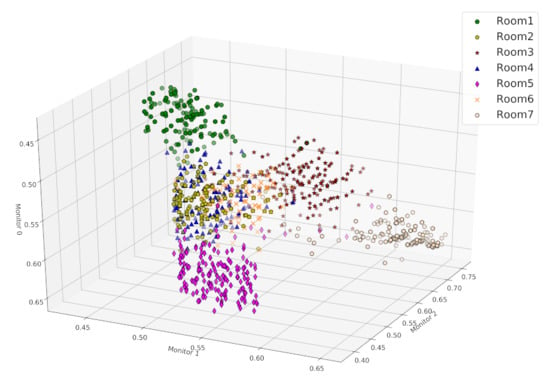
Figure 9.
Denoised RSSI data.
5. Performance Evaluations
5.1. Experimental Design
This section shows the proof-of-concept prototype to implement and evaluate the proposed edge-based individual tracking scheme relying on WiFi-based localization and smartphone-edge interaction for user activity sensing with fine-tuned data analytics via machine learning technologies. The experiment has been conducted. The experimental environments are as follows. Android 8.0 is used for the mobile OS, and Ubuntu 18.04 LTS are used for the edge OS. There are eight activities to distinguish. Data collection time series are 100ms. Accelerometer, gyroscope, orientation sensor, and magnetic sensor are used and all x, y, z axes are used to sense the activity of the user. 10,000 points of data are collected for each activity.
The types of activities for human activity recognition (HAR) consist of Walk&Pocket, Walk&Hand, Walk&Use, Run&Pocket, Run&Hand, Sit-Down&Hand, Stand-Up&Hand, Put&Hand. Prerequisites for the experiment are set to include putting the smartphone in the right-side pocket of pants, holding the smartphone in the right hand, and performing minute movements of the body. Surrounding environmental variables are altitude, the number of people, metal materials, and so on.
The experiment for localization is conducted in seven different rooms. The size of rooms 1 to 6 is 3 m × 2.5 m and room 7 is 6 m × 3 m. We use monitor devices for Raspberry Pi 3B+ with ipTIME N150UA WNIC. In rooms 1, 2, and 6, a total of two or three monitor devices are deployed to collect the RSSI data. The total number of measured data is 100,000 for all rooms.
5.2. Experimental Results
Figure 10 shows the accuracy of the state (putting on and falling down activities). First, MLP demonstrated an accuracy of 98.30% for training data and 98.28% for test data. Second, SVM demonstrated an accuracy of 66.19% for training data and 65.65% for test data. Finally, CNN demonstrated an accuracy of 79.42% for training data and 79.11% for test data. Consequently, the best accuracy is 98.28% in MLP with test data. Figure 11 shows the total accuracy for all user activities. The accuracy of MLP is 99.1% for training data and 98.82% for test data. The accuracy of SVM is 91.67% for training data and 91.65% for test data. In the case of 1D CNN, the accuracy is 96.93% for training data and 96.94% for test data. Similar to , MLP showed the highest accuracy.
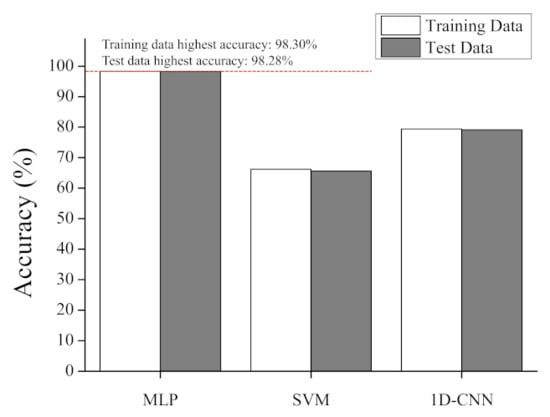
Figure 10.
Accuracy of .
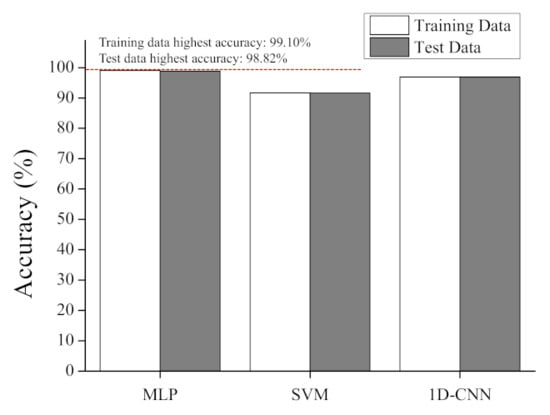
Figure 11.
Total accuracy of all activities.
Table 2 shows the accuracy of activities predicted by each machine learning scheme. In particular, MLP showed remarkable performance in almost all cases. However, in the case of Sit-Down&Hand, SVM is superior to other machine learning schemes. Overall, the performance of CNN is lower than other machine learning schemes in most cases, and the result is unsuitable for prediction of user activities.

Table 2.
Prediction accuracy for activities in machine learning schemes.
This experiment has performed based on two to three monitor devices in order to classify the seven rooms. Then, two machine learning schemes, i.e., SVM and MLP, are employed to analyze the RSSI data collected from monitor devices. The set of data used on each machine learning scheme is equal. The accuracy of indoor positioning is higher when using three monitor devices than using two monitor devices; the greater the number of monitor devices, the more RSSI is collected from the monitor devices. Finally, the amount of data increased the performance of the machine learning technology. Therefore, as the number of monitors increased, the amount of data also increased. Figure 12 presents the confusion matrix of machine learning schemes SVM and MLP with DAE. Figure 12a shows that the average accuracy of localization when incorporating SVM is 95.60%. Figure 12b shows that the average accuracy of localization when incorporating MLP with DAE is 96.70%.
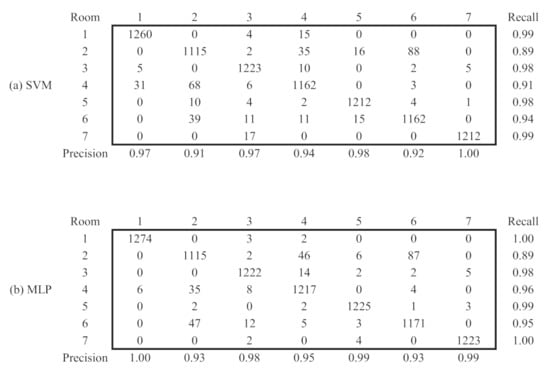
Figure 12.
Confusion Matrix for Localization.
6. Conclusions and Future Work
This paper proposes an edge-based individual monitoring system in order to search for victims in indoor places. E-IMS is composed of user state detection and fine-grained localization based on machine learning with sensory data and signal information obtained from off-the-shelf devices. The field test via proof-of-concept proves that E-IMS shows high accuracy and reliability for user activity detection and indoor localization. In future work, to improve the performance of E-IMS, we will increase the accuracy of AI-aided detection in the edge server.
Author Contributions
Conceptualization, T.Y. and S.P.; data curation, S.-H.L.; methodology, T.Y.; resources, S.-H.L.; software, T.Y.; supervision, S.P.; visualization, S.-H.L.; writing—original draft, T.Y. and S.P.; writing—review & editing, S.-H.L. and S.P. All authors have read and agreed to the published version of the manuscript.
Funding
This research was supported by Basic Science Research Program through the National Research Foundation of Korea (NRF) funded by the Ministry of Education (2019R1I1A3A01062944).
Conflicts of Interest
The authors declare no conflict of interest.
References
- Liu, C.H.; Zhang, Z.; Chen, M. Personalized Multimedia Recommendations for Cloud-Integrated Cyber-Physical Systems. IEEE Syst. J. 2017, 11, 106–117. [Google Scholar] [CrossRef]
- Siryani, J.; Tanju, B.; Eveleigh, T.J. A Machine Learning Decision-Support System Improves the Internet of Things’ Smart Meter Operations. IEEE Internet Things J. 2017, 4, 1056–1066. [Google Scholar] [CrossRef]
- Ghazali, S.N.A.M.; Anuar, H.A.; Zakaria, S.N.A.S.; Yusoff, Z. Determining position of target subjects in Maritime Search and Rescue (MSAR) operations using rotary wing Unmanned Aerial Vehicles (UAVs). In Proceedings of the 2016 International Conference on Information and Communication Technology (ICICTM), Kuala Lumpur, Malaysia, 16–17 May 2016; pp. 1–4. [Google Scholar]
- Kashihara, S.; Yamamoto, A.; Matsuzaki, K.; Miyazaki, K.; Seki, T.; Urakawa, G.; Fukumoto, M.; Ohta, C. Wi-SF: Aerial Wi-Fi Sensing Function for Enhancing Search and Rescue Operation. In Proceedings of the IEEE Global Humanitarian Technology Conference (GHTC), Seattle, WA, USA, 17–20 October 2019; pp. 1–4. [Google Scholar]
- Kashihara, S.; Wicaksono, M.A.; Fall, D.; Niswar, M. Supportive Information to Find Victims from Aerial Video in Search and Rescue Operation. In Proceedings of the IEEE International Conference on Internet of Things and Intelligence System (IoTaIS), Bali, Indonesia, 5–7 November 2019; pp. 56–61. [Google Scholar]
- Elsisi, M.; Tran, M.-Q.; Mahmoud, K.; Lehtonen, M.; Darwish, M.M.F. Deep Learning-Based Industry 4.0 and Internet of Things towards Effective Energy Management for Smart Buildings. Sensors 2021, 21, 1038. [Google Scholar] [CrossRef] [PubMed]
- Fotopoulou, E.; Zafeiropoulos, A.; Terroso-Sáenz, F.; Şimşek, U.; González-Vidal, A.; Tsiolis, G.; Gouvas, P.; Liapis, P.; Fensel, A.; Skarmeta, A. Providing Personalized Energy Management and Awareness Services for Energy Efficiency in Smart Buildings. Sensors 2017, 17, 2054. [Google Scholar] [CrossRef] [Green Version]
- Bianchi, V.; Ciampolini, P.; De Munari, I. RSSI-Based Indoor Localization and Identification for ZigBee Wireless Sensor Networks in Smart Homes. IEEE Trans. Instrum. Meas. 2019, 68, 566–575. [Google Scholar] [CrossRef]
- Faragher, R.; Harle, R. Location Fingerprinting With Bluetooth Low Energy Beacons. IEEE J. Sel. Areas Commun. 2015, 33, 2418–2428. [Google Scholar] [CrossRef]
- Chilipirea, C.; Petre, A.; Dobre, C.; van Steen, M. Presumably Simple: Monitoring Crowds Using WiFi. In Proceedings of the 2016 17th IEEE International Conference on Mobile Data Management (MDM), Porto, Portugal, 13–16 June 2016; pp. 220–225. [Google Scholar]
- Kim, C.; Kim, S.; Lee, S.-H.; Park, S.; Yang, T. Cyber-Physical Individual Monitoring in Indoor Internet-of-Things Systems With Edge Intelligence. In Proceedings of the 2021 IEEE 18th Annual Consumer Communications & Networking Conference (CCNC), Las Vegas, NV, USA, 9–12 January 2021; pp. 1–2. [Google Scholar]
- Yang, J.; Zou, H.; Jiang, H.; Xie, L. Device-Free Occupant Activity Sensing Using WiFi-Enabled IoT Devices for Smart Homes. IEEE Internet Things J. 2018, 5, 3991–4002. [Google Scholar] [CrossRef]
- Nguyen, V.; Ibrahim, M.; Rupavatharam, S.; Jawahar, M.; Gruteser, M.; Howard, R. Eyelight: Light-and-Shadow-Based Occupancy Estimation and Room Activity Recognition. In Proceedings of the IEEE INFOCOM 2018 - IEEE Conference on Computer Communications, Honolulu, HI, USA, 16–19 April 2018; pp. 351–359. [Google Scholar]
- McNamara, L.; Ngai, E. SADHealth: A Personal Mobile Sensing System for Seasonal Health Monitoring. IEEE Syst. J. 2018, 12, 30–40. [Google Scholar] [CrossRef]
- Chen, C.; Huang, F.; Liu, Y.; Wu, D. Artificial Intelligence and Mobile Phone Sensing Based User Activity Recognition. In Proceedings of the IEEE 15th International Conference on e-Business Engineering (ICEBE), Xi’an, China, 12–14 October 2018; pp. 164–171. [Google Scholar]
- Yared, R.; Negassi, M.E.; Yang, L. Physical activity classification and assessment using smartphone. In Proceedings of the IEEE 9th Annual Information Technology, Electronics and Mobile Communication Conference (IEMCON), Vancouver, BC, Canada, 1–3 November 2018; pp. 140–144. [Google Scholar]
- Iwashita, S.; Hayashi, A.; Shimanuki, Y. Estimation of Human Movement State by Smartphone Sensor Information without GPS. In Proceedings of the 10th International Conference on Soft Computing and Intelligent Systems (SCIS) and 19th International Symposium on Advanced Intelligent Systems (ISIS), Toyama, Japan, 5–8 December 2018; pp. 554–558. [Google Scholar]
- Voicu, R.-A.; Dobre, C.; Bajenaru, L.; Ciobanu, R.-I. Human Physical Activity Recognition Using Smartphone Sensors. Sensors 2019, 19, 458. [Google Scholar] [CrossRef] [PubMed] [Green Version]
- Lee, C.; Park, S.; Yang, T.; Lee, S. Smart Parking with Fine-Grained Localization and User Status Sensing Based on Edge Computing. In Proceedings of the 2019 IEEE 90th Vehicular Technology Conference (VTC2019-Fall), Honolulu, HI, USA, 22–25 September 2019; pp. 1–5. [Google Scholar]
- Xie, X.; Xu, H.; Yang, G.; Mao, Z.; Jia, W.; Sun, M. Reuse of Wi-Fi Information for Indoor Monitoring of the Elderly. In Proceedings of the 2016 IEEE 17th International Conference on Information Reuse and Integration (IRI), Pittsburgh, PA, USA, 28–30 July 2016; pp. 261–264. [Google Scholar]
- Chabbar, H.; Chami, M. Indoor Localization Using Wi-Fi Method Based on Fingerprinting Technique. In Proceedings of the 2017 International Conference on Wireless Technologies, Embedded and Intelligent Systems (WITS), Fez, Morocco, 19–20 April 2017; pp. 1–5. [Google Scholar]
- Zhang, Y.; Ye, L. Indoor localization method based on AP and local linear regression algorithm. In Proceedings of the IEEE 17th International Conference on Communication Technology (ICCT), Chengdu, China, 27–30 October 2017; pp. 1122–1126. [Google Scholar]
- Vattapparamban, E.; Çiftler, B.S.; Güvenç, İ.; Akkaya, K.; Kadri, A. Indoor occupancy tracking in smart buildings using passive sniffing of probe requests. In Proceedings of the 2016 IEEE International Conference on Communications Workshops (ICC), Kuala Lumpur, Malaysia, 23–27 May 2016; pp. 38–44. [Google Scholar]
- Potortì, F.; Crivello, A.; Girolami, M.; Traficante, E.; Barsocchi, P. Wi-Fi probes as digital crumbs for crowd localisation. In Proceedings of the 2016 International Conference on Indoor Positioning and Indoor Navigation (IPIN), Alcala de Henares, Spain, 4–7 October 2016; pp. 1–8. [Google Scholar]
- Acuna, V.; Kumbhar, A.; Vattapparamban, E.; Rajabli, F.; Guvenc, I. Localization of Wi-Fi Devices Using Probe Requests Captured at Unmanned Aerial Vehicles. In Proceedings of the 2017 IEEE Wireless Communications and Networking Conference (WCNC), San Francisco, CA, USA, 19–22 March 2017; pp. 1–6. [Google Scholar]
Publisher’s Note: MDPI stays neutral with regard to jurisdictional claims in published maps and institutional affiliations. |
© 2021 by the authors. Licensee MDPI, Basel, Switzerland. This article is an open access article distributed under the terms and conditions of the Creative Commons Attribution (CC BY) license (https://creativecommons.org/licenses/by/4.0/).