You are currently viewing a new version of our website. To view the old version click .
Electronics
  • Article
  • Open Access

2 June 2021

Multi-Sensory Color Expression with Sound and Temperature in Visual Arts Appreciation for People with Visual Impairment

,
and
1
Department of Electrical and Computer Engineering, Sungkyunkwan University, Suwon 16419, Korea
2
Department of Human ICT Convergence, Sungkyunkwan University, Suwon 16419, Korea
*
Author to whom correspondence should be addressed.
This article belongs to the Special Issue Multi-Sensory Interaction for Blind and Visually Impaired People

Abstract

For years the HCI community’s research has been focused on the hearing and sight senses. However, in recent times, there has been an increased interest in using other types of senses, such as smell or touch. Moreover, this has been accompanied with growing research related to sensory substitution techniques and multi-sensory systems. Similarly, contemporary art has also been influenced by this trend and the number of artists interested in creating novel multi-sensory works of art has increased substantially. As a result, the opportunities for visually impaired people to experience artworks in different ways are also expanding. In spite of all this, the research focusing on multimodal systems for experiencing visual arts is not large and user tests comparing different modalities and senses, particularly in the field of art, are insufficient. This paper attempts to design a multi-sensory mapping to convey color to visually impaired people employing musical sounds and temperature cues. Through user tests and surveys with a total of 18 participants, we show that this multi-sensory system is properly designed to allow the user to distinguish and experience a total of 24 colors. The tests consist of several semantic correlational adjective-based surveys for comparing the different modalities to find out the best way to express colors through musical sounds and temperature cues based on previously well-established sound-color and temperature-color coding algorithms. In addition, the resulting final algorithm is also tested with 12 more users.

1. Introduction

Multi-sensory systems, or systems that combine several modes of interaction through different senses, have been gaining popularity in recent times in the field of HCI (Human–Computer Interaction). Each one of the five senses gives humans unique ways of experiencing the world around and, as a result, researchers have seen the potential of applying those natural ways of interacting with the world into different ways of interacting with computers. In addition, multi-sensory systems can also be useful to convey complex or abstract information since each sense can congruently aid the others. Moreover, recent research has shown that humans are used to interacting with the world in a multi-sensory way and that multi-sensory experiences tend to be more engaging and easier to remember when compared to unisensory ones [1].
One of the possible applications for multi-sensory systems is the creation of novel art which creates a novel experience for the spectator by means of its multi-sensory interfaces. Because of that, artists have been showing a growing interest in multi-sensory art exhibitions. This increase of multi-sensory experiences, which makes interaction drift from the common visual and auditory types to other types of interaction, can be really convenient for minority groups that lack one of those senses, such as the visually impaired people. People with visual impairments are interested not only in performing with ease the necessary activities of everyday life but also in visiting museums and enjoying visual arts, which is why many museums have been making some of their exhibitions and artworks accessible to visually impaired people by hosting specialized tours with access to tactile representations of the artworks [2,3,4]. Nevertheless, most of those tours and exhibitions are based solely on tactile and audio systems which do not make use of any other sensory modality for interacting with the artworks. Since visually impaired people lack only the sense of vision, we believe they could benefit greatly from multi-sensory experiences as they provide them not only with the possibility of experiencing the artwork without relying on single sense that they cannot have access to, but also with the increased engagement, gamification and artwork comprehension which multi-sensory experiences can facilitate.
In this work, we design a novel sound-temperature multi-sensory system that helps visually impaired people experience a total of 24 colors. Additionally, during the process, a throughout investigation about the relationship of the different sounds and temperatures with the warm/cold and bright/dark dimensions of colors was performed. This investigation included extensive surveys and tests with a total of 18 participants, and an additional 12 participants for the final multimodal test. The work is the continuation of a series of works whose aim is to develop a multi-modal system and algorithms that aid visually impaired people in experiencing pieces of art. In previous works, both a color-temperature mapping algorithm and a sound-color coding system were designed, implemented into physical prototypes, and tested [5,6,7]. This work introduces a method for finding the best way to turn those unisensory systems into an improved sound-temperature multi-sensory system for conveying colors. Both works will be explained in more detail in the following sections.

3. Method

3.1. Previous Method

As we stated above, this paper addresses and aims to improve previous works in which unisensory color-coding was performed and tested. While in [5] a sound-color mapping algorithm was designed, in [6] the developed algorithm and system was a temperature–color one. It is our goal to mix both these methods for increasing the number of colors the user can experience and for making the sensory experience more stimulating and engaging. However, for developing a multi-sensory system mixing both of them, it is necessary to find the best way of implementing both methods in a multi-sensory way in order to increase the easiness of color recognition and the comfortability of the sensory experience.
The sound–color code designed in [6] for each of the colors and their saturated, bright, and dark variants can be seen in Table 1. There, each of the 18 colors is represented by a musical excerpt either from a sound set consisting of variations on a Vivaldi piece or from a more ample classical repertoire sound set. Each one of these sound sets received a name: VIVALDI, and CLASSIC. The melody, rhythm, harmony, instrument, and tessitura of the sound files of both sound sets were selected in order to make a comprehensible representation of the hue and quality of each color. While more information about the musical selection and processing method can be seen in [6], it is important to notice that, regardless of the method, each sound file was created so its musical excerpt represents both the hue of the color and the quality of the color. Therefore, all sounds belonging to the dark colors have differences, which allows the user to distinguish the hue, but also have similarities that represent the dark dimension of the color. It is important to remember that this set of sounds come in two different versions, CLASSIC and VIVALDI, since one of the research’s goals will be finding out which one of those set of sounds is more convenient for being implemented in the multi-sensory system.
Table 1. Sound coding colors with saturated/bright/dark colors (Adapted from ref. [6]). The sound wav files are provided separately as a supplementary materials.
Similarly, a temperature–color mapping was designed based on the previous work from [5], where it was proved that users were able to discern with high accuracy temperatures with intervals larger than 3 °C. As a result, any division of the comfortable temperature range with more than 3 °C between temperatures can be used for discerning several colors or the other dimensions of the colors. Consequently, the following temperature-color codes were designed, one for expressing hues (Table 2) and the other for expressing other color dimensions (Table 3). The original main method, based on [5], would be to have the user feel two temperatures, one expressing hue and the second one expressing the color dimensions of that same hue.
Table 2. Temperature-Color coding for color hue.
Table 3. Temperature-Color coding for color warm/bright/dark and cold dimensions.

3.2. Multi-Sensory Improved Method

It was possible to mix both those methods to create a multi-sensory experience of colors if both sound–color and temperature–color mappings were simplified and mixed, dividing the roles each one had. For example, hue could be expressed only through sound while the color quality could be expressed only by means of the temperature cues, or vice versa. This created a multi-sensory experience of the colors more engaging and convenient than the original unisensory experiences. In addition, the separation of hue and the other color dimensions into different sensory modalities may make memorization of the mapping easier and faster for the user. Both novel multi-sensory sound-temperature-color systems can be seen in Table 4 and Table 5. In Table 4, a coding where color hue is expressed as sound, and the other color dimensions are expressed as temperature, is presented. On the contrary, in Table 5 the color hue is expressed through temperature and the other dimensions are expressed by means of sound cues. We created a naming convention for these two possible mappings by following the order of the sensory experience: sound-temperature-color coding and temperature-sound-color coding, respectively.
Table 4. Designed sound–temperature–color coding.
Table 5. Designed temperature–sound–color coding.
For the satisfactory development of a multi-sensory color-coding system based on these methods, three are the elements that needed to be figured out:
  • Finding out whether it was better to represent color hue with sounds and the color dimensions with temperature, or vice versa.
  • Knowing which one was those warmest and coldest colors (that appear in Table 5) from the sound set and the temperature set. In other words, setting the dark dimension as an example, with many sounds representing the quality of “dark” such as “dark green” or “dark red”, it was important to figure out which one of all those dark color-sounds expressed the dark quality of color the best.
  • Finding out which sound set from the two options (VIVALDI and CLASSIC) is in general terms more suitable to express the different dimensions of color.
Tests were performed for answering these questions. These tests and their analysis and results will be explored in the following sections.

3.3. Hardware

For the temperature system, a thermal display that was developed for prior research was used [7]. The system consisted of an array of Petliers, which is a device that releases heat on one side and absorbs it through the other one when electric current passes through it. All the Petliers are driven by a dual H-bridge board controlled through an Arduino Mega microcontroller. Figure 1 shows the array of Petliers that was used during testing. An array of petliers was used in order to be able to set each petlier at a different temperature from the beginning, so the test could be perform faster. The temperature range of each petlier was from 10 °C to 40 °C.
Figure 1. Peltier array temperature device and controller (Adapted from ref. [7]).

4. Experimentation

Inspired by the research related to music and color association [21], we chose to use a common semantic and emotive link to compare the different modalities. We used as a link a list of adjectives and the emotional-semantic space they created. Osgood [22] simplified the semantic space of adjectives into three aspects, which are (1) evaluation (like–dislike), (2) potency (strong–weak), and (3) activity (fast–slow). The adjectives we decided to adopt in this research are the pairs of adjectives that people are familiar with; emotion, shape, location, activity, texture, contrast, temperature, sound characteristics, and so on.
As a result, 18 pairs of adjectives, each set of six representing one of the three different Osgood semantic spaces, were chosen. In other words, there was a set of adjectives representative of the whole semantic space with which to create a comparison between modalities. That modified list of adjectives from Osgood [22] can be seen in Table 6, where the column indicates the Osgood adjective list.
Table 6. Selected semantic adjectives (modified from Osgood [22]) to be used as a common link between sound coding colors and color dimensions like warm/cold and bright/dark.
The main idea for the test was the following: classifying the adjectives into warm/cold and dark/bright dimensions, correlating the different adjectives to the different sound and temperature cues, and, as a result, giving to each sound and temperature a warm/cold and dark/bright score to find out which cues expressed the warm, cold, dark or bright dimensions the best. Additionally, those scores would help us find out whether VIVALDI or CLASSIC was a better option for representing the color dimensions and whether it was better to express color hue with temperature and color dimension through sounds or vice versa.
In total, three different types of tests were performed: one for classifying the different adjectives into the warm/cold and dark/bright main dimensions, a second one for finding out the weights of each particular pair of adjectives with the dimensions they were classified into, and one last test which had the users selecting adjectives for each one of the temperatures and sound cues. The three test were analyzed and the results presented in the analysis section.
The number of participants was 18. They were college students who had normal eyesight and an average age of 21.5 years old. Since tests were performed on different days, not all of them were able to participate in all tests. 15 users participated in the first two tests and a total of 12 users in the third one. All the test sessions included an explanation of the test and its procedure before starting the surveys. Test duration varied, with the first and second one lasting together for about 25 min per person and the last test lasting for around 45 min per person. The testing procedure was the following:
(1)
Introducing the context of the research, explaining about visually impaired people and art exploration, color, and multi-sensory systems.
(2)
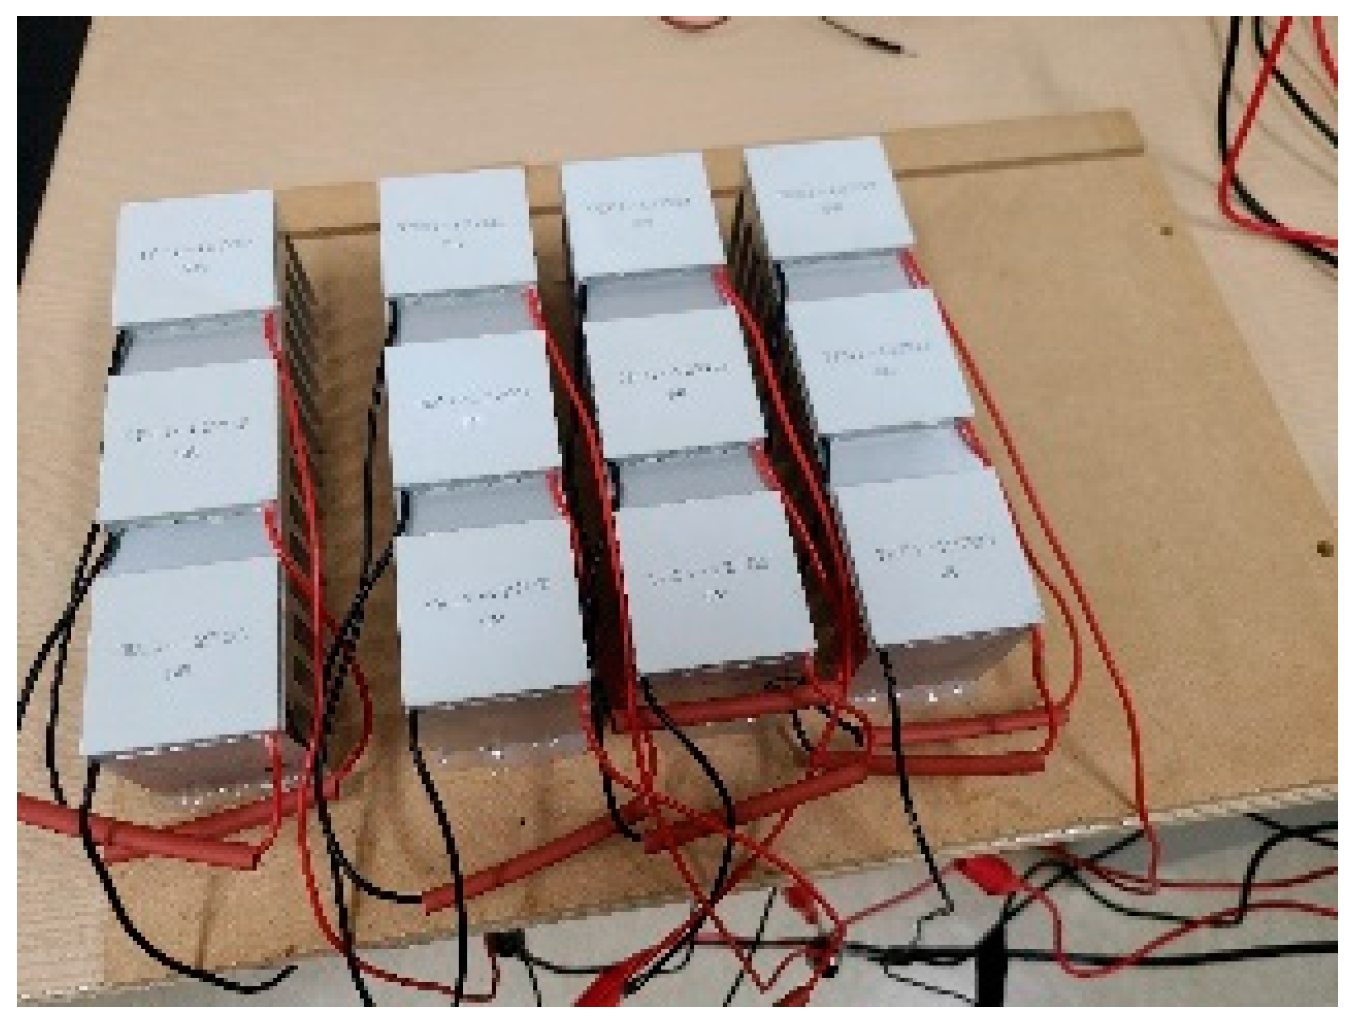
Introduction of the Petlier thermal display prototype (only during the third test).
(3)
Lastly, the tester interacted with the different audio or temperature cues and was given the survey questions. Each audio cue was heard as many times as the user needed (the user was given the playback control for repeating it until he/she was ready to answer the survey question related to that cue). Similarly, the user was able to feel the different temperatures as many times as desired before answering to the survey question related to that temperature cue.

4.1. First Test: Classifying Pair of Adjectives

Users were asked to select which color dimension was related to each pair of adjectives the most: the bright/dark dimensions, the warm/cold dimensions, both of them or none. As an example, the answer of one of the users for the adjective pair “noisy–quiet” can be seen in Table 7. There, the user stated that the dimensions that is more correlated to the “noisy–quiet” adjective pair was the bright/dark dimension of the colors. Table 8 presents the results after summing up all the answers. The number indicates the total of users that ticked an option. Since some users selected the option “both”, it is possible that the sum of the bright/dark and warm/cold counts results in a number higher than that of the total number of users.
Table 7. Example of the dimension survey for the adjective pair “noisy-quiet”.
Table 8. Total count of answers for all adjectives after surveying 15 participants. L/D is the bright/dark dimension and W/C is the warm/cold dimension.

4.2. Second Test: Calculating Weights of Each Pair of Adjectives for Each Dimension

In this test, the users were asked to rate the correlation of each pair of adjectives with each individual dimension: warm, cold, bright, and dark. The scale used was from −2 to 2. Table 9 shows the answer of one of the users for the adjective pair “noisy-quiet” in relation to the color dimension “bright”.
Table 9. Example of the weight score survey answered by one participant for the dimension bright and the adjective pair “noisy–quiet”. Participants were asked to give a weight score of each pair of adjectives for each one of each color dimension.
Once all the users rated all the adjective pairs in all the dimensions, four tables with the weights for each dimension and pair of adjectives, graded from −2 to +2, were made. Negative numbers indicate that the dimension is directly correlated with the adjective from the left column, while positive numbers indicate that it is directly correlated with the adjective from the right column. The number indicates how strongly the correlation is, with −2 and +2 being the strongest correlation and a zero meaning there is no correlation at all. As an example, in Table 10, the weights for the dimension of bright can be seen. Similar tables for warm, cold, and dark dimensions were also made but omitted here for brevity.
Table 10. All weight scores for each adjective pair or the “bright” dimension. Similar weight tables were acquired for the warm, cold and dark dimensions. The standard deviation is indicated next to the value in parenthesis.

4.3. Final Test: Linking Adjectives to Each Modality Cue

During the final test, all modalities and all cues (VIVALDI sound, CLASSIC sound, and temperatures) were given a score for each one of the pairs of adjectives stated above. For example, in the case of temperature modality, the process was the following.
First, the user would feel one of the temperatures seen in Table 2, and, for each one of those temperatures, a form sheet like the one shown in Table 11 would be filled up. As an example, Table 11 has been filled up with all the answers of one of the users after having felt the 38 °C temperature Peltier. This same process was performed not only with the rest of the temperatures but also after listening to each one of the sounds from the VIVALDI and CLASSIC sounds. As a result, there was an adjective-graded sheet for each one of the cues (each one of the temperatures and sounds) of the three different modalities contemplated.
Table 11. Adjective score table of the 38 °C temperature cue filled up with the answers of one of the participants. The users answered similar score tables after hearing to each musical sound and feeling each temperature.
From all the testers’ answers, an average score on the scale of [−2, 2] was calculated. The value of −2 would be the equivalent to all testers giving a score of 1 to the adjective during the survey. A score of +2 would be the result of all participants giving a score of 5. As an example, the results for the saturated red of the VIVALDI set of sounds can be seen in Table 12.
Table 12. Adjective score results for VIVALDI red saturated color. Similar adjective scores were acquired for all colors and temperatures from the third test.

5. Analysis and Results

5.1. Analysis

Analysis of the results was performed for finding out the best design of the multi-sensory color-mapping system. The analysis process was the following.
First, by means of the results presented during the second test, we created a weight table indicating all the pairs of adjectives and their relative weights to each one of the four dimensions: bright, warm, cold, and dark (Table 13). However, only the adjectives that were selected during the first test as related to that particular dimension were taken into account when filling up the table. Therefore, empty weights are the set of adjectives that were uncorrelated to that particular dimension on the first test’s results. Both the weight table and the adjective score (like the one shown in Table 12) for each one of the sounds and temperature cues were used to calculate a bright score, dark score, warm score, and cold score for each cue. The basic formula for each of those four scores was the following.
S c d = i ( W d i + S c i )
where S c d is the total score of the dimension “ d ” for the cue “ c ”, W d i is the weight of the dimension “ d ” for the adjective pair “ i ”, and S c i is the score of the adjective pair “ i ” for the cue “ c ”.
Table 13. Weight score summary of each adjective pair for each one of the four dimensions.
After applying the formula for all dimensions and each sound and temperature cue, three color dimension score tables were created, one for VIVALDI and all its sounds, other one for CLASSIC and all its sounds, and the last one for all the temperatures. An example of all the scores for the VIVALDI set can be seen in Table 14. Only the positive results are relevant, since it indicates cues that are directly correlated to the different dimensions. In Figure 2, Figure 3, Figure 4 and Figure 5, bar plots graph indicating all the positive scores of all sets for each dimension can be seen. In Figure 6, the highest store per dimension for each set is presented. Lastly, in Figure 7, Figure 8 and Figure 9, all the scores of all the cues (negative values included) are presented in a boxplot graph for each one of the methods and dimensions.
Table 14. Color dimension scores for VIVALDI. The scores are within the range [−100,100].
Figure 2. Positive scored cues in all sets for the bright dimension.
Figure 3. Positive scored cues in all sets for the dark dimension.
Figure 4. Positive scored cues in all sets for the warm dimension.
Figure 5. Positive scored cues in all sets for the cold dimension.
Figure 6. Highest score graph of the three methods for each of the four dimensions.
Figure 7. Boxplot of the four dimensions for all points for VIVALDI. The average, max., and min. values, together with the different percentiles, can be seen.
Figure 8. Boxplot of the four dimensions for all points for CLASSIC. The average, max., and min. values, together with the different percentiles, can be seen.
Figure 9. Boxplot of the four dimensions for all points for TEMPERATURE. The average, max., and min. value, together with the different percentiles, can be seen.

5.2. Results

These final scores can aid us in finding out which VIVALDI, CLASSIC and temperature cues are the ones that express the bright, dark, warm, and cold dimensions of colors the best. For finding that out, it is necessary to select the sound and temperature cues that scored the highest for each dimension. Table 15 presents the cues that score the highest for each dimension and method and the name of that cue.
Table 15. Highest scores attained by each method for each color dimension. The name of the cue which attained that highest score can be seen inside the parenthesis.
Several interesting points can be observed from these results:
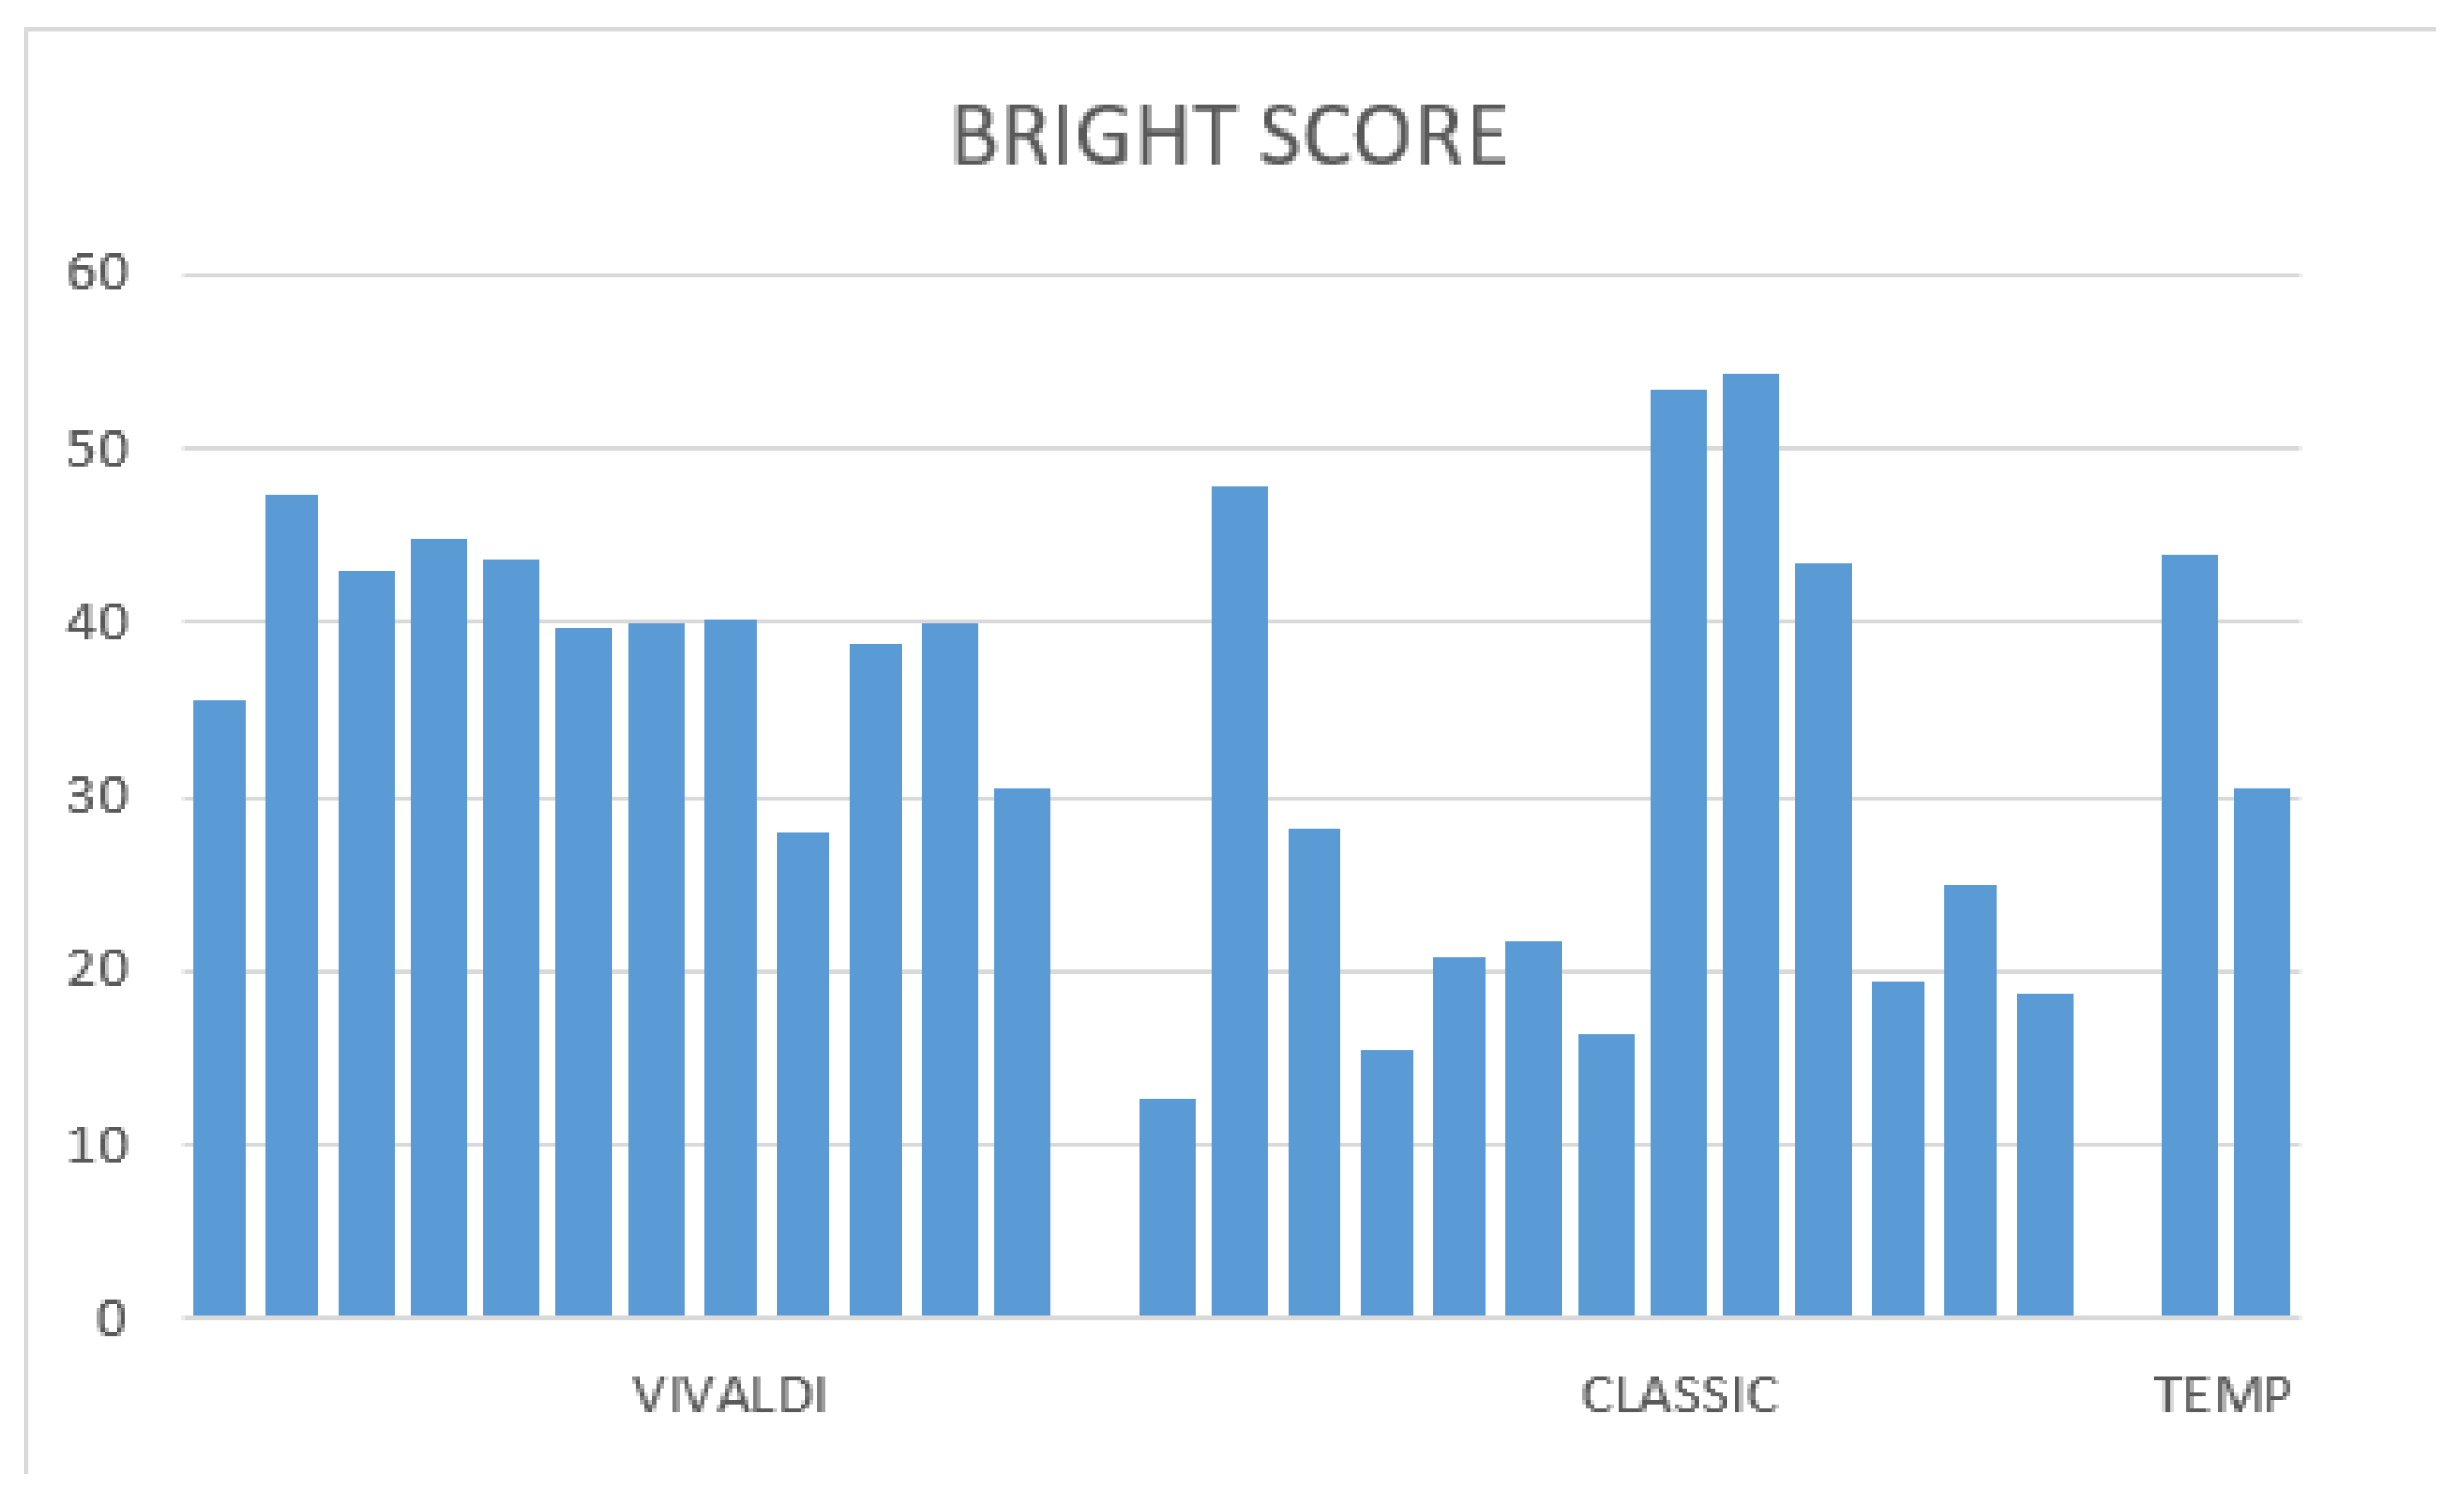
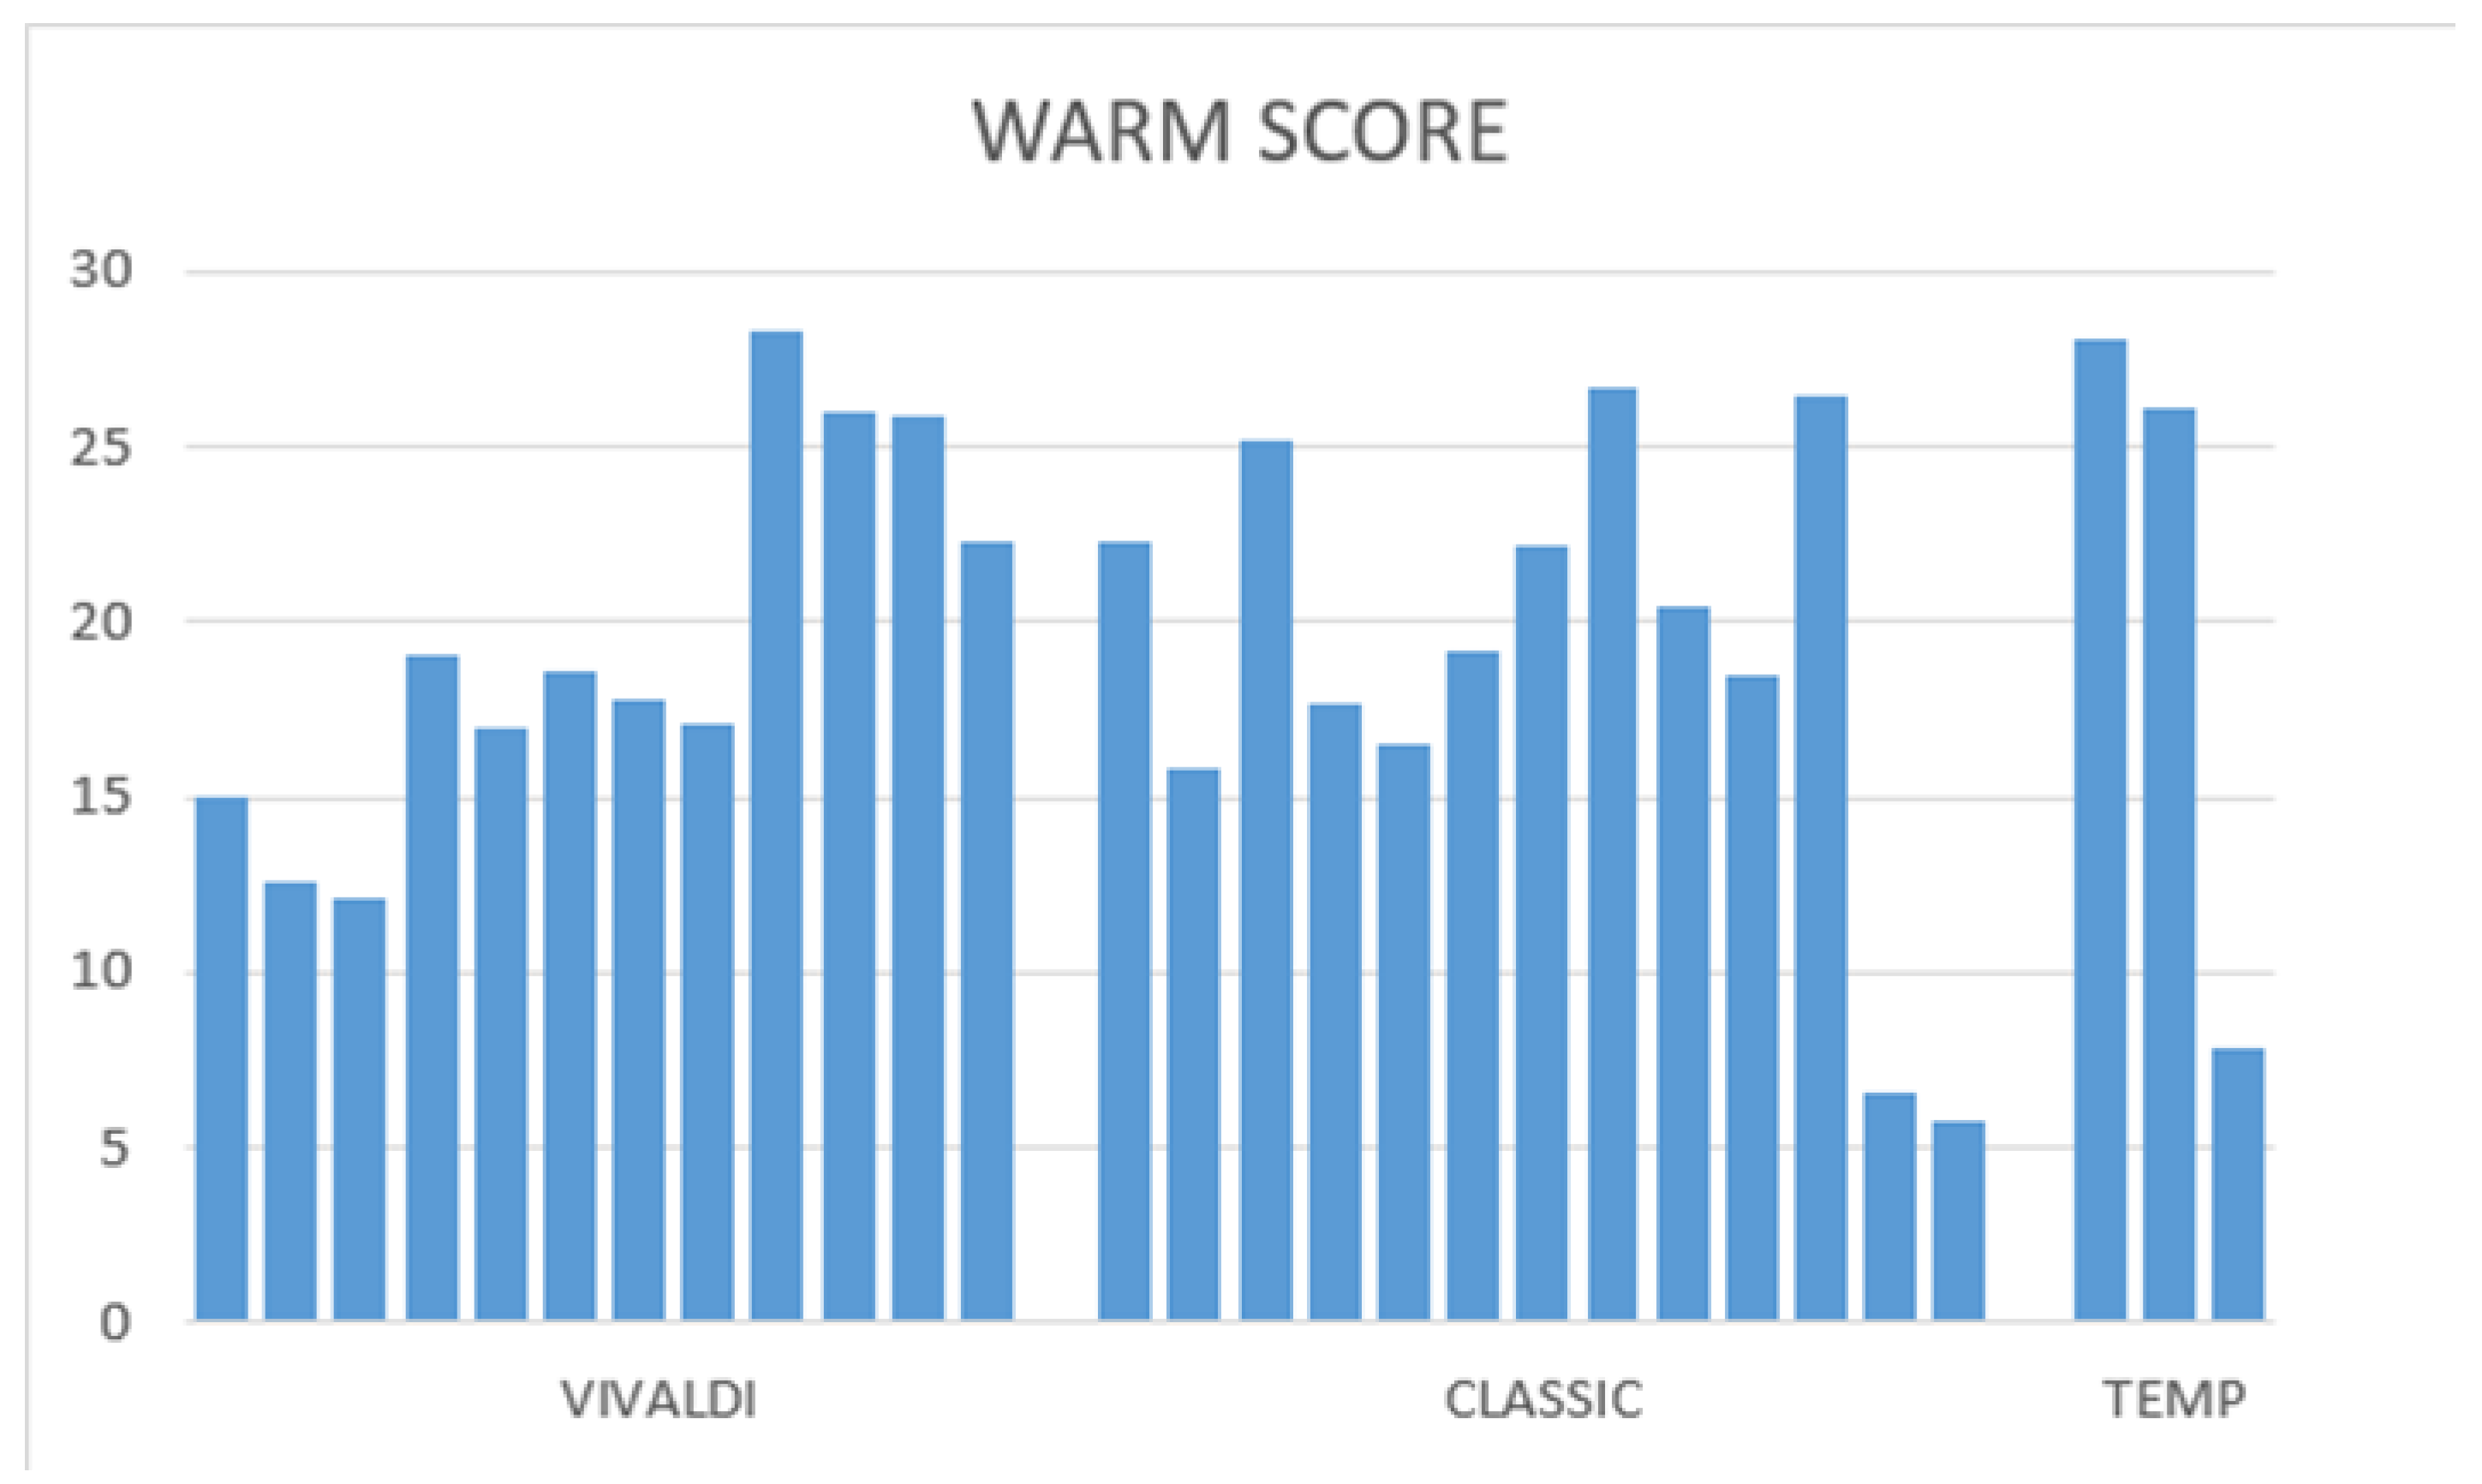
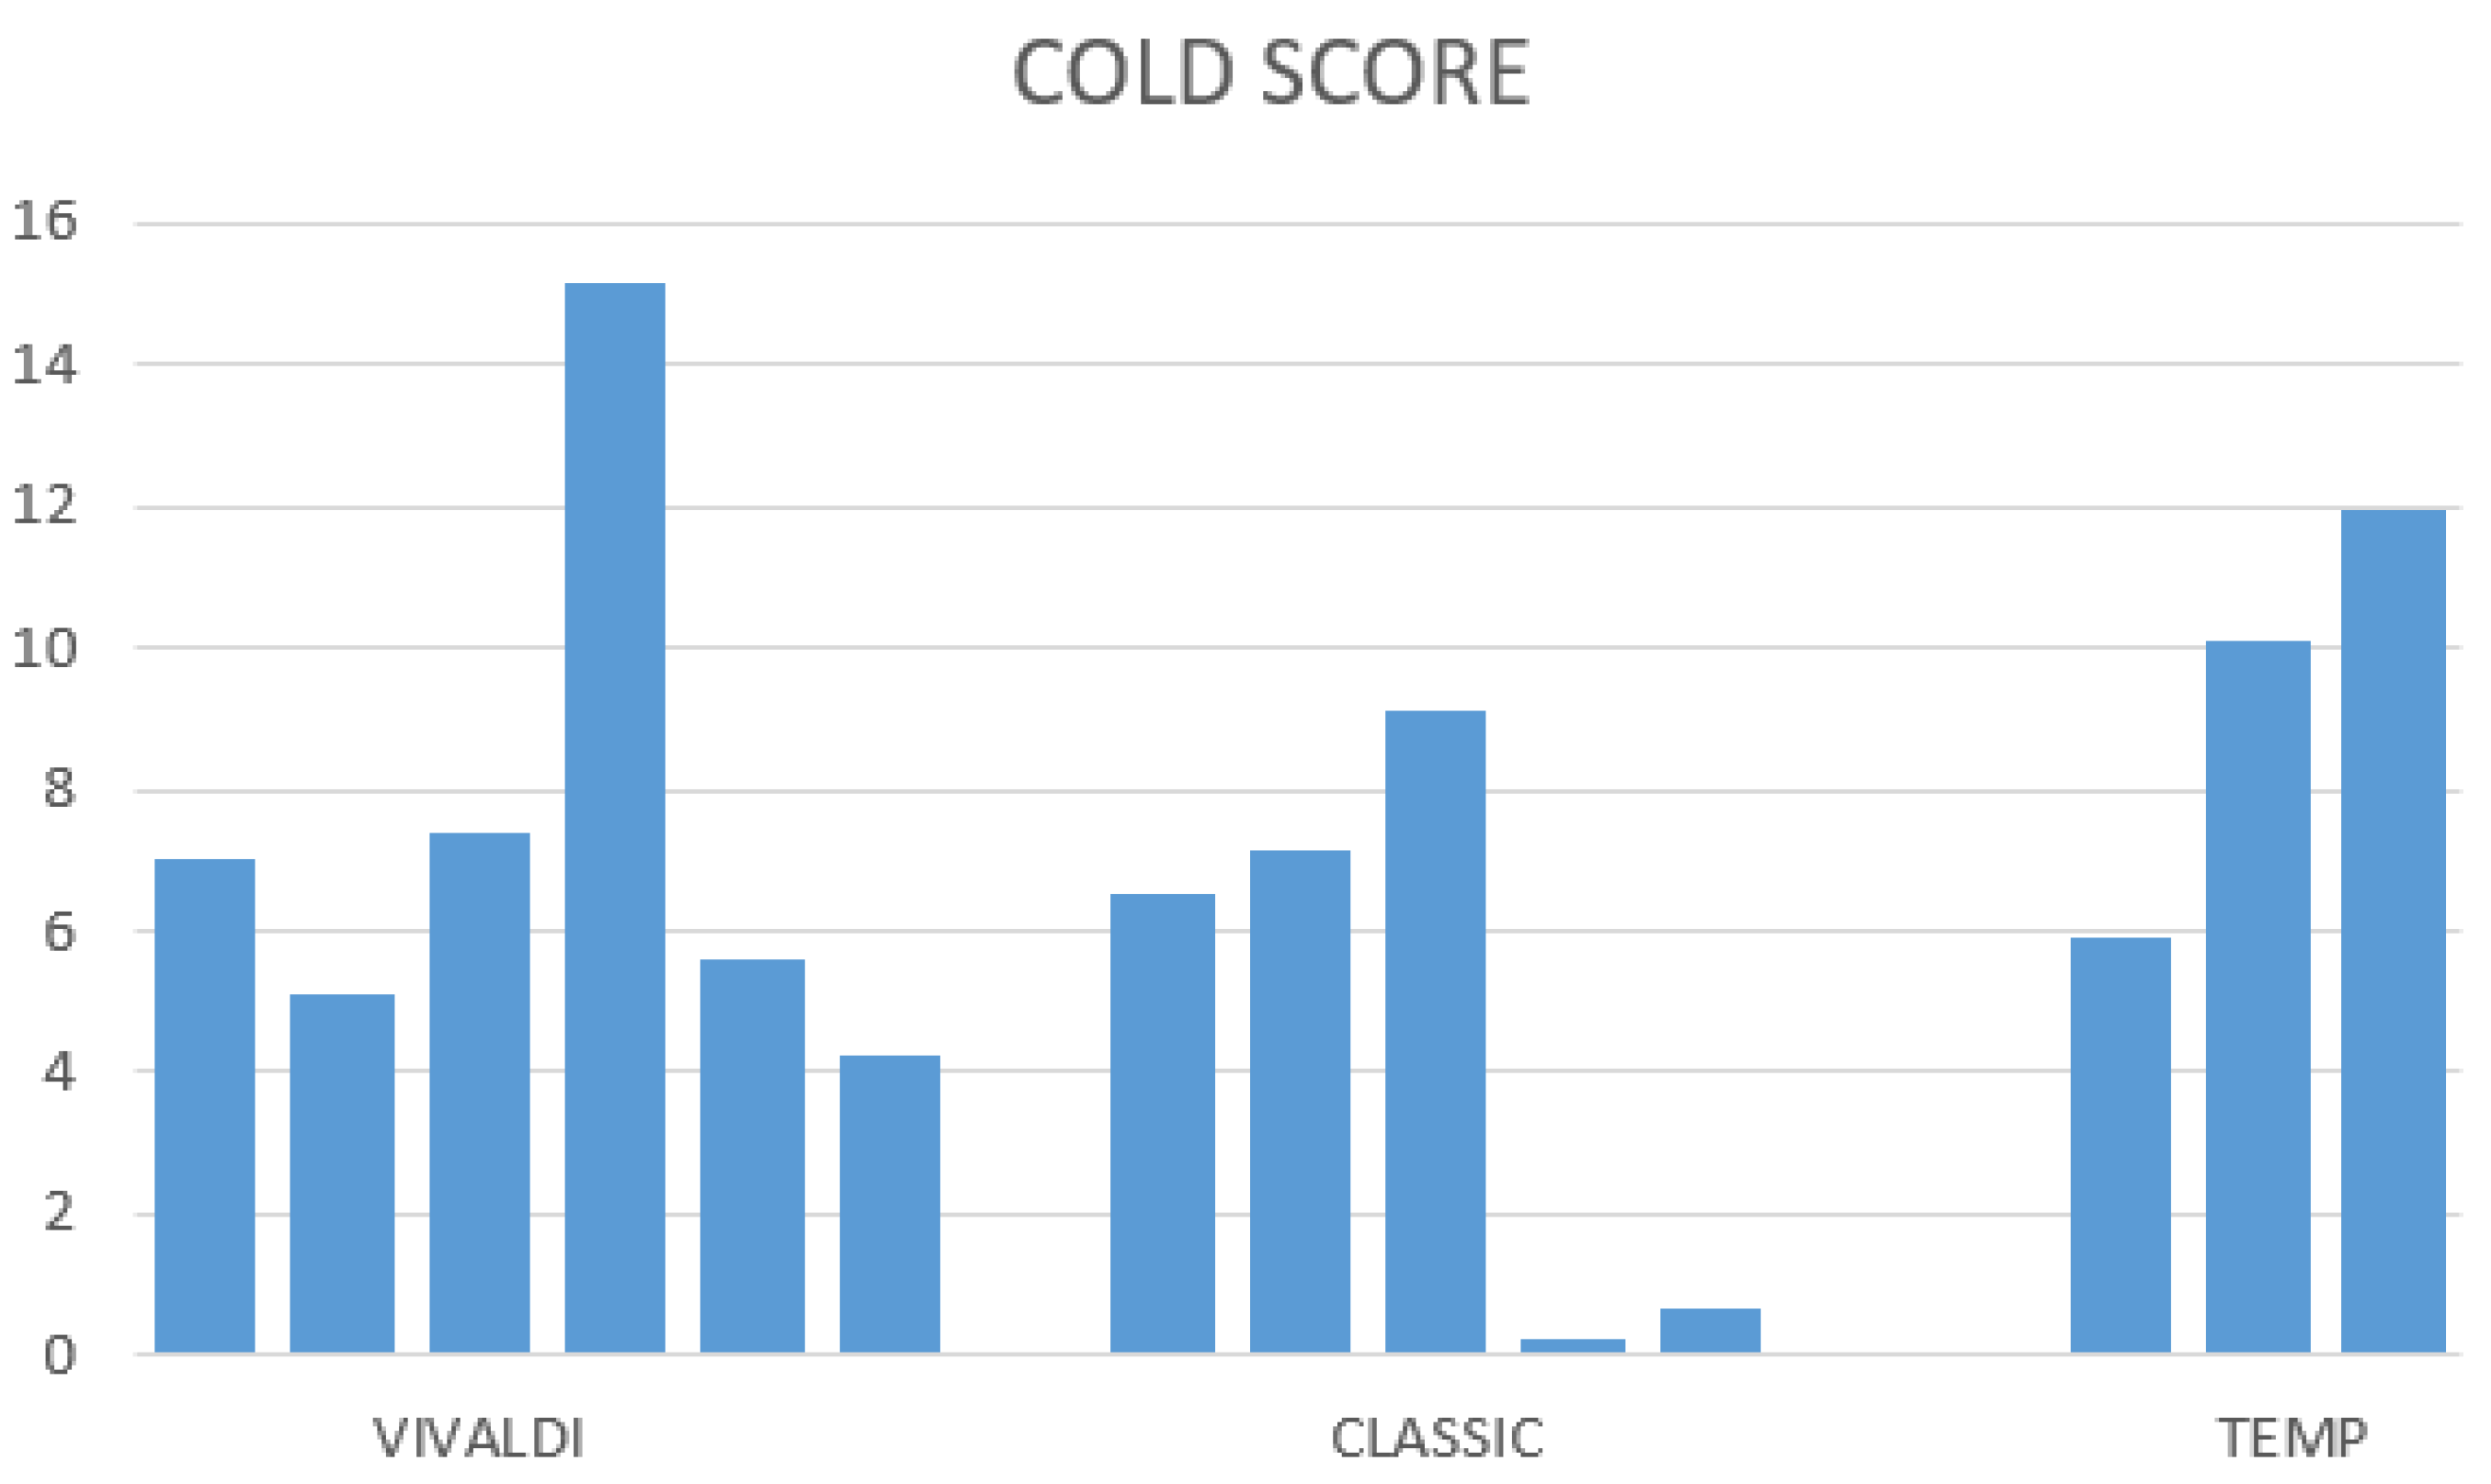
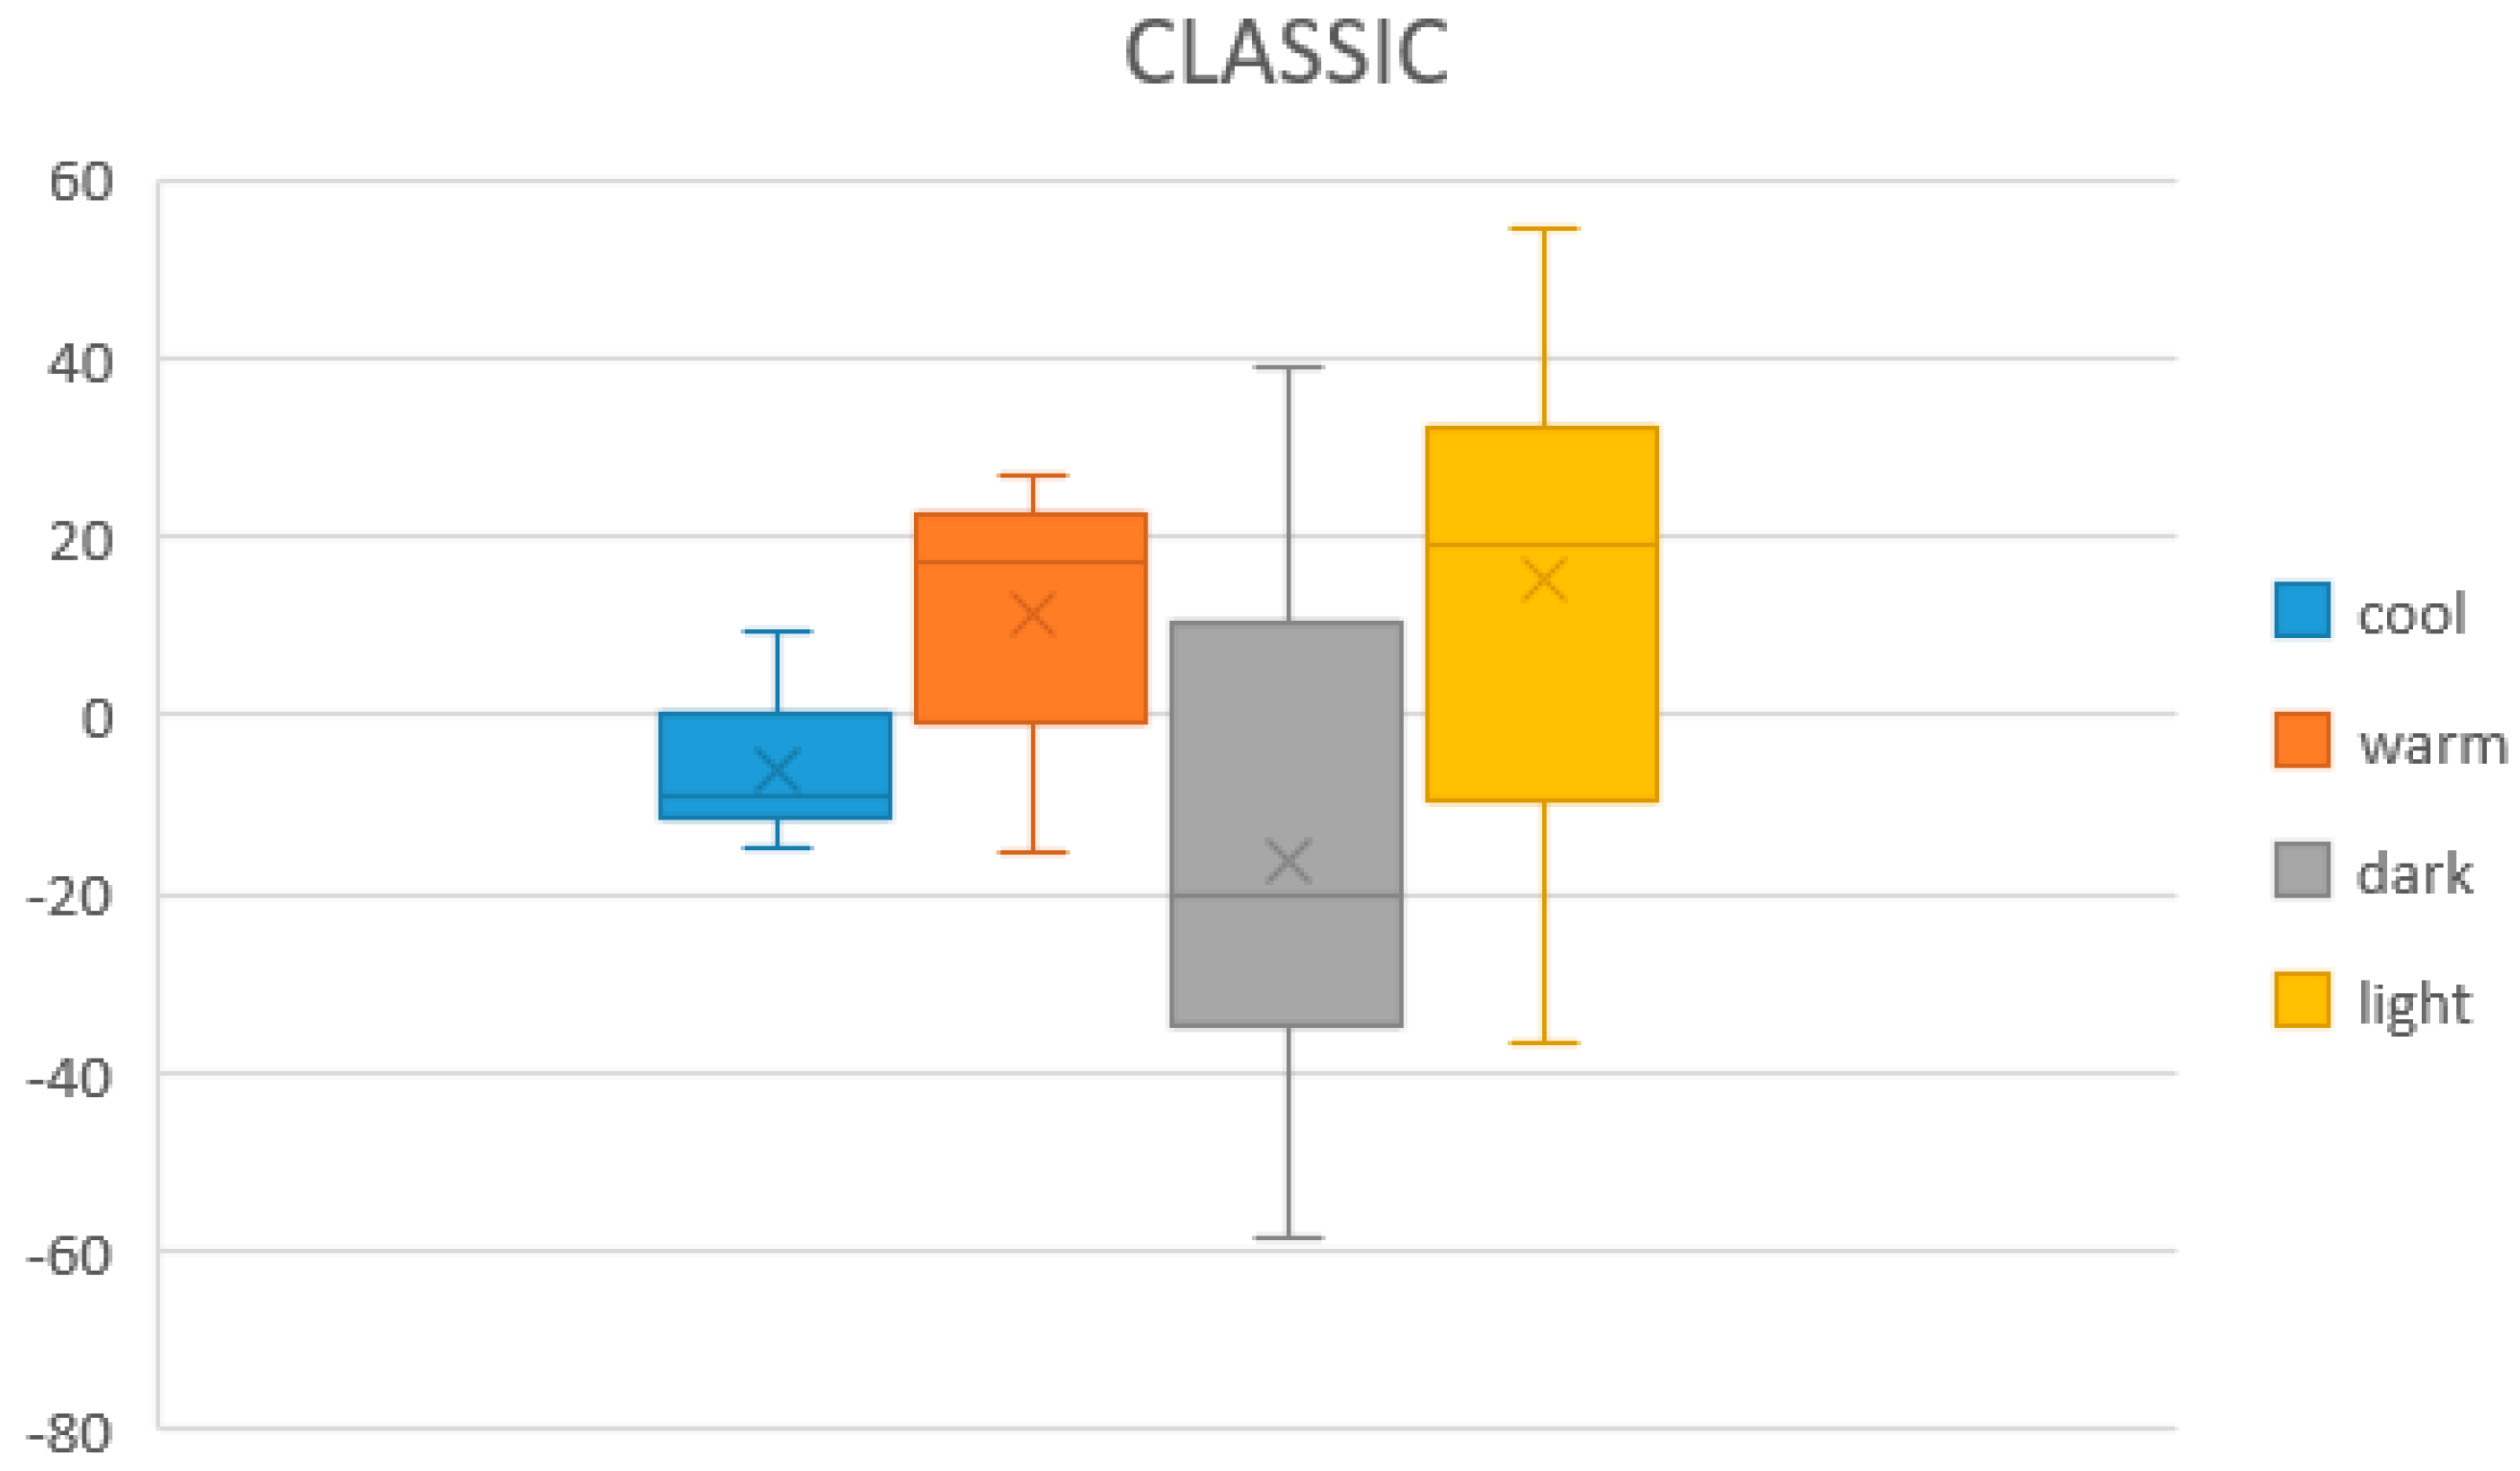
  • The CLASSIC sound set’s cue which best expressed the bright and warm dimensions of color was the same sound. This was not convenient since users would not be able to discern whether the sound was expressing brightness or warmness. The cues for representing each dimension had be all different from each other so the user could relate each particular cue to a particular dimension.
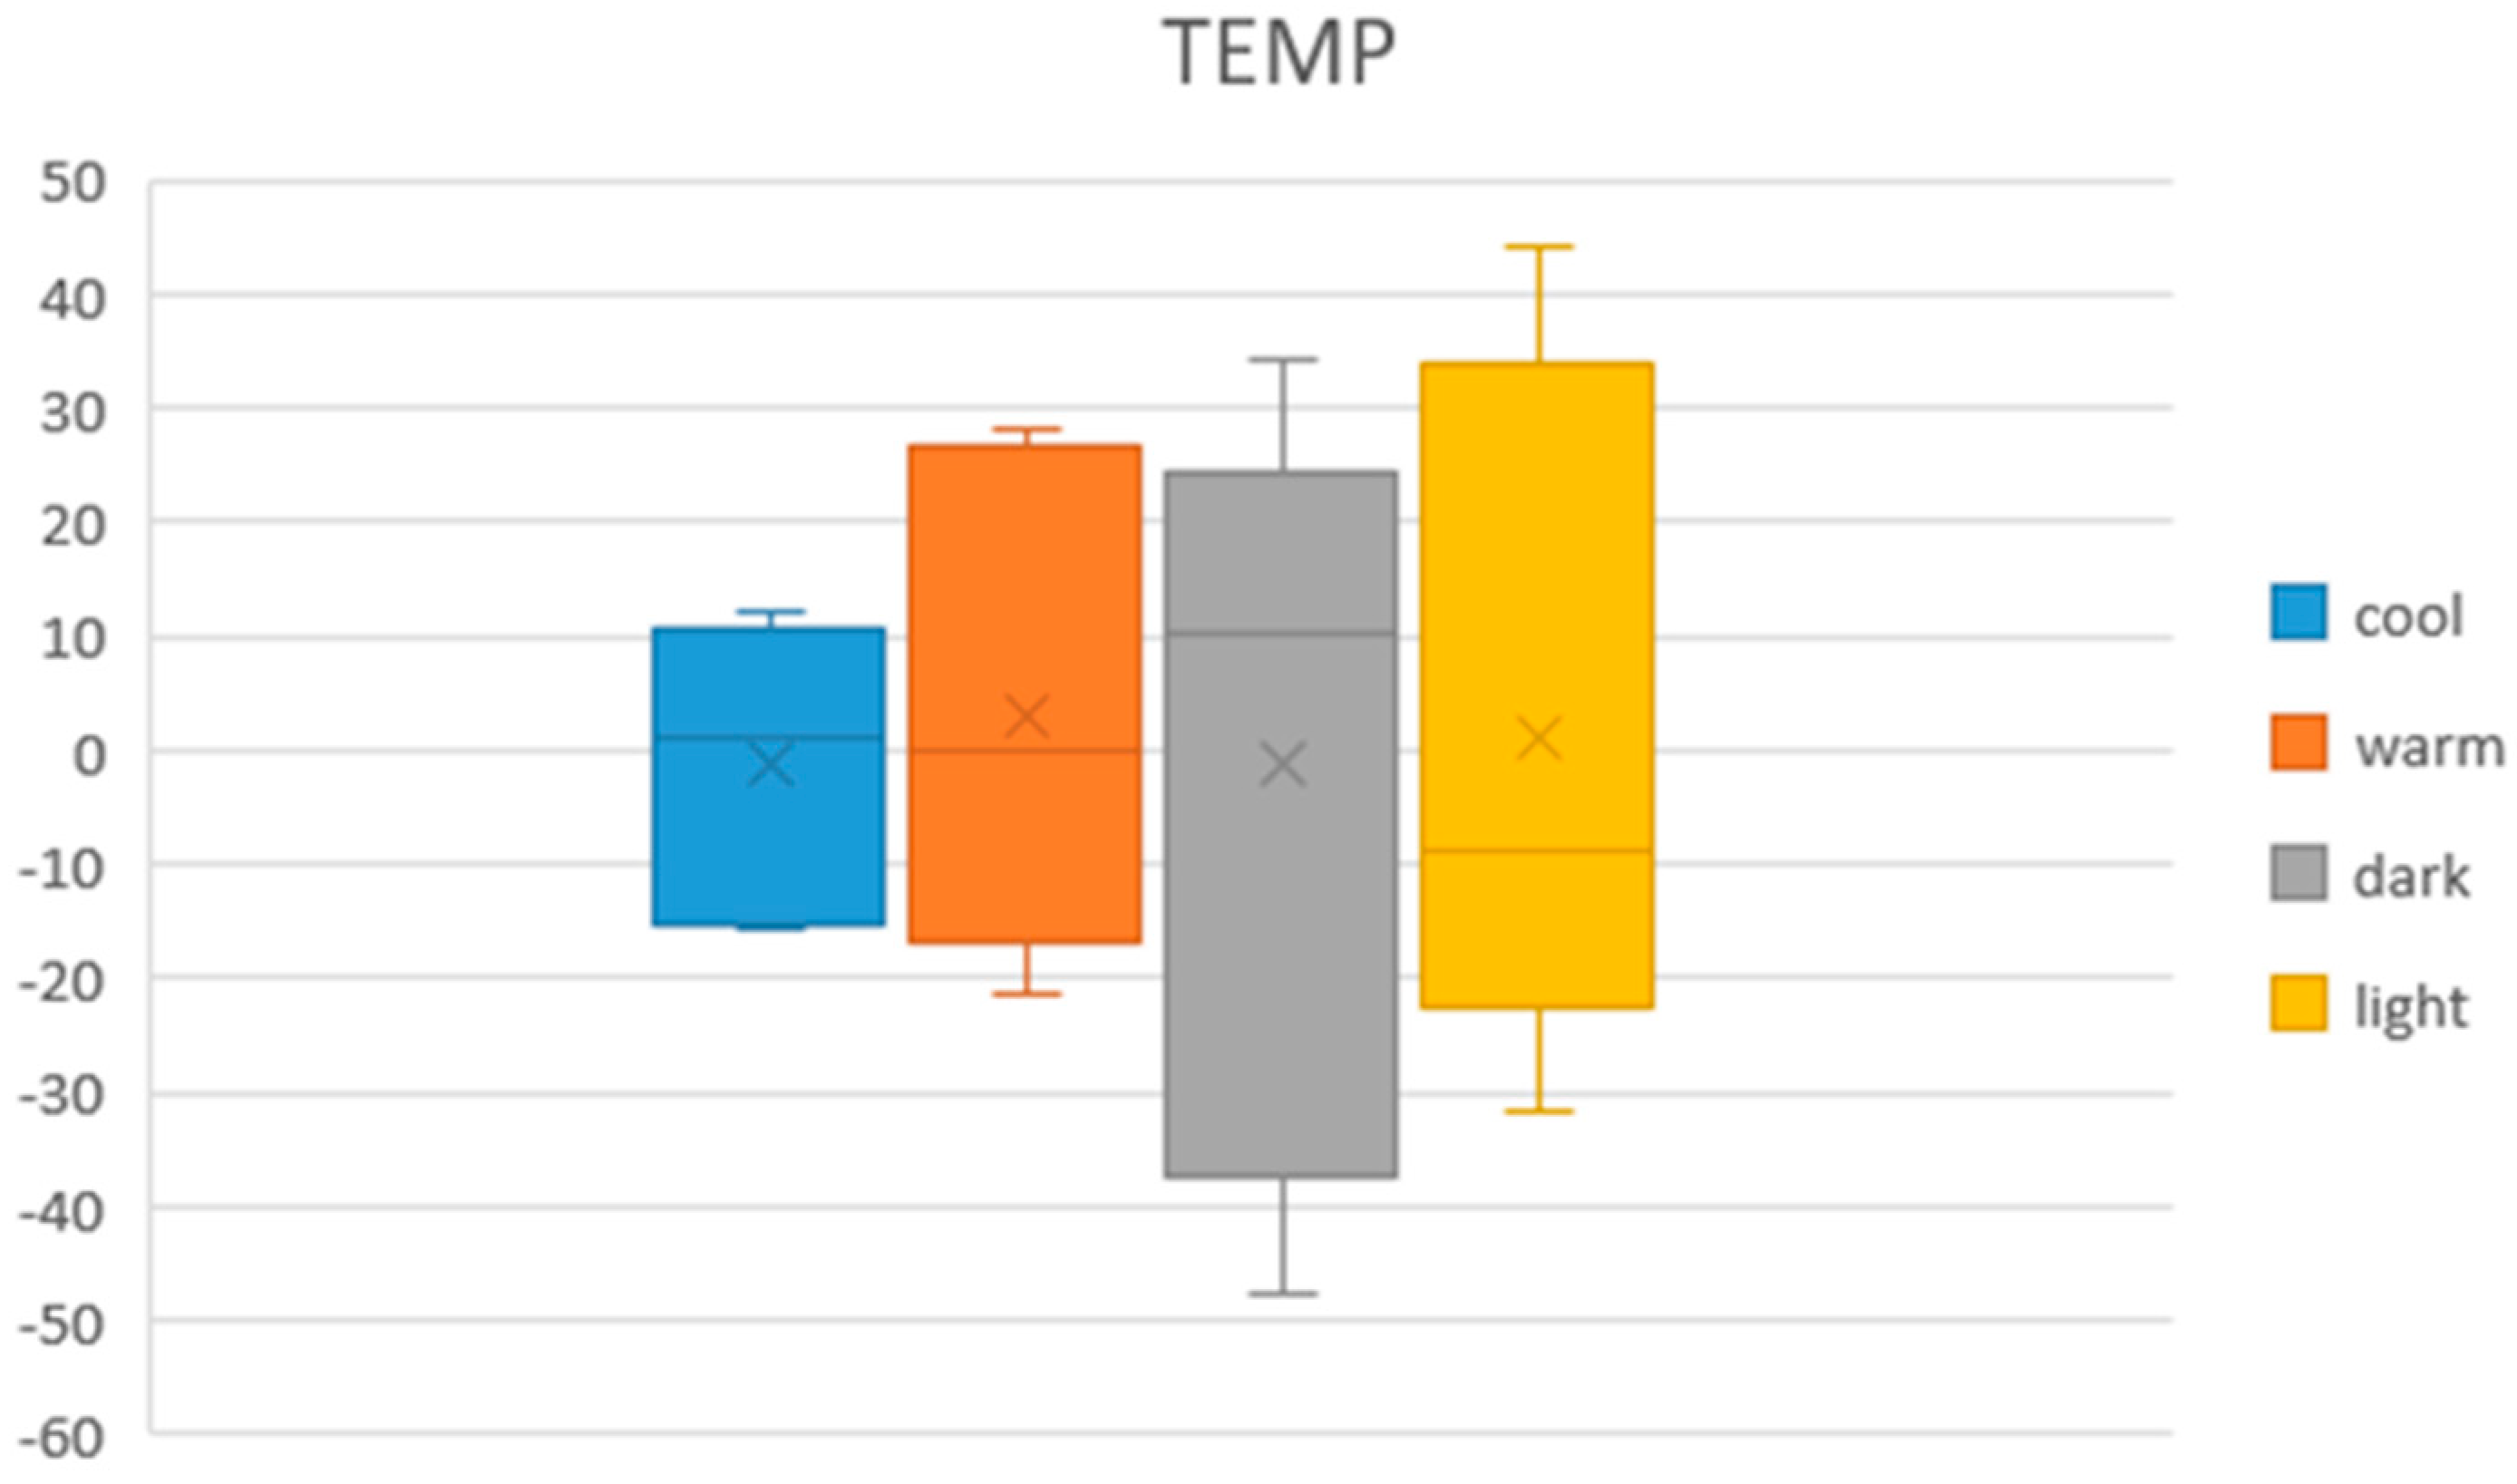
  • Similarly, the highest temperature of 38 °C is the best one for representing both the warmness and brightness of the color. Additionally, the coldest temperature of 14 °C was the best temperature cue for conveying darkness and coldness. Like with the CLASSIC sound set, this reiteration of cues made temperature modality not suitable for representing the color dimensions.
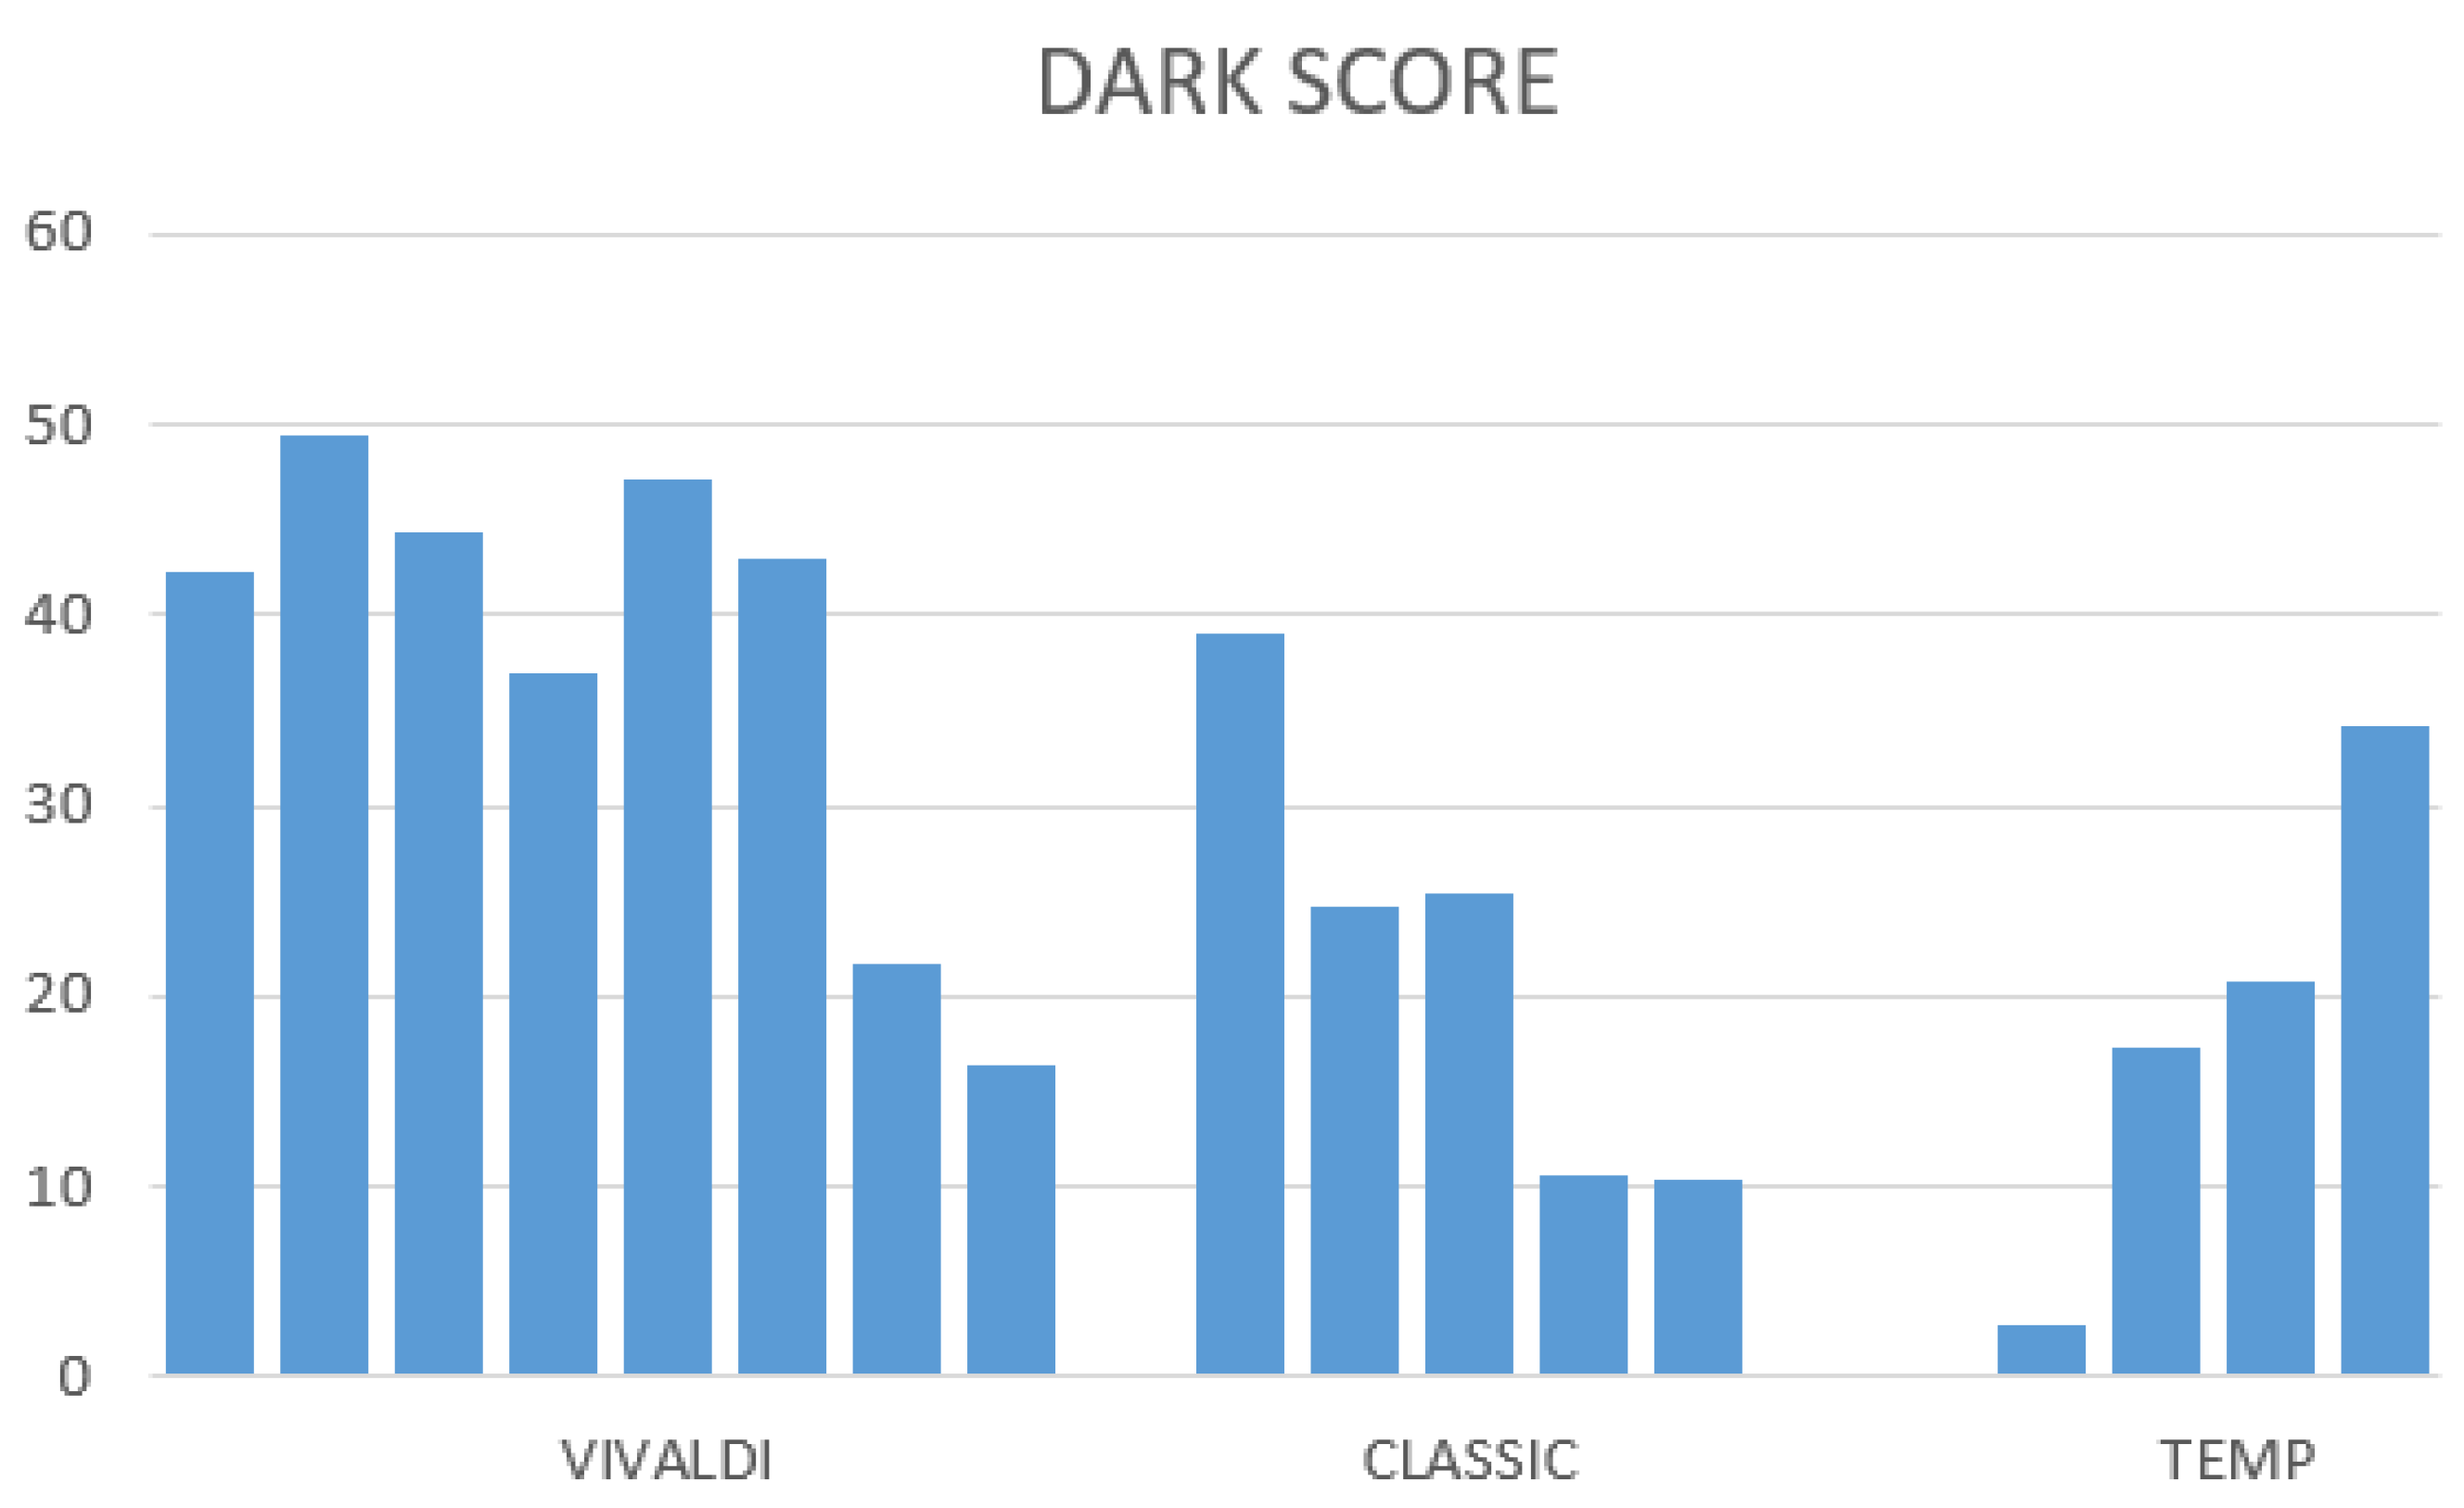
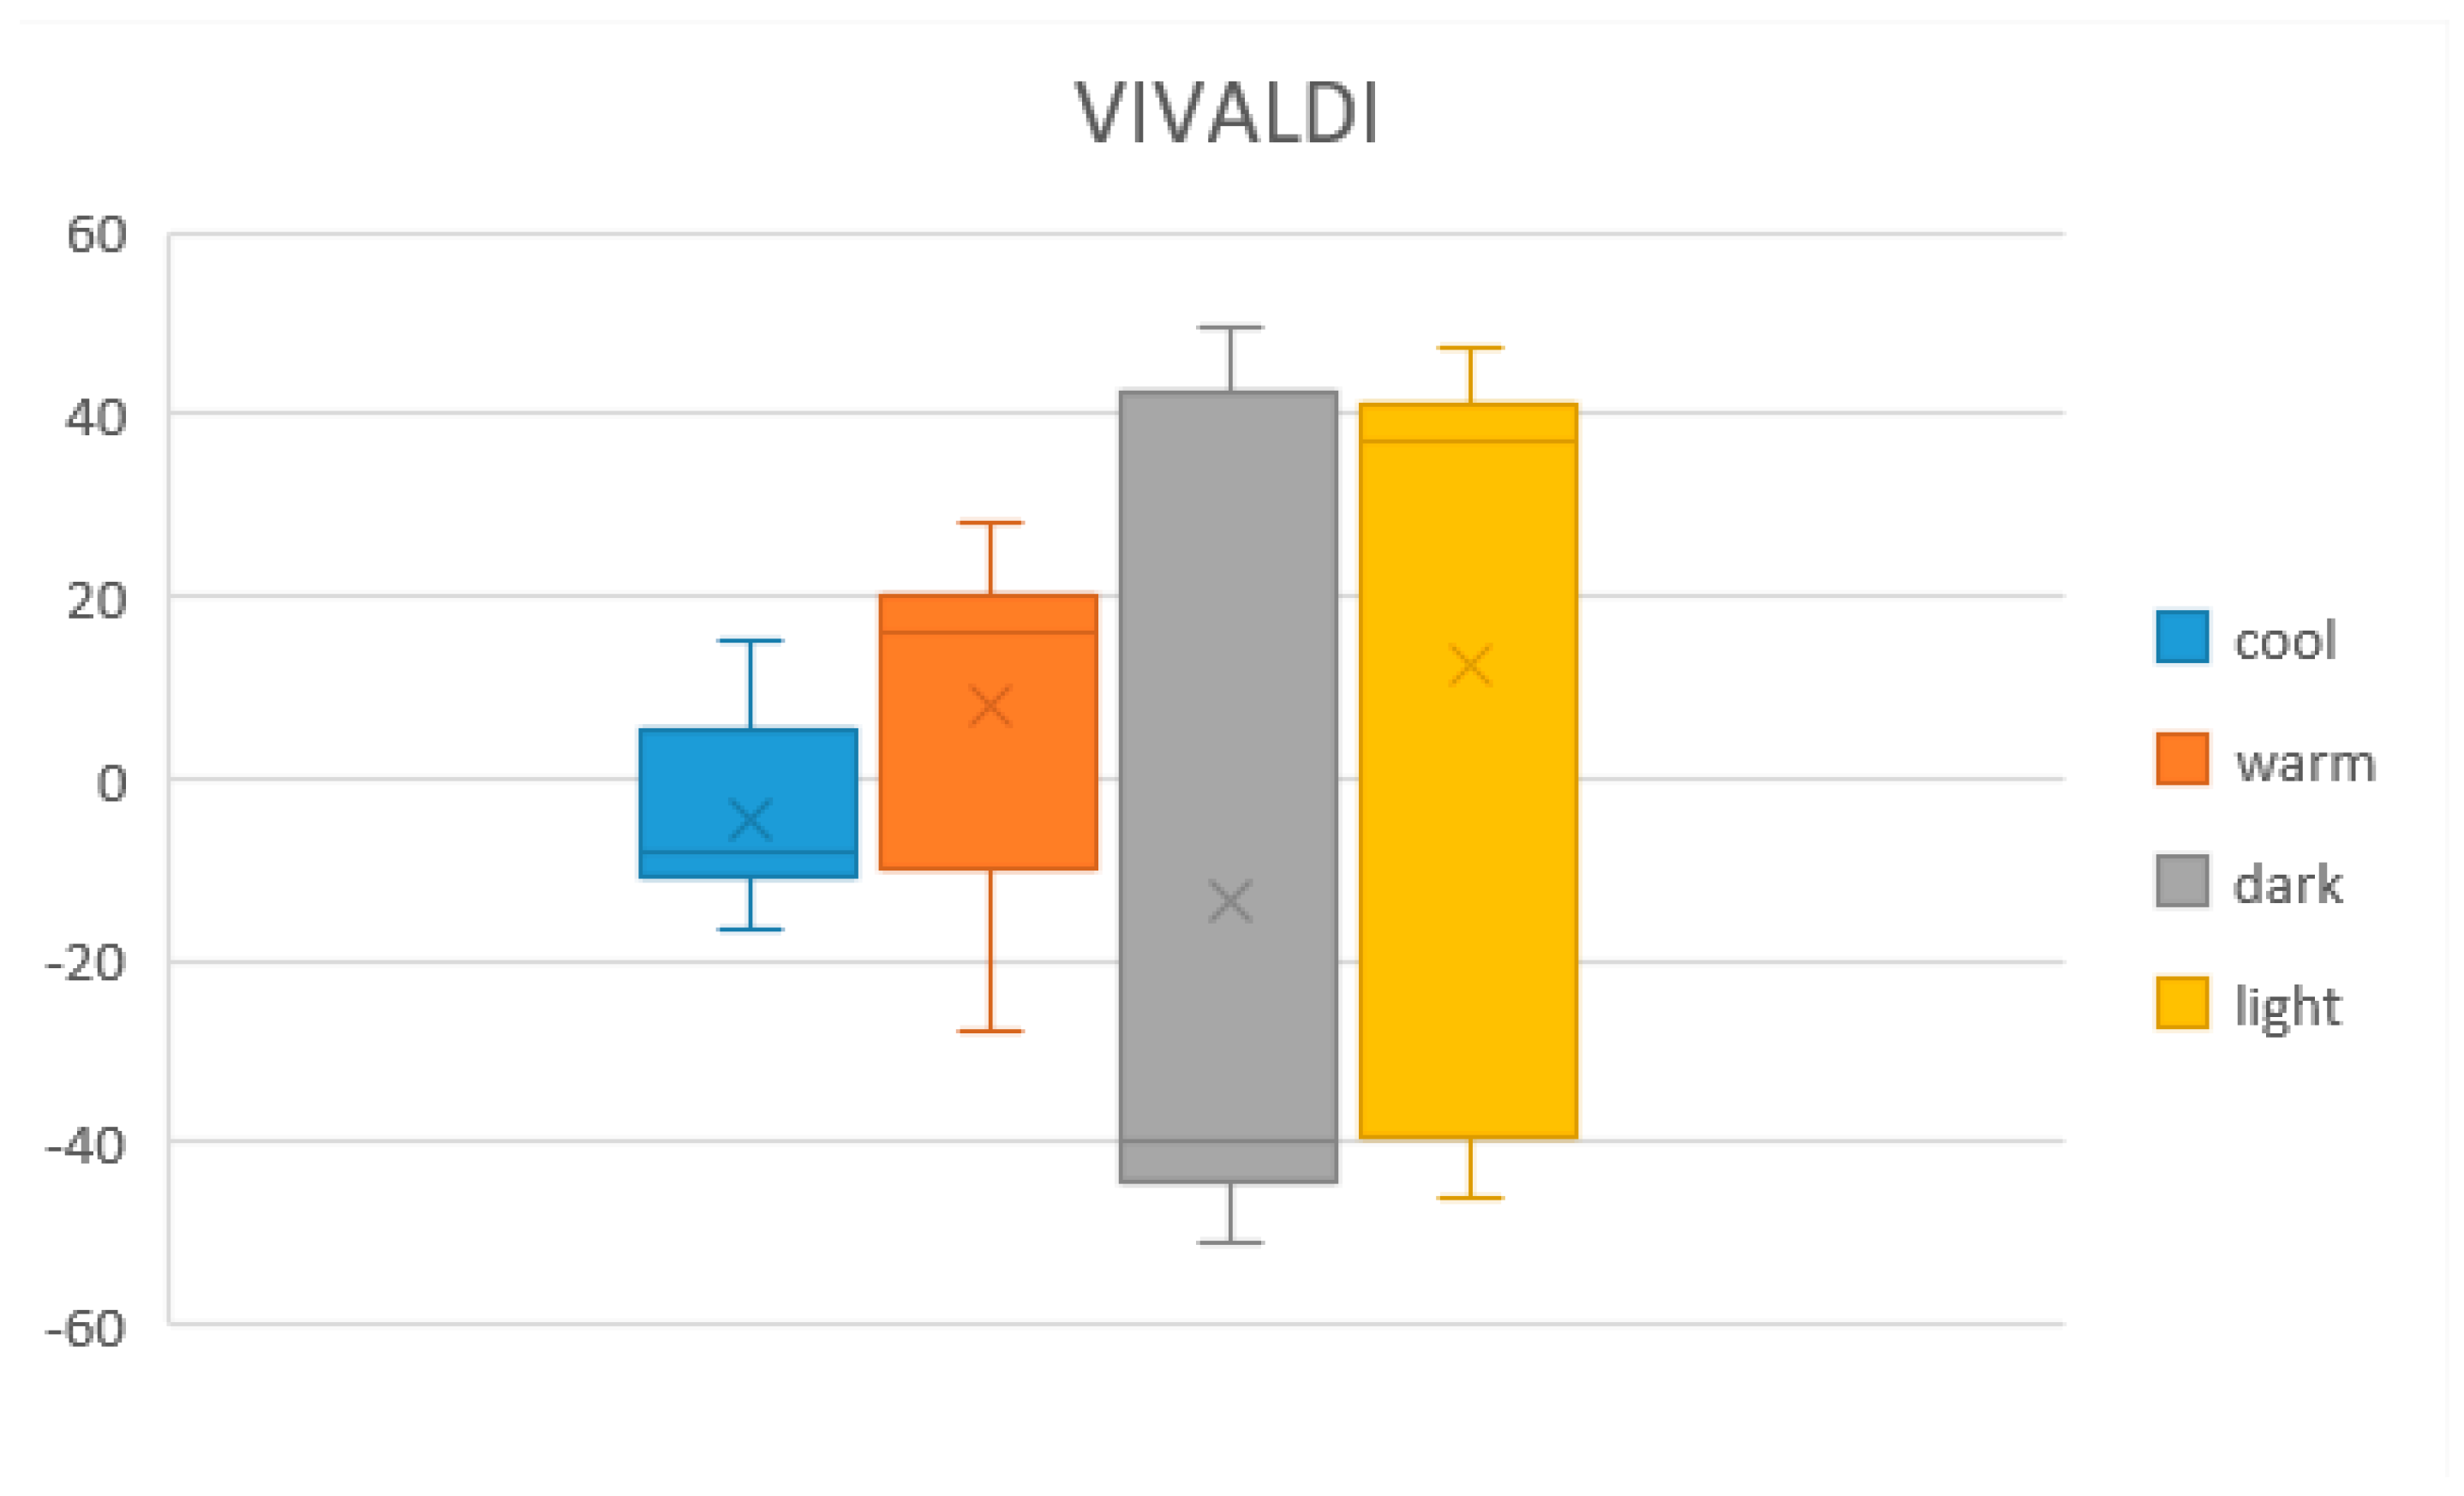
  • On the contrary, none of the VIVALDI sounds is repeated. Each dimension is conveyed best by a different musical sound cue.
  • Except for conveying brightness, in which CLASSIC sound reached a higher score, VIVALDI sound reached higher scores for all the other three dimensions when compared to both the CLASSIC and temperature sets.
Taking into consideration these observations, it was possible to reach several conclusions. First of all, all the cues that expressed most accurately the different dimensions of color were clearly defined. Additionally, it is clear that, for expressing color dimensions, VIVALDI sounds were better than CLASSIC sounds since, except for one dimension, the scores reached by VIVALDI sound cues were higher. In addition, it was better to use temperatures as a way of expressing color hues and sounds to express color dimensions, since, as observed above, the warmest and the coldest temperature conveyed the best two dimensions each, but it was convenient for the user that each dimension was represented by one and only one cue. Therefore, temperature was not a good modality for representing color dimensions.
It can be concluded that the best multi-sensory algorithm was one where the temperature cues expressed color hue and VIVALDI sounds expressed the other color dimensions. In other words, the best multi-sensory method was the temperature–sound–color coding method presented in Table 4, which is shown now in its final complete state in Table 16. The algorithm of Table 16 is the temperature–sound–color designed through the tests and results that were observed.
Table 16. Final temperature–sound–color coding.

5.3. Final Temperature–Sound Coding Multimodal Test and Results

For assessing the final temperature–sound multimodal coding that was designed (Table 16, a final multimodal test with the final system was performed. The number of participants was 12. They were college students who had normal eyesight and an average age of 22 years. The test sessions included an explanation of the test and the method, a short training time so the user could familiarize himself/herself with the different temperatures and sounds, and a final test in which the user had to guess which color the multimodal system was representing through its sound and temperature. Test duration lasted around 25 min per person. The testing procedure was the following:
(1)
Introducing the context of the research, the system and the method (5 min).
(2)
Explanation of the 10 different cues and training time for both the six temperature cues and the four sound cues (10 min)
(3)
After that the users were tested on 10 colors. The users were given the multimodal feedback related to each color and were asked to find out which color it represented. In other words, after feeling both the temperature cue and hearing sound at the same time, they were asked about the color. The users were given a printed page similar to Table 16 so they did not need to memorize what each temperature represented. All the users were given the same questions in the same order.
The accuracy during the test can be seen in Table 17, and a list with all the wrong and correct answers, divided into hue (represented through temperature) and dimension (represented through sound) during the test can be seen in Table 18. Additionally, in Table 19 and Table 20, confusion matrices for both the hue and the dimension of the color (each one presented to the user as a temperature cue and as a sound, respectively) are presented. The total accuracy was 67.5%. Considering only the hue of the colors, the accuracy went up a little bit to 71.6%. On the other hand, the accuracy of guessing the dimension of the color through sound reached up to 92.5%. While 67.5% might not seem too high, it is important to consider the limited training time the users were given with. With a longer training time, the accuracy would likely increase. In addition, previous work [5] seems to suggest that the capacity for visually impaired people to discern temperatures might be higher than the one reflected here (with sighted users). On the other hand, the confusion matrices show clearly that the main recognition problem is caused by the colors yellow and orange, whose temperature cues (30 °C and 34 °C) are not easily discernible. Therefore, the temperatures cues for orange and yellow, and that particular temperature range of (30 °C, 34 °C) are things that will have to be modified and improved in the future in order to improve the system. Overall, the results are promising and the system seems to have the potential to be developed and improved on future iterations.
Table 17. Accuracy when discerning a color correctly (both hue and dimension) and same value when only taking hue or dimension into account.
Table 18. Final multimodal system test results for 12 users. “H” means the answer related to hue, “D” the one related to the dimension. As a result, if for the case of Dark Red a user answered Dark Blue, the “H” answer would be wrong while the “D” answer would be correct. “Tot_D” gives the total number of correct answers per user per dimension. “Tot” gives the total correct answers per user considering both hue and dimension together.
Table 19. Confusion matrix for the six color hues (presented through temperature cues). The main recognition problem is caused by the colors yellow and orange, whose temperature cues (30 °C and 34 °C) are not easily discernible.
Table 20. Confusion matrix for the four dimensions of the colors (presented through sounds).

6. Discussion

Throughout this work, three types of tests were performed to assess a multi-sensory method to convey color information by using temperature and musical sound cues. The results showed the intrinsic relationship of several sounds and temperature-based cues to the warm, cold, dark, and bright dimensions of colors. Based on these results, a promising multi-sensory system for expressing color through sound and temperature was designed. It was shown that, from both sound codes designed in [6], VIVALDI color coding was better for the task than the CLASSIC color coding. Similarly, different temperatures were also assessed and the best temperature cues to apply for each dimension were also found. Lastly, the most appropriate temperature–sound–color coding method was defined by defining the method and all its temperature and sound cues. In addition, this last coding method was tested with 12 different users. The final results show that the system is a promising solution for expressing color to users in a multimodal way.
The addition of a multi-sensory sound–temperature interaction as a way of communicating color can open the door to many new ways of experiencing art for the VIP. In addition, the extensive adjective survey for each one of the sounds and temperature cues can be handy for other investigations in the future. Finally, we expect this research to serve encouragement for many more multi-sensory application research and systems that could improve the way in which visually impaired people experience art.

7. Future Work

There are many ways in which this work could be continued or improved on such as:
  • The problem for differentiating the colors yellow and orange need to be addressed, since it is the main bottleneck for reaching high accuracy on the system.
  • Installing the multi-sensory system and using its method for performing complete on-field user tests with different artworks and on different exhibitions for the visually impaired people. This could be the beginning of research about the effect of multi-sensory systems on art engagement and artwork memorization by the visually impaired people.
  • Finding a way to increase the number of colors that can be expressed by the system, without increasing its complexity or making it less engaging.
  • Finding other applications based on the same sound-temperature concept or expressing other features of the artworks.

8. Conclusions

In this work, a multi-sensory sound-temperature cross-modal mapping method for conveying a total of 24 colors (six hues and four different color dimensions of dark, bright, warm and cold) was designed. The mapping was based on previous unisensory temperature-color and sound-color codes. They were adapted and tests were performed for finding out the best way to mix them for reaching a satisfactory multi-sensory cross-modal code. In addition, a semantic study of the musical sound cues and temperatures from those methods were acquired. The results showed that the musical sounds and temperatures can be used as a substitute for color hues and color dimensions. Additionally, the data from the results guided us into designing the optimum multi-sensory temperature-sound method based on those musical sounds and temperatures. We hope this work can encourage researchers to consider thermal and sound multi-sensory interaction both as a substitute for color and as a way to improve accessibility for the visually impaired people in visual artworks and color experience.

Supplementary Materials

The sound wav files on CLASSIC and VIVALDI sound color codes in Table 1 are available online at https://www.mdpi.com/article/10.3390/electronics10111336/s1.

Author Contributions

Conceptualization, J.-D.C.; methodology, J.-D.C.; software, G.C.; validation, J.-D.C. and G.C.; formal analysis, J.-D.C. and J.I.B.; investigation, J.-D.C., J.I.B. and G.C.; resources, J.-D.C.; data curation, G.C.; writing—original draft preparation, J.-D.C.; writing—review and editing, J.-D.C. and J.I.B.; supervision, J.-D.C.; project administration & funding acquisition, J.-D.C. All authors have read and agreed to the published version of the manuscript.

Funding

This research was funded by the Science Technology and Humanity Converging Research Program of the National Research Foundation of Korea, grant number 2018M3C1B6061353.

Institutional Review Board Statement

The study was conducted according to the guidelines of the Declaration of Helsinki, and approved by the Institutional Review Board of Sungkyunkwan University (protocol code: 2020-11-005-001, 22 February 2021).

Conflicts of Interest

The author declares that they have no conflicts of interest.

References

  1. Shams, L.; Seitz, A.R. Benefits of multisensory learning. Trends Cogn. Sci. 2008, 12, 411–417. [Google Scholar] [CrossRef] [PubMed]
  2. The Guggenheim Museums and Foundation. Mind’s Eye Programs. Available online: https://www.guggenheim.org/event/event_series/minds-eye (accessed on 28 February 2021).
  3. The Metropolitan Museum of Art. For Visitors Who Are Blind or Partially Sighted. Available online: https://www.metmuseum.org/events/programs/access/visitors-who-are-blind-or-partially-sighted (accessed on 28 February 2021).
  4. Museum of Moden Art. Accessibility. Available online: https://www.moma.org/visit/accessibility/index#individuals-who-are-blind-or-have-low-vision (accessed on 28 February 2021).
  5. Bartolome, J.D.I.; Quero, L.C.; Cho, J.; Jo, S. Exploring Thermal Interaction for Visual Art Color Appreciation for the Visually Impaired People. In Proceedings of the 2020 International Conference on Electronics, Information, and Communication (ICEIC), Barcelona, Spain, 19–22 January 2020; pp. 1–5. [Google Scholar]
  6. Cho, J.D.; Jeong, J.; Kim, J.H.; Lee, H. Sound Coding Color to Improve Artwork Appreciation by People with Visual Impairments. Electronics 2020, 9, 1981. [Google Scholar] [CrossRef]
  7. Bartolomé, J.I.; Cho, J.D.; Quero, L.C.; Jo, S.; Cho, G. Thermal Interaction for Improving Tactile Artwork Depth and Color-Depth Appreciation for Visually Impaired People. Electronics 2020, 9, 1939. [Google Scholar] [CrossRef]
  8. Lloyd-Esenkaya, T.; Lloyd-Esenkaya, V.; O’Neill, E.; Proulx, M.J. Multisensory inclusive design with sensory substitution. Cogn. Res. Princ. Implic. 2020, 5, 1–15. [Google Scholar] [CrossRef]
  9. Faustino, D.B.; Gabriele, S.; Ibrahim, R.; Theus, A.-L.; Girouard, A. SensArt Demo: A Multi-sensory Prototype for Engaging with Visual Art. In Proceedings of the 2017 ACM International Conference on Interactive Surfaces and Spaces, New York, NY, USA, 17 October 2017; pp. 462–465. [Google Scholar] [CrossRef]
  10. Pursey, T.; Lomas, D. Tate Sensorium: An experiment in multisensory immersive design. Senses Soc. 2018, 13, 354–366. [Google Scholar] [CrossRef]
  11. Baumgartner, T.; Lutz, K.; Schmidt, C.F.; Jäncke, L. The emotional power of music: How music enhances the feeling of affective pictures. Brain Res. 2006, 1075, 151–164. [Google Scholar] [CrossRef] [PubMed]
  12. Edirisinghe, C.; Podari, N.; Cheok, A.D. A multi-sensory interactive reading experience for visually impaired children; a user evaluation. Pers. Ubiquitous Comput. 2018, 1–13. [Google Scholar] [CrossRef]
  13. Brule, E.; Bailly, G.; Brock, A.; Valentin, F.; Denis, G.; Jouffrais, C. MapSense: Multi-Sensory Interactive Maps for Children Living with Visual Impairments. In Proceedings of the 2016 CHI Conference on Human Factors in Computing Systems, San Jose, CA, USA, 7–12 May 2016; pp. 445–457. [Google Scholar]
  14. Feeling Van Gogh, Van Gogh Museum, Amsterdam. Feel, Smell and Listen to the Sunflowers. Available online: https://www.vangoghmuseum.nl/en/visit/whats-on/feeling-van-gogh (accessed on 28 February 2021).
  15. Ibraheem, N.A.; Hasan, M.A.; Khan, R.Z.; Mishra, P.K. Understanding color models: A review. ARPN J. Sci. Technol. 2012, 2, 265–275. [Google Scholar]
  16. Bailey, R.J.; Grimm, C.M.; Davoli, C. The Real Effect of Warm-Cool Colors. Report Number: WUCSE-2006-17. All Computer Science and Engineering Research. 2006. Available online: https://openscholarship.wustl.edu/cse_research/166 (accessed on 31 May 2021).
  17. Wang, Q.; Spence, C. The Role of Pitch and Tempo in Sound-Temperature Crossmodal Correspondences. Multisens. Res. 2017, 30, 307–320. [Google Scholar] [CrossRef]
  18. Levitan, C.A.; Charney, S.; Schloss, K.B.; Palmer, S.E. The Smell of Jazz: Crossmodal Correspondences Between Music, Odor, and Emotion. In Proceedings of the CogSci, Pasadena, CA, USA, 22–25 July 2015; pp. 1326–1331. [Google Scholar]
  19. Hamilton-Fletcher, G.; Obrist, M.; Watten, P.; Mengucci, M.; Ward, J. I Always Wanted to See the Night Sky. In Proceedings of the 2016 CHI Conference on Human Factors in Computing Systems; Association for Computing Machinery (ACM), San Jose, CA, USA, 7–12 May 2016; pp. 2162–2174. [Google Scholar]
  20. Jia, Z.; Li, J.; Chen, C. Design and Evaluation of a Thermal Tactile Display for Colour Rendering. Int. J. Adv. Robot. Syst. 2015, 12, 162. [Google Scholar] [CrossRef]
  21. Palmer, S.E.; Schloss, K.B.; Xu, Z.; Prado-Leon, L.R. Music-color associations are mediated by emotion. Proc. Natl. Acad. Sci. USA 2013, 110, 8836–8841. [Google Scholar] [CrossRef] [PubMed]
  22. Osgood, C.E.; Suci, G.; Tannenbaum, P.H. The Measurement of Meaning; University of Illinois Press: Urbana, IL, USA, 1957. [Google Scholar]
Publisher’s Note: MDPI stays neutral with regard to jurisdictional claims in published maps and institutional affiliations.

Article Metrics

Citations

Article Access Statistics

Multiple requests from the same IP address are counted as one view.