Abstract
With the rapid development of metro–commercial integration, ensuring the safety of building operations has become increasingly critical. This study proposes a comprehensive safety evaluation framework tailored to integrated metro–commercial complexes. The framework establishes a hierarchical indicator system encompassing risk management, human safety management, facility and equipment safety, intelligent information management, and integrated crowd and operational risk. By combining historical records, real-time sensor data, and management logs, secondary indicators are quantified and normalized, while a hybrid weighting method integrating expert judgment and statistical analysis ensures both theoretical validity and empirical robustness. A case study demonstrates the framework’s applicability, yielding an overall operational safety score of 0.601, which corresponds to a “Moderate” level. Detailed analysis identifies deficiencies in flood resilience, intelligent monitoring reliability, and crowd-related fire risks, underscoring the complexity of safety challenges in such facilities. Targeted optimization measures—including enhanced drainage redundancy, condition-based equipment maintenance, improved intelligent monitoring, evacuation corridor expansion, and catering fire safety upgrades—are shown to substantially improve the composite safety index and operational resilience. This study contributes a dynamic, data-driven, and interpretable evaluation methodology that not only supports scientific safety management in metro–commercial buildings but also provides a reference for broader applications in multifunctional urban infrastructure.
1. Introduction
With the acceleration of urbanization, metro systems not only serve as the backbone of urban transportation but are increasingly integrated with commercial developments, forming complex multifunctional buildings [,]. As shown in Figure 1, some metro stations have evolved into hubs that combine transport functions with retail spaces, offices, and public services, generating significant economic and social value [].
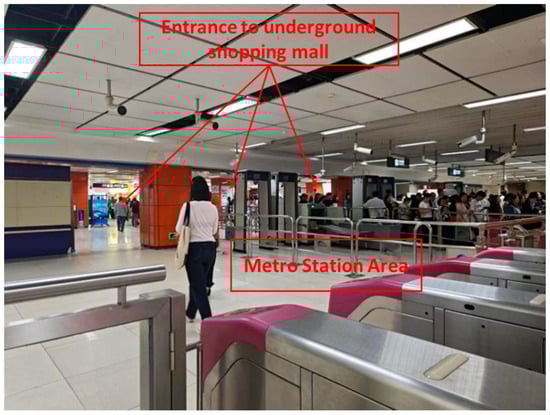
Figure 1.
The entrance of an underground shopping mall is directly connected to a metro station (Figure source: taken by the authors).
However, the integration of metro stations and adjacent commercial spaces also introduces complex safety management challenges. The interconnection of multiple building systems—such as electrical, fire protection, ventilation, drainage, and security—combined with high passenger density and continuous commercial activity, creates intricate operational environments []. Any oversight in these interdependent systems may lead to substantial safety risks. Studies indicate that operational safety risks in metro-commercial complexes primarily arise from human behavior, equipment and facility conditions, environmental factors, and management effectiveness [,,]. These factors interact dynamically, producing multi-level and multidimensional risk couplings []. For instance, during peak hours in commercial complexes, high population density and limited evacuation routes can severely hinder emergency egress, while equipment failures, malfunctioning fire protection systems, or surveillance blind spots can further increase accident likelihood.
To address these challenges, recent research has proposed various safety evaluation methods, including fuzzy comprehensive evaluation, analytic hierarchy process (AHP), and integrated approaches leveraging big data and intelligent monitoring [,,]. These methods enable quantitative assessment of operational safety across human, equipment, environmental, and management dimensions, providing scientific support for operational decision-making. Nevertheless, most existing studies focus on individual subsystems or single-station operations, while comprehensive evaluation models for integrated metro-commercial buildings remain limited. Moreover, the practical implementation of systematic management optimization strategies is still insufficient.
Despite the growing body of research on metro–commercial complexes, most existing studies rely on static assessments or focus on isolated subsystems such as equipment safety, evacuation performance, or human behavior. These approaches often overlook the dynamic coupling of risks across interdependent systems and fail to incorporate real-time operational data into the evaluation process. Furthermore, current frameworks seldom integrate multi-source information—from sensors, management logs, and historical records—into a unified decision-support mechanism. To address these limitations, the present study develops a comprehensive and data-driven evaluation approach that synthesizes dynamic monitoring, intelligent sensing, and multi-dimensional indicator analysis. This integrated framework enables system-level assessment of operational safety and provides a transparent, scalable, and empirically grounded basis for management optimization in metro–commercial environments.
Therefore, investigating safety evaluation and management optimization strategies for metro-commercial buildings is of both theoretical and practical significance. Such research can provide operators and municipal authorities with robust indicator systems and risk identification methodologies, offering data-driven guidance for emergency planning and operational management. It also serves as a reference for the design, planning, and operation of future metro-commercial developments, promoting safe, efficient, and sustainable building operation. Building on existing literature, this study aims to construct a risk evaluation model for metro-commercial operations, identify key safety management factors, and propose targeted optimization strategies to ensure the safe and efficient functioning of integrated metro-commercial facilities. This study addresses two core questions: (1) the scientific question of whether a comprehensive and quantifiable framework can be established for evaluating integrated metro–commercial infrastructures; and (2) the practical question of whether such a model can be feasibly applied to guide operational optimization strategies.
2. Literature Review
Metro stations integrated with commercial developments are increasingly forming complex multifunctional buildings that combine transportation, retail, office, and public service functions, generating substantial economic and social value [,]. Such integration introduces intricate operational environments, with interdependent systems including electrical, fire protection, ventilation, drainage, and security [,]. Managing these complex systems while ensuring safety presents significant challenges [].
The integration of metro systems with commercial developments has become a prominent model in urban planning, particularly in rapidly urbanizing cities. This “metro plus property” approach not only facilitates efficient land use but also enhances urban functionality and economic value. A comprehensive review by Lu et al. (2025) provides an in-depth analysis of the development of urban rail transit systems in China over the past decade. The study emphasizes the importance of coordinated development between metro systems and surrounding commercial areas, highlighting the economic and social value generated through such integration. It also discusses the complexities introduced by the interconnection of various building systems and the associated safety management challenges []. Similarly, Li and Aveline-Dubach (2025) critically examine the Shenzhen Metro’s “metro plus property” model, which has provided practical experience in planning, financing, and operational management for integrated developments []. Their study highlights the economic and social value generated through such integration and discusses the complexities introduced by the interconnection of various building systems and the associated safety management challenges.
However, despite the evident benefits, the integration introduces complex operational environments characterized by interdependent systems such as electrical, fire protection, ventilation, drainage, and security. Managing these systems while ensuring safety presents significant challenges. Studies indicate that operational safety risks in metro-commercial complexes primarily arise from human behavior, equipment and facility conditions, environmental factors, and management effectiveness. These factors interact dynamically, producing multi-level and multidimensional risk couplings. Li et al. utilized a fuzzy comprehensive evaluation method to construct a multi-level index system for systematic analysis of operational risks in metro-commercial buildings []. Zhang et al. applied the Analytic Hierarchy Process (AHP) to assign weights to safety factors, providing a quantitative basis for decision-making []. Himeur et al. conducted a comprehensive survey on the application of AI and big data analytics in Building Automation and Management Systems (BAMSs), highlighting the limitations of traditional systems and demonstrating how emerging technologies can enhance operational efficiency and decision-making processes [].
Furthermore, Sun et al. introduced a risk assessment model integrating variable weight theory and an extension cloud model, enabling a more scientific and effective evaluation of risks during metro tunnel construction []. Additionally, Li et al. applied structural equation modeling (SEM) to assess safety risks in urban public spaces, identifying key factors such as construction equipment, road traffic, social governance, urban environment, and human behavior, and providing practical insights for hierarchical risk management and scenario-based safety planning []. These studies indicate that safety evaluation methods are shifting from static, experience-based models toward dynamic, intelligent frameworks, offering theoretical support for developing operational safety strategies.
In summary, the literature indicates that metro-commercial integration offers significant economic, social, and urban planning benefits but also creates complex operational environments with interdependent safety risks. The integrated metro–commercial complex operates as an interdependent system, where spatial, functional, and operational couplings make it difficult to evaluate risks solely from the perspective of either the metro station or the commercial environment. In its current form, the proposed model assesses safety performance at the system level, capturing the combined behavior of interconnected subsystems such as fire protection, evacuation networks, ventilation systems, and monitoring platforms. As a result, the framework does not explicitly differentiate between risks originating from the metro component versus those arising from commercial activities. Nevertheless, the model is inherently extensible. If future applications require distinguishing organizational responsibilities—for example, differentiating the consequences of a station-side fire affecting a shopping area versus a commercial-side event compromising metro safety—the indicator system can be decomposed into metro-specific and commercial-specific sub-indices. Such an extension would enable responsibility attribution, directional risk propagation analysis, and more refined management interventions, while retaining the integrative nature of the overall evaluation framework.
Existing studies provide robust frameworks for evaluating operational safety using methods such as fuzzy comprehensive evaluation, AHP, SEM, and big-data-driven monitoring. The trend is moving toward dynamic, intelligent, and data-driven approaches, highlighting the need for integrated management strategies that combine advanced technology, staff training, and systematic operational planning to ensure the safe and efficient functioning of metro-commercial facilities. The increasing interdependence of infrastructure subsystems underscores the need for integrative evaluation models, making such approaches both relevant and timely.
3. Methodology
3.1. Research Framework
A comprehensive safety evaluation methodology for the building operation management of metro-commercial integration projects is proposed, which integrates natural risk management, human factors, facility equipment safety, and intelligent information management, underpinned by big data analysis and intelligent monitoring technologies. The methodology combines historical data, real-time sensor data, and management system records to generate quantifiable safety indices that reflect both static and dynamic operational risk.
As shown in Figure 2, the framework consists of four sequential steps:
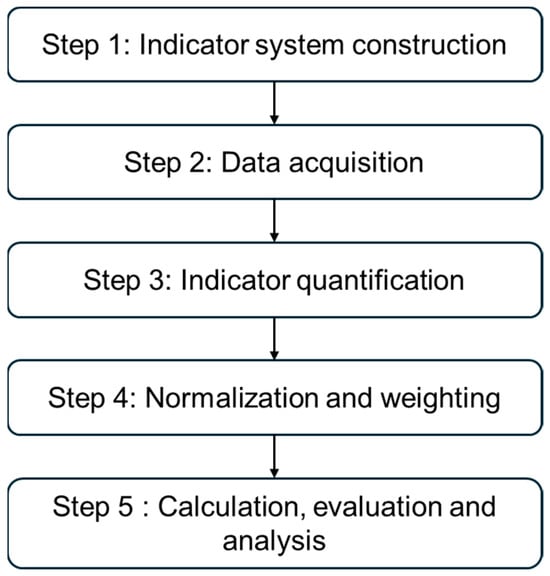
Figure 2.
The evaluation framework.
- Indicator system construction: establishment of a multi-level and multi-dimensional indicator framework that defines the safety dimensions and measurement criteria for subsequent data acquisition and quantitative analysis.
- Data acquisition: collection of multi-source data, including historical records, IoT sensor data, CCTV monitoring, and operational logs after the indicator system is established.
- Indicator quantification: calculation of secondary indicators based on raw data through predefined formulas.
- Normalization and weighting: standardization of indicators and aggregation into primary indicators and total safety values.
- Evaluation and analysis: Real-time update of indicators and decision support for safety management optimization.
Although some Level-2 indicators exhibit logical causal relationships—for example, fire risk increases the demand for emergency response capability, which in turn affects evacuation efficiency—the proposed framework is not intended to function as a causal inference model. The methodology serves as a multi-attribute decision-making framework that synthesizes multiple dimensions of operational safety into an integrated score. Potential causal dependencies are reflected implicitly through expert judgments in the AHP, where indicators with stronger downstream influence are assigned higher weights, as well as through their combined contributions to the overall safety value.
Explicit causal modeling could further enhance interpretability, particularly in the analysis of risk propagation across interconnected subsystems. Approaches such as DEMATEL, Bayesian networks, and system dynamics provide promising avenues for capturing these causal structures in a more rigorous manner. Within this context, the current framework should be regarded as a foundational evaluative model, with the potential for future extensions that incorporate explicit causal representations to better characterize hazard evolution and interdependent risk pathways.
3.2. Evaluation Indicator System
A hierarchical indicator system was constructed to capture comprehensive operational safety, encompassing four dimensions:
- Risk Management (NM). Earthquake, flood, and extreme weather risks, as well as man-made risks, are incorporated into building resilience.
- Human Safety Management (HSM). Employee safety training, emergency response capacity, and organizational safety culture.
- Facility and Equipment Safety (FES). Operational status, maintenance timeliness, and evacuation infrastructure performance.
- Intelligent Information Management (IIM). Monitoring coverage, data acquisition integrity, risk warning accuracy, and decision-support effectiveness.
- Integrated Crowd & Operational Risk (ICOR). Passenger flow management, congestion risk control, evacuation efficiency, and operational continuity under peak loads.
Each primary dimension contains secondary indicators that can be quantitatively measured using big data sources and intelligent monitoring systems (e.g., IoT devices, surveillance cameras, management logs). Table 1 summarizes the indicator system, including the indicator name and codes.

Table 1.
Evaluation indicator system for building operations under the integrated metro station-commercial development model.
3.3. Expert Panel and Indicator Development Procedure
To enhance the transparency and empirical robustness of an indicator system, an expert panel can be convened to guide the development, refinement, and weighting of Level-1, Level-2, and Level-3 indicators. The panel may include specialists in metro operation management, fire safety engineering, emergency response and evacuation management, building facility maintenance, and intelligent monitoring systems. Experts are typically required to have substantial professional experience and may be drawn from relevant organizations such as metro operating companies, emergency management agencies, fire departments, design institutes, and academic research centers.
An indicator system can be developed through a three-round Delphi process. In Round 1, an initial pool of indicators is generated based on a comprehensive review of literature, national standards, metro operation manuals, and preliminary field investigations. Experts rate the relevance, measurability, and independence of each candidate indicator, and indicators with low relevance, poor measurability, or conceptual overlap can be removed or merged. Round 2 focuses on refining the definitions, calculation approaches, and data sources of each remaining indicator. In Round 3, experts aim to reach consensus on the final set of Level-1 to Level-3 indicators, ensuring comprehensive coverage of operational risks in integrated metro–commercial environments.
Indicator weights can be calculated using a hybrid method combining the Analytic Hierarchy Process (AHP) and historical operational data. Experts perform pairwise comparisons for indicators at the same level, forming a judgment matrix that is evaluated using consistency tests (CI and CR ≤ 0.1). The resulting expert-based weights can then be adjusted using empirical contributions derived from historical data, such as equipment malfunctions, congestion records, fire incidents, and emergency response delays. A linear combination method can be applied to integrate expert judgment and data-driven insights, yielding weights that are both theoretically grounded and empirically validated.
3.4. Data Acquisition
The proposed methodology leverages both historical data and real-time monitoring data:
- Historical data: Includes historical seismic events, flood records, extreme weather data, maintenance logs, and past emergency events.
- Real-time sensor data: IoT devices on critical equipment, water-level and rainfall sensors, temperature and humidity sensors.
- Intelligent monitoring systems: CCTV-based human flow detection, alarm system logs, and decision-support platform usage logs.
- Management records: Employee training databases, inspection reports, and emergency drill logs.
These heterogeneous data sources are integrated into a unified big data platform, enabling real-time access and automated processing for safety evaluation.
3.5. Indicator Quantification and Calculation
3.5.1. Risk Management (NM)
In the operation and management of subway commercial integrated buildings, natural and sudden disaster risks are an important component of building safety. To quantify and monitor these risks, this study designs five secondary indicators corresponding to fire, earthquake, heavy rain and flooding, emergency drills, and disaster dynamic monitoring capability.
To enable a reproducible case analysis, the Fire Risk score was operationalized through a weighted combination of detector availability and historical incident frequency. The proposed formula is expressed as
where denotes the number of smoke detectors currently operational, represents the total number of installed smoke detectors, is the number of fire incidents detected within the reference year, and is a normalization constant reflecting the maximum expected number of incidents in comparable metro-commercial facilities (set to 10 in this demonstration). The first term captures the functional coverage of fire detection devices, while the second term penalizes higher incident frequency. The coefficients (0.6 and 0.4) reflect expert-judged relative importance, giving slightly greater weight to preventive monitoring infrastructure. This formulation ensures the score remains within [0, 1] and integrates both real-time equipment performance and historical risk exposure.
The indicator Earthquake Risk is calculated by integrating the building’s seismic design rating, historical earthquake data, and real-time structural health monitoring information. First, the building’s seismic grade, defined according to national or local building codes (e.g., GB50011-2010 Code for Seismic Design of Buildings of China []), is converted into a standardized value , reflecting the designed seismic resistance. Historical earthquake data from similar buildings within the same region are used to determine the maximum observed seismic value , ensuring the assessment considers practical performance ranges. The overall maximum standard value is then defined as the minimum of the code-based maximum grade and the historical maximum:
Real-time structural performance is captured using accelerometers and strain gauges installed at key structural nodes, generating a dynamic adjustment value based on observed vibrations and stress levels. The final earthquake risk value is computed as a weighted combination of the design value and the real-time adjustment, normalized by :
The indicator Heavy Rain and Flood Risk quantifies the potential impact of extreme rainfall and flooding on subway commercial integrated buildings. It integrates rainfall intensity, building exposure, structural vulnerability, and adaptive response capability, incorporating both historical big data and real-time intelligent monitoring.
Rainfall Intensity Index (RI) is calculated using both historical rainfall datasets (e.g., regional meteorological archives covering decades of hourly rainfall) and real-time measurements from rain gauges or radar-based precipitation sensors installed around the site:
where is the current rainfall intensity captured by sensors, is the statistically derived average for extreme events, and α is a weighting factor reflecting the contribution of historical data.
Exposure Index (EI) is then calculated by combining GIS-based floodplain maps, urban drainage network models, and real-time water level sensors in surrounding areas to assess flood-prone zones. Real-time sensor data allows dynamic adjustment of (EI) during actual heavy rain events.
Vulnerability Index (VI) can be calculated by integrating building design data (structural type, waterproofing, critical facility locations) with sensor-based measurements of water infiltration, soil saturation, or basement water levels:
Adaptive/Response Index (AI) evaluates the building’s capacity to respond to flooding using intelligent monitoring systems, including drainage pump flow sensors, real-time water level monitoring, and automated alert systems:
At last, the overall risk value can be calculated:
The indicator Emergency Plan and Drill is designed to evaluate both the coverage of disaster emergency plans and their practical execution effectiveness in metro stations and commercial integrated buildings. The indicator integrates two dimensions, Plan Coverage Index (PCI) and Drill Effectiveness Index (DEI). PCI is used to measure the extent to which the emergency plan addresses critical disaster scenarios (e.g., fire, earthquake, heavy rain, and flood) and covers key departments and facilities. It is calculated as:
PCI ranges from 0 to 1, with 1 indicating complete coverage of all critical scenarios and units.
The indicator Drill Effectiveness (DEI) is used to evaluate the performance of the emergency plan during actual drills, including response time, resource allocation efficiency, and the number and severity of issues identified. Each component is standardized and weighted:
In which, and increase with better performance, while is calculated such that fewer detected problems result in a higher value.
At last, the value for the indicator Emergency Plan and Drill can be obtained by using Equation (14).
3.5.2. Human Safety Management (HSM)
Human safety management is a crucial aspect of the operation of metro-commercial integrated buildings, encompassing operational procedures, staff training, emergency response, and safety culture development. The indicator Operational Process Compliance is used to evaluate the adherence to safety regulations throughout the operation. Using data from intelligent monitoring systems, IoT device logs, and RFID card swipes, the number of compliant steps can be obtained and compared with the total number of steps in the process . The index is quantified using the formula:
This method leverages video analysis and automated log detection of non-compliant actions, enabling managers to monitor process execution in real time.
The indicator Employee Training and Safety Awareness evaluates staff training completion using data from training platforms, exam values, and mobile learning terminals. It is calculated with the formula:
where represents the number of employees who have completed the training, is the total number of employees, and is the exam or assessment value (ranging from 0 to 1). By using big data to analyze training coverage and pass rates, the safety awareness level of employees can be quantitatively assessed.
The indicator Emergency Response Capability measures the timeliness of responses to unexpected incidents. Using event logs from monitoring systems and IoT alarm trigger timestamps, the actual response time from incident occurrence to response initiation can be obtained and compared with the standard response time . The index is calculated as:
A higher value indicates a more timely response. The real-time event detection capability of intelligent monitoring systems ensures the dynamic updating of this index.
The indicator Safety Culture reflects employees’ proactive reporting of safety incidents and the overall safety atmosphere. Using data from safety incident reporting systems and survey platforms, the ratio of actively reported incidents to the total number of incidents is calculated, combined with the safety culture survey value , to compute the index as:
Through intelligent monitoring and big data analysis, weaknesses in safety culture can be identified in a timely manner, providing a basis for management improvement.
3.5.3. Facility and Equipment Safety (FES)
The indicator Facility and Equipment Safety (FES) primarily evaluates the operational status and maintenance management level of key building facilities, including fire protection systems, elevators and escalators, ventilation equipment, evacuation routes, and the integrity of signage, as well as the timeliness of equipment maintenance.
The indicator Fire Equipment Integrity is designed to quantify the availability and reliability of fire protection equipment within the building. Real-time operational status of fire equipment is obtained through intelligent monitoring systems and IoT sensors, and the ratio of normally functioning equipment to the total deployed equipment is calculated as:
A higher index value indicates a better condition of the fire equipment. Intelligent monitoring systems can upload equipment status in real time, and by combining historical maintenance records from big data analysis, potential failures can be predicted and warned, enabling dynamic management.
The indicator Critical Equipment Status is used to evaluate the safety and reliability of equipment such as elevators, escalators, ventilation systems, and lighting. By monitoring the number of operational fault events through IoT sensors and comparing it with the total number of devices , the index is normalized using the formula. This method leverages real-time monitoring and big data analysis of equipment fault trends to provide decision support for maintenance planning and operational optimization.
The indicator Evacuation Routes and Signage is used to quantify the efficiency of personnel evacuation and the safety of evacuation pathways. Intelligent cameras monitor the actual width and congestion of evacuation routes , which is compared with the standard width , and combined with the ratio of intact signs and to calculate the index as:
The indicator Equipment Maintenance Timeliness reflects the completion status of facility and equipment maintenance tasks. Using data from intelligent management platforms, the ratio of completed maintenance tasks to the total planned maintenance tasks is calculated as:
3.5.4. Intelligent and Information-Based Management (IIM)
The indicator Disaster Dynamic Monitoring Capability reflects the real-time perception capacity of the building when facing various emergency disasters. By calculating the ratio between the number of fire detectors, water-level sensors, and video surveillance cameras currently operating and transmitting data , and the total number of deployed sensors of each type , the dynamic monitoring capability value of the evaluated object can be obtained using the following equation.
The indicator Data Analysis and Early Warning Capability is used to evaluate the accuracy of intelligent systems in detecting and issuing warnings for abnormal events. By counting the number of correct alerts , false alerts , and the total number of alerts , the index is calculated as:
Through intelligent monitoring and big data analysis, high-precision detection and early warning of abnormal events can be achieved, while dynamically updating the warning algorithm parameters to enhance safety management.
The indicator Decision Support Capability measures the extent to which information systems support operational management decisions. Using the value from a visualization analysis platform and the ratio of decisions optimized based on system data and the total number of decisions , the index is calculated as:
Big data platforms can aggregate data from various sensors and monitoring systems in real time, provide visual analysis and trend forecasting, and support management in making informed decisions, thereby enhancing the overall safety operation of the building.
3.5.5. Integrated Crowd & Operational Risk (ICOR)
The indicator Passenger Density reflects the degree of crowding in station halls and commercial areas during peak hours, which is a defining feature of metro-commercial integrated buildings. The raw data are obtained from entry and exit gate records, CCTV-based passenger counting systems, and the net usable area of each functional zone. The index is calculated as the average density within a selected peak-hour time window T:
where is the number of passengers in the area at time T, and A is the effective area in square meters.
The Evacuation Flow Efficiency measures the capacity of the integrated station-commercial complex to evacuate passengers in case of emergencies. Data are collected from evacuation drills, CCTV-based trajectory tracking, and evacuation simulation models. The efficiency is computed by comparing the actual evacuation flow rate with the target flow rate specified by design or regulation:
where is the number of participants, is the median evacuation completion time, and is the benchmark evacuation rate. A higher normalized EFE indicates better evacuation performance and greater resilience of the facility.
The indicator Catering Fire Risk evaluates the specific fire hazards introduced by catering services, which are prevalent in metro-commercial complexes. Data sources include the number and proportion of catering units, the area occupied by kitchens, and sensor records of gas leaks or smoke alarms. The indicator combines exposure and alarm records as follows:
where represents the exposure coefficient based on the proportion of catering facilities, is the rate of fire-related alarms per kitchen per time unit, and is a sensitivity parameter. Higher CFR values indicate increased fire risk due to catering operations, requiring stricter monitoring and prevention measures.
The indicator Transfer Congestion reflects the level of congestion in transfer corridors between the commercial area and the station area, which directly impacts both normal passenger circulation and emergency evacuation. Data are collected from CCTV-based flow tracking, gate traffic data, and simulation-based capacity estimates. The index can be defined either in terms of flow ratio or crowd density:
where is the average observed flow rate, is the design or simulated capacity, is the passenger density at time , and is the critical density threshold. A higher normalized TCI indicates higher congestion levels, signaling potential bottlenecks in daily operation and heightened risk in emergencies.
3.6. Normalization and Weighting
3.6.1. Normalization of Indicators
The proposed methodology involves multiple indicators measured in different units and scales, such as seismic intensity, response time, and equipment failure counts. To aggregate them meaningfully, each secondary indicator is normalized to a 0–1 scale using a data-driven, quantile-based normalization approach:
where
- x is the raw value of a Level-3 indicator, which can be obtained by using the methods proposed in Section 3.4.
- and are the 5th and 95th percentile values of historical or continuously monitored data.
- Values below are set to 0, and values above are set to 1.
3.6.2. Weight Determination
To determine the weights of the evaluation indicators, a combined method of Analytic Hierarchy Process (AHP) and historical data analysis was adopted according to A Handbook on Multi-Attribute Decision-Making Methods []. In the first stage, AHP was applied to capture expert knowledge and judgment. A hierarchical model was constructed, with the overall safety management goal at the top, Level-2 indicators such as Risk Management (RM), Human Safety Management (HSM), Facility and Equipment Safety (FES), intelligent information management (IIM), and Integrated Crowd and Operational risk (ICOR) in the middle, and the corresponding Level-3 indicators at the bottom. A panel of experts in metro operation, safety engineering, and emergency management was invited to perform pairwise comparisons of indicators at the same level, using the Saaty 1–9 scale to express relative importance. These pairwise judgments were then synthesized to form a comparison matrix, from which eigenvectors were extracted to derive normalized weights. Consistency tests (CI/CR ≤ 0.1) were conducted to ensure logical consistency of expert opinions, producing the expert-based weights .
In the second stage, historical operational and incident data were used to adjust the weights, ensuring that they reflect actual risk patterns observed in practice. Data such as equipment failures, fire incidents, congestion records, and emergency response delays were collected and linked with corresponding indicators. Correlation analysis and regression modeling were employed to examine the explanatory power of each indicator for safety outcomes, while principal component analysis (PCA) was used to identify indicators with stronger contributions to variance in historical incidents. The resulting statistical contributions were normalized to generate data-driven weights. . Finally, the two sets of weights were integrated through a linear combination, expressed as
where is a balancing coefficient, typically set at 0.7 to emphasize expert knowledge while still incorporating objective data patterns. This hybrid weighting approach ensures both theoretical rationality and empirical robustness in the comprehensive safety evaluation model.
3.6.3. Calculation of Level-2 Indicator Values
Once Level-3 indicators are normalized and weighted, each Level-2 indicator value is calculated by a weighted sum of its secondary indicators:
where is the normalized value of Level-3 indicator i under Level-2 indicator j; is the corresponding weight.
For Level-2 indicator Risk Management (NM) with 4 Level-3 indicators (, , , ), .
3.6.4. Calculation of Total Safety Value
The overall building operational safety value is derived through a weighted aggregation of the primary indicator values, ensuring that the evaluation comprehensively reflects the multiple dimensions of metro station–commercial complex safety. The calculation is expressed as
where represents the weight of the j-th primary indicator and denotes the corresponding value. The weights of primary indicators are determined using the same hybrid approach as that adopted for secondary indicators, integrating expert judgment through the Analytic Hierarchy Process (AHP) with statistical analysis of historical operational and incident data. To guarantee the logical soundness of the model, the sum of all weights satisfies the constraint . The resulting total value ranges between 0 and 1, with values closer to 1 representing higher levels of operational safety. Beyond the overall assessment, individual primary indicator values can also be examined to diagnose specific strengths and weaknesses of the building safety management system. For instance, a high value in Risk Management (RM) but a relatively low value in Human Safety Management (HSM) would indicate that while the infrastructure is resilient to natural hazards, deficiencies remain in emergency preparedness or personnel management. This interpretability ensures that the model not only provides a quantitative benchmark for overall safety performance but also offers practical insights for targeted optimization of safety management strategies.
3.6.5. Operational Safety Grading Framework
After calculating the total safety value , the continuous range [0, 1] is discretized into five categorical levels in order to facilitate interpretation and practical application in management. This transformation not only enhances the intuitiveness of the results but also enables operators to adopt differentiated safety management strategies according to the specific level.
Specifically, an interval-based method is employed, dividing the range [0, 1] into five equal-width categories, corresponding to “Very Poor,” “Poor,” “Moderate,” “Good,” and “Excellent.” The classification is determined using Equation (34).
Here, Safety Level denotes the safety category, where a higher value indicates a higher level of operational safety management. This formula allows any total value to be mapped into a clear categorical level, thereby realizing the transformation from a “quantitative value” to a “qualitative interpretation.” Importantly, the classification method is highly programmable and can be embedded in big data platforms or intelligent monitoring systems, enabling automated real-time evaluation and early warning. To provide a more intuitive understanding of the operational safety level represented by each category, a grading table is established, as shown in Table 2.
Table 2.
Operational Safety Grading Criteria.
Through this grading framework, the safety evaluation provides not only quantitative values but also qualitative levels that offer actionable management guidance, thereby enhancing the applicability of the methodology in real-world engineering and operational contexts.
4. Case Study
4.1. Raw Data
To validate the operability of the proposed safety evaluation framework, an empirical case study was carried out on a metro station–commercial integrated complex in Chengdu, China. Instead of relying on assumed parameters, the evaluation was based on first-hand operational records, on-site monitoring data, and management documents collected during the field investigation. Data sources included facility inspection logs, real-time outputs from IoT sensors and CCTV systems, historical maintenance records, staff training databases, and emergency drill reports. These multi-source datasets provided the raw values for tertiary indicators, which were then processed and normalized according to the methodology outlined in Section 3. Table 3 presents the collected operational and monitoring data from the case-study building, ensuring that the evaluation results reflect the real conditions of an integrated metro–commercial facility rather than hypothetical assumptions.
Table 3.
Raw data of the case study.
4.2. Calculations
The weights of Level-3 indicators are determined by following the method described in Section 3.6.2. And the values of Level-3 indicators can be calculated and normalized using equations in Section 3.4 and Section 3.5 based on raw data presented in Table 3. The obtained weights and values of Level-3 indicators are listed in Table 4.
Table 4.
Weights and calculated values of Level-3 indicators.
Once Level-3 indicators are normalized and weighted, each Level-2 indicator value can be calculated by Equation (32). The weights of Level-3 indicators can also be obtained by the methods proposed in Section 3.6.2. The weights and calculated values of Level-2 indicators are listed in Table 5.
Table 5.
Weights and calculated values of Level-2 indicators.
After Level-2 indicators are normalized and weighted, the value of the Level-1 indicator can be calculated by Equation (33). The weights of Level-2 indicators can also be obtained by the methods proposed in Section 3.5.2. The weights and calculated values of the Level-1 indicator are listed in Table 6.
Table 6.
Calculated values of Level-1 indicators.
The case study yielded an overall operational safety score of 0.601, placing the facility at the lower boundary of the “Moderate” level. A closer examination of the five primary dimensions reveals significant variation across indicators. Risk Management (0.574) and Intelligent Information Management (0.534) emerged as the weakest areas, while Human Safety Management (0.745) performed relatively well, although some deficiencies remain. Facility and Equipment Safety (0.569) and Integrated Crowd and Operational Risk (0.521) were assessed at intermediate levels, indicating multiple vulnerabilities that could threaten operational resilience.
Within the Risk Management dimension, the Heavy Rain and Flood Risk sub-indicator recorded a particularly low value (0.098). Real-time rainfall measurements have already reached 85 mm/h compared to a fifty-year extreme of 95 mm/h, and only 90% of basement pumps are operational. In addition, GIS analysis identifies 15% of the site as flood-prone. Together, these factors indicate a high probability of water ingress, which could disable power systems and obstruct vertical evacuation. Facility and Equipment Safety was undermined by incomplete maintenance (83% completion rate) and by 30 malfunctioning exit signs concentrated in the transfer corridor. In an emergency, these weaknesses could seriously compromise evacuation effectiveness. Intelligent Information Management was hampered by a 6% false-alarm rate and a 10% sensor outage, including blind spots in CCTV coverage and a non-functioning water-level sensor at a critical interface between the retail and platform zones. Finally, Integrated Crowd and Operational Risk was adversely affected by a peak passenger density of 1.6 persons/m2 and the presence of 35 catering units sharing a single exhaust plenum, which was responsible for ten fire-related alarms in the previous year. These conditions amplify both congestion risk and fire hazards.
To elevate the facility’s safety performance to the “Good” category, several targeted measures are recommended. First, the defective basement pump should be repaired promptly, and an additional portable pump installed to enhance redundancy. Second, escalator and critical equipment maintenance should transition to a condition-based strategy driven by real-time sensor data. Third, the intelligent monitoring system requires upgrades: the adoption of ring-topology Ethernet and multi-criteria fire detectors is expected to reduce false alarms by up to 60%. Fourth, operational adjustments such as reprogramming train departure intervals could reduce peak inflow by 8%, while physical widening of the transfer corridor from 2.6 m to 4.0 m would substantially improve evacuation efficiency. Lastly, the fire risk from catering operations should be mitigated through the installation of automatic water-mist curtains inside kitchen exhaust ducts. Collectively, these interventions are projected to increase the composite safety index to approximately 0.78, reduce expected annual disruption losses by 25%, and provide a ten-minute safety buffer for controlled evacuation in scenarios involving simultaneous flooding and fire.
4.3. Before–After Comparison of Key Indicators
To demonstrate the effectiveness of the proposed optimization strategies, a comparative analysis was conducted to quantify the expected improvements in key safety indicators. Table 7 summarizes the before–after changes in representative dimensions, including drainage capacity, equipment safety, intelligent monitoring performance, and crowd–catering related risks. After implementing targeted enhancements—such as restoring full pump operability, introducing condition-based maintenance, improving monitoring system redundancy, and upgrading fire prevention measures in catering areas—the composite safety index is projected to increase from 0.601 to approximately 0.78. This improvement reflects notable gains in flood resilience, evacuation reliability, and real-time risk perception. The results confirm that the proposed management measures can significantly enhance operational resilience and reduce the likelihood of cascading failures during emergencies.
Table 7.
Comparison of Key Indicators Before and After Optimization.
5. Conclusions
A comprehensive safety evaluation framework for metro–commercial integrated buildings was proposed in this study, incorporating risk management, human safety management, facility and equipment safety, intelligent information management, and integrated crowd and operational risk. By combining big data analytics, real-time monitoring, and expert judgment through a hybrid weighting approach, the methodology enables both quantitative benchmarking and diagnostic analysis of operational safety performance. The case study demonstrated the framework’s practical applicability. The evaluated complex achieved a moderate safety level, with significant weaknesses in flood resilience, intelligent information management, and crowd–catering interactions. These findings highlight the necessity of targeted interventions, such as improving drainage system redundancy, enhancing condition-based equipment maintenance, upgrading intelligent monitoring, optimizing passenger flow, and strengthening fire safety in catering facilities. Implementing such measures can substantially raise the safety index, reduce operational disruptions, and ensure safer evacuation under compound emergency scenarios. This work contributes by bridging the methodological gap between isolated subsystem assessments and comprehensive system-level evaluations. On the other hand, this study has several limitations that warrant future attention. First, the evaluation framework relies on data collected from a single metro–commercial complex, which may limit the generalizability of the results to regions with different operational conditions or regulatory environments. Second, although real-time monitoring data were incorporated, the system has not yet been validated under extreme or compound hazard scenarios, such as simultaneous flooding and fire. Third, the current model evaluates risk at the system level but does not fully capture cross-organizational decision interactions between metro operators, commercial tenants, and emergency agencies. Future research could address these limitations by conducting cross-regional comparisons, integrating digital twin platforms for scenario simulation, and extending the framework to support multi-agent collaborative decision-making.
Overall, the proposed model not only provides a systematic tool for assessing and comparing the safety performance of metro–commercial complexes but also offers actionable guidance for management optimization. Its adaptability allows integration into smart building platforms, supporting dynamic, data-driven decision-making. Beyond the case presented, the framework has broader implications for the safe operation of multifunctional urban infrastructure, contributing to sustainable and resilient city development.
Author Contributions
Conceptualization, Y.H. and H.Y.; methodology, H.Y.; software, X.J.; validation, Y.H., H.Y. and X.P.; formal analysis, H.Y., X.J.; investigation, Y.H.; resources, H.Y.; data curation, Y.H.; writing—original draft preparation, Y.H.; writing—review and editing, H.Y.; visualization, X.P.; supervision, H.Y.; project administration, H.Y.; funding acquisition, H.Y. All authors have read and agreed to the published version of the manuscript.
Funding
This study is supported by the Science and Technology Plan Project of Longquanyi District of Chengdu City (No. 2025LQRD0030), administered by the New Economy and Science and Technology Bureau of Longquanyi District. The funds were used for sample collection, analysis, and statistical software licenses. The funding agencies had no influence on the study design, data collection, interpretation of results, or the writing of this manuscript.
Institutional Review Board Statement
Not applicable.
Informed Consent Statement
Not applicable.
Data Availability Statement
The datasets analyzed during the current study are available from the corresponding author upon reasonable request.
Conflicts of Interest
The authors declare no conflicts of interest.
References
- Lin, D.; Zhou, Z.; Weng, M.; Broere, W.; Cui, J. Metro Systems: Construction, Operation and Impacts. Tunn. Undergr. Space Technol. 2024, 143, 105373. [Google Scholar] [CrossRef]
- Yang, H.; Cui, N.; Xia, H. The Evolution of the Interaction Between Urban Rail Transit and Land Use: A CiteSpace-Based Knowledge Mapping Approach. Land 2025, 14, 1386. [Google Scholar] [CrossRef]
- Alhassan, J.A.K.; Anciaes, P. Public Transport Investments as Generators of Economic and Social Activity. J. Transp. Health 2025, 41, 101989. [Google Scholar] [CrossRef]
- Yang, X.; Zhang, G.; Cao, S.; Li, Y. Adaptive Safety Management of Bidirectional Crowd in Metro Stations Considering Robustness: From Data-Driven Identification to Prediction Control. Phys. A Stat. Mech. Its Appl. 2025, 672, 130662. [Google Scholar] [CrossRef]
- Liu, J.; Wan, L.; Wang, W.; Yang, G.; Ma, Q.; Zhou, H.; Zhao, H.; Lu, F. Integrated Fuzzy DEMATEL-ISM-NK for Metro Operation Safety Risk Factor Analysis and Multi-Factor Risk Coupling Study. Sustainability 2023, 15, 5898. [Google Scholar] [CrossRef]
- Lu, Y.; Zhang, Y.; Jiang, X.; Wang, Y. Risk Assessment of Passenger Behaviors That Influence Accident Type and Severity in Metro Operation. Psychol. Res. Behav. Manag. 2023, 16, 3697–3715. [Google Scholar] [CrossRef] [PubMed]
- Su, S.; Li, S.; Ding, Y.; Mao, P.; Chong, D. Health Damage Assessment of Commuters and Staff in the Metro System Based on Field Monitoring—A Case Study of Nanjing. Front. Public Health 2024, 11, 1305829. [Google Scholar] [CrossRef] [PubMed]
- Li, X.; Liao, F.; Wang, C.; Alashwal, A. Managing Safety Hazards in Metro Subway Projects under Complex Environmental Conditions. ASCE-ASME J. Risk Uncertain. Eng. Syst. Part A Civ. Eng. 2022, 8, 04021079. [Google Scholar] [CrossRef]
- Li, Y.; Dang, X.; Yu, M.; Feng, T. Research on Safety Risk Assessment of Xi’an Metro Operation Based on Structural Equation Model (SEM)-Matter-Element Extension Model (MEA). Transp. Res. Rec. 2024, 2679, 1558–1568. [Google Scholar] [CrossRef]
- Liu, J.; Qi, Y.; Wang, W. Emergency Management Capacity Assessment for Urban Rail Transit—An Example of Beijing Metro Line 13. Transp. Saf. Environ. 2023, 6, tdad015. [Google Scholar] [CrossRef]
- Shi, T.; Wan, H.; Ma, W.; Gan, L. Rail Transit Operational Safety Risk Assessment Based on Improved AHP and Cloud Model; Atlantis Press: Dordrecht, The Netherlands, 2023; pp. 474–486. [Google Scholar]
- Santos-Reyes, J.; Padilla-Perez, D.; Beard, A.N. Transport Infrastructure Interdependency: Metro’s Failure Propagation in the Road Transport System in Mexico City. Sustainability 2019, 11, 4757. [Google Scholar] [CrossRef]
- Zhu, Y.; Jiao, L.; Zhang, Y.; Wu, Y.; Huo, X. Sustainable Development of Urban Metro System: Perspective of Coordination between Supply and Demand. Int. J. Environ. Res. Public Health 2021, 18, 10349. [Google Scholar] [CrossRef] [PubMed]
- Tang, Y.; Bi, W.; Varga, L.; Dolan, T.; Li, Q. An Integrated Framework for Managing Fire Resilience of Metro Station System: Identification, Assessment, and Optimization. Int. J. Disaster Risk Reduct. 2022, 77, 103037. [Google Scholar] [CrossRef]
- Lu, K.; Zhang, L.; Li, S.; Huang, Y.; Ding, X.; Hao, J.; Huang, S.; Li, X.; Lu, F.; Zhang, H. Urban Rail Transit in China: Progress Report and Analysis (2015–2023). Urban Rail Transit 2025, 11, 1–27. [Google Scholar] [CrossRef]
- Li, C.; Aveline-Dubach, N. The Limits of a Success Story: Rethinking the Shenzhen Metro “Rail Plus Property” Model for Planning Sustainable Urban Transit in China. Land 2025, 14, 1508. [Google Scholar] [CrossRef]
- Li, X.K.; Wang, X.M.; Lei, L. The Application of an ANP-Fuzzy Comprehensive Evaluation Model to Assess Lean Construction Management Performance. Eng. Constr. Archit. Manag. 2020, 27, 356–384. [Google Scholar] [CrossRef]
- Zhang, G.; Wang, L.; Duffy, A.P.; Di Febo, D.; Orlandi, A.; Sasse, H. Applying the Analytic Hierarchy Process (AHP) to an FSV-Based Comparison of Multiple Datasets. IEEE Trans. Electromagn. Compat. 2015, 57, 477–483. [Google Scholar] [CrossRef]
- Himeur, Y.; Elnour, M.; Fadli, F.; Meskin, N.; Petri, I.; Rezgui, Y.; Bensaali, F.; Amira, A. AI-Big Data Analytics for Building Automation and Management Systems: A Survey, Actual Challenges and Future Perspectives. Artif. Intell. Rev. 2023, 56, 4929–5021. [Google Scholar] [CrossRef] [PubMed]
- Sun, X.; Wu, L.; Wu, D. Risk Evaluation of Metro Tunnel Shield Construction Based on Game Variable Weight Extension Cloud Theory. Sci. Rep. 2025, 15, 18961. [Google Scholar] [CrossRef]
- Li, X.; Wang, C.; Kassem, M.A.; Zhang, Z.; Xiao, Y.; Lin, M. Safety Risk Assessment in Urban Public Space Using Structural Equation Modelling. Appl. Sci. 2022, 12, 12318. [Google Scholar] [CrossRef]
- GB50011-2010; Code for Seismic Design of Buildings. China Architecture & Building Press: Beijing, China, 2010.
- Bozorg-Haddad, O.; Zolghadr-Asli, B.; Loáiciga, H. Analytic Hierarchy Process (AHP). In A Handbook on Multi-Attribute Decision-Making Methods; John Wiley & Sons, Ltd.: Hoboken, NJ, USA, 2021; pp. 25–42. ISBN 978-1-119-56350-1. [Google Scholar]
Disclaimer/Publisher’s Note: The statements, opinions and data contained in all publications are solely those of the individual author(s) and contributor(s) and not of MDPI and/or the editor(s). MDPI and/or the editor(s) disclaim responsibility for any injury to people or property resulting from any ideas, methods, instructions or products referred to in the content. |
© 2025 by the authors. Licensee MDPI, Basel, Switzerland. This article is an open access article distributed under the terms and conditions of the Creative Commons Attribution (CC BY) license (https://creativecommons.org/licenses/by/4.0/).