Abstract
Easy maintenance and high durability are expected in structures made with fiber-reinforced cementitious composite (FRCC) reinforced with fiber-reinforced polymer (FRP) bars. In this study, we focused on the bond and cracking characteristics of polyvinyl alcohol (PVA)-FRCC reinforced with braided AFRP bars (AFRP/PVA-FRCC). Pullout tests on specimens with varying bond lengths were conducted. Beam specimens were also subjected to four-point bending tests. In the pullout tests, experimental parameters included the cross-sectional dimensions and the fiber volume fractions of PVA-FRCC. A trilinear model for the bond constitutive law (bond stress–loaded-end slip relationship) was proposed. In the pullout bond test with specimens of long bond length, bond strength was found to increase with increases in both the fiber volume fraction and the cross-sectional dimension of the specimens. Bond behavior in specimens of long bond length was analyzed numerically using the proposed bond constitutive law. The calculated average bond stress–loaded-end slip relationships favorably fitted the test results. In bending tests with AFRP/PVA-FRCC beam specimens, high ductility was indicated by the bridging effect of fibers. The number of cracks increased with increases in the fiber volume fraction of PVA-FRCC. In specimens with a fiber volume fraction of 2%, the load reached its maximum value due to compression fracture of the FRCC. The crack width in PVA-FRCC calculated by the predicted formula, considering the bond constitutive law and the fiber bridging law, showed good agreement with the reinforcement strain–crack width relationship obtained from the tests.
1. Introduction
In recent years, there has been growing concern regarding the deterioration of aging infrastructure, with reduced service lives being reported even for concrete structures. Proper maintenance management is now seen as essential to extend the service lives of newly built concrete structures. Steel reinforcements have been regularly used in concrete structures; however, steel reinforcements are known to corrode as a result of carbonation and chloride attack, amongst other factors, causing deterioration in structural performance.
Fiber-reinforced polymer (FRP) bars are characterized by their superior corrosion resistance, tensile strength, and full-elastic behavior, compared with steel reinforcements [1]. These properties can improve the durability and repairability of concrete structures when FRP bars are used instead of steel reinforcements, as demonstrated by numerous studies conducted since the 1980s e.g., [2,3,4,5,6,7,8]. FRP bars are formed by impregnating and integrating resin into fibers. Two main types of fibers are used: organic fibers, represented by aramid fibers; and inorganic fibers, represented by carbon, glass, and basalt fibers. Each fiber has its own particular characteristics; for instance, aramid FRP (AFRP) is both flexible and easy to handle due to its organic nature, and also provides insulation, while carbon FRP (CFRP) is noted for its high elastic modulus and tensile strength. Numerous studies have been conducted to understand the various material properties of FRP. For instance, Aydın and Arslan investigated the material properties of FRP in different environmental conditions and thereby demonstrated the superior qualities of CFRP [9]. Researchers have also found that the bond characteristics of FRP depend on surface configurations [10].
In structural design, it is imperative to ensure a requisite level of durability so that safety standards are upheld. In FRP-reinforced concrete, the expected ultimate failure mode is the bending fracture of the concrete (avoiding FRP rupture); however, a rapid drop in bearing capacity can be foreseen due to the brittle crushing of concrete.
Fiber-reinforced cementitious composite (FRCC) may be used to address these issues. FRCC is a cementitious material reinforced with short discrete fibers. It exhibits ductile behavior due to the bridging effect of these fibers across cracks. Steel fibers have been utilized in FRCC, as well as polymeric fibers such as polyethylene (PE), polyvinyl alcohol (PVA), and polypropylene (PP). Different types of FRCC are characterized by their behavior following the occurrence of cracks. For example, ductile fiber-reinforced cementitious composites (DFRCCs) [11] exhibit deflection-hardening behavior under bending conditions, while strain-hardening cementitious composites (SHCCs) [12] exhibit pseudo-strain-hardening behavior under uniaxial tension. Because one of the advantages of FRCC is its ability to control crack width through the bridging effect of the fibers across the crack, it is important to understand the relationship between tensile stress and crack width, hereinafter referred to as the bridging law. This law has been determined by numerous researchers using various methods [13,14,15,16,17,18,19,20]. The authors of this paper have also studied bridging laws for PVA-FRCC [21,22] and aramid-FRCC [23] by considering the effects of inclined angles and probability density functions upon fiber dispersion and orientation.
Easy maintenance and high durability are expected in structures made with FRCC reinforced with FRP bars (FRP/FRCC). While several studies involving FRP/FRCC members have been conducted, most of these have involved hybrid structures in which reinforcing steel or conventional concrete was used [24,25,26,27,28]. To date, researchers have considered only a limited range of FRP and FRCC-mixed fibers, and there remains a need for a more comprehensive structural characterization. For the present study, therefore, we combined a braided aramid FRP bar with PVA-FRCC, and thus adopted a novel approach.
For practical application, understanding the structural performance of FRP/FRCC specimens is crucial. It is also important to quantitatively evaluate crack width, as the fiber bridging law in FRCC is a function of crack width. In the present study, we mainly focused on the structural performance and crack width of members in FRP/FRCC. For reinforced concrete (RC) members, the authors proposed a crack width prediction formula based on the calculation of bond interactions between the reinforcing bar and concrete [29]. This formula expresses crack width as a simple function of concrete and rebar dimensions, bond stiffness, tensile strength of concrete, and rebar strain. The effect of the bridging law in FRCC is also incorporated into this formula, so that it may be used as a crack width prediction formula for steel reinforcement FRCC members [30]. This formula is also applicable to FRP/FRCC members because the terms related to the reinforcement are the reinforcement dimensions, the elastic modulus, and the bond properties. To apply this formula, the properties of the bond between the FRP and the FRCC must be understood. In the present study, therefore, a pullout bond test was conducted to characterize the bond constitutive law between the FRP bars and the FRCC. In addition, a pullout test using specimens of long bond length was conducted to compare numerical relationships with test results. Finally, a four-point bending test was conducted to determine the structural performance of FRP/FRCC beam specimens, and the test results were compared with the rebar strain–crack width relationship obtained using the prediction formula.
2. Pullout Bond Test
2.1. Outline of Pullout Bond Test [31]
Table 1 presents a list of specimens used in the pullout bond test. Figure 1 illustrates an example specimen. The height of all specimens was 100 mm. Each specimen contained one AFRP bar positioned in the center of the cross-section. The used AFRP was a bundled-type rod impregnated with epoxy resin. The specified fiber volume content was 75%. PVA fibers were used for the FRCC. The cross-sectional dimensions were set to be 100 × 100 mm2, 120 × 120 mm2, and 140 × 140 mm2. To secure the specimens in the testing machine’s chuck, a steel coupler was affixed to the end of the FRP reinforcement using an expansion agent which is conventionally utilized for destroying rocks. There was no special attachment at the free end. The bond length was set to 54 mm, which was approximately four times the bar diameter. The experimental parameters included the cross-sections of the specimens and the fiber volume fractions of the FRCC (0%, 1%, 2%). Naming of the specimens followed a format based on fiber volume fractions (MT: 0%; PVA1%: 1.0%; and PVA2%: 2.0%) and cross-sections (A: 100 × 100 mm2, B: 120 × 120 mm2, and C: 140 × 140 mm2). Three specimens were manufactured for each parameter, resulting in a total of twenty-seven specimens.

Table 1.
List of specimens of pullout bond test.
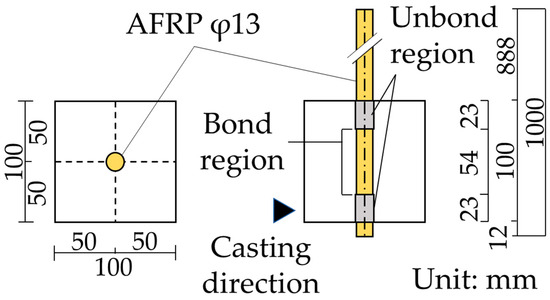
Figure 1.
Example specimen (A series).
Figure 2 and Figure 3 show the surface shapes of AFRP and PVA fibers, respectively. Table 2 and Table 3 show the mechanical properties of AFRP and PVA fibers, respectively. Table 4 shows the mixture proportions and compressive properties of the FRCC for a φ100 mm × 200 mm cylinder compression test followed by JIS A 1108 [32].
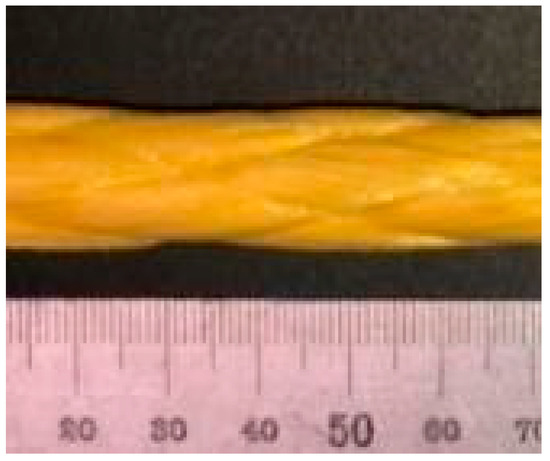
Figure 2.
Braided AFRP bar.
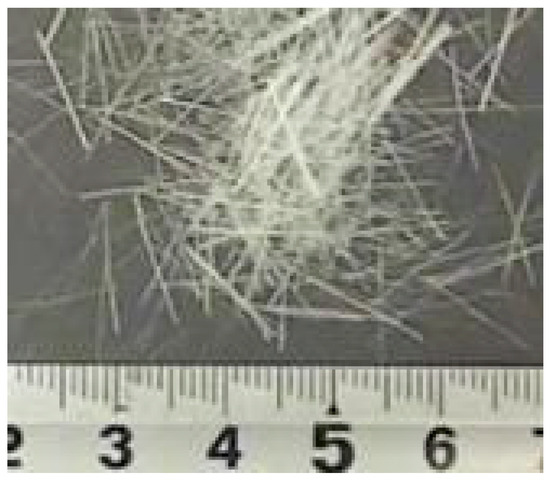
Figure 3.
PVA fibers.
Table 2.
Mechanical properties of reinforcement.
Table 3.
Mechanical properties of fiber.
Table 4.
Mixture proportions and compressive properties of FRCC.
Figure 4 shows the loading method. The monotonic pullout loading was carried out using a universal testing machine. To minimize the friction between the reaction plate and the specimen, a Teflon sheet was inserted. The measurement items were the pullout load and the reinforcement slip at the free end, measured using a linear variable displacement transducer (LVDT).
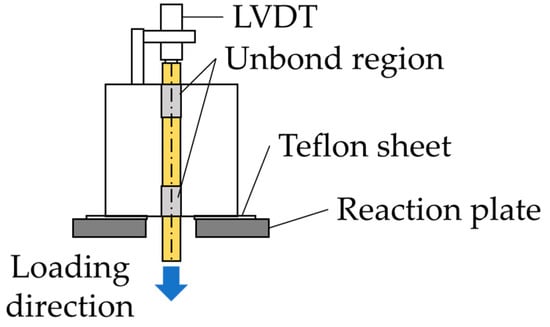
Figure 4.
Loading configuration.
2.2. Modeling of Bond Constitutive Law
The bond stress–loaded-end slip relationship obtained from the pullout test results was described using a trilinear model, as shown in Figure 5. The maximum bond stress was determined to be the average of maximum bond stresses among identical specimens. was the average of the slip at maximum bond stresses. The initial slope was set to 4/5 of the maximum bond stress. was set to 4/5 of the maximum bond stress. The softening slope was determined as −0.3 N/mm3 because there were no observable differences among the FRCC specimens. In the case of MT specimens, because test results for the softening branch could not be obtained, the ultimate slip was empirically set to 1.5 mm. Table 5 shows the characteristic values derived from the trilinear model for each type of specimen. Figure 6 shows a comparison between the test results and trilinear model values. It can be seen that the trilinear model values are compatible with the test results, particularly with respect to behavior leading up to the maximum bond stress.
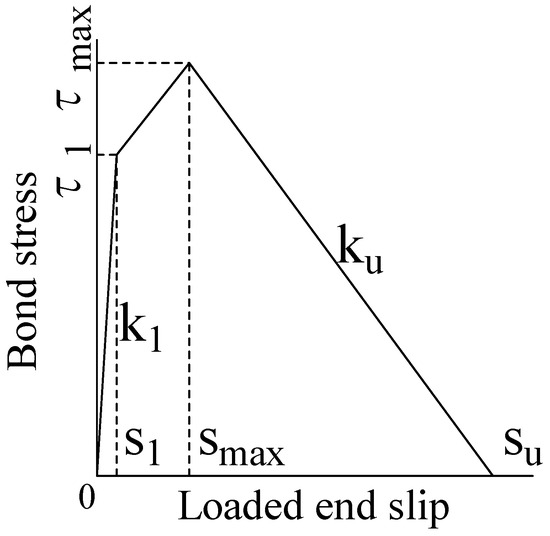
Figure 5.
Trilinear model.
Table 5.
List of characteristic values of the trilinear model.
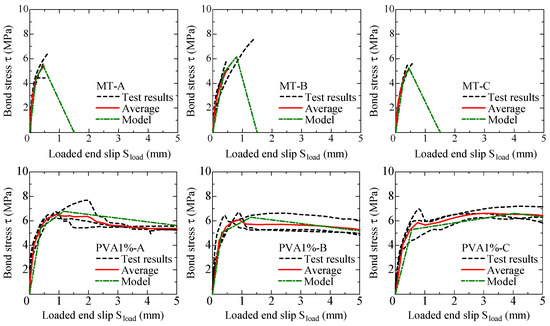
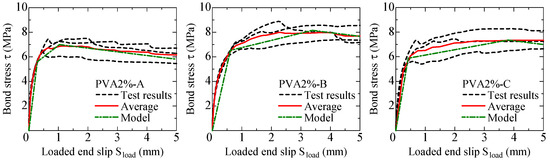
Figure 6.
Comparison between test results and trilinear model values.
3. Pullout Bond Test with Long Bond Length
3.1. Outline of Pullout Bond Test
3.1.1. Specimens
Table 6 presents a list of specimens used in the pullout bond test with long bond length. Figure 7 illustrates an example specimen. These specimens consisted of three types of rectangular FRCC blocks, each with a height of 600 mm. The cross-sectional dimensions were 100 × 100 mm2 (A series), 120 × 120 mm2 (B series), and 140 × 140 mm2 (C series). One braided AFRP bar was positioned at the center of each block. A steel coupler was affixed to the end of the reinforcement to fix the testing machine’s chuck. The bond length was 543 mm, approximately forty times the diameter of the FRP reinforcement. The experimental parameters included the cross-sections of the specimens and the fiber volume fractions of the FRCC (0%, 1%, or 2%). PVA fibers were used for the FRCC. Naming of the specimens followed a format based on fiber volume fractions (MT: 0%; PVA1%: 1.0%; and PVA2%: 2.0%) and cross-sections (A: 100 × 100 mm2; B: 120 × 120 mm2; and C: 140 × 140 mm2). One specimen was manufactured for each parameter, resulting in a total of nine specimens.
Table 6.
List of specimens used in bond tests with a long bond length.
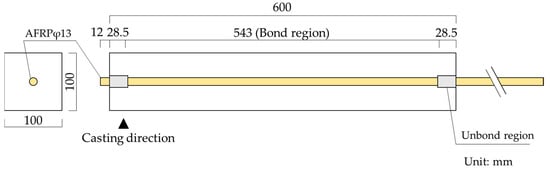
Figure 7.
Example specimen (A series).
3.1.2. Materials
The AFRP and PVA fibers used in this context were identical to those employed in the pullout bond test described in Section 2 above. However, in the case of the AFRP bar, the manufacturer’s production lot was different from that of the bar described in Section 2; its mechanical properties are shown in Table 7. However, a comparison of Table 2 and Table 7 reveals that the differences in the mechanical properties of reinforcement were small, and because they were manufactured using a similar method, the impact of the differences in manufacture on the experimental results was minimal. The mixture proportions of the FRCC were consistent with those set out in Table 4 above. Table 8 shows the compressive properties of the FRCC for a φ100 mm × 200 mm compression test followed by JIS A 1108. The fiber volume fractions of the PVA fibers were set to 0% (mortar), 1%, and 2%, i.e., the same as those in the pullout bond test.
Table 7.
Mechanical properties of reinforcement.
Table 8.
Compressive properties of FRCC.
3.1.3. Loading Method
Figure 8 shows the loading method. The monotonic pullout loading was applied using a universal testing machine under controlled displacement. Teflon sheets were inserted between the specimen and the reaction plate to facilitate lateral displacement of the block. The measurement items were the pullout load, the reinforcement slip at the free end, and the displacement at the loaded end by two LVDTs.
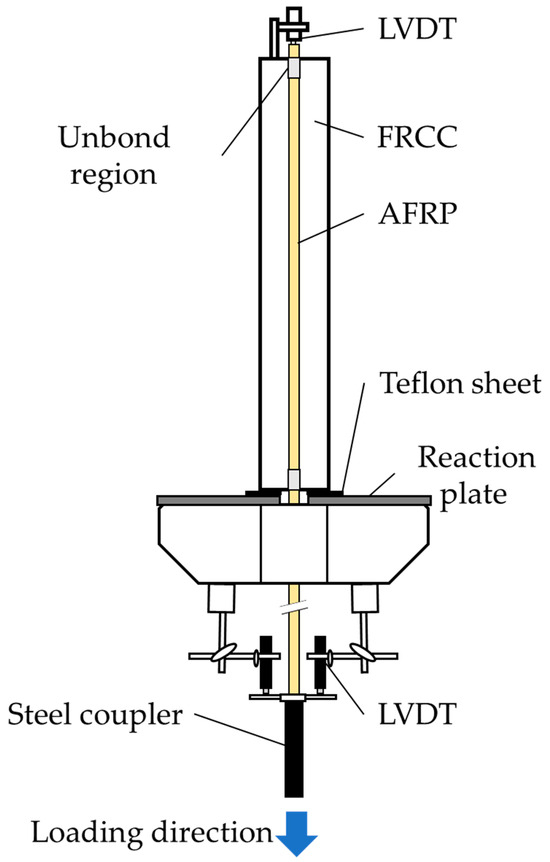
Figure 8.
Loading configuration.
3.2. Test Results
3.2.1. Specimens after Loading
Figure 9 shows the specimens after testing. Cracks were observed at the free ends and sides of all specimens. For MT specimens, the generation of the first crack coincided with reaching the maximum load, leading to specimen failure. In contrast, among FRCC specimens, the crack width decreased with increases in fiber volume fraction.
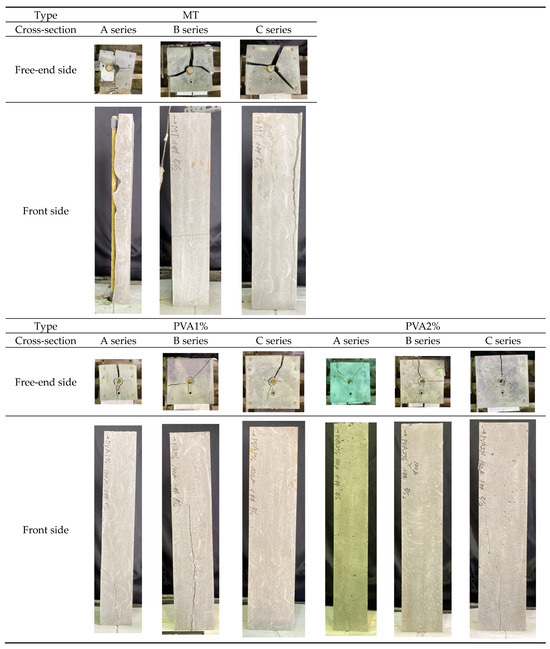
Figure 9.
Specimens after testing.
3.2.2. Average Bond Stress–Loaded-end Slip Relationship
Figure 10 shows the average bond stress–loaded-end slip relationship obtained from the pullout bond test. The average bond stress was calculated by dividing the pullout load by the surface area of the reinforcing bars within the bond length, as shown in Equation (1). The loaded-end slip was calculated by subtracting the FRP elongation outside the bond region from the average of the displacements at the loaded end, as measured by the LVDTs, as shown in Equation (2).
where is average bond stress, in Mpa; is the average of the displacements at the loaded end obtained by the LVDTs, in mm; and is the length from the upper end of the steel coupler to the bottom end of the bond region, in mm.
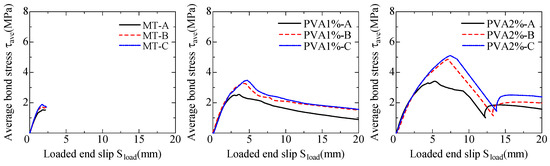
Figure 10.
Average bond stress–loaded-end slip relationships.
In MT specimens, when the first crack was generated, the average bond stress reached maximum value and then decreased rapidly. In FRCC specimens, the average bond stress continued to increase even after generation of the first crack. Moreover, the maximum average bond stress in FRCC specimens was greater than that in MT specimens. Additionally, FRCC specimens exhibited greater ductility behavior after reaching the maximum average bond stress; this was attributed to the fiber bridging effect. In FRCC specimens, the average bond stress increased with the increases in fiber volume fraction. In all specimens, the average bond stress increased with increases in the specimen cross-section. In contrast to the findings from the pullout bond test described in Section 2 above, the strength of the longer bond led to enhancement of the FRCC binding effect and consequently exerted a more effective restraint on slip.
3.3. Numerical Calculation of Bond Properties
3.3.1. Method of Numerical Calculation
In a previous study, the bond behavior of RC members with long bond length was analyzed numerically using a relation equation that described the local bond properties of these RC members [35]. In this study, a similar approach was applied to analyze the bond properties of AFRP/PVA-FRCC members with long bond length. The bond constitutive laws (bond stress–slip relations) used in this analysis were derived from the results of the pullout bond test conducted on AFRP/PVA-FRCC which were presented in Section 2. Figure 11 shows the infinitesimal element of FRCC reinforced with AFRP bar under tensile conditions in the i-th section in calculation, where is the length of the infinitesimal element, is the tensile force of the reinforcement, is the increment of the tensile force of the reinforcement in , τi−1 is the local bond stress, is the slip, and is the increment of the slip.
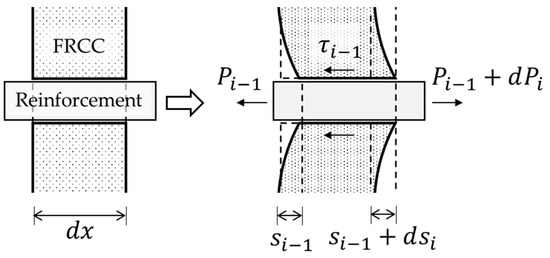
Figure 11.
The infinitesimal element of FRCC reinforced with AFRP bar under tensile conditions in the i-th section. (i = 1, 2, 3,...).
Because the bond stress can be considered uniform within the infinitesimal element, and can be expressed using Equations (3) and (4), respectively, as follows:
where is the elastic modulus of reinforcement, is the cross-sectional area of reinforcement, is the elastic modulus of FRCC, is the cross-sectional area of FRCC, and is the perimeter of reinforcement.
Values for and at the end of the infinitesimal element may now be calculated using Equations (5) and (6), respectively, as follows:
To apply to the pullout bond test, a sequential computation was conducted from the free end to the loaded end, with the tensile force at the free end , and a boundary condition assigned to (representing the free end slip). The average bond stress–loaded-end slip relationship could then be obtained by increasing from a sufficiently small value. The average bond stress was calculated by dividing the tensile force at the loaded end by the whole surface area of the reinforcing bar within the bond length.
For the bond constitutive laws, the trilinear model of bond stress–loaded-end slip relationships shown in Figure 5 was used. In this study, the model was modified by multiplying the bond stress by 54 mm/100 mm (bond length/height of specimen) to account for the restraint imposed by the FRP due to the unbonded region in the FRCC [36]. Table 9 shows the list of characteristic values of the local bond properties.
Table 9.
List of characteristic values of the local bond properties.
3.3.2. Comparison of Average Bond Stress–Loaded-end Slip Relationships
Figure 12 shows a comparison of the test results with the numerical calculations. The green lines indicate calculation results, and the dashed lines indicate test results. Overall, the fitting between the calculations and the test results was generally favorable. For the PVA2%-B and PVA2%-C specimens, the calculated maximum average bond stress was slightly lower than that observed in the test results. This discrepancy was attributed to the fact that, unlike in the pullout bond test in Section 2, the average bond stress in these cases increased with the increasing cross-sectional area of the specimens.
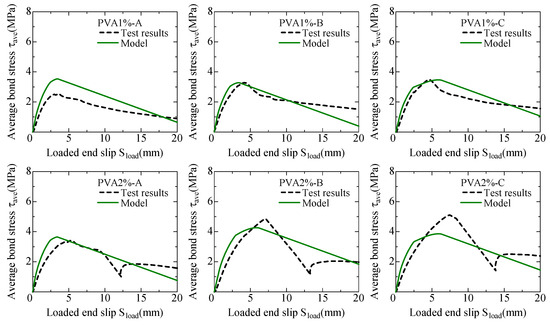
Figure 12.
Comparison of average bond stress–loaded-end slip relationships.
4. Bending Test of AFRP/PVA-FRCC Beams
4.1. Outline of Bending Test
4.1.1. Specimens
Table 10 presents a list of specimens used in the bending test. Figure 13 illustrates an example specimen. Four beams of PVA-FRCC reinforced with AFRP, each with a total length of 1680 mm and cross-sectional dimensions of 280 mm × 180 mm, were designed to lead the fracture of the FRCC at the compression side before the rupture of AFRP bars. As in the pullout test with long bond length described in Section 3 above, the same braided AFRP bars and PVA fibers were used. The focused test section was the constant bending moment region. In the shear span, steel stirrups by D10 were arranged to avoid shear failure. The main experimental parameters were the fiber volume fraction (0%, 1%, or 2%) and the loading method (monotonic loading or one-sided cyclic loading). One-sided cyclic loading (denoted by symbol C) was conducted only on specimens with 2% fiber volume fraction. The mixture proportions of FRCC remained consistent with those specified in the pullout bond test, as shown in Table 4 above. Table 11 shows the compressive properties of the FRCC for a φ100 mm × 200 mm cylinder compression test followed by JIS A 1108. One specimen was prepared for each parameter, resulting in a total of four specimens.
Table 10.
List of specimens.
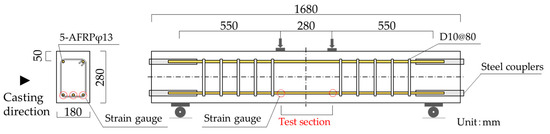
Figure 13.
Example specimen.
Table 11.
Compressive properties of FRCC.
4.1.2. Loading Method
A four-point bending load was applied by the universal testing machine under controlled displacement. Two LVDTs were set to measure the deflection at the loading points. Three π-type displacement transducers (C1, C2, and C3) were arranged to measure axial deformation at the compression side of the specimens, while another three π-type displacement transducers (T1, T2, and T3) were arranged to measure axial deformation at the tensile side of the specimens. Figure 14 shows specimen details with the setup of displacement transducers. Six strain gauges were set to measure the strains of AFRP reinforcement bars at the tension side of loading points, as shown in Figure 13. Figure 15 shows the loading history of one-sided cyclic loading. The cyclic loading was controlled by deflection at the loading points and was applied five times each at deflections of 2 mm, 4 mm, 6 mm, 8 mm, and 10 mm, and twice at a rotation angle of 3/100 rad. (16.5 mm). After applying cyclic loading, the specimens underwent loading until ultimate failure was reached.
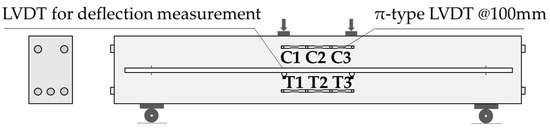
Figure 14.
Specimen details with the setup of displacement transducers.
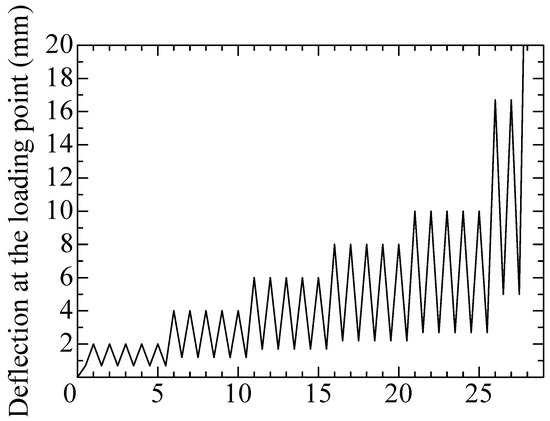
Figure 15.
Loading history.
4.2. Test Results
4.2.1. Specimens after Loading
Figure 16 shows specimens after loading and cracks in the constant bending moment region. In MT and PVA1% specimens, the load decreased due to the failure of the anchorage at the end of the specimen. In the PVA2% and PVA2%C specimens, the load reached maximum value due to the compression fracture of the FRCC. Following this, deflection increased while the load was maintained. In FRCC specimens, the number of cracks within the constant bending moment region increased with increases in the fiber volume fraction.
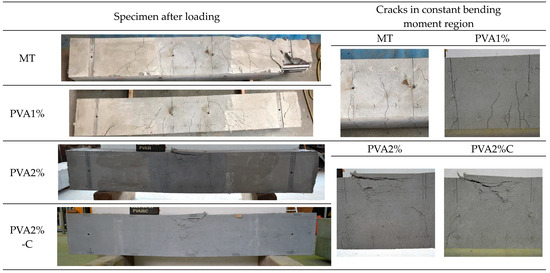
Figure 16.
Specimens after loading and cracks in constant bending moment regions.
4.2.2. Load–Deflection Relationships
Figure 17 shows the load–deflection relationships for monotonic loading specimens. The left figure includes a skeleton illustration for the cyclic-loading specimen. In the right figure, the whole relationship of the cyclic-loading specimen is shown. The deflection is the average of two deflections at the loading points. The maximum loads recorded for each type of specimen were as follows: MT: 154 kN; PVA1%: 217 kN; PVA2%: 198 kN; and PVA2%-C: 229 kN. For the PVA2%-C specimens, no reduction in load or maximum load was observed throughout each cycle of cyclic loading. PVA2% specimens exhibited ductile behavior following FRCC crushing; this was attributed to fiber bridging.
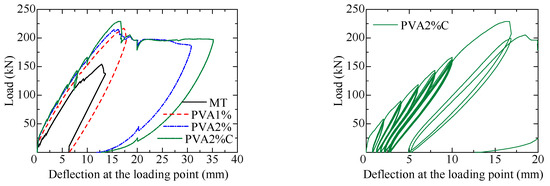
Figure 17.
Load–deflection relationships.
4.2.3. Cracking Characteristics
Figure 18 shows the AFRP reinforcement strain–crack width relationship measured in the test. The AFRP reinforcement strain was an average of the six strain gauges located at the loading points of tension bars. Experimental crack width values were determined by dividing the axial deformation of each section, as obtained from the π-type displacement transducers, by the number of cracks in each section. The blue lines in Figure 18 show averaged test results. It can be seen that the slopes of the averaged experimental results become more pronounced as the fiber volume fraction increases because the fiber bridging effect brings control of the crack width opening and increased numbers of cracks at the same reinforcement strain.
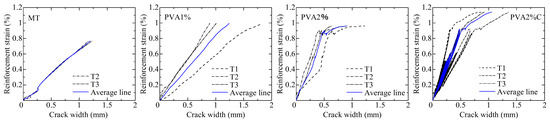
Figure 18.
Reinforcement strain–crack width relationships.
The crack width prediction formula, as given in Equation (7), was proposed in previous studies [30]. This formula is obtained by solving the force equilibrium and compatibility conditions between FRCC and the reinforcing bar, considering the bond stress–slip relationship, the fiber bridging law, and the conditions of crack occurrence. The formula expresses the relationship between the reinforcement strain and crack width in FRCC as the possible width of a single crack.
Here, is the reinforcement strain, is the perimeter of FRP reinforcement, is the cracking strength of FRCC, is the crack width, is the fiber bridging stress at crack, is the elastic modulus ratio (), is the reinforcement ratio (), is the elastic modulus of reinforcement, is the elastic modulus of FRCC, is the cross-sectional area of reinforcement, is the cross-sectional area of FRCC, and is the loaded-end slip.
Figure 19 shows the reinforcement strain–crack width relationship as determined using the crack width prediction formula. Regarding the bridging law, a trilinear model [22] was employed, which replicated the calculation results using the same PVA fiber and mixture proportion of matrix with this study. The integral of the right-hand side of Equation (7) indicates the bond stress–slip relationship (bond constitutive law). The trilinear model developed in this study for the 100 × 100 mm2 cross-section specimen described in Section 2 (Figure 5) was utilized. Table 12 shows the values substituted into the formula. The tensile strength of FRCC was determined as the average cracking strength from the bending test of the 100 mm × 100 mm × 400 mm specimens, using the same mixing batch of PVA-FRCC. The cross-section of the FRCC corresponds to the equivalent cross-section of the FRCC supported by each tension bar, as shown in Figure 20.
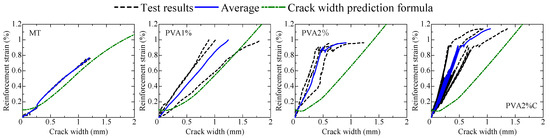
Figure 19.
Reinforcement strain–crack width relationships.
Table 12.
Values substituted into the prediction formula.
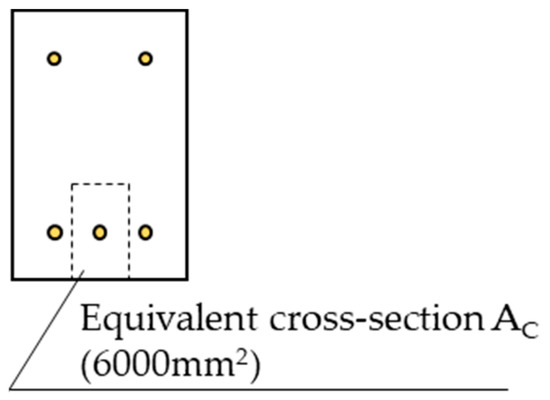
Figure 20.
Equivalent cross-section of FRCC.
It can be seen that, for all specimens, the crack width observed along the average line was smaller than that predicted by the formula at the same strain. The formula indicates the possible width of individual cracks, but in the actual structure, the width of each crack tends to be smaller than the predicted value due to the presence of other cracks. Because the prediction formula offers a mean calculation of potential maximum crack widths at any given reinforcement strain, the values obtained using the prediction formula are reasonably accurate when compared with test results.
5. Conclusions
The main conclusions of this research may be summarized as follows:
- In the pullout bond test, a trilinear model for the bond constitutive law (bond stress–loaded-end slip relationship) was proposed.
- According to the pullout bond test with specimens of long bond length, the bond strength increased with increases in both the fiber volume fraction and the cross-section of the specimens. These characteristics can be attributed to the fiber bridging effect, which results in control of crack width opening.
- Bond behavior with a long bond length was analyzed numerically using the proposed bond constitutive law. The calculated average bond stress–loaded-end slip relationships favorably fitted the test results.
- The bending test results for AFRP/PVA-FRCC beam specimens showed that the number of cracks increased with the increases in fiber volume fraction. The maximum loads recorded for each type of specimen were as follows: MT: 154 kN; PVA1%: 217 kN; PVA2%: 198 kN; and PVA2%C: 229 kN. In the case of specimens with a fiber volume fraction of 2%, the load reached its maximum value due to the compression fracture of the FRCC, and cyclic loading had no discernible effect.
- The adaptability of the crack width prediction formula, considering the bond constitutive law and the fiber bridging law with respect to PVA-FRCC, was discussed. The reinforcement strain–crack width relationship obtained from the bending test exhibited good compatibility with the crack width prediction formula.
Author Contributions
Conceptualization, S.T., T.K. and H.K.; methodology, S.T., T.K. and H.K.; validation, S.T., T.K. and H.K.; formal analysis, S.T.; investigation, S.T., H.K. and H.S.; data curation, S.T. and H.K.; writing—original draft preparation, S.T.; writing—review and editing, T.K.; visualization, S.T. and H.K.; supervision, T.K.; project administration, T.K. All authors have read and agreed to the published version of the manuscript.
Funding
This research received no external funding.
Data Availability Statement
The data that support the findings of this study are available from the corresponding author upon reasonable request.
Acknowledgments
The AFRP bars and PVA fibers were provided by Fibex Co., Ltd., and Kuraray Co., Ltd., respectively.
Conflicts of Interest
The authors declare no conflict of interest.
References
- American Concrete Institute. Guide for the Design and Construction of Structural Concrete Reinforced with Fiber-Reinforced Polymer (FRP) Bars, ACI 440.1R-15; American Concrete Institute: Farmington Hills, MI, USA, 2015. [Google Scholar]
- Nanni, A. Flexural Behavior and Design of RC Members Using FRP Reinforcement. J. Struct. Eng. 1993, 119, 3344–3359. [Google Scholar] [CrossRef]
- Pecce, M.; Manfredi, G.; Cosenza, E. Experimental Response and Code Modelsof GFRP RC Beams in Bending. J. Compos. Constr. 2000, 4, 182. [Google Scholar] [CrossRef]
- Gravina, R.J.; Smith, S.T. Flexural Behaviour of Indeterminate Concrete Beams Reinforced with FRP Bars. Eng. Struct. 2008, 30, 2370–2380. [Google Scholar] [CrossRef]
- Burgoyne, C.J. Should FRP Be Bonded to Concrete? Special Publication Series; American Concrete Institute: Farmington Hills, MI, USA, 1993; SP-138; pp. 367–368. [Google Scholar]
- Kanakubo, T.; Yonemaru, K.; Fukuyama, H.; Fujisawa, M.; Sonobe, Y. Bond Performance of Concrete Members Reinforced with FRP Bars; Special Publication Series; American Concrete Institute: Farmington Hills, MI, USA, 1993; SP-138; pp. 767–788. [Google Scholar]
- Toutanji, H.; Deng, Y. Deflection and Crack-Width Prediction of Concrete Beams Reinforced with Glass FRP Rods. Constr. Build. Mater. 2003, 17, 69–74. [Google Scholar] [CrossRef]
- El-Nemr, A.; Ahmed, E.A.; El-Safty, A.; Benmokrane, B. Evaluation of the Flexural Strength and Serviceability of Concrete Beams Reinforced with Different Types of GFRP Bars. Eng. Struct. 2018, 173, 606–619. [Google Scholar] [CrossRef]
- Aydın, F.; Arslan, Ş. Investigation of The Durability Performance of FRP Bars in Different Environmental Conditions. Adv. Concr. Constr. 2021, 12, 295–302. [Google Scholar]
- Solyom, S.; Balázs, G.L. Analytical and Statistical Study of the Bond of FRP Bars with Different Surface Characteristics. Compos. Struct. 2021, 270, 113953. [Google Scholar] [CrossRef]
- Matsumoto, T.; Mihashi, H. JCI-DFRCC Summary Report on DFRCC Terminologies and Application Concepts. In Proceedings of the JCI International Workshop on Ductile Fiber Reinforced Cementitious Composites (DFRCC), Takayama, Japan, 21–22 October 2002; pp. 59–66. [Google Scholar]
- Rokugo, K.; Kanda, T. (Eds.) Strain Hardening Cement Composites: Structural Design and Performance RILEM State-of-the-Art Reports 6; Springer: Berlin/Heidelberg, Germany, 2013; p. 90. [Google Scholar]
- Lövgren, I. Fibre-Reinforced Concrete for Industrial Construction—A Fracture Mechanics Approach to Material Testing and Structural Analysis; Chalmers University of Technology: Gothenburg, Sweden, 2005. [Google Scholar]
- Balaguru, P.N.; Shah, S.P. Basic Concepts and Mechanical Properties: Tension, Fiber-Reinforced Cement Composites; McGraw-Hill: New York, NY, USA, 1992; pp. 37–84. [Google Scholar]
- Amin, A.; Foster, S.J.; Muttoni, A. Derivation of the σ- w Relationship for SFRC from Prism Bending Tests. Struct. Concr. 2015, 16, 93–105. [Google Scholar] [CrossRef]
- Pereira, E.B.; Fischer, G.; Barros, J.A.O. Direct Assessment of Tensile Stress-Crack Opening Behavior of Strain Hardening Cementitious Composites (SHCC). Cem. Concr. Res. 2012, 42, 834–846. [Google Scholar] [CrossRef]
- Yu, J.; Leung, C.K.Y. Novel Experimental Method to Determine Crack-Bridging Constitutive Relationship of SHCC Using Digital Image Processing. In Strain-Hardening Cement-Based Composites SHCC-4; Springer: Dresden, Germany, 2018; Volume 15, pp. 55–62. [Google Scholar]
- Li, V.C.; Stang, H.; Krenchel, H. Micromechanics of Crack Bridging in Fibre-Reinforced Concrete. Mater. Struct. 1993, 26, 486–494. [Google Scholar] [CrossRef]
- Laranjeira de Oliveira, F. Design-Oriented Constitutive Model for Steel Fiber Reinforced Concrete. Ph.D. Thesis, Universitat Politècnica de Catalunya, Barcelona, Spain, 2010. [Google Scholar]
- Yang, E.-H.; Wang, S.; Yang, Y.; Li, V.C. Fiber-Bridging Constitutive Law of Engineered Cementitious Composites. J. Adv. Concr. Technol. 2008, 6, 181–193. [Google Scholar] [CrossRef]
- Kanakubo, T.; Miyaguchi, M.; Asano, K. Influence of fiber orientation on bridging performance of polyvinyl alcohol fiber-reinforced cementitious composite. ACI Mater. J. 2016, 113, 131–141. [Google Scholar] [CrossRef]
- Yuriko, O.; Masaru, M.; Toshiyuki, K. Modeling of Bridging Law for PVA Fiber-Reinforced Cementitious Composite Considering Fiber Orientation. J. Civ. Eng. Archit. 2018, 12, 651–661. [Google Scholar] [CrossRef]
- Kanakubo, T.; Echizen, S.; Wang, J.; Mu, Y. Pullout behavior of bundled aramid fiber in fiber-reinforced cementitious composite. Materials 2020, 13, 1746. [Google Scholar] [CrossRef]
- Fischer, G.; Li, V.C. FRP reinforced ECC structural members under reversed cyclic loading conditions, Advances in Building Technology. In Proceedings of the International Conference on Advances in Building Technology, Hong Kong, China, 4–6 December 2002; Volume I; pp. 781–788. [Google Scholar]
- Tolou Kian, M.J.; Ghazizadeh, S.; Cruz Noguez, C.A. An Experimental Investigation of FRCC Shear Walls Reinforced with Steel and GFRP Bars. J. Compos. Sci. 2018, 2, 55. [Google Scholar] [CrossRef]
- Hu, B.; Zhou, Y.; Xing, F.; Sui, L.; Luo, M. Experimental and Theoretical Investigation on the Hybrid CFRP-ECC Flexural Strengthening of RC Beams with Corroded Longitudinal Reinforcement. Eng. Struct. 2019, 200, 109717. [Google Scholar] [CrossRef]
- Hou, W.; Li, Z.-Q.; Gao, W.-Y.; Zheng, P.-D.; Guo, Z.-X. Flexural Behavior of RC Beams Strengthened with BFRP Bars-Reinforced ECC Matrix. Compos. Struct. 2020, 241, 112092. [Google Scholar] [CrossRef]
- Ge, W.; Song, W.; Ashour, A.F.; Lu, W.; Cao, D. Flexural Performance of FRP/Steel Hybrid Reinforced Engineered Cementitious Composite Beams. J. Build. Eng. 2020, 31, 101329. [Google Scholar] [CrossRef]
- Kanakubo, T.; Yamato, N. Crack Width Prediction Method for Steel and FRP Reinforcement Based on Bond Theory. J. Adv. Concr. Technol. 2014, 12, 310–319. [Google Scholar] [CrossRef][Green Version]
- Sunaga, D.; Namiki, K.; Kanakubo, T. Crack Width Evaluation of Fiber-Reinforced Cementitious Composite Considering Interaction between Deformed Steel Rebar. Constr. Build. Mater. 2020, 261, 119968. [Google Scholar] [CrossRef]
- Takasago, S.; Kanakubo, T.; Kobayashi, H. Crack Width Evaluation of DFRCC Members Reinforced with Braided AFRP Bar. In Strain Hardening Cementitious Composites. SHCC 2022; RILEM Bookseries; Kunieda, M., Kanakubo, T., Kanda, T., Kobayashi, K., Eds.; Springer: Cham, Switzerland, 2023; Volume 39, pp. 156–166. [Google Scholar]
- JIS A 1108; Method of Test for Compressive Strength of Concrete. Japanese Industrial Standard, Japanese Standards Association: Tokyo, Japan, 2018.
- JIS A 1192; Test Method for Tensile Properties of Fiber Reinforced Polymer (FRP) Bars and Grids for Reinforcement of Concrete. Japanese Industrial Standard, Japanese Standards Association: Tokyo, Japan, 2021.
- JIS A 6201; Fly Ash for Use in Concrete. Japanese Industrial Standard, Japanese Standards Association: Tokyo, Japan, 2015.
- Yasojima, A.; Kanakubo, T. Bond Splitting Strength of RC Members Based on Local Bond Stress and Slip Behavior. In Proceedings of the 11th International Conference on Fracture, Turin, Italy, 20–25 March 2005; pp. 1566–1571. [Google Scholar]
- Kanakubo, T.; Hosoya, H. Bond-Splitting Strength of Reinforced Strain-Hardening Cement Composite Elements with Small Bar Spacing. Struct. J. 2015, 112, 189–198. [Google Scholar] [CrossRef]
Disclaimer/Publisher’s Note: The statements, opinions and data contained in all publications are solely those of the individual author(s) and contributor(s) and not of MDPI and/or the editor(s). MDPI and/or the editor(s) disclaim responsibility for any injury to people or property resulting from any ideas, methods, instructions or products referred to in the content. |
© 2023 by the authors. Licensee MDPI, Basel, Switzerland. This article is an open access article distributed under the terms and conditions of the Creative Commons Attribution (CC BY) license (https://creativecommons.org/licenses/by/4.0/).