Abstract
To meet gas turbines’ growing demand for high-performance thermal barrier coatings (TBCs), this study addresses the limitations of traditional single-layer 8% Y2O3-stabilized ZrO2 (YSZ) coatings in high-temperature corrosive environments. Atmospheric plasma spraying (APS) was used to fabricate the double-ceramic TBCs with (Sm0.2Gd0.2Dy0.2Er0.2Yb0.2)2(Zr0.7Hf0.3)2O7 (RHZ) as the outer layer and YSZ as the inner layer; thermal cycling corrosion tests (1000 °C, Na2SO4 + V2O5 molten salt) were conducted to compare its performance with traditional single-layer YSZ. The results showed that the YSZ corrosion products were m-ZrO2 and YVO4, while RHZ/YSZ produced rare-earth vanadates, m-(Zr,Hf)O2, and t′-(Zr,Hf)O2, and corrosion degree was positively correlated with salt concentration (which was more impactful) and the number of cycles. Both coatings failed via molten salt penetration, thermochemical reaction, and crack-induced spallation. The corrosion mechanism between the RHZ/YSZ coating and the mixed salt can be explained based on the Lewis acid–base theory and the optical basicity. The RHZ layer on the surface of RHZ/YSZ coatings indeed hinders the penetration of corrosive molten salts into the underlying YSZ layer to some extent.
1. Introduction
Gas turbines are critical equipment in energy generation, aerospace, and industrial propulsion systems, and their efficiency and service life are strongly dependent on the operating temperature of turbine hot-end components (e.g., turbine blades and guide vanes) []. With the continuous pursuit of higher energy efficiency, the inlet temperature at the turbine front end has been steadily increasing, posing unprecedented challenges to the high-temperature stability and corrosion resistance of the materials protecting these components []. TBCs have become indispensable for isolating substrates from high-temperature gas and ensuring the safe operation of gas turbines [,].
The traditional TBC system primarily consists of a ceramic layer (for thermal insulation) and a bond coat (for adhesion). Among ceramic layer materials, 6%–8% (mass fraction) Y2O3-stabilized ZrO2 (YSZ) has long been the most widely used in industrial gas turbines due to its excellent balance of low thermal conductivity and high fracture toughness []. However, YSZ has inherent limitations that restrict its performance under harsh conditions: when operating above 1200 °C, YSZ undergoes phase transformation from metastable tetragonal (t′-ZrO2) to monoclinic (m-ZrO2), accompanied by a 3%–5% volume expansion that induces cracking []; additionally, high-temperature sintering of internal pores reduces the coating’s strain tolerance, further compromising its durability []. Worse still, TBCs often encounter corrosive environments during service—especially in marine or low-quality fuel-fired conditions—where Cl−, Na+ in air react with S, V, Pb in fuel to form molten salts (e.g., Na2SO4-V2O5 eutectics). These molten salts deposit on coating surfaces, penetrate microcracks/pores, and erode the ceramic layer or protective films, leading to premature failure [,,,].
To overcome these limitations, researchers have explored numerous materials with superior high-temperature performance and corrosion resistance [,,,,,]. Among these new materials, rare-earth zirconate/hafnate-based materials (e.g., Re2(Zr,Hf)2O7, where Re represents a rare earth element) have emerged as highly promising candidates because they exhibit lower thermal conductivity than YSZ, a key advantage for enhancing thermal insulation [,,]. In recent years, high-entropy rare-earth zirconate ceramics containing five or more cations have garnered significant attention due to their outstanding thermal properties. These properties stem from their exceptional high-temperature stability, slow kinetics, significant lattice distortion, and the “cocktail effect” []. Research confirms that high-entropy TBC materials exhibit favorable phase stability, low thermal conductivity, excellent sinter resistance, and high toughness, making them ideal candidates for next-generation thermal barrier coatings [,,]. However, most rare-earth zirconates suffer from low thermal expansion coefficients and poor fracture toughness, which limit their large-scale industrial application as single-layer coatings []. A viable solution is the double-ceramic-layer (DCL) design: using the new rare-earth zirconate as the outer layer to resist high temperatures and corrosion and YSZ as the inner layer to leverage its good mechanical properties and substrate compatibility. Previous studies have shown that DCL TBCs (e.g., LaYbZr2O7/YSZ) exhibit significantly improved thermal barrier performance and thermal cycling life compared to single-layer YSZ []. Preliminary studies reveal that high-entropy (Sm0.2Gd0.2Dy0.2Er0.2Yb0.2)2Zr2O7, containing ultra-high-density (approximately 109 mm−2) edge dislocations [], partially enhances the material’s fracture toughness, offering potential for extending the thermal cycling life of TBCs. Furthermore, related studies indicate that partial substitution of Zr4+ with Hf4+ in A2B2O7-type rare-earth zirconates significantly enhances the material’s mechanical properties []. Although multi-layer or multi-component designs have been shown to enhance thermal durability [,,], detailed studies on the corrosion behavior and failure mechanisms of double-layer TBCs based on high-entropy rare-earth zirconates in typical molten salt environments remain scarce.
In this study, a dual-ceramic (RHZ/YSZ) thermal barrier coating was prepared using the APS process, with the RHZ layer as the outer layer and YSZ as the inner layer. Through thermal cycling corrosion tests, the corrosion behavior and failure mechanisms of the two coating structures were investigated at 1000 °C in Na2SO4 + V2O5 molten salt, and compared with those of conventional single-layer YSZ thermal barrier coatings. The results show that the corrosion products of YSZ consist of m-ZrO2 and YVO4, while RHZ/YSZ coatings generate rare-earth vanadates, m-ZrO2, and t′-ZrO2. The corrosion extent exhibits positive correlation with salt concentration and the number of cycles. The RHZ layer in RHZ/YSZ coatings demonstrates certain ability to inhibit molten salt penetration. The corrosion mechanism between the RHZ/YSZ coating and the mixed salt can be explained based on the Lewis acid–base theory and the optical basicity. This study aims to comprehensively understand the thermal corrosion behavior and failure mechanism of RHZ/YSZ coatings in vanadate-containing molten salts.
2. Materials and Methods
2.1. Preparation of Materials and Coatings
The raw material for the YSZ ceramic layer was commercial ceramic powder Metco204NS (ZrO2-8Y2O3). The raw materials for the RHZ ceramics layer are synthesized via solid-state reactions using raw materials including Sm2O3 (≥99.99%), Gd2O3 (≥99.99%), Dy2O3 (≥99.99%), Er2O3 (≥99.99%), Yb2O3 (≥99.99%), ZrO2 (≥99.99%), and HfO2 (≥99.99%). These raw material powders were first calcined at 1000 °C for 10 h. They were then directly ball-milled at a speed of 250 r/min using ethanol as the mixing medium for 10 h in stoichiometric ratios. The slurry was dried by rotary evaporation and subsequently sintered at 1250 °C for 10 h to obtain the pre-sintered powder. The pre-sintered powder was subjected to ball milling and rotary evaporation again using the same parameters as above. The dried powder was then ground and sieved to obtain the final powder for spraying.
M247 nickel-based alloy circular specimens with a diameter of 25 mm and a thickness of 3.5 mm were used as the metal substrate. A double-layer NiCoCrAlY bond coat with a total thickness of approximately 240 μm was prepared via the high-velocity oxygen fuel (HVOF) spraying process. The double-ceramic layer was prepared using the APS process. Firstly, YSZ was sprayed on the surface of the bond coat as the inner ceramic layer with a thickness of approximately 225 μm, and then RHZ was sprayed as the outer ceramic layer with a thickness of approximately 225 μm. The coating thickness information is shown in Figure 1. The TBCs were deposited by APS in a Multicoat facility (Oerlikon Metco, Wohlen, Switzerland) with an SG100 gun. The HVOF coating equipment for the NiCoCrAlY bond layer was Praxair JP8000 (Astro Alloys, Houston, TX, USA), with preparation parameters: fuel flow rate 6.5 gpm, oxygen flow rate 1850 scfh, powder feed rate 50 g/min, and spray distance 300–350 mm. The APS parameters for the RHZ layer and YSZ layer are listed in Table 1. For comparison, a single-layer YSZ coating specimen with a thickness of approximately 450 μm was prepared on the surface of the same substrate and bond coat.
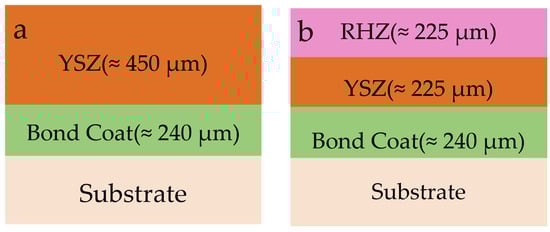
Figure 1.
Thickness information of coatings: (a) YSZ coating; (b) RHZ/YSZ coating.

Table 1.
APS Parameters for Preparing RHZ Layer and YSZ Layer.
2.2. Thermal Cycling Corrosion Test
The corrosive medium used in this study was a mixed salt of 50% (mass fraction) Na2SO4 + 50% (mass fraction) V2O5. Before the experiment, a certain amount of salt was mixed with anhydrous ethanol to form a slurry. Then, the slurry was uniformly sprayed onto the coating surface using an airbrush (Iwata,CM-B, Tokyo, Japan). The specimens coated with the corrosion salt were placed in a drying oven (Mitr LSG, Changsha, China) at 80 °C for sufficient drying, taken out, and weighed using a balance (Mettler Toledo, XPR36, Zurich, Switzerland). The processes of salt coating and weighing were repeated several times until the coverage concentration of the corrosion salt reached the designed concentration. The hot corrosion experiment was carried out in a tube furnace (Kemi,THF-1700, Hefei, China) for convenient experimental observation. The schematic diagram of the cyclic corrosion experiment is shown in Figure 2.
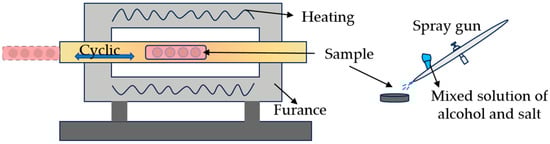
Figure 2.
Schematic diagram of cyclic corrosion experiments.
During the thermal cycling experiment of the specimens coated with corrosion salt, to avoid the influence of edge effects on the experimental results, a distance of 2.5 mm was maintained between the salt-coated area and the edge of the TBC specimen. The thermal cycling corrosion method was used to study the hot corrosion law of the coating. The test temperature was 1000 °C, and the heating rate was 10 °C per minute. Each cycle of the cyclic corrosion process included 50 min of isothermal heating in the furnace and 10 min of cooling outside the furnace, i.e., one cycle lasted for 1 h. Three experimental conditions were established for the thermal cycling corrosion test: ① salt concentration of 5 mg/cm2 with 10 cycles; ② salt concentration of 10 mg/cm2 with 10 cycles; ③ salt concentration of 5 mg/cm2 with 50 cycles. Two duplicate samples were set up under each condition to ensure the reliability of the results.
2.3. Material Characterization
X-ray diffraction (XRD) (Rigaku, Ultima 4, Tokyo, Japan) was used for phase analysis of the newly sprayed coatings and the corroded coatings. The parameters were set as follows: current of 40 mA, voltage of 40 kV, scanning range of 20–80° with a Cu target, and scanning rate of 5°/min. The obtained XRD patterns of the samples were compared with standard PDF cards using Jade (9.0) software to determine the phases. A scanning electron microscope (SEM) (Thermo Scientific, Phenom XL, Waltham, MA, USA) equipped with an energy-dispersive X-ray spectrometer (EDS) was used to analyze the surface and cross-sectional morphologies as well as the element distribution of the specimens. Before the test, the cross-sectional analysis specimens were encapsulated in epoxy resin to avoid potential damage to the coating during the polishing process, and then polished with sandpaper and diamond suspension. A thin gold layer was deposited via a sputtering system (GEVEE, GVC-1000D, Beijing, China) to prevent charge generation during observation.
3. Results and Discussion
3.1. Coating Structure and Phase State
As can be seen from Figure 3a,b, both coatings had a rough surface structure, with unmelted, partially melted, and fully melted particles. The unmelted and partially melted particles were wrapped by the fully melted particles, forming sponge-like microstructural regions with partial porosity, which is a typical feature of the surface morphology of APS coatings. Meanwhile, due to the stress generated by rapid cooling during the spraying process, some microcracks were observed between the fully melted regions, which were conducive to the penetration of molten salt during thermal cycling corrosion. It can be seen from Figure 3c,d that both coatings had a layered structure similar to that of TBCs, consisting of a bond coat and a porous ceramic layer. The RHZ/YSZ coating exhibited a more obvious double-layer structure, with RHZ as the outer layer and YSZ as the inner layer, and the two ceramic layers were well bonded. Additionally, a large number of pores and microcracks were observed on the cross-section, which would provide penetration paths for molten salt during hot corrosion.
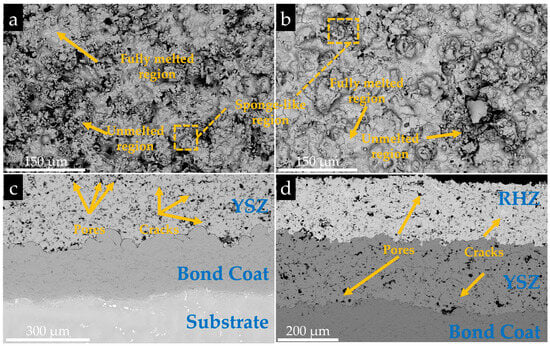
Figure 3.
Surface morphologies and cross-sectional morphologies of APS-prepared coatings: (a) Surface morphology of YSZ coating; (c) Cross-sectional morphology of YSZ coating; (b) Surface morphology of RHZ/YSZ coating; (d) Cross-sectional morphology of RHZ/YSZ coating.
As shown in Figure 4a, the YSZ coating mainly exhibited metastable tetragonal zirconia (t′-ZrO2), which is a typical phase of zirconia-based TBCs. Compared with other phases of ZrO2, t′-ZrO2 has better fracture toughness due to the ferroelastic toughening mechanism inside the grains, which is beneficial to improving the thermal cycling life of the coating. Figure 4b shows the XRD pattern of the RHZ coating. It can be seen from Figure 4b that the diffraction peaks (111), (200), (220), (311), (222), and (400) are all characteristic peaks of the fluorite structure [], and no second-phase diffraction peaks appear, indicating that the RHZ ceramic layer has a single fluorite structure.
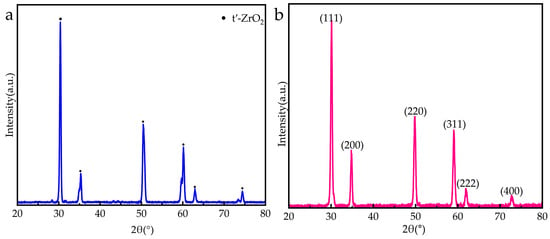
Figure 4.
XRD spectrum: (a) YSZ coating; (b) RHZ coating.
The structure of the RHZ coating can be expressed as A2B2O7, where A and B randomly occupy the 4a (0, 0, 0) lattice sites, and O atoms occupy 7/8 of the 8c (0.125, 0.125, 0.125) lattice sites, with 1/8 oxygen vacancies []. The crystal structure of A2B2O7-type materials is mainly determined by the ratio of the average radii of A-site and B-site cations (r = rA/rB). When rA/rB < 1.46, a defective fluorite structure tends to form; when 1.46 < rA/rB < 1.78, a pyrochlore structure tends to form; and when rA/rB > 1.78, a monoclinic crystal structure tends to form []. The ionic radii of various elements are listed in Table 2. The calculated r value of the RHZ sample is 1.44, so the RHZ sample should have a fluorite-type single-phase structure, which is consistent with the XRD analysis results.
Table 2.
Ionic Radii of Various Elements (The coordination number of rare-earth elements is 8, and that of Zr and Hf is 6) [].
3.2. Corrosion Phenomenon and Corrosion Mechanism of YSZ Coating
Figure 5 shows the macroscopic photographs of the YSZ coating under different corrosion conditions at 1000 °C. Overall, the surface of these coatings changed from white to brownish-yellow after hot corrosion. This indicates that the corrosive salt was completely melted and spread on the coating surface at 1000 °C. After hot corrosion, some coatings showed crack propagation and block spallation. The surface spallation rate of the specimens was quantified using ImageJ (2) software. After 10 cycles of corrosion at a concentration of 5 mg/cm2, cracks were generated on the surface of the YSZ coating with a tendency for propagation. With the extension of hot corrosion time, after 50 h of hot corrosion, long cracks and spallation (approximately 4%) occurred on the surface of the YSZ coating. After 10 cycles of corrosion at a concentration of 10 mg/cm2, severe spallation occurred on the coating surface, and the spallation area of the coating (approximately 13%) was larger than that of the YSZ coating after 50 h of corrosion at a concentration of 5 mg/cm2 (approximately 4%). The above results initially indicate that hot corrosion accelerates the spallation of the YSZ coating. As the concentration of the corrosion salt increases, the corrosion is further aggravated, and with the increase in the number of corrosion cycles, the spallation becomes more severe.
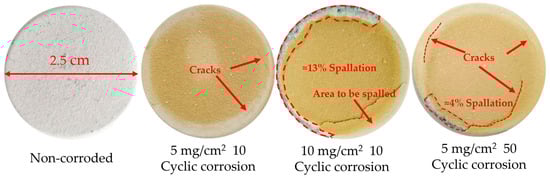
Figure 5.
Macroscopic photographs of YSZ coating before and after corrosion.
As shown in Figure 6, corrosion products were generated on the surface of the YSZ ceramic layer after corrosion, but the morphology and distribution density of the corrosion products on the coating surface were significantly different. In general, long rod-like crystals and granular crystals were clearly observed on the surface of the YSZ coating after corrosion. By comparing Figure 6a,b, it can be seen that the rod-like products generated on the coating surface under the high-concentration corrosion condition were larger than those under the low-concentration condition. By comparing Figure 6a,c, it can be seen that under the same concentration, as the number of cycles increases, the size of the products also shows an increasing trend, but the density of the rod-like products is higher and the size is smaller under a small number of cycles.
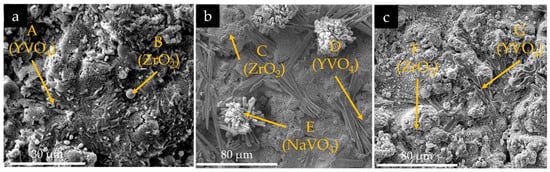
Figure 6.
Corrosion products morphology of YSZ coating: (a) 5 mg/cm2, 10 cycles; (b) 10 mg/cm2, 10 cycles; (c) 5 mg/cm2, 50 cycles.
The EDS analysis results of the corrosion products at different marked positions in Figure 6 are listed in Table 3. Combined with the XRD analysis in Figure 7, the types of corrosion products can be determined. The granular corrosion products in regions B, C, and F on the surface of the corroded YSZ coating are mainly composed of Zr, O, and a small amount of V and Na elements. The rod-like corrosion products in regions A, D, and G on the surface of the YSZ coating are mainly composed of Y, V, and O elements. The cluster-like products in region E are mainly NaVO3. In conclusion, the granular corrosion products on the surface of the YSZ coating are mainly m-ZrO2, which is a product generated after the stabilizer in t′-ZrO2 is consumed by the molten salt. The rod-like corrosion products on the surface of the YSZ coating are mainly YVO4. In the YSZ coating, the stabilizer Y2O3 reacts with the corrosion salt, and the doping elements are consumed during the formation of vanadates, which further leads to the phase transformation of t′-ZrO2 to m-ZrO2.
Table 3.
EDS results of corrosion products at different marked positions in Figure 6.
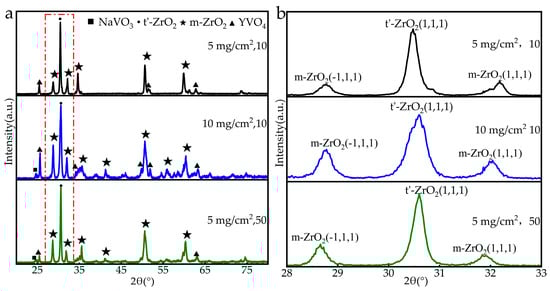
Figure 7.
XRD of the YSZ coating after corrosion: (a) total pattern; (b) enlarged view.
The above results indicate that the quantity and size of corrosion products are related to both the residence time of the molten salt and the reaction rate. When the residence time is the same, more molten salt penetrates into the coating through cracks and pores and reacts under the high-concentration corrosion salt condition, resulting in larger sizes of corrosion products on the surface of the high-concentration corrosion samples and larger spallation areas. Moreover, no cluster-like products as shown in Figure 6b were found under the low-concentration condition, suggesting that the cluster-like products may be intermediate products during the corrosion reaction, and the intermediate product of corrosion is NaVO3.
Figure 7a shows the XRD patterns of the YSZ coating after thermal corrosion with the Na2SO4 + V2O5 salt mixture at 1000 °C for different durations. According to the standard PDF cards of m-ZrO2, t′-ZrO2, YVO4, and NaVO3, the phases corresponding to the XRD peaks were labeled. As can be seen from Figure 7, obvious diffraction peaks of monoclinic zirconia (m-ZrO2) and tetragonal yttrium vanadate (YVO4) appeared in the XRD patterns of the corroded coatings, while the diffraction peaks of Na2SO4 and V2O5 almost completely disappeared. Meanwhile, diffraction peaks of NaVO3 were also found in the XRD results. The above XRD results confirm the previously described corrosion behavior of YSZ, indicating that the molten salt reacts with Y. The loss of Y leads to the instability of ZrO2, resulting in the phase transformation from t′-ZrO2 to m-ZrO2. The corrosion products are mainly m-ZrO2 and YVO4, with the intermediate product NaVO3 existing simultaneously.
By comparing the content of m-ZrO2 phase in the samples under the action of corrosion salt, the destabilization rate of the samples during hot corrosion can be intuitively reflected []. Figure 7b is a partial enlarged view of Figure 7a, which includes the main peak of tetragonal ZrO2 t′(111) and the main peaks of monoclinic zirconia phases m(−111) and m(111). After corrosion, the diffraction peak intensity of t′-ZrO2 in the YSZ coating decreased significantly, and a new m-ZrO2 phase was generated. The content of m-ZrO2 phase can be used as an important reference for coating degradation. The content of m-ZrO2 (Cm) in the coating was calculated using the Miller equation based on the XRD peak intensity, as shown in Equation (1), where Cm, Im(abc), and It’ (abc) represent the relative volume fraction (%) of the m-ZrO2 phase, the integral intensity of the m-ZrO2 phase and t′-ZrO2 phase on specific diffraction atomic planes (abc), respectively.
In this study, Equation (1) was used to calculate the changes in the content of m-ZrO2 phase in the samples after the thermal cycling corrosion experiment. The calculated relative volume fractions of m-ZrO2 phase in the YSZ coating after thermal cycling corrosion were 24.6% (5 mg/cm2, 10 cycles), 43.3% (10 mg/cm2, 10 cycles), and 36.1% (5 mg/cm2, 50 cycles). This proves that the content of m-ZrO2 phase in YSZ under cyclic corrosion conditions at 1000 °C increases with the increase in the number of corrosion cycles and the concentration of corrosion salt, and overall, the concentration of corrosion salt has a greater impact on the corrosion process than the number of corrosion cycles.
Figure 8 shows the cross-sectional morphology of the YSZ coating after thermal cycling corrosion in the Na2SO4 + V2O5 environment and the distribution of V and Y elements. It can be seen that the morphology of the pores in the YSZ coating changed significantly, and Y and V elements accumulated on the surface of the ceramic layer and in the internal pores and gaps, which means that the corrosive medium mainly penetrates through the pores and corrodes with Y2O3. With the passage of time, through cracks are generated inside the ceramic layer, and the further propagation of the cracks leads to the spallation of the coating. By comparing Figure 3c with Figure 8a–c, it can be seen that compared with the newly sprayed state, the porosity of the YSZ coating decreased after thermal cycling corrosion, which is related to the penetration of the corrosive molten salt and the grain growth inside the ceramic layer. A large number of Y and V elements are enriched in the cracks and pores, which proves that the generation of crack defects inside the ceramic layer after thermal cycling corrosion is related to the penetration of molten salt into the coating and the reaction with Y2O3. This process is accompanied by volume expansion, thereby changing the stress state inside the coating. Since the corrosion concentration was excessive in all cases, the molten salt penetrated into the entire ceramic layer during the corrosion process. As shown in Figure 8, the deterioration of YSZ coating intensifies with increasing corrosion time and concentration.
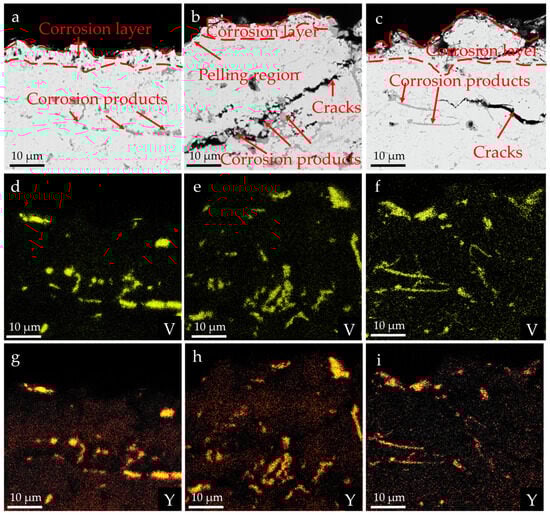
Figure 8.
Cross-sectional morphologies and element distributions of YSZ coating after corrosion: (a,d,g) 5 mg/cm2, 10 cycles; (b,e,h) 10 mg/cm2, 10 cycles; (c,f,i) 5 mg/cm2, 50 cycles.
In conclusion, under the condition of containing corrosion salt, the YSZ coating showed obvious crack propagation and spallation after thermal cycling, with a decrease in porosity, and the initial failure position occurred at the edge of the specimen, which is related to the thermal stress concentration at this position. Meanwhile, small transverse cracks were found inside the YSZ coating, and the cracks were filled with corrosion products, indicating that the molten salt reacts with YSZ through the cracks and pores. This process is accompanied by phase transformation and volume expansion, leading to crack propagation and spallation of the coating.
The above results show that the final corrosion products of the YSZ coating in the Na2SO4 + V2O5 corrosion environment are vanadates and m-ZrO2. In this corrosion environment, V2O5 and Na2SO4 react at high temperatures to form NaVO3 with a lower melting point. The molten NaVO3 spreads on the surface of the ceramic layer and penetrates into its interior through microcracks and pores, preferentially reacting with the stabilizer (Y2O3) in the ZrO2 solid solution to form corresponding vanadate products. This reaction causes the consumption of the stabilizer, leading to the phase transformation of the ZrO2 solid solution from t′-ZrO2 phase to m-ZrO2 phase. The phase transformation from t′-ZrO2 phase to m-ZrO2 phase is accompanied by a volume expansion rate of 3%–5%. At the same time, the decrease in the content of t′-ZrO2 phase leads to the degradation of the mechanical properties of the coating. Under the combined action of the phase transformation stress caused by hot corrosion and the thermal stress during the thermal cycling process, cracks are easily initiated and propagated inside the coating, eventually leading to coating spallation. In addition, when the YSZ coating reacts with the molten salt, rod-like YVO4 crystals are generated, which grow outward to the surface, generating additional stress inside the coating. The above processes lead to the failure of the coating. In conclusion, the reaction process between the YSZ coating and the Na2SO4 + V2O5 mixed salt at 1000 °C is as follows:
At high temperatures, V2O5 and Na2SO4 react to form NaVO3 with a melting point of 610 °C [,], as shown in Equation (2) below.
Na2SO4 + V2O5→2NaVO3 + SO3
The molten NaVO3 penetrates into the interior of the YSZ coating through the cracks and gaps on the surface, and reacts with the stabilizer Y2O3, destroying the stability of the t′-ZrO2 phase and inducing its phase transformation to m-ZrO2 [,], as shown in Equation (3).
ZrO2(t′) + Y2O3 + 2NaVO3→ZrO2(m) + 2YVO4 + Na2O
Then, the Na2O generated in this process directly reacts with V2O5 to form NaVO3, allowing the corrosion reaction to proceed continuously.
Na2O + V2O5→2NaVO3
The chemical reactions between the YSZ coating and NaVO3 all follow the Lewis acid–base reaction law [,]. In the YSZ coating, the cations in the stabilizer Y2O3 have a fully filled outer electron structure (Y3+:4s2p6) [], which can provide sufficient lone electron pairs as Lewis bases. These stabilizers have stronger basicity than ZrO2 and will preferentially react with NaVO3, which has Lewis acidity.
In conclusion, for the YSZ coating, the melting points of V2O5 and Na2SO4 are 690 °C and 884 °C, respectively. According to Reaction Equation (2), NaVO3 with a melting point of 610 °C will be generated. At 1000 °C, the mixed liquid molten salt mainly penetrates into the coating through cracks and pores. At the same time, the Y2O3 stabilizer precipitates and is consumed, which leads to the unfavorable phase transformation from t′-ZrO2 to m-ZrO2 as shown in Reaction Equation (3). Therefore, the defects in the YSZ coating are filled with corrosion products, and new microcracks are generated due to the volume change of the ZrO2 phase. The molten NaVO3 can penetrate through the newly generated cracks and react with the YSZ coating until the entire coating is damaged.
3.3. Corrosion Phenomenon and Corrosion Mechanism of RHZ/YSZ Coating
Figure 9 shows the macroscopic photographs of the RHZ/YSZ coating under different corrosion conditions at 1000 °C. The surface of the original RHZ/YSZ coating was pink. After hot corrosion, all coatings showed fragmented spallation, and part of the yellow corrosion layer spalled off, with more severe spallation at the edge of the corrosion area than in the middle. After 10 cycles of corrosion at a concentration of 5 mg/cm2, brown corrosion products were generated on the surface of the RHZ/YSZ coating, and spallation initially started from the center. With the extension of hot corrosion time, after 50 h of hot corrosion, no obvious corrosion products were observed on the surface of the RHZ/YSZ coating, and it basically showed the color of the original coating. After 10 cycles of corrosion at a concentration of 10 mg/cm2, spallation also occurred on the coating surface, and no corrosion products were observed. The above results initially indicate that hot corrosion accelerates the spallation of the top RHZ coating in the RHZ/YSZ coating. As the concentration of the corrosion salt increases and the number of corrosion cycles increases, the spallation is further aggravated.
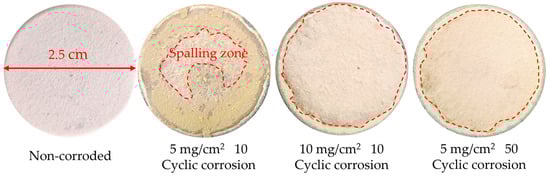
Figure 9.
Macroscopic photographs of RHZ/YSZ coating before and after hot corrosion.
As shown in Figure 10, the surface of the RHZ/YSZ coating was uneven after corrosion, with cracks and faults all over the surface, but there were differences in the spallation under different concentrations and different numbers of corrosion cycles. As shown in Figure 10a, after 10 cycles of corrosion at 5 mg/cm2, a large number of corrosion products existed on the surface of the RHZ/YSZ coating, and a large area of coating spallation was observed. As shown in Figure 10b, after 10 cycles of corrosion at 10 mg/cm2, the coating spalled down to the YSZ coating. As shown in Figure 10c, after 50 cycles of corrosion at 5 mg/cm2, a large number of cracks existed in the coating, and granular corrosion products were present at the pores and gaps of the coating after spallation. By comparing Figure 10a,b, it can be seen that under the same corrosion time, the coating spallation was more severe under the high-concentration condition. By comparing Figure 10a,c, it can be seen that under the same concentration, the coating spallation became more severe as the number of corrosion cycles increased.
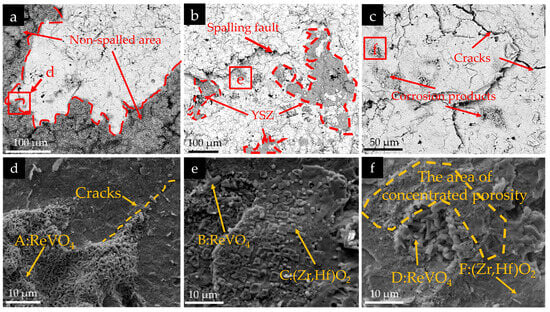
Figure 10.
Surface morphologies of RHZ coating: (a,d) 5 mg/cm2, 10 cycles; (b,e) 10 mg/cm2, 10 cycles; (c,f) 5 mg/cm2, 50 cycles.
The EDS analysis results of the corrosion products at different marked positions in Figure 10 are listed in Table 4. Combined with the XRD analysis in Figure 11 and the EDS results in Table 4, the types of corrosion products can be determined. It can be seen from Figure 10d–f that the rod-like corrosion products in regions A, B, and D on the surface of the corroded RHZ coating are mainly composed of rare-earth elements Re (Sm, Gd, Dy, Er, Yb), V, O, and a small amount of Zr and Hf elements. Meanwhile, compounds mainly composed of Hf, Zr, and O elements can be observed in regions C and E on the surface of the RHZ coating. In conclusion, the rod-like corrosion products on the surface of the RHZ/YSZ coating are mainly ReVO4, and the granular products are mainly (Zr, Hf)O2. Since most of the coatings showed severe spallation at the end of the cyclic experiment, except for the corrosion products detected by the XRD results under the condition of 5 mg/cm2 corrosion for 10 cycles, the XRD patterns under the other two conditions were similar to those of the uncorroded RHZ/YSZ coating. This is because the coating gradually spalled off, exposing the new uncorroded underlying coating. However, after the corrosion test, the intensity of the defective fluorite phase decreased. Under the condition of 5 mg/cm2 corrosion for 10 cycles, the peaks of tetragonal rare-earth vanadates (ReVO4), m-ZrO2, and t′-ZrO2 were detected as corrosion products. The rare-earth elements in the RHZ/YSZ double coating exhibited similar corrosion behavior to Y in the YSZ layer.
Table 4.
EDS Results of Different Marked Positions in Figure 10.

Figure 11.
XRD patterns of RHZ coating after corrosion: (a) total pattern; (b) enlarged view.
As shown in Figure 12 below, the RHZ/YSZ coating showed different spallation under different corrosion conditions. By comparing Figure 3d with Figure 12, it can be seen that compared with the newly sprayed state, the porosity of the YSZ coating decreased after thermal cycling corrosion. After 10 cycles of corrosion at 5 mg/cm2, the upper RHZ coating showed slight spallation, and its thickness changed little. After 10 cycles of corrosion at 10 mg/cm2 and 50 cycles of corrosion at 5 mg/cm2, the outer RHZ ceramic layer gradually spalled off, and there was no obvious corrosion layer on the surface of the coating after spallation. The thickness of RHZ and the Corrosion were measured using the image processing software Image J. For each coating in Figure 12, measurements were taken at three different positions, and the average values were recorded. After 10 cycles of corrosion at 10 mg/cm2, the coating spalled to approximately 11.6% of its original thickness. After 50 cycles of corrosion at 5 mg/cm2, the coating spalled to approximately 23.6% of its original thickness. The above results once again indicate that the salt concentration has a more significant impact on the corrosion results than the number of cycles.
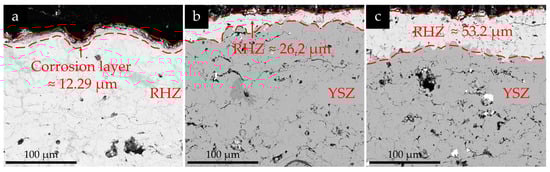
Figure 12.
Cross-sections of RHZ coating after spallation: (a) 5 mg/cm2, 10 cycles; (b) 10 mg/cm2, 10 cycles; (c) 5 mg/cm2, 50 cycles.
Figure 13a,b depict the corrosion cross-sections and vanadium distribution in non-porous regions of the surface RHZ coating after 10 cycles under 5 mg/cm2 corrosion conditions. Figure 13c,d illustrate the corrosion cross-sections and vanadium element distribution in pore regions of the surface RHZ coating under the same corrosion conditions after 10 cycles. Figure 13e,f demonstrate the cross-sections and vanadium element distribution in peeling-off regions of the RHZ coating under identical corrosion conditions after 50 cycles. It can be seen that after 5 cycles of corrosion at 5 mg/cm2, the coating only showed slight spallation, and a large amount of V element was distributed on the surface of the ceramic layer of RHZ and in the internal gaps. By comparing Figure 13a with Figure 8a, it can be seen that compared with the YSZ coating, the corrosion layer formed on the surface of the RHZ coating is more obvious, which indicates that the RHZ coating is more reactive with the mixed molten salt. As shown in Figure 13c,d, the area of the corrosion region around the pore area is larger, and the enrichment of V element is characterized at the pores and cracks, which indicates that the molten salt penetrates into the entire ceramic layer through the pores and cracks at 1000 °C, and rare-earth elements are concentrated in the region where V element is accumulated. However, as can be seen from Figure 13e, there is no obvious corrosion layer on the spalled surface, which proves that the coating fracture surface here is caused by brittle fracture induced by crack extension. It can be seen from the EDS results in Table 5 that rare-earth elements such as Sm, Gd, Dy, Er, and Yb are concentrated in the region where V element is accumulated. The corrosion products are mainly ReVO4, and some white phase of (Zr, Hf)O2 is precipitated around the corrosion region, which is consistent with the XRD results in Figure 11. The distribution of V in Figure 13f is weaker than that in Figure 13b,d, demonstrating that the coating in the peeling-off zone not only participates in the corrosion reaction but also carries away a significant amount of incompletely penetrated corrosion agents during the rapid peeling process.
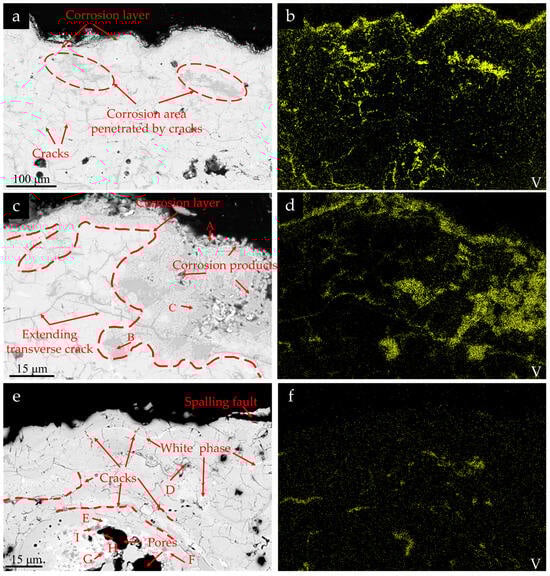
Figure 13.
Cross-sectional morphologies and element distributions of RHZ coating after corrosion: (a–d) 5 mg/cm2, 10 cycles; (e,f) 5 mg/cm2, 50 cycles.
Table 5.
EDS Results of Different Marked Positions in Figure 13.
Figure 14 illustrates the V element distribution at the RHZ/YSZ interface under different corrosion conditions. It can be observed that the RHZ layer partially inhibits the further penetration of corrosion salts. In addition to being present in the cracks and pores of the RHZ layer, the corrosion salts are also widely concentrated at the interface between YSZ and RHZ. The thickness of these V-enriched regions was measured using the image processing software Image J. For each coating in Figure 14, measurements were taken at three different positions, and the average values were recorded. It can be observed that as the corrosion time and corrosive salt concentration increase, the thickness of the V-enriched region formed at the interface also increases continuously. The specific thicknesses are as follows: 0.42 μm (5 mg/cm2, 10 cycles), 1.58 μm (10 mg/cm2, 10 cycles), and 1.04 μm (5 mg/cm2, 50 cycles). This could be attributed to the discontinuities such as cracks and pores at the interface on one hand, and the high reactivity between RHZ and corrosion salts delaying the infiltration of molten salts into the YSZ coating on the other hand.
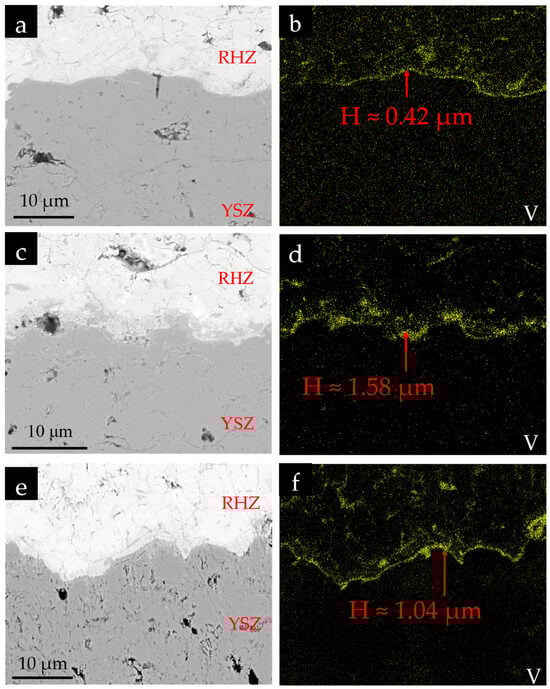
Figure 14.
V element distribution at the RHZ-YSZ interface: (a,b) 5 mg/cm2, 10 cycles; (c,d) 10 mg/cm2, 10 cycles; (e,f) 5mg/cm2, 50 cycles.
(Sm0.2Gd0.2Dy0.2Er0.2Yb0.2)2(Zr0.7Hf0.3)2O7 can be regarded as a compound formed by introducing Re2O3 (Sm2O3, Dy2O3, Yb2O3, Gd2O3, Er2O3) into the (Zr0.7Hf0.3)O2 oxide. The mixed salt reacts at high temperatures of 1000 °C as shown in Equation (2) to form NaVO3. The corrosion mechanism between the RHZ/YSZ coating and the mixed salt can be explained based on the Lewis acid–base theory and the optical basicity (OB) theory: acidic compounds containing vanadium are prone to react with compounds with high basicity, that is, the Lewis acid NaVO3 will preferentially react with Lewis bases with stronger basicity. The concept of optical basicity [] was first proposed by Duffy et al. This theory holds that acid–base reactions cause acids to gain electrons from bases to form coordinate bonds. Optical basicity is used to represent the degree to which oxygen ions in the coordination bonds of metal oxides provide electrons. Cations with high polarizability attract electrons away from oxygen, resulting in weaker basicity of such oxides (low optical basicity); while oxides with cations of low polarizability have high optical basicity []. The OB values of some oxides are listed in the table below. The optical basicity of each oxide composing the rare-earth zirconate ceramic is shown in Table 6. The basicity order of the above oxides is: Sm2O3 > Gd2O3 > Dy2O3 > Er2O3 > Yb2O3 > ZrO2 > HfO2. Therefore, according to the Lewis acid–base theory, the acidic NaVO3 will preferentially react with rare-earth oxides to form rare-earth vanadates.
Table 6.
Optical Basicity Values of Oxides [,].
The corrosion process of the RHZ/YSZ coating in the high-temperature environment of 1000 °C is as follows. At high temperatures, V2O5 and Na2SO4 react to form NaVO3 with a melting point of 610 °C [,], as shown in Equation (2). Then, the molten NaVO3 penetrates into the interior of the RHZ coating through the cracks and gaps on the surface and reacts with RHZ, while precipitating the t′-(Zr, Hf)O2 phase, which is induced to transform into the m-(Zr, Hf)O2 phase with thermal cycling, as shown in Equation (5).
Re2(Zr,Hf)2O7 + 2NaVO3→2(Zr,Hf)O2(t′,m) + 2ReVO4 + Na2O
During the above reaction process, the cracks generated due to volume changes caused by phase transformation and crystal growth will quickly propagate to the surface layer, and these cracks will accelerate the further intrusion of molten salt. The rapid spallation of the top layer coating may also lead to the removal of some molten salts during the infiltration process. As shown in Figure 14, the surface RHZ layer in RHZ/YSZ coatings to some extent inhibits the penetration of corrosive molten salts into the underlying YSZ layer, which contributes to maintaining the stability of the YSZ layer. Relevant studies have shown that high-entropy rare-earth zirconates have low damage tolerance and fracture toughness []. Therefore, it is hypothesized that the rapid spallation phenomenon of RHZ coatings may be related to their relatively low fracture toughness, but this assumption requires verification through future mechanical property tests specifically targeting RHZ coatings.
4. Conclusions
In this study, single-ceramic YSZ and double-ceramic (RHZ/YSZ) thermal barrier coatings were prepared via atmospheric plasma spraying. Molten salt corrosion tests with 50% wt Na2SO4 + 50% wt V2O5 were carried out at 1000 °C. Combined with phase structure and microstructural analysis, the molten salt corrosion behavior and failure mechanism of the YSZ coating and RHZ/YSZ coating at 1000 °C were discussed. The main conclusions are as follows:
At 1000 °C, the corrosion products of the YSZ coating are mainly m-ZrO2 and YVO4, with the intermediate product NaVO3 existing simultaneously. The corrosion products of the RHZ coating are tetragonal rare-earth vanadates (ReVO4), m-ZrO2, and t′-ZrO2. The corrosion degree is positively correlated with the salt concentration and the number of corrosion cycles, with the former exerting a more pronounced influence.
At 1000 °C, the failure process of both the YSZ and RHZ/YSZ coatings in the molten salt corrosion of 50% wt Na2SO4 + 50% wt V2O5 can be divided into three stages: ① Molten salt reaction and penetration stage: NaVO3 is generated through the reaction, and the molten NaVO3 spreads on the surface of the ceramic layer and penetrates into its interior through microcracks and pores; ② Thermochemical reaction stage: For the YSZ coating, the Y2O3 stabilizer precipitates and is consumed by reacting with NaVO3, leading to the unfavorable phase transformation from t′-ZrO2 to m-ZrO2; For the RHZ coating, the molten NaVO3 reacts with rare-earth elements according to the Lewis acid–base rule, while precipitating the t′-(Zr, Hf)O2 phase, which is induced to transform into the m-(Zr, Hf)O2 phase with thermal cycling; ③ Crack propagation and coating spallation stage: Under the combined action of the phase transformation stress caused by hot corrosion, the additional stress generated by the growth of corrosion crystals to the outer surface, and the thermal stress during the thermal cycling process, cracks are initiated inside the coating, eventually leading to coating spallation.
Overall, after molten salt corrosion at 1000 °C, the YSZ coating undergoes significant crack propagation and spallation. The RHZ coating generates a large number of microcracks, which propagate and lead to fragmented spallation. Compared to a single-layer ceramic YSZ coating, the dual-layer ceramic RHZ/YSZ coating indeed partially hinders the penetration of corrosive molten salts into the underlying YSZ layer due to the presence of the surface RHZ layer. The rapid delamination of the RHZ layer may be related not only to its higher reactivity with corrosive salts but also to its relatively lower fracture toughness, but this hypothesis still needs to be confirmed through future mechanical performance tests of the coating. Furthermore, the rapid spalling of RHZ coatings highlights the necessity of significantly improving the mechanical properties. Improvements can be achieved by introducing new substances for reinforcement, adjusting the elemental doping ratio to optimize the lattice structure, and optimizing the spraying parameters to reduce defects [,].
Finally, this study only investigated the corrosion resistance under a single high-entropy ceramic composition, a single temperature, and a single salt composition ratio. Future research should further expand the salt composition ratios, temperature ranges, and compositional designs to comprehensively reveal the corrosion mechanisms of the high-entropy rare-earth zirconate double-layer coatings.
Author Contributions
Conceptualization, C.W. (Chunman Wang) and H.M.; methodology, Y.S. and X.H.; investigation, J.S., H.Y. and G.L.; resources, H.Y. and C.W. (Chunlei Wan); data curation, H.W. and G.Z.; writing—original draft preparation, C.W. (Chunman Wang); writing—review and editing, C.W. (Chunman Wang) and X.H.; supervision, S.G. and C.W. (Chunlei Wan); project administration, Y.S. and K.C.; funding acquisition, K.C. All authors have read and agreed to the published version of the manuscript.
Funding
This research was funded by the Zhejiang Provincial Natural Science Foundation of China (LZ23E020005) and the Key R&D Program of Zhejiang (2024SSYS0075).
Institutional Review Board Statement
Not applicable.
Informed Consent Statement
Not applicable.
Data Availability Statement
Data are contained within the article.
Conflicts of Interest
Author Haiyuan Yu was employed by Material Research Institute, Beijing Beiye Functional Materials Co., Ltd. Authors Jian Sun, Guanghua Liu and Guijuan Zhou were employed by China United Heavy-Duty Gas Turbine Technology Co., Ltd. The remaining authors declare that the research was conducted in the absence of any commercial or financial relationships that could be construed as a potential conflict of interest.
References
- Padture, N.P.; Gell, M.; Jordan, E.H. Thermal barrier coatings for gas-turbine engine applications. Science 2002, 296, 280–284. [Google Scholar] [CrossRef]
- Guo, H.B.; Murakami, H.Y.; Kuroda, S.J. Thermal cycling behavior of plasma sprayed segmented thermal barrier coatings. Mater. Trans. 2006, 47, 306–309. [Google Scholar] [CrossRef]
- Feuerstein, A.; Knapp, J.; Taylor, T.; Ashary, A.; Bolcavage, A.; Hitchman, N. Technical and economical aspects of current thermal barrier coating systems for gas turbine engines by thermal spray and EBPVD: A review. J. Therm. Spray Technol. 2008, 17, 199–213. [Google Scholar] [CrossRef]
- Cipitria, A.; Golosnoy, I.O.; Clyne, T.W. A sintering model for plasma-sprayed zirconia TBCs. Part I: Free-standing coatings. Acta Mater. 2009, 57, 980–992. [Google Scholar] [CrossRef]
- Kosieniak, E.; Biesiada, K.; Kaczorowski, J.; Innocenti, M. Corrosion failures in gas turbine hot components. J. Fail. Anal. Prev. 2012, 12, 330–337. [Google Scholar] [CrossRef]
- Ziegler, D.; Puccinelli, M.; Bergallo, B.; Picasso, A. Investigation of turbine blade failure in a thermal power plant. Case Stud. Eng. Fail. Anal. 2013, 1, 192–199. [Google Scholar] [CrossRef]
- Bhagi, L.K.; Gupta, P.; Rastogi, V. Fractographic investigations of the failure of L-1 low pressure steam turbine blade. Case Stud. Eng. Fail. Anal. 2013, 1, 72–78. [Google Scholar] [CrossRef]
- Kumari, S.; Satyanarayana, D.V.V.; Srinivas, M. Failure analysis of gas turbine rotor blades. Eng. Fail. Anal. 2014, 45, 234–244. [Google Scholar] [CrossRef]
- Hu, X.X.; Chen, Y.G.; He, J. YPO4: A promising environmental barrier coating candidate against corrosion of molten CMAS. J. Eur. Ceram. Soc. 2025, 45, 117359. [Google Scholar] [CrossRef]
- Hu, X.X.; Chen, Y.G.; Guo, H.B.; Xu, H.B. Corrosion Behaviors and Failure Mechanism of Plasma Sprayed Yb2Si2O7/Si Environmental Barrier Coatings Exposed to CMAS+ NaVO3. J. Eur. Ceram. Soc. 2025, 45, 117005. [Google Scholar] [CrossRef]
- Xiang, Y.; Yan, K.; Yu, H.Y.; Guo, Y.W.; Ying, Y.X.; Li, Z.R.; Sun, J.; Fang, C.G. Comparative Investigation on the Hot Corrosion Failure of YSZ and GdYb-YSZ Double-Ceramic-Layer Thermal Barrier Coatings under Na2SO4+V2O5 Molten Salts. Ceram. Int. 2023, 49, 18678–18688. [Google Scholar] [CrossRef]
- Yin, Q.H.; Sun, Z.P.; Wang, J.J.; Lu, Y.H.; Xiao, P.; Li, Y. Research status of RE hafnates for thermal/environmental barrier coatings. Ceram. Int. 2025, 51, 22987–23002. [Google Scholar] [CrossRef]
- Yan, K.; Xiang, Y.; Yu, H.Y.; Guo, Y.W.; Sun, J.; Wan, C.L.; Liu, G.H.; Li, Z.R.; Li, Z.Q.; Wu, Y.J.; et al. Hot Corrosion Mechanism and Thermal Cycling Performance of Air-Plasma-Sprayed LaYbZr2O7 Thermal Barrier Coatings in the Vanadate-Containing Molten Salts. Surf. Coat. Technol. 2023, 472, 129925. [Google Scholar] [CrossRef]
- Wei, Z.Y.; Meng, G.H.; Chen, L. Progress in ceramic materials and structure design toward advanced thermal barrier coatings. J. Adv. Ceram. 2022, 11, 985–1068. [Google Scholar] [CrossRef]
- Zhang, C.L.; Fei, J.M.; Guo, L.; Yu, J.X.; Zhang, B.B.; Yan, Z.; Ye, F.X. Thermal cycling and hot corrosion behavior of a novel LaPO4/YSZ double-ceramic-layer thermal barrier coating. Ceram. Int. 2018, 44, 8818–8826. [Google Scholar] [CrossRef]
- Meng, F.W.; Ye, F.X.; Luo, T.Y. The High-Temperature CMAS Corrosion Behavior of High-Entropy (La0.2Nd0.2Sm0.2Eu0.2Gd0.2)2Hf2O7 Hafnate Thermal Barrier Coating Material with Fluorite Structure. J. Eur. Ceram. Soc. 2024, 44, 2460–2470. [Google Scholar] [CrossRef]
- Han, Y.; Liu, X.Y.; Zhang, Q.Q.; Huang, M.Z.; Li, Y.; Pan, W.; Zong, P.A.; Li, L.Y.; Yang, Z.S.; Feng, Y.J.; et al. Ultra-dense dislocations stabilized in high entropy oxide ceramics. Nat. Commun. 2022, 13, 2871. [Google Scholar] [CrossRef] [PubMed]
- Wang, Y.F.; Yang, F.; Xiao, P. Role and determining factor of substitutional defects on thermal conductivity: A study of La2(Zr1−xBx)2O7 (B = Hf, Ce, 0 ≤ x ≤ 0.5) pyrochlore solid solutions. Acta. Mater. 2014, 68, 106–115. [Google Scholar] [CrossRef]
- Zou, Z.H.; Jia, L.B.; Yang, L.X.; Shan, X.; Luo, L.R.; Guo, F.W.; Zhao, X.F.; Xiao, P. Role of internal oxidation on the failure of air plasma sprayed thermal barrier coatings with a double-layered bond coat. Surf. Coat. Technol. 2017, 319, 370–377. [Google Scholar] [CrossRef]
- Zhou, X.; Song, W.J.; Yuan, J.Y.; Gong, Q.M.; Zhang, H.; Cao, X.Q.; Dingwell, D.B. Thermophysical properties and cyclic lifetime of plasma sprayed SrAl12O19 for thermal barrier coating applications. J. Am. Ceram. Soc. 2020, 103, 5599–5611. [Google Scholar] [CrossRef]
- Liu, Q.; Hu, X.P.; Zhu, W.; Hu, X.P.; Zhu, W.; Liu, G.L.; Guo, J.W.; Bin, J. Thermal shock performance and failure behavior of Zr6Ta2O17-8YSZ double-ceramic-layer thermal barrier coatings prepared by atmospheric plasma spraying. Ceram. Int. 2022, 48, 24402–24410. [Google Scholar] [CrossRef]
- Doleker, K.M.; Ozgurluk, Y.; Karaoglanli, A.C. Isothermal oxidation and thermal cyclic behaviors of YSZ and double-layered YSZ/La2Zr2O7 thermal barrier coatings (TBCs). Surf. Coat. Technol. 2018, 351, 78–88. [Google Scholar] [CrossRef]
- Subramanian, M.A.; Aravamùdan, G.; Rao, G. Oxide pyrochlores—A review. Prog. Solid State Chem. 1983, 15, 55–143. [Google Scholar] [CrossRef]
- Shannon, R.D. Revised effective ionic radii and systematic studies of interatomic distances in halides and chalcogenides. Acta Crystallogr. 1976, A32, 751–767. [Google Scholar] [CrossRef]
- Fan, Z.J.; Wang, K.; Dong, X.; Wang, R.J.; Duan, W.Q.; Mei, X.S.; Wang, W.J.; Cui, J.L.; Zhang, S.; Xu, C.Y. The role of the surface morphology and segmented cracks on the damage forms of laser re-melted thermal barrier coatings in presence of a molten salt (Na2SO4+V2O5). Corros. Sci. 2017, 115, 56–67. [Google Scholar] [CrossRef]
- Wu, Y.; Bai, Z.M.; Zheng, L.; He, W.T.; Guo, H.B. Hot corrosion behavior of NdYbZr2O7 exposed to V2O5 and Na2SO4 + V2O5 molten salts. Ceram. Int. 2020, 46, 8543–8552. [Google Scholar] [CrossRef]
- Song, D.; Song, T.; Paik, U.; Lyub, G.L.; Jung, Y.G. Hot corrosion behavior in thermal barrier coatings with heterogeneous splat boundary. Corros. Sci. 2020, 163, 108225. [Google Scholar] [CrossRef]
- Jones, R.L. Some aspects of the hot corrosion of thermal barrier coatings. J. Therm. Spray Technol. 1997, 6, 77–84. [Google Scholar] [CrossRef]
- Guo, L.; Lim, Z.; Ye, F.X. Phase stability and thermal conductivity of RE2O3 (RE = La, Nd, Gd, Yb) and Yb2O3 co-doped Y2O3 stabilized ZrO2 ceramics. Ceram. Int. 2016, 42, 7360–7365. [Google Scholar] [CrossRef]
- Duffy, J.A.; Ingram, M.D. An interpretation of glass chemistry in terms of the optical basicity concept. J. Non-Cryst. Solids 1976, 21, 373–410. [Google Scholar] [CrossRef]
- Nanba, T.; Miura, Y.; Sakida, S. Consideration on the correlation between basicity of oxide glasses and O1s chemical shift in XPS. J. Ceram. Soc. Jpn. 2005, 113, 44–50. [Google Scholar] [CrossRef]
- Zhao, X.; Wang, X.; Lin, H.; Wang, Z.Q. Electronic polarizability and optical basicity of lanthanide oxides. Phys. B. 2007, 392, 132–136. [Google Scholar] [CrossRef]
- Krause, A.R.; Senturk, B.S.; Garces, H.F.; Dwivedi, G.; Ortiz, A.L.; Sampath, S.; Padture, N.P. 2ZrO2∙Y2O3 Thermal Barrier Coatings Resistant to Degradation by Molten CMAS: Part I. Optical Basicity Considerations and Processing. J. Am. Ceram. Soc. 2014, 97, 3943–3949. [Google Scholar] [CrossRef]
- Teng, Z.; Wang, P.; Zeng, S.F.; Feng, W.L.; Chen, C.; Jia, P.; Tan, Y.Q.; Peng, S.M. Reactive spark plasma sintering of high-entropy (La1/7Nd1/7Sm1/7Eu1/7Gd1/7Dy1/7Ho1/7)2Zr2O7 pyrochlore ceramic. Ceram. Int. 2024, 50, 6892–6897. [Google Scholar] [CrossRef]
- Feng, Y.J.; Liu, X.Y.; Han, Y.; Zhang, Z.J.; Wang, W.; Liu, G.H.; Sun, J.; Liu, W.; Pan, W.; Wan, C.L. Effect of configurational entropy on the mechanical and thermal properties of rare earth aluminates—Rare earth zirconates composite. J. Am. Ceram. Soc. 2025, 108, e20333. [Google Scholar] [CrossRef]
- Yin, Q.; Shen, K.H.; Wang, Y.; Xing, Y.Z. Research progress of rare earth zirconate thermal barrier coating ceramic materials. Mater. Today Commun. 2025, 42, 111579. [Google Scholar] [CrossRef]
Disclaimer/Publisher’s Note: The statements, opinions and data contained in all publications are solely those of the individual author(s) and contributor(s) and not of MDPI and/or the editor(s). MDPI and/or the editor(s) disclaim responsibility for any injury to people or property resulting from any ideas, methods, instructions or products referred to in the content. |
© 2025 by the authors. Licensee MDPI, Basel, Switzerland. This article is an open access article distributed under the terms and conditions of the Creative Commons Attribution (CC BY) license (https://creativecommons.org/licenses/by/4.0/).