HPLC with Fluorescence Detection for Determination of Bisphenol A in Canned Vegetables: Optimization, Validation and Application to Samples from Portuguese and Spanish Markets

 , ,
, ,  , and
, and 
Abstract
1. Introduction
2. Materials and Methods
2.1. Chemicals and Standard Solutions
2.2. Samples Preparation
2.3. HPLC-FLD
2.4. LC-MS/MS
2.5. Chromatographic Conditions
2.6. ATR-FTIR
2.7. Recovery
2.8. Precision
3. Results and Discussion
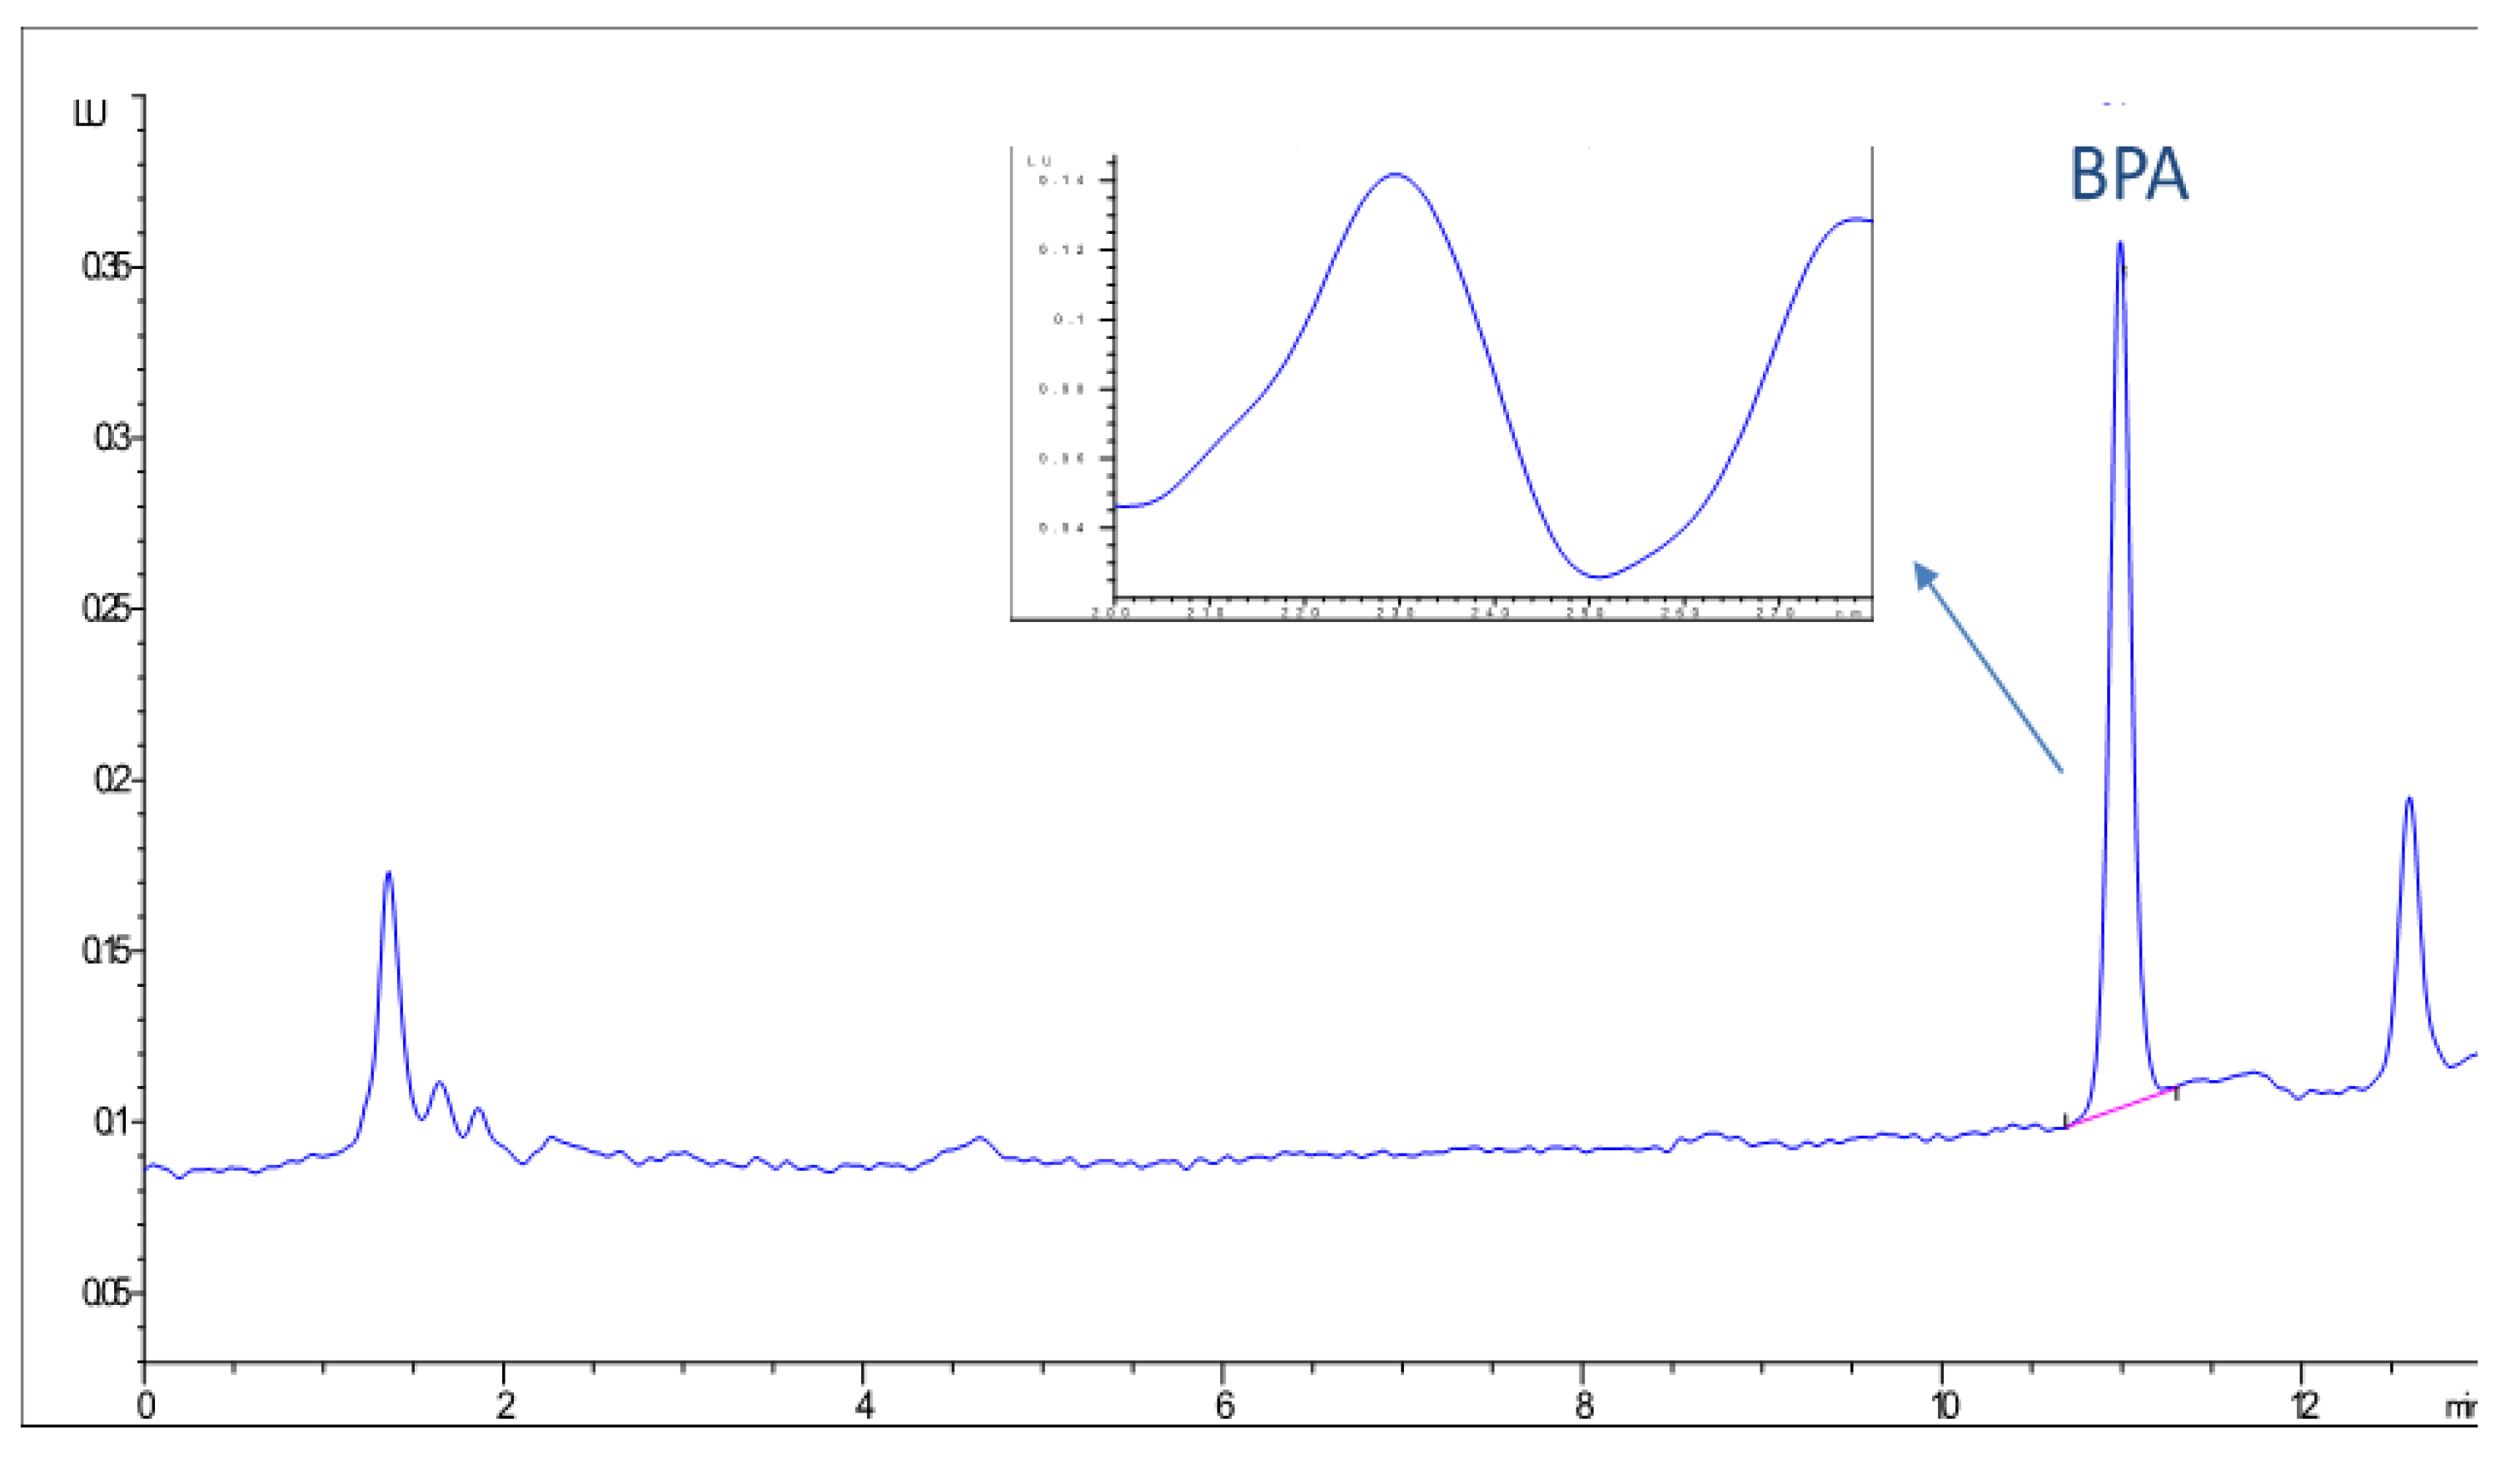
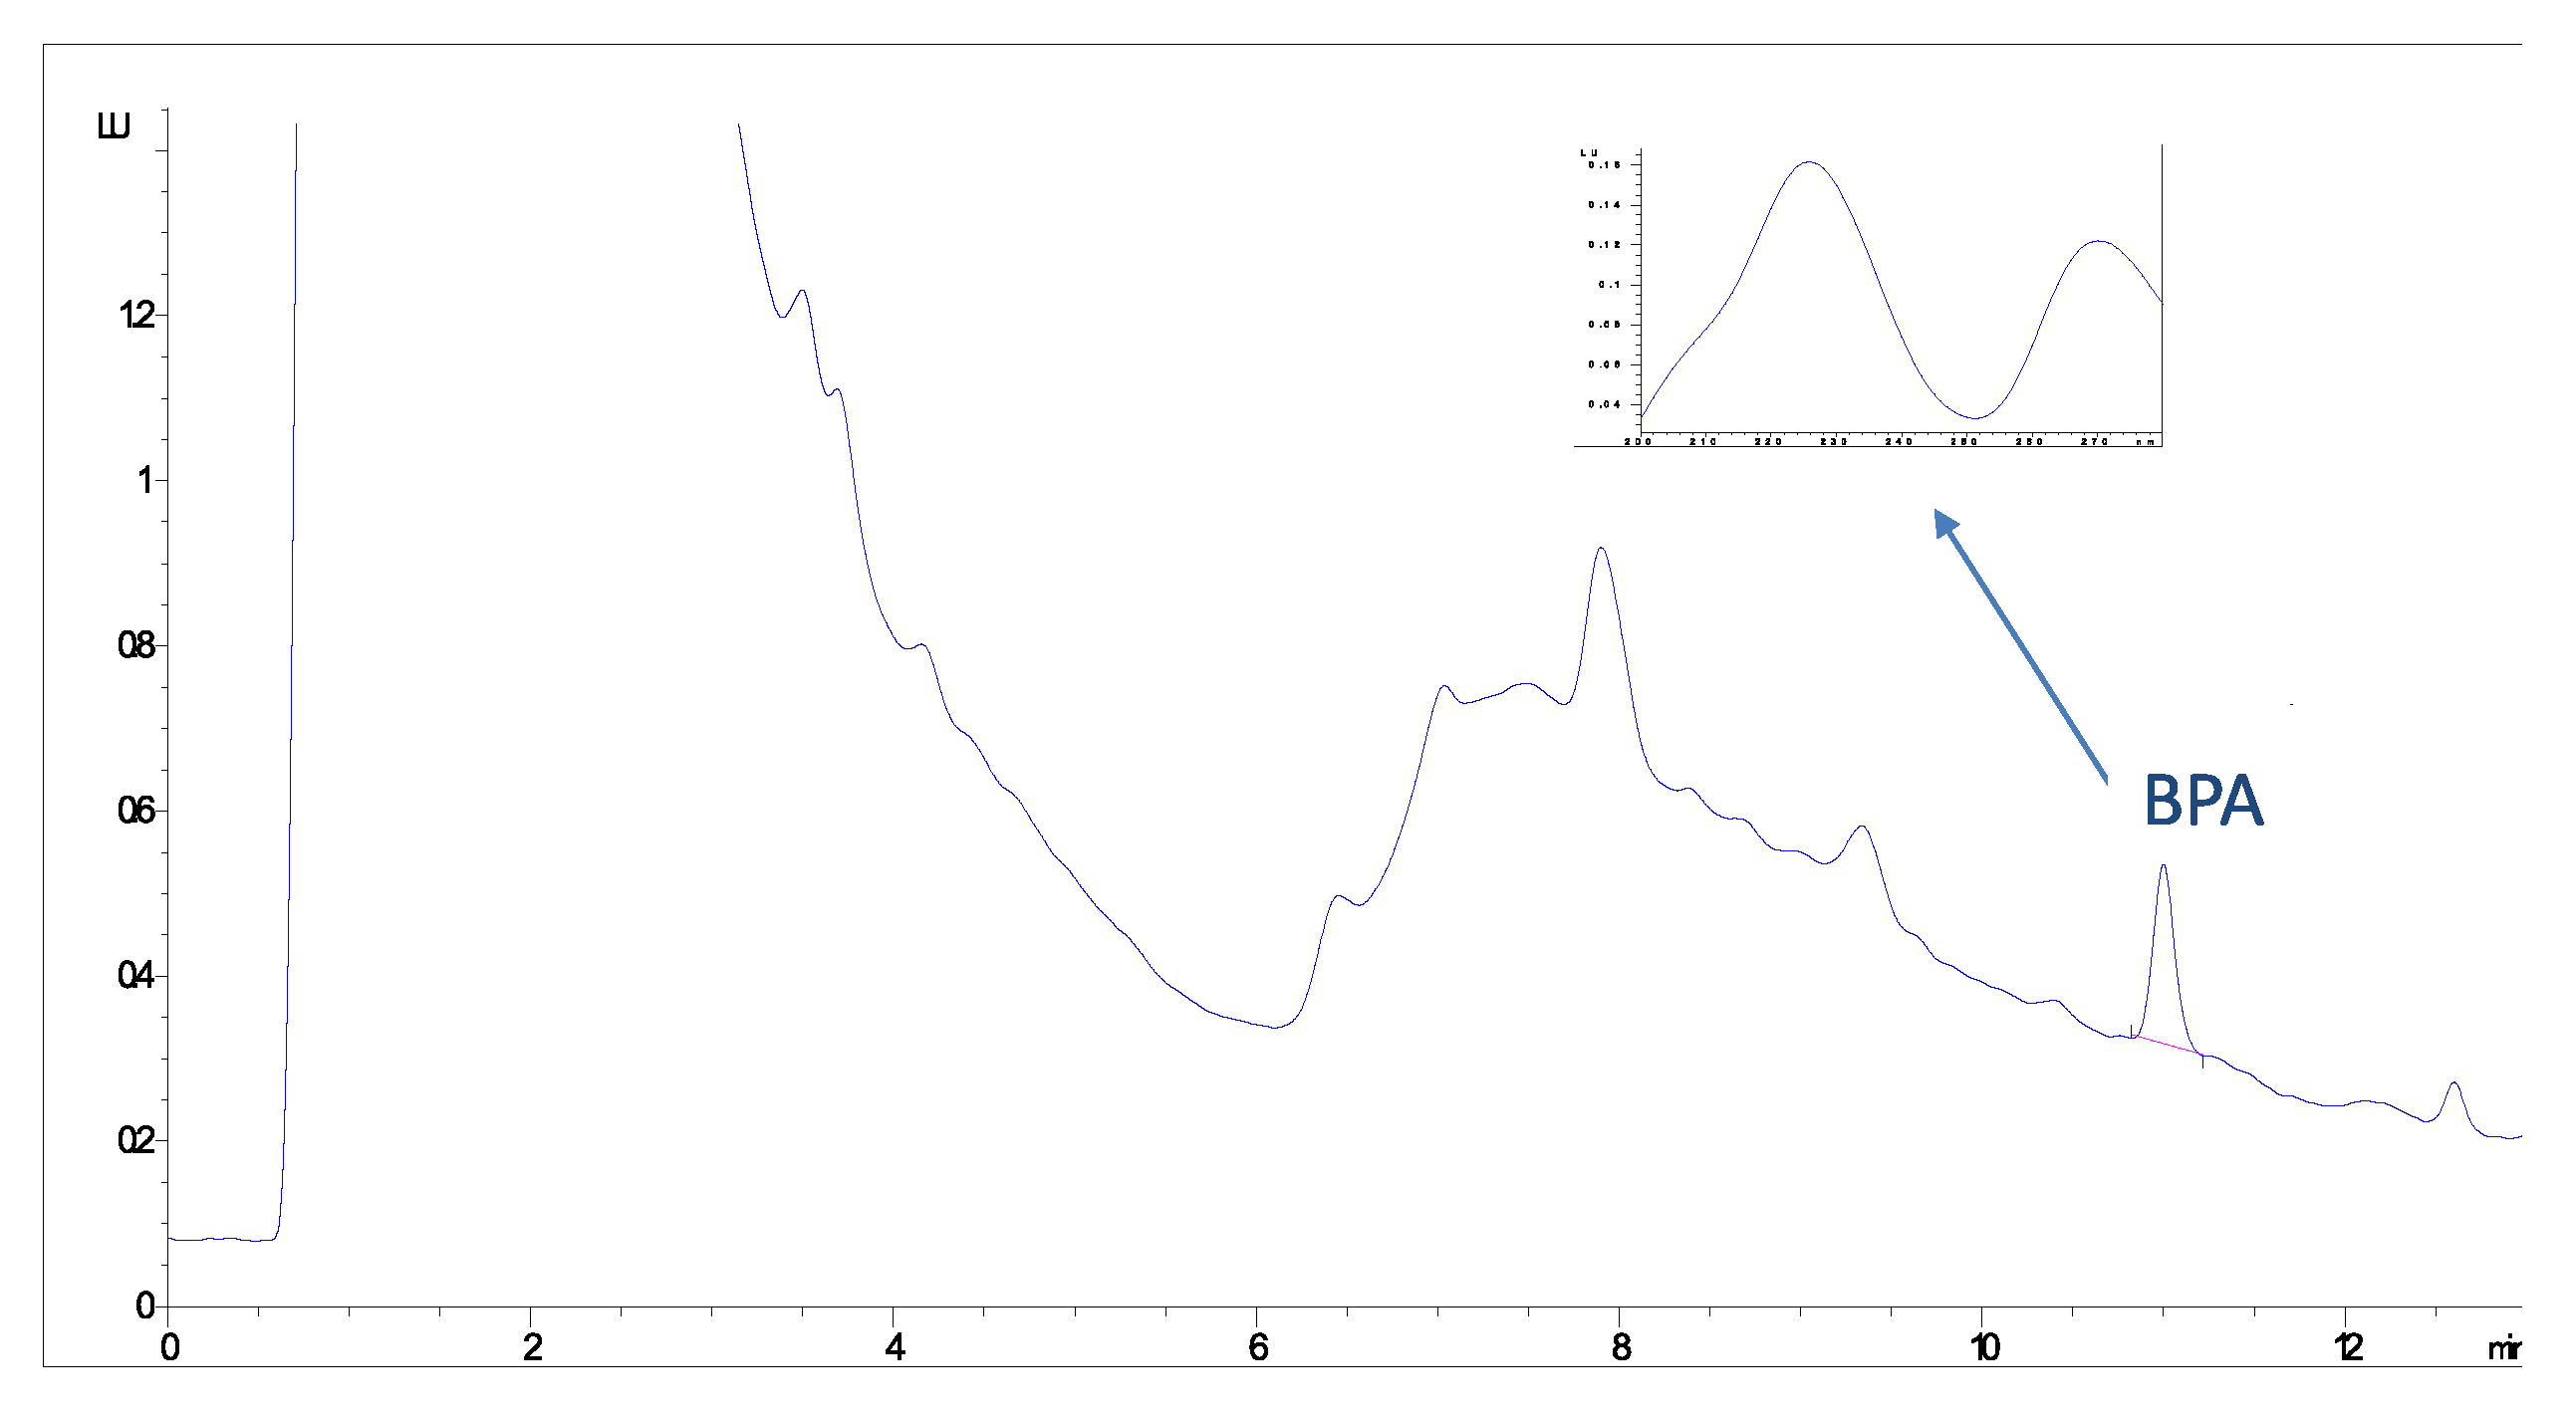
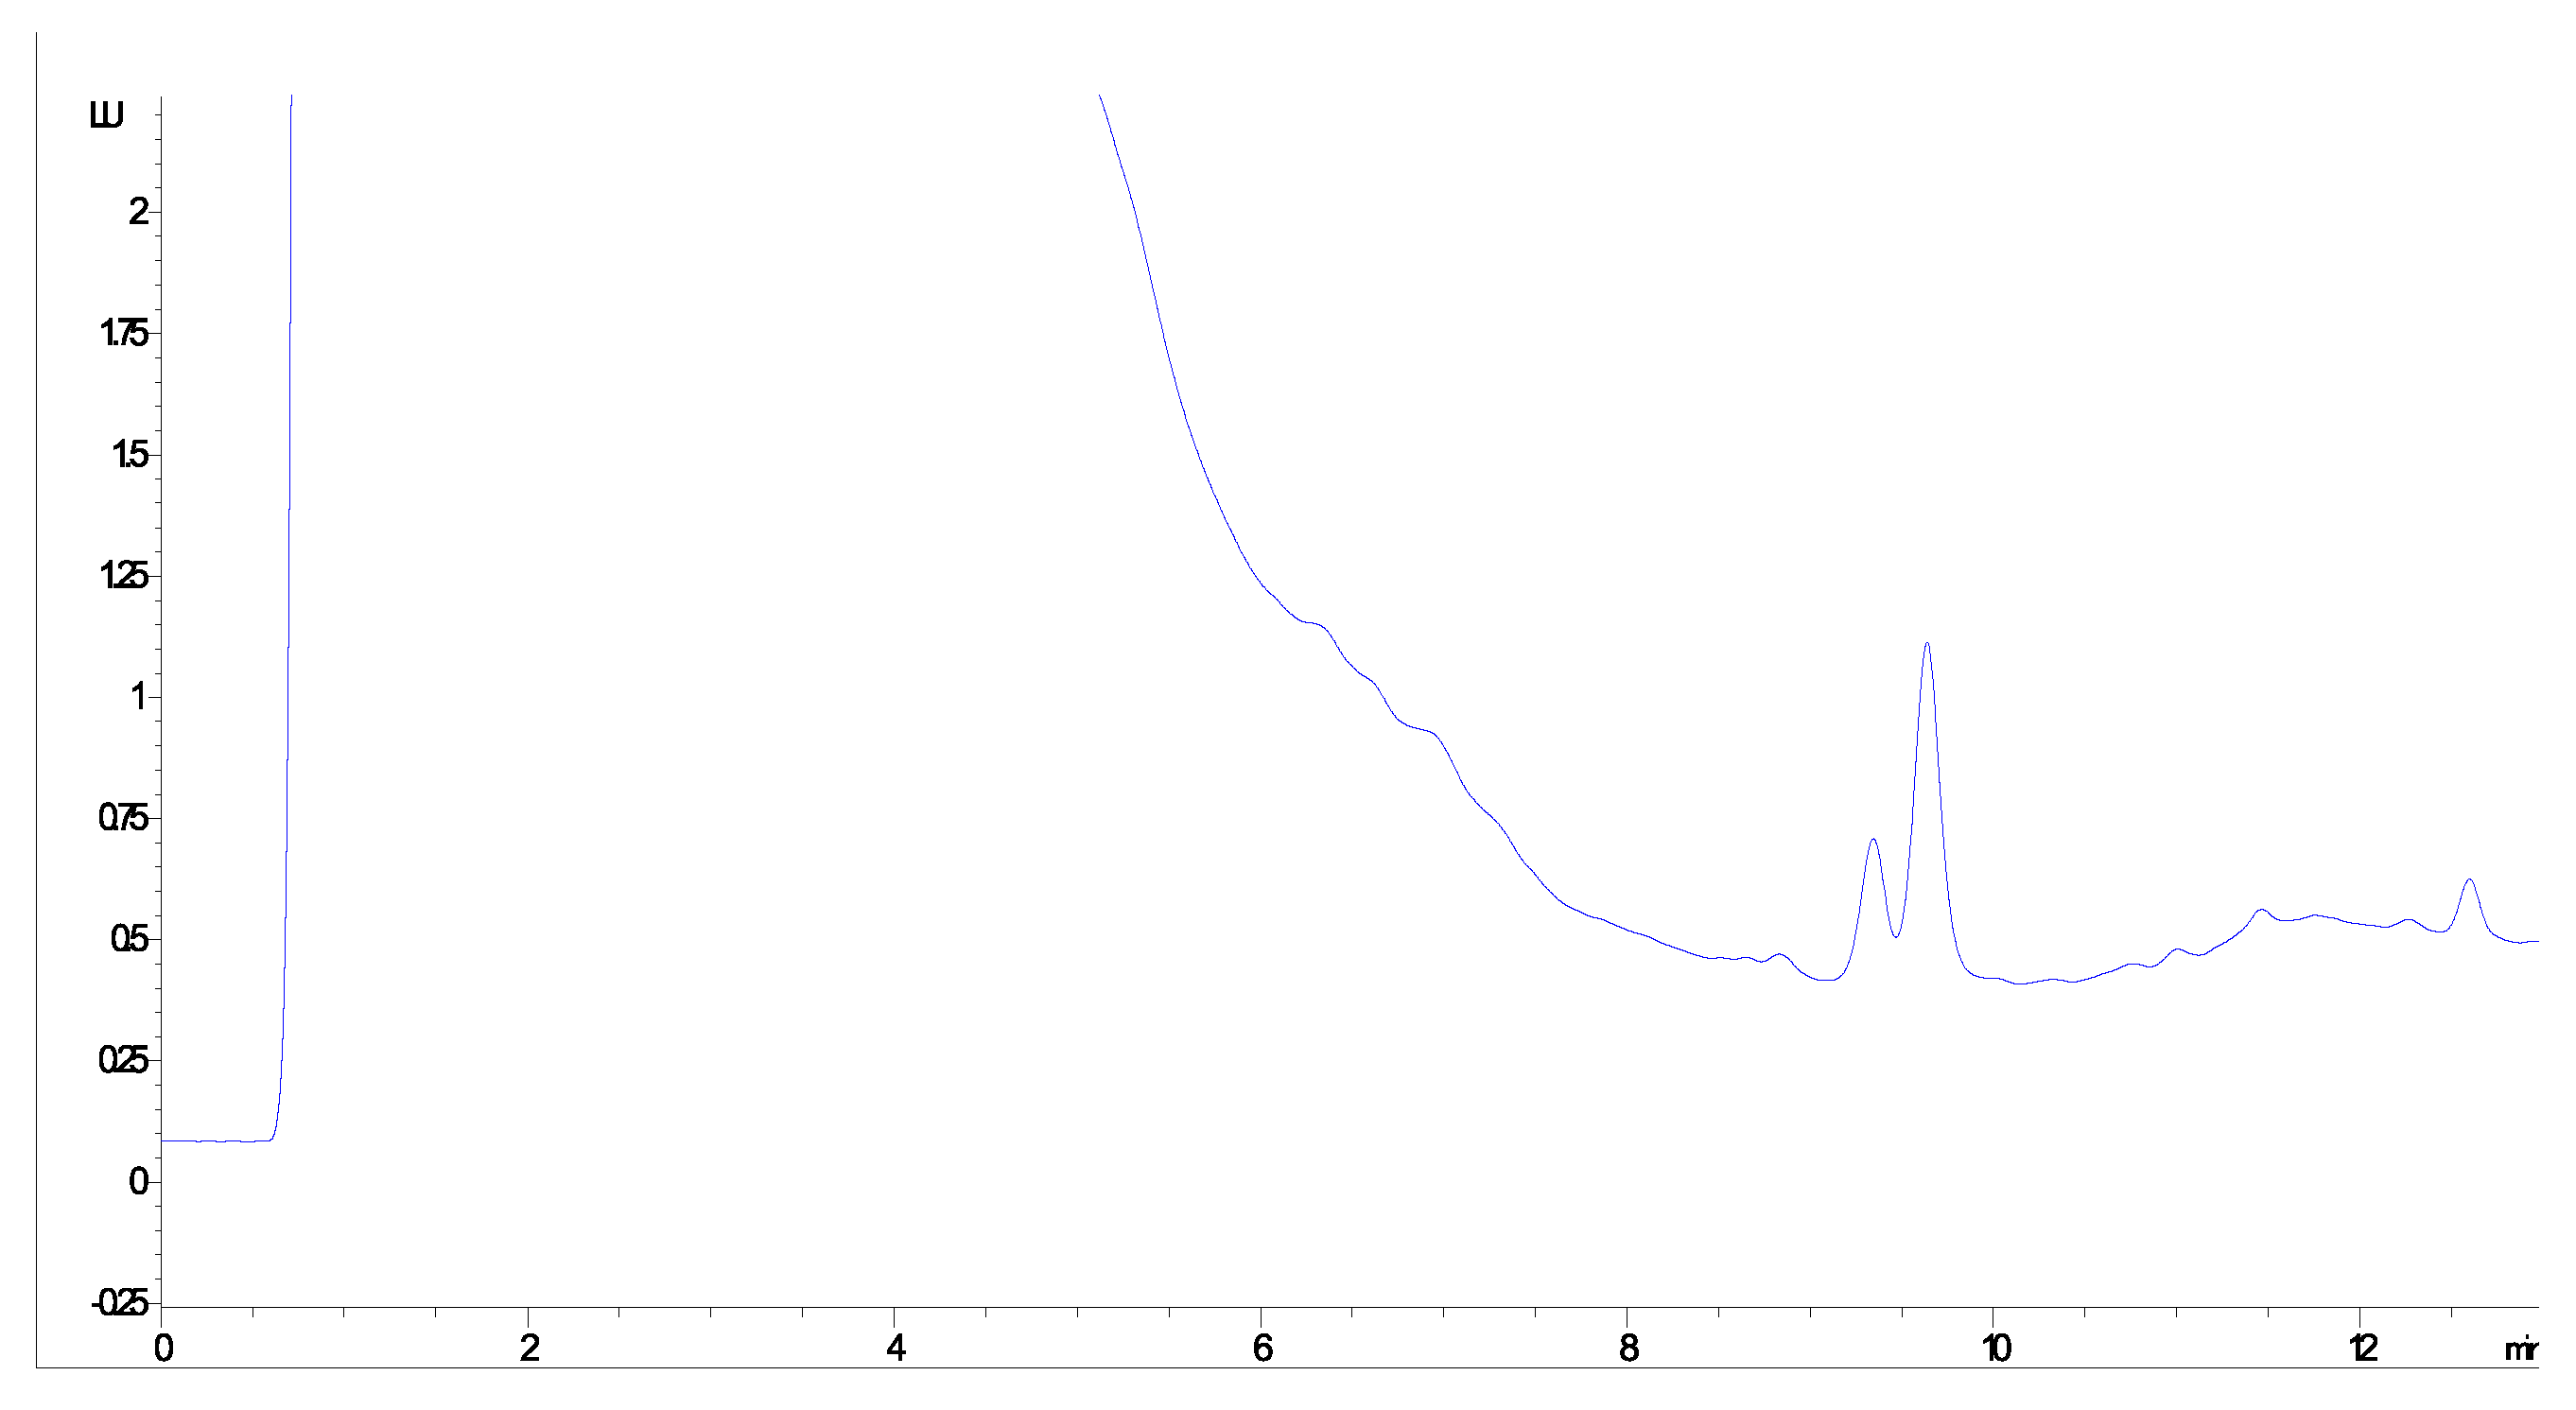
3.1. Method Validation
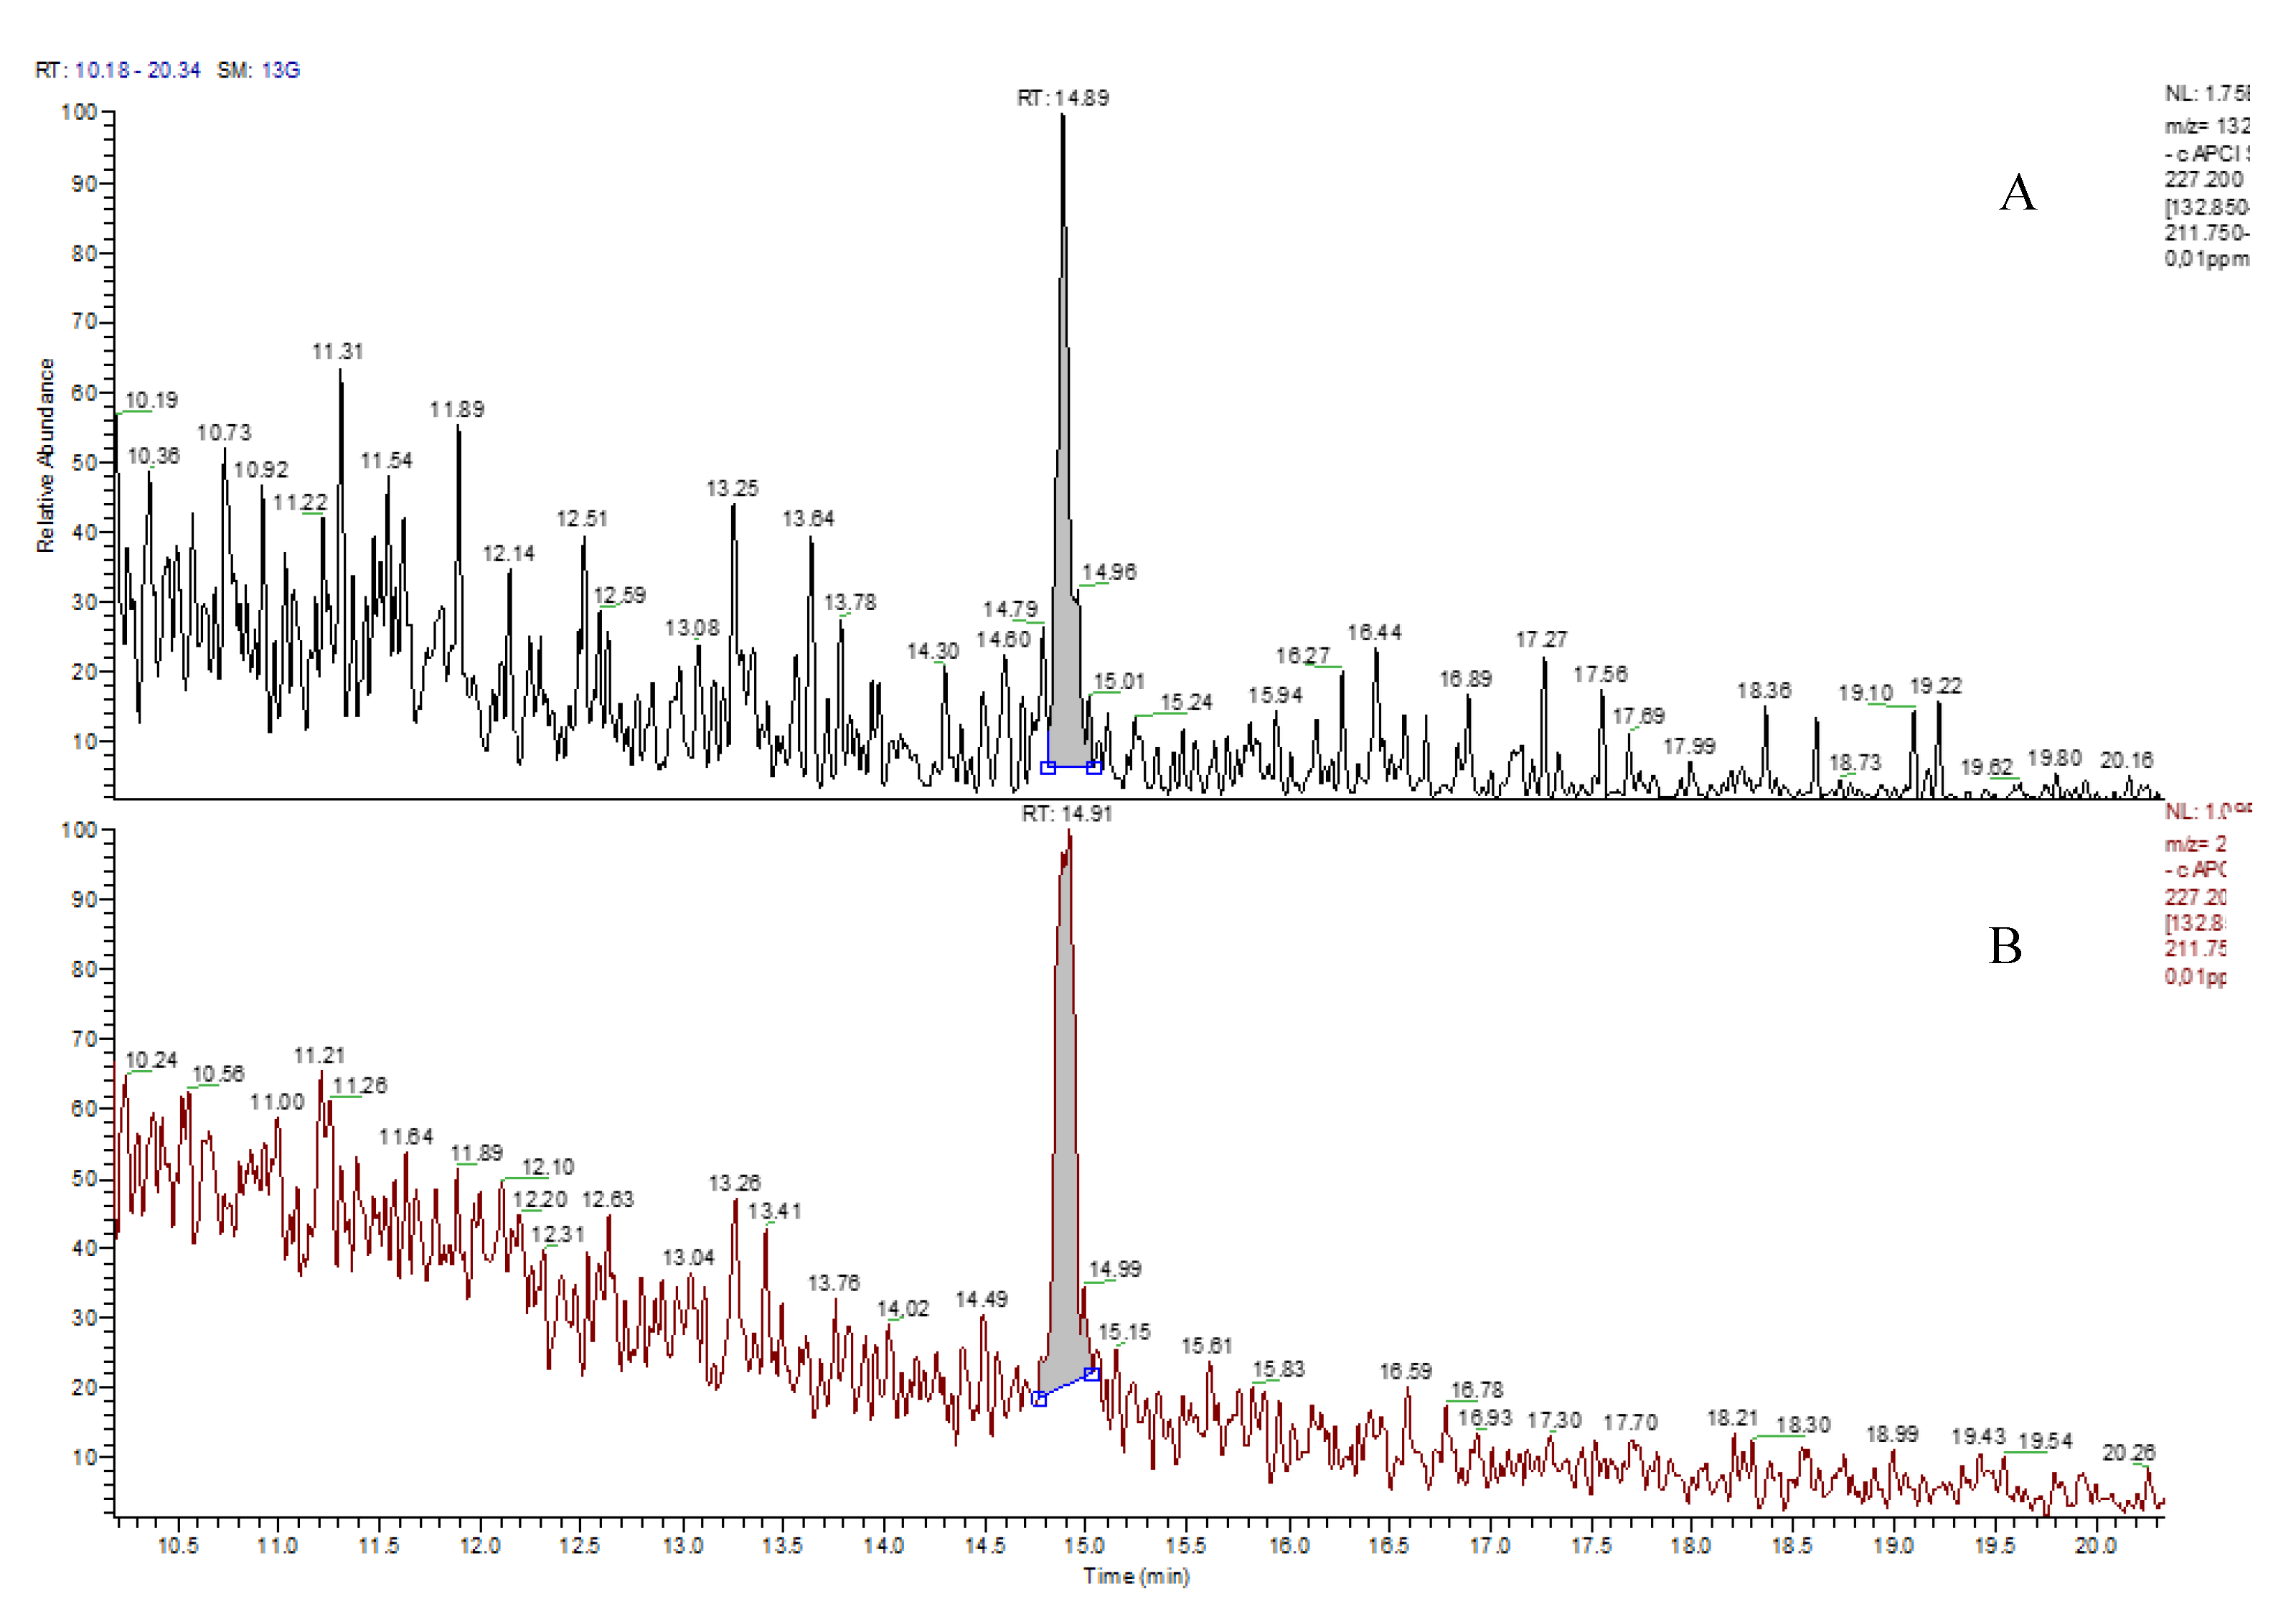
3.2. LC-MS/MS
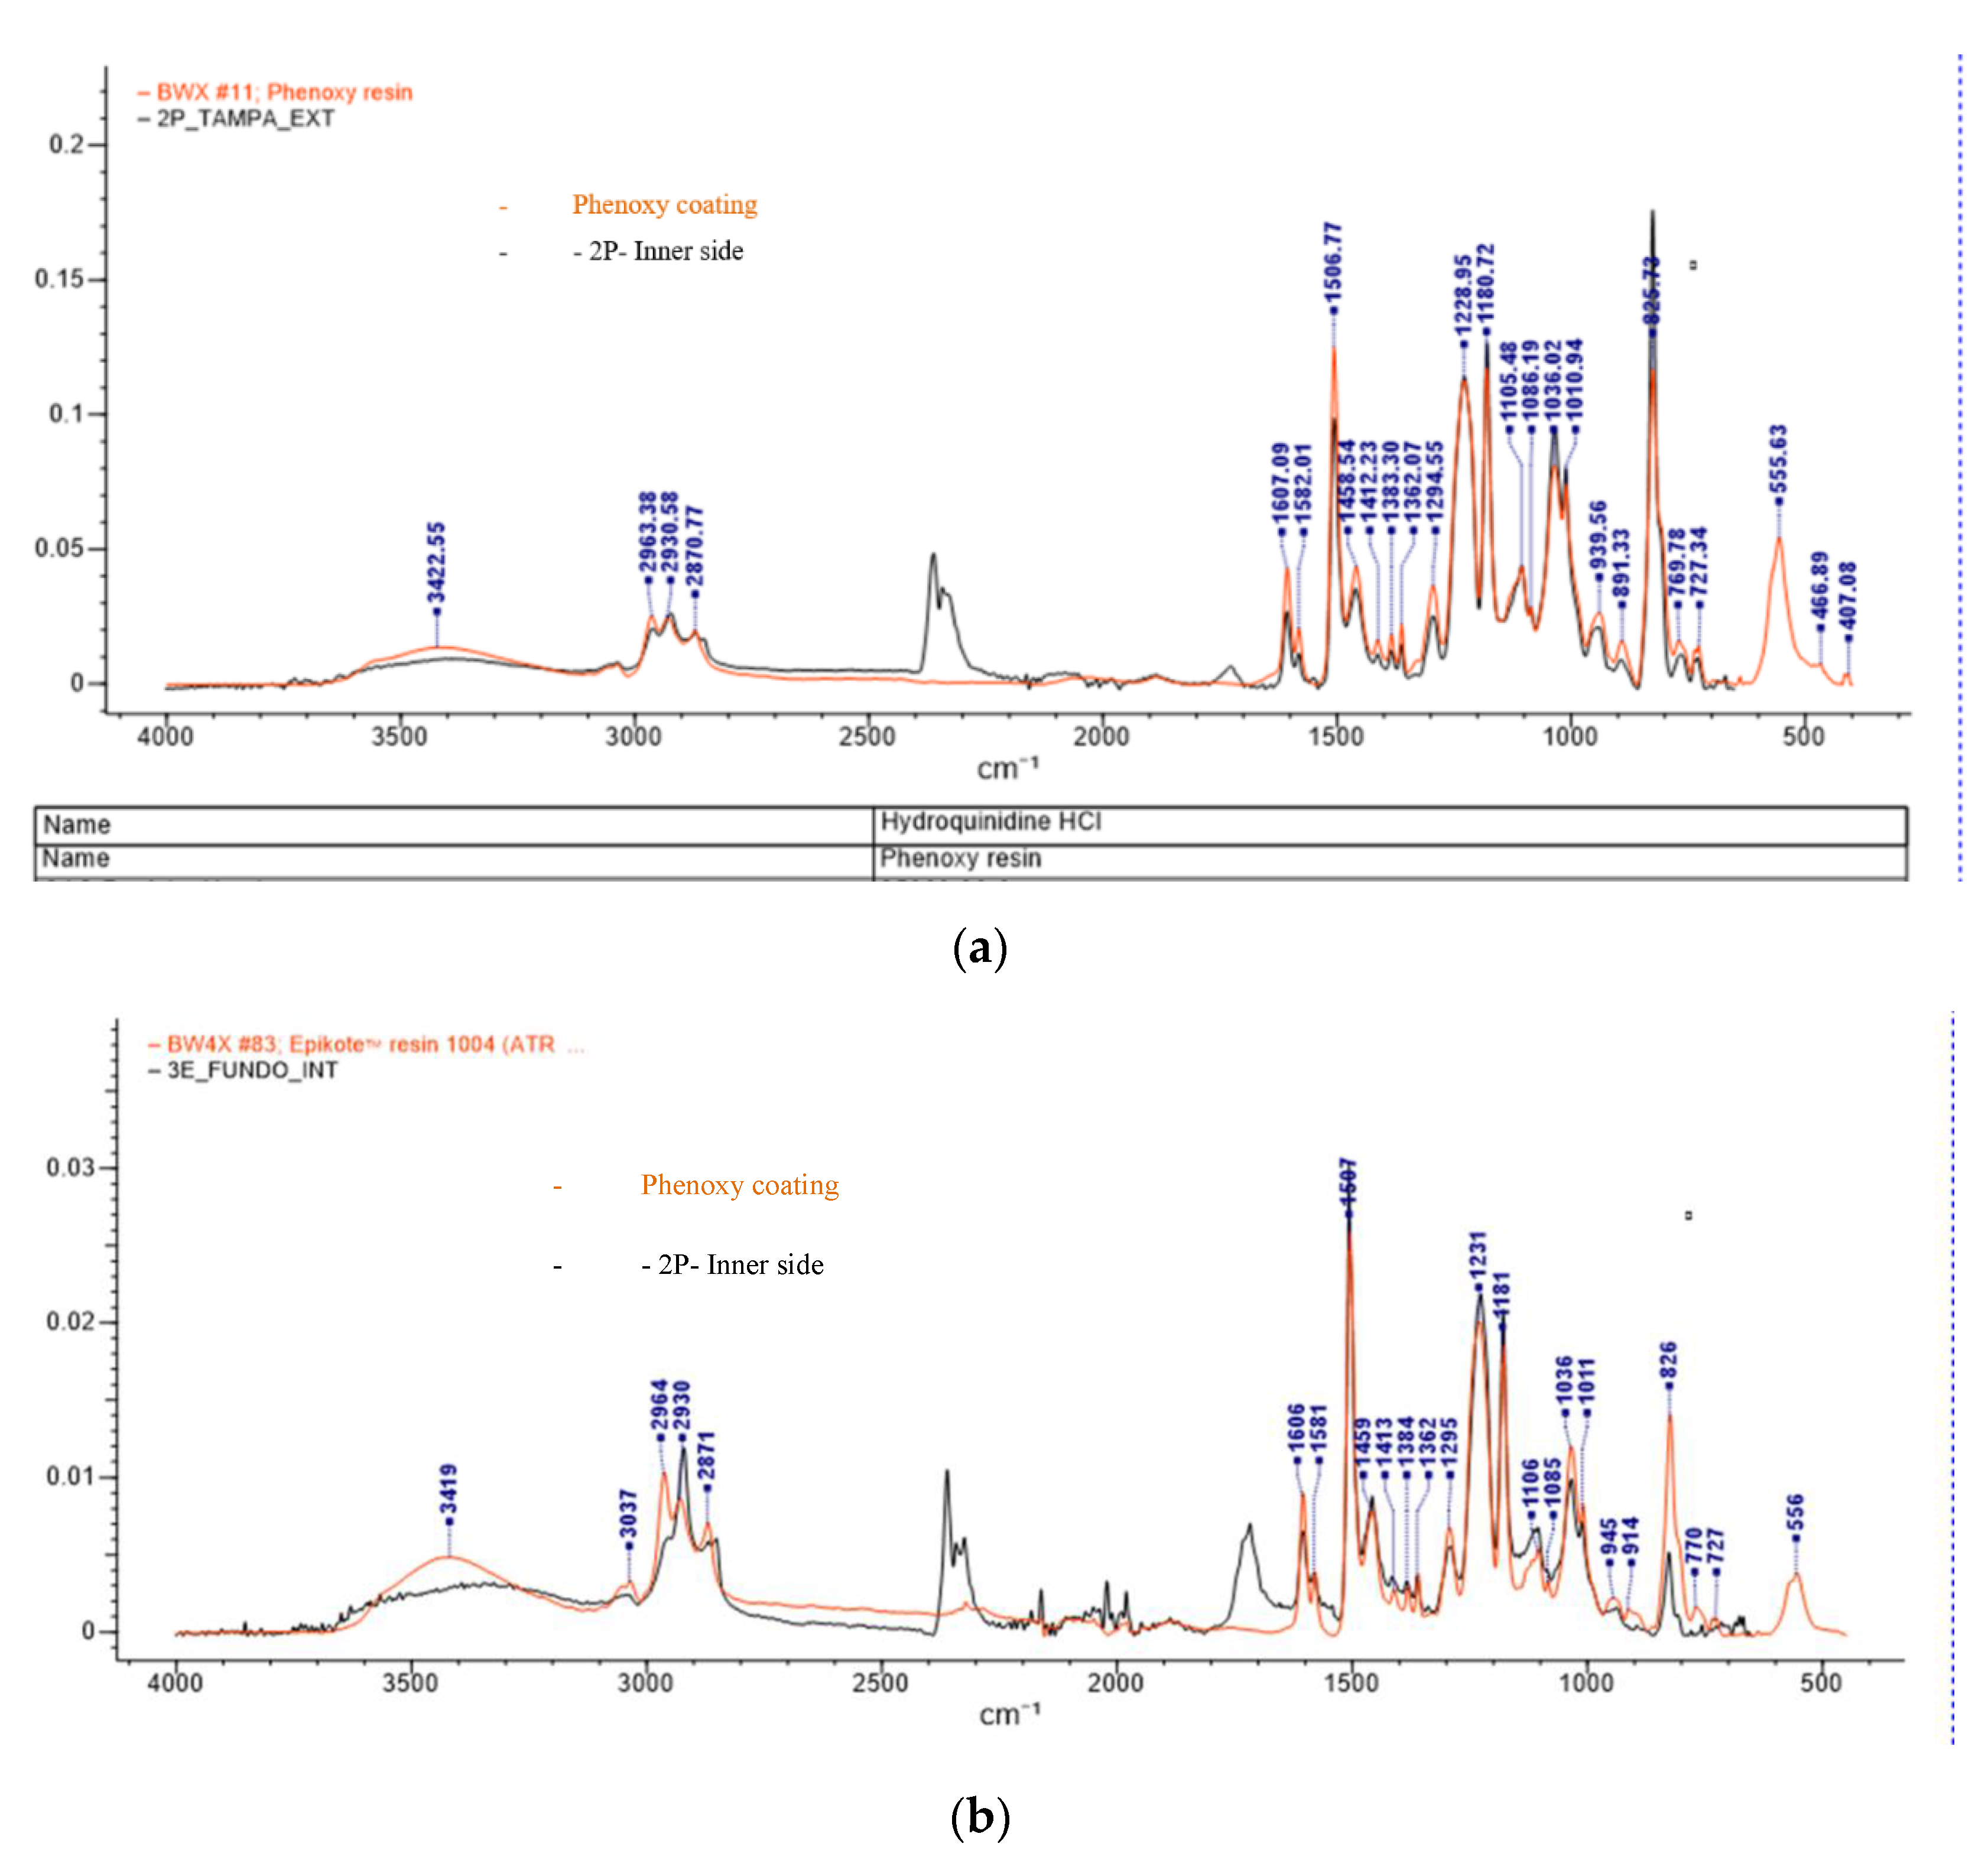
3.3. ATR-FTIR
4. Conclusions
Author Contributions
Funding
Conflicts of Interest
References
- García Ibarra, V.; Sendón, R.; Bustos, J.; Paseiro Losada, P.; Rodríguez Bernaldo de Quirós, A. Estimates of dietary exposure of Spanish population to packaging contaminants from cereal based foods contained in plastic materials. Food Chem. Toxicol. 2019, 128, 180–192. [Google Scholar] [CrossRef] [PubMed]
- Sanches-Silva, A.; Freire, J.M.C.; Franz, R.; Paseiro Losada, P.P. Mass transport studies of model migrants within dry foodstuffs. J. Cereal Sci. 2008, 48, 662–669. [Google Scholar] [CrossRef]
- Sanches-Silva, A.; Costa, D.; Albuquerque, T.G.; Buonocore, G.G.; Ramos, F.; Castilho, M.C.; Machado, A.V.; Costa, H.S. Trends in the use of natural antioxidants in active food packaging: A review. Food Addit. Contam. Part A 2014, 31, 374–395. [Google Scholar] [CrossRef] [PubMed]
- Vilarinho, F.; Sendón, R.; van der Kn, A.; Vaz, M.F.; Silva, A.S. Bisphenol A in food as a result of its migration from food packaging. Trends Food Sci. Technol. 2019, 91, 33–65. [Google Scholar] [CrossRef]
- Gugoasa, L.A.D. Review—Electrochemical Sensors for Determination of the Endocrine Disruptor, Bisphenol A. J. Electrochem. Soc. 2020, 167, 37506. [Google Scholar] [CrossRef]
- Peng, Y.; Wang, J.; Wu, C. Determination of Endocrine Disruption Potential of Bisphenol A Alternatives in Food Contact Materials Using In Vitro Assays: State of the Art and Future Challenges. J. Agric. Food Chem. 2019, 67, 12613–12625. [Google Scholar] [CrossRef]
- Thomson, B.M.; Grounds, P.R. Bisphenol A in canned foods in New Zealand: An exposure assessment. Food Addit. Contam. 2005, 22, 65–72. [Google Scholar] [CrossRef]
- Deshwal, G.K.; Panjagari, N.R. Review on metal packaging: Materials, forms, food applications, safety and recyclability. J. Food Sci. Technol. 2020, 57, 2377–2392. [Google Scholar] [CrossRef]
- European Commission. Commission Regulation (EU) No 10/2011 of 14 January 2011. on plastic materials and articles intended to come into contact with food. Off. J. Eur. Union 2011, 12, 1–89. [Google Scholar]
- Commission Regulation (EU) 2018/213 of 12 February 2018. On the Use of Bisphenol A in Varnishes and Coatings Intended to Come into Contact with Food and Amending Regulation (EU) No 10/2011 as Regards the Use of That Substance in Plastic Food Contact Materials; Official Journal of the European Union: Brussels, Belgum, 2018; pp. 6–12. [Google Scholar]
- Barroso, J. Commission Directive 2011/8/EU of 28 January 2011 amending Directive 2002/72/EC as regards the restriction of use of bisphenol A in plastic infant feeding bottles. Off. J. Eur. Union 2011, 50, 11–14. [Google Scholar]
- Rykowska, I.; Wasiak, W. Properties, Threats, and Methods of Analysis of Bisphenol a and Its Derivatives. Acta Chromatogr. 2006, 60–780, 21. [Google Scholar]
- Sungur, Ş.; Köroğlu, M.; Özkan, A. Determinatıon of bisphenol a migrating from canned food and beverages in markets. Food Chem. 2014, 142, 87–91. [Google Scholar] [CrossRef] [PubMed]
- Aristiawan, Y.; Aryana, N.; Putri, D.; Styarini, D. Analytical Method Development for Bisphenol a in Tuna by Using High Performance Liquid Chromatography-UV. Procedia Chem. 2015, 16, 202–208. [Google Scholar] [CrossRef]
- Gallo, P.; Di Marco Pisciottano, I.; Fattore, M.; Rimoli, M.G.; Seccia, S.; Albrizio, S. A method to determine BPA, BPB, and BPF levels in fruit juices by liquid chromatography coupled to tandem mass spectrometry. Food Addit. Contam. Part A 2019, 36, 1–11. [Google Scholar] [CrossRef] [PubMed]
- Ballesteros-Gómez, A.; Rubio, S.; Pérez-Bendito, D. Analytical methods for the determination of bisphenol A in food. J. Chromatogr. A 2009, 1216, 449–469. [Google Scholar] [CrossRef] [PubMed]
- Nerín, C.; Philo, M.R.; Salafranca, J.; Castle, L. Determination of bisphenol-type contaminants from food packaging materials in aqueous foods by solid-phase microextraction-high-performance liquid chromatography. J. Chromatogr. A 2002, 963, 375–380. [Google Scholar] [CrossRef]
- Cardama, A.L.; Quirós, A.R.-B.; Sendón, R. Analysis of Bisphenol A in Beverages and Food Packaging by High- Performance Liquid Chromatography Food. Nutr. J. 2017, 2017, 4. [Google Scholar] [CrossRef]
- Guideline, I.H.T. Note for Guidance on Validation of Analytical Procedures: Text and Methodology (CPMP/ICH/381/95); European Medicines Agency: Amsterdam, The Netherlands, 1995. [Google Scholar]
- Guideline, I.H.T. International conference on harmonization. In Proceedings of the Validation of Analytical Procedures: Text and Methodology Q2 (R1), Geneva, Switzerland, 10 November 2005; Volume 11. [Google Scholar]
- MacDougall, D.; Crummett, W.B. Guidelines for data acquisition and data quality evaluation in environmental chemistry. Anal. Chem. 1980, 52, 2242–2249. [Google Scholar] [CrossRef]
- Poustka, J.; Dunovská, L.; Hajšlová, J.; Holadová, K.; Poustková, I. Determination and occurrence of bisphenol A, bisphenol A diglycidyl ether, and bisphenol F diglycidyl ether, including their derivatives, in canned foodstuffs’ from the Czech retail market. Czech J. Food Sci. 2008, 25, 221–229. [Google Scholar] [CrossRef]
- Errico, S.; Bianco, M.; Mita, L.; Migliaccio, M.; Rossi, S.; Nicolucci, C.; Menale, C.; Portaccio, M.; Gallo, P.; Mita, D.G.; et al. Migration of bisphenol A into canned tomatoes produced in Italy: Dependence on temperature and storage conditions. Food Chem. 2014, 160, 157–164. [Google Scholar] [CrossRef]
- Dixit, V.; Nagpal, A.K.; Singhal, R. Synthesis and Characterization of Phenoxy Modified Epoxy Blends. Malaysian Polym. J. 2010, 5, 69–83. [Google Scholar]
- Chukwu, M.; Polytechnic, A.; Ekebafe, L. Effects of Snail Shell as Filler on the Mechanical Properties of Terephthalic Unsaturated polyester Resin. Niger. Res. J. Chem. Sci. 2019, 6, 1–12. [Google Scholar]
- Phenoxy Resin (PF). Available online: https://www.corrosionpedia.com/definition/5787/phenoxy-resin (accessed on 31 October 2019).


| Origin (Country) | Samples Used for Trial |
|---|---|
| 1E | Alegrias Riojanas |
| 2E | Asparagus buds |
| 3E | Red peppers—whole in brine |
| 4E | Artichoke hearts |
| 5E | Sweet corn |
| 6E | Peas with extra-fine carrots |
| 7E | Laminated mushrooms |
| 8E | Eggplant Almagro |
| 9E | Fine peas |
| 10E | Whole peeled tomato |
| 11E | White cabbage |
| 1P | Very fine peas |
| 2P | Cooked lentils |
| 3P | Vegetables of Macedonia |
| 4P | Sweet corn |
| 5P | Mungo bean sprouts |
| 6P | White cooked quinoa |
| 7P | Green beans |
| 8P | Artichoke Hearts |
| Chromatographic Conditions of HPLC-FLD and LC-MS/MS Methods | |
|---|---|
| Analytical column | Luna® C18 (2) 100 Å (150 mm × 3 mm, 5 µm particle size) |
| Temperature | 25 °C |
| Injection volume | 20 µl |
| FLD detector | λem 305 nm; λex 225 nm |
| MS spectrometer conditions | |
| Acquired in | Negative atmospheric pressure chemical ionization (APCI) mode |
| Spray voltage | 2500 V |
| Nebulizer gas | (N2), 35 psi |
| Vaporizer temperature | 400 °C |
| Capillary temperature | 350 °C |
| Collision gas | Argon (1.5 mTorr) |
| Selected precursor ion for BPA | m/z 227.2 |
| SRM transitions monitored | 227.2 > 212.1, collision energy: 21V |
| SRM transitions monitored | 227.2. > 133.2, collision energy: 29V |
| Time (min) | %A | %B* |
|---|---|---|
| 0.0 | 70.0 | 30.0 |
| 2.00 | 70.0 | 30.0 |
| 23.00 | 0.0 | 100.0 |
| 30.00 | 0.0 | 100.0 |
| 32.00 | 70.0 | 30.0 |
| 35.00 | 70.0 | 30.0 |
| Compound | Recovery (%) (n = 6) | Repeatability (RSD%) (n = 6) | Intermediate Precision (RSD%) (n = 18) | ||||||
|---|---|---|---|---|---|---|---|---|---|
| BPA | 0.01a) mg kg−1 | 0.05 a) mg kg−1 | 0.25 a) mg kg−1 | 0.01 a) mg kg−1 | 0.05 a) mg kg−1 | 0.25 a) mg kg−1 | 0.01 a) mg kg−1 | 0.05 a) mg kg−1 | 0.25 a) mg kg−1 |
| 90 | 77 | 72 | 9.94 | 3.48 | 3.26 | 4.53 | 4.70 | 0.57 | |
| Day | Equation | r2 | LOD (mg kg−1) | LOQ (mg kg−1) | Range (mg kg−1) |
|---|---|---|---|---|---|
| 1 | y = 224.71x − 0.1121 | 0.9999 | 0.005 | 0.01 | 0.01–0.25 |
| 2 | y = 223.92x − 0.2539 | ||||
| 3 | y = 219.54x − 0.113 |
| Samples/ Country | Part of the Tin Can Evaluated | Main Compound Identified |
|---|---|---|
| 1S | Inner Body | Epoxy coating |
| Inner Cover | Polyester | |
| 1P | Inner Bottom | Polyester |
| Inner Side | Phenoxy coating | |
| Inner Cover | Polyester | |
| 2S | Inner Bottom | Modified phenolic coating |
| Inner Side | Epoxy coating | |
| Inner Cover | Epoxy coating | |
| 2P | Inner Bottom | Polyester |
| Inner Side | Phenoxy coating | |
| Inner Cover | Polyester | |
| 3S | Inner Bottom | Epoxy coating |
| Inner Side | Polyester | |
| Inner Cover | Polyester | |
| 3P | Inner Bottom | Polyester |
| Inner Side | Polyester | |
| Inner Cover | Polyester | |
| 4S | Inner Bottom | Polyester |
| Inner Side | Polyester | |
| Inner Cover | Polyester | |
| 4P | Inner Bottom | Polyester |
| Inner Side | Phenoxy coating | |
| Inner Cover | Phenoxy coating | |
| 5S | Inner Bottom | Polyester |
| Inner Side | Polyester | |
| Inner Cover | Polyester | |
| 5P | Inner Bottom | Polyester |
| Inner Side | Polyester | |
| Inner Cover | Polyester | |
| 6S | Inner Bottom | Phenoxy coating |
| Inner Side | Polyester | |
| Inner Cover | Polyester | |
| 6P | Inner Bottom | Phenoxy coating |
| Inner Side | Polyester | |
| Inner Cover | Polyester | |
| 7S | Inner Bottom | Phenoxy coating |
| Inner Side | Phenoxy coating | |
| Inner Cover | Polyester | |
| 7P | Inner Bottom | Polyester |
| Inner Side | Polyester | |
| Inner Cover | Phenoxy coating | |
| 8S | Inner Bottom | Epoxy coating |
| Inner Side | Phenoxy coating | |
| Inner Cover | Polyester | |
| 8P | Inner Bottom | Epoxy coating |
| Inner Side | Epoxy coating | |
| Inner Cover | Phenoxy coating | |
| 9S | Inner Bottom | Polyester |
| Inner Side | Phenoxy coating | |
| Inner Cover | Phenoxy coating | |
| 10S | Inner Bottom | Epoxy coating |
| Inner Side | Phenoxy coating | |
| Inner Cover | Phenoxy coating | |
| 11S | Inner Bottom | Epoxy coating |
| Inner Side | Epoxy coating | |
| Inner Cover | Phenoxy coating |
© 2020 by the authors. Licensee MDPI, Basel, Switzerland. This article is an open access article distributed under the terms and conditions of the Creative Commons Attribution (CC BY) license (http://creativecommons.org/licenses/by/4.0/).
Share and Cite
Vilarinho, F.; Lestido-Cardama, A.; Sendón, R.; Rodríguez Bernaldo de Quirós, A.; Vaz, M.d.F.; Sanches-Silva, A. HPLC with Fluorescence Detection for Determination of Bisphenol A in Canned Vegetables: Optimization, Validation and Application to Samples from Portuguese and Spanish Markets. Coatings 2020, 10, 624. https://doi.org/10.3390/coatings10070624
Vilarinho F, Lestido-Cardama A, Sendón R, Rodríguez Bernaldo de Quirós A, Vaz MdF, Sanches-Silva A. HPLC with Fluorescence Detection for Determination of Bisphenol A in Canned Vegetables: Optimization, Validation and Application to Samples from Portuguese and Spanish Markets. Coatings. 2020; 10(7):624. https://doi.org/10.3390/coatings10070624
Chicago/Turabian StyleVilarinho, Fernanda, Antia Lestido-Cardama, Raquel Sendón, Ana Rodríguez Bernaldo de Quirós, Maria de Fátima Vaz, and Ana Sanches-Silva. 2020. "HPLC with Fluorescence Detection for Determination of Bisphenol A in Canned Vegetables: Optimization, Validation and Application to Samples from Portuguese and Spanish Markets" Coatings 10, no. 7: 624. https://doi.org/10.3390/coatings10070624
APA StyleVilarinho, F., Lestido-Cardama, A., Sendón, R., Rodríguez Bernaldo de Quirós, A., Vaz, M. d. F., & Sanches-Silva, A. (2020). HPLC with Fluorescence Detection for Determination of Bisphenol A in Canned Vegetables: Optimization, Validation and Application to Samples from Portuguese and Spanish Markets. Coatings, 10(7), 624. https://doi.org/10.3390/coatings10070624