Graphene-Oxide and Ionic Liquid Modified Electrodes for Electrochemical Sensing of Breast Cancer 1 Gene


Abstract
:1. Introduction
2. Materials and Methods
2.1. Instrument
2.2. Chemicals
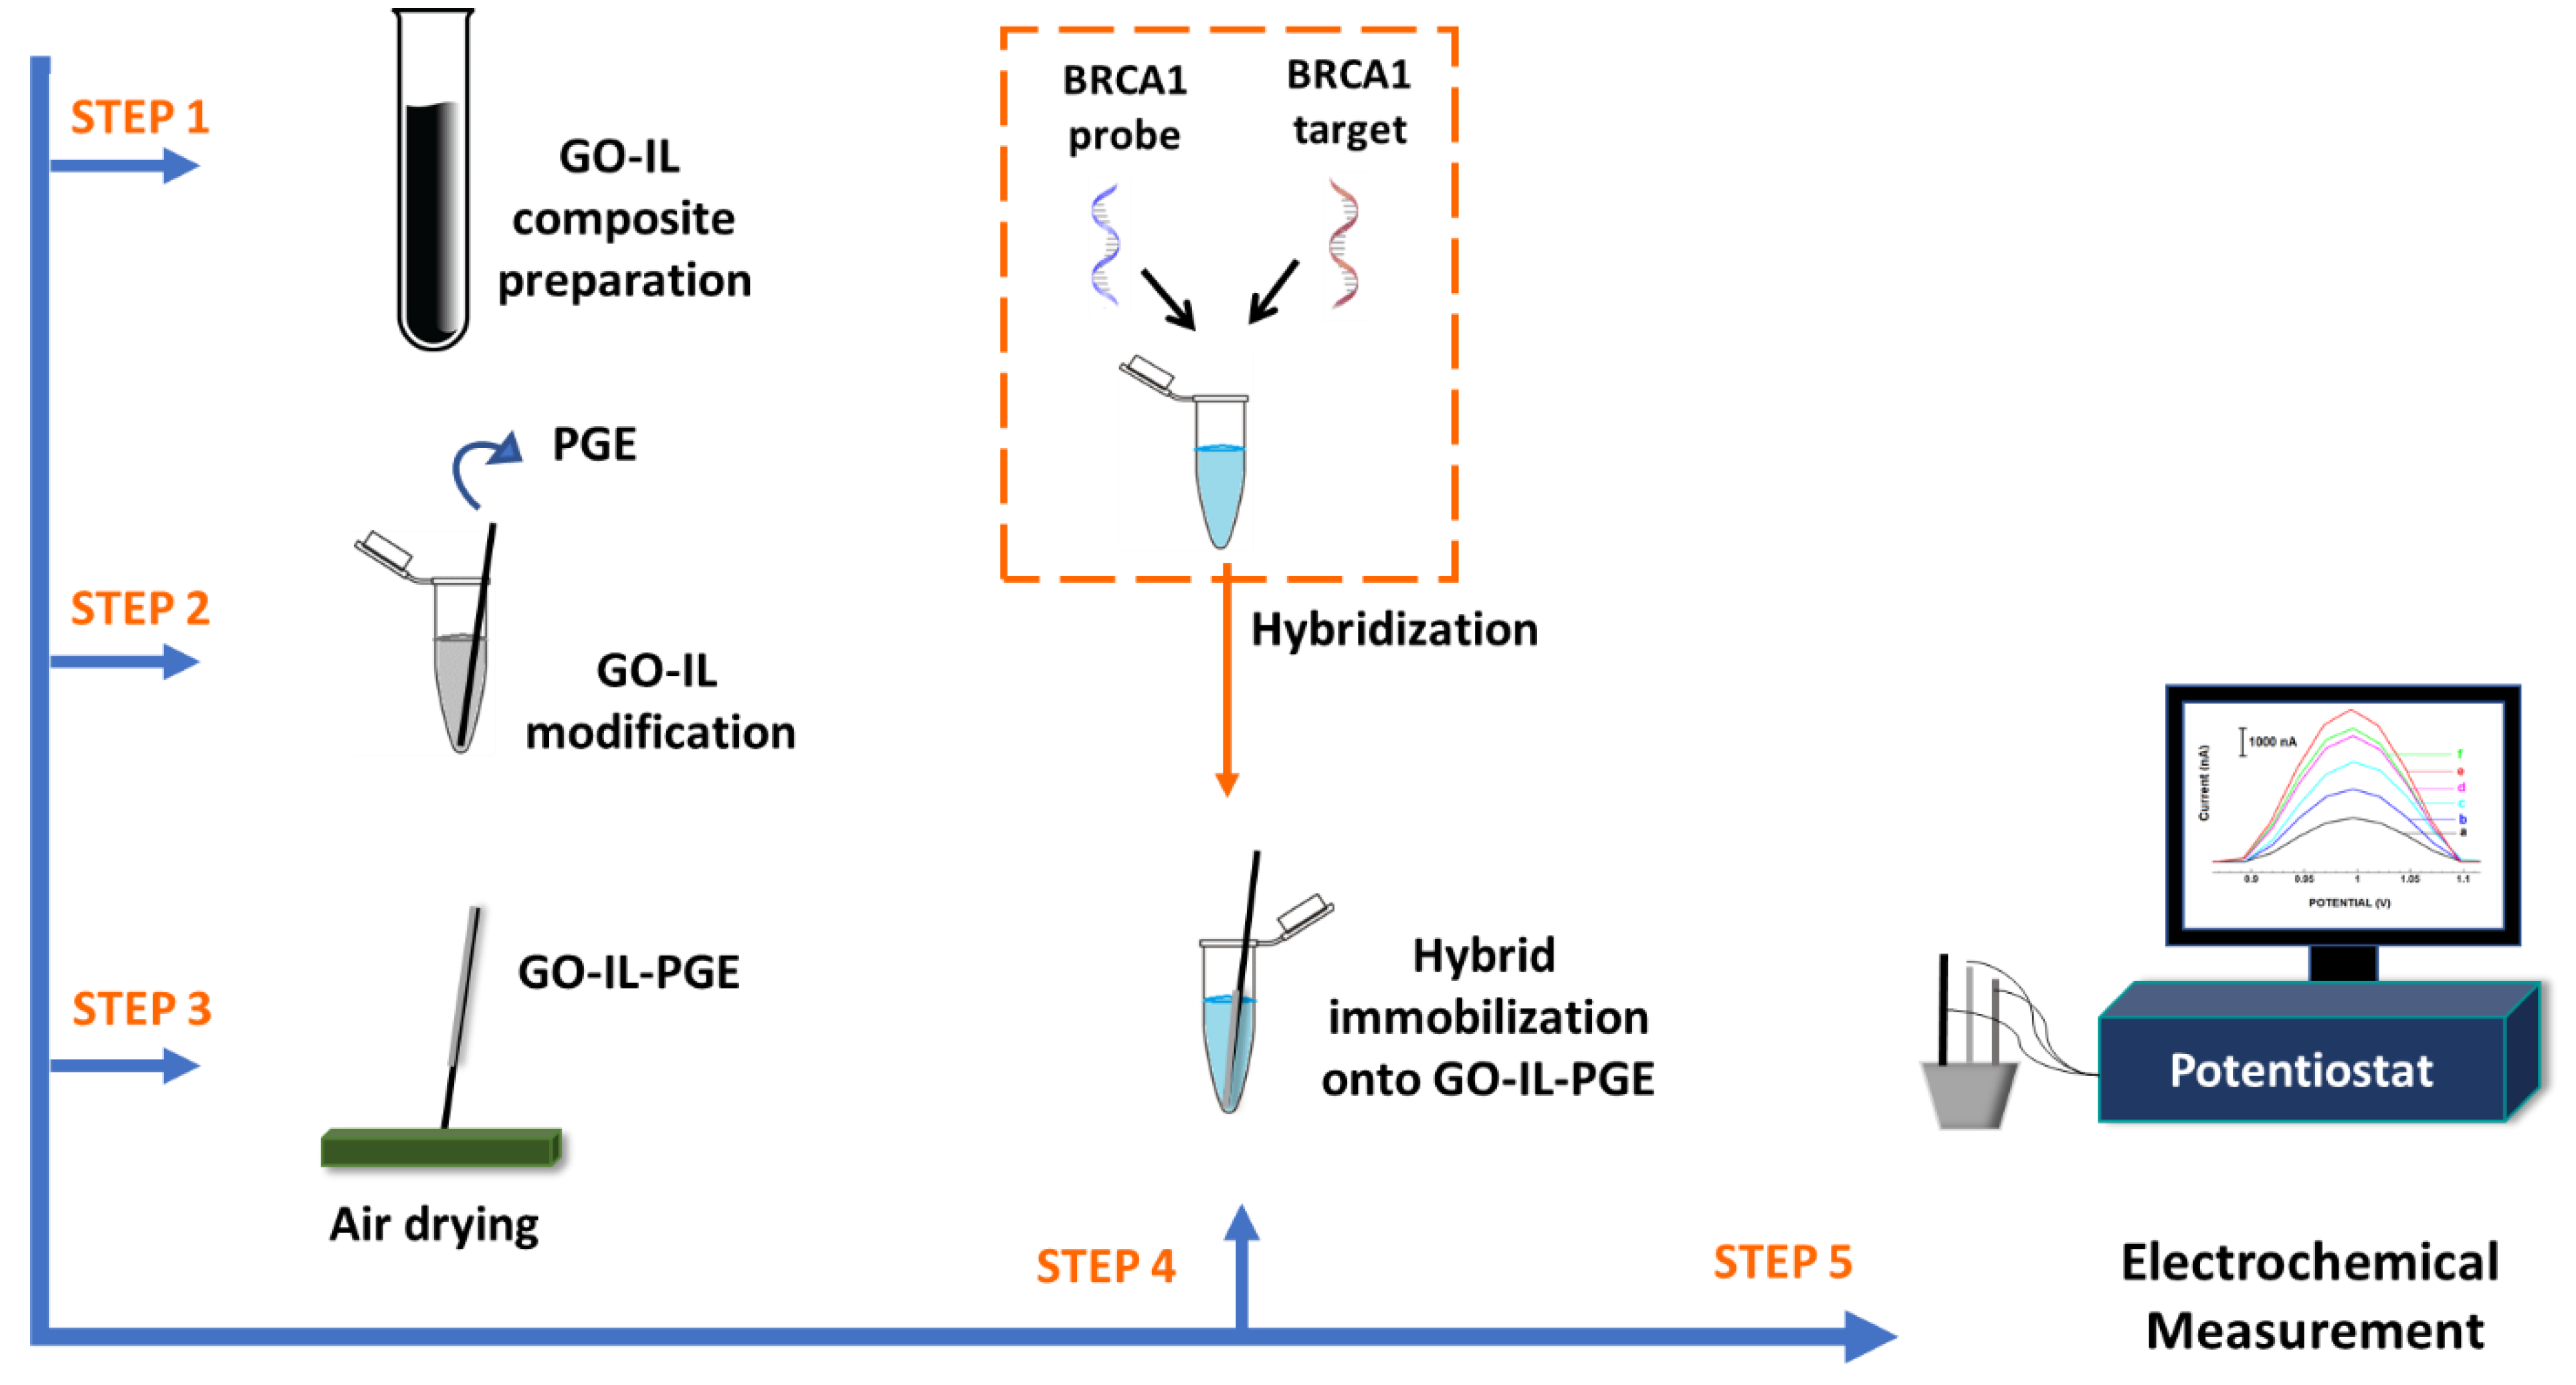
- (i)
- GO-IL modification onto PGE surface.
- (ii)
- Hybridization BRCA1 probe and BRCA1 target, or other DNA ODNs; NC, MM.
- (iii)
- DNA–DNA hybrid immobilization onto GO-IL-PGE.
2.2.1. Preparation of GO-IL-PGEs
2.2.2. Hybridization of BRCA1-Specific DNA Probe with BRCA1 Target and Immobilization onto the GO-IL-PGEs
2.3. Voltammetric Measurements
2.4. Impedimetric Measurements
3. Results and Discussion
4. Conclusions
Supplementary Materials
Author Contributions
Funding
Institutional Review Board Statement
Informed Consent Statement
Data Availability Statement
Acknowledgments
Conflicts of Interest
References
- Shahrokhian, S.; Salimian, R. Ultrasensitive detection of cancer biomarkers using conducting polymer/electrochemically reduced graphene oxide-based biosensor: Application toward BRCA1 sensing. Sens. Actuators B Chem. 2018, 266, 160–169. [Google Scholar] [CrossRef]
- De Bonis, M.; Minucci, A.; Scaglione, G.L.; De Paolis, E.; Zannoni, G.; Scambia, G.; Capoluongo, E. Capillary electrophoresis as alternative method to detect tumor genetic mutations: The model built on the founder BRCA1 c.4964_4982del19 variant. Fam. Cancer 2019, 18, 29–35. [Google Scholar] [CrossRef] [PubMed]
- Wong, R.S.J.; Lee, S.-C. BRCA sequencing of tumors: Understanding its implications in the oncology community. Chin. Clin. Oncol. 2020, 9, 66. [Google Scholar] [CrossRef] [PubMed]
- Qu, S.; Chen, Q.; Yi, Y.; Shao, K.; Zhang, W.; Wang, Y.; Bai, J.; Li, X.; Liu, Z.; Wang, X.; et al. A Reference System for BRCA Mutation Detection Based on Next-Generation Sequencing in the Chinese Population. J. Mol. Diagn. 2019, 21, 677–686. [Google Scholar] [CrossRef] [PubMed]
- Ellison, G.; Huang, S.; Carr, H.; Wallance, A.; Ahdesmaki, A.; Bhaskar, S.; Mills, J. A reliable method for the detection of BRCA1 and BRCA2 mutations in fixed tumour tissue utilising multiplex PCR-based targeted next generation sequencing. BMC Clin. Pathol. 2015, 15, 5. [Google Scholar] [CrossRef] [Green Version]
- Zakrzewski, F.; Gieldon, L.; Rump, A.; Seifert, M.; Grützmann, K.; Krüger, A.; Loos, S.; Zeugner, S.; Hackman, K.; Porrmann, J.; et al. Targeted capture-based NGS is superior tomultiplex PCR-based NGS for hereditary BRCA1 and BRCA2 gene analysis in FFPE tumor samples. BMC Cancer 2019, 19, 396. [Google Scholar] [CrossRef]
- Chen, M.; Wu, D.; Tu, S.; Yang, C.; Chen, D.; Xu, Y. A novel biosensor for the ultrasensitive detection of the lncRNA biomarker MALAT1 in non-small cell lung cancer. Sci. Rep. 2021, 11, 3666. [Google Scholar] [CrossRef] [PubMed]
- Wang, J.; Kawde, A.-N.; Erdem, A.; Salazar, M. Magnetic-Bead based Label-Free Electrochemical Detection of DNA Hybridization. Analyst 2001, 126, 2020–2024. [Google Scholar] [CrossRef]
- Wang, J.; Xu, D.; Erdem, A.; Polsky, R.; Salazar, M. Genomagnetic Electrochemical Assays of DNA Hybridization. Talanta 2002, 56, 931–938. [Google Scholar] [CrossRef]
- Liu, J.; Wang, T.; Xiao, B.; Deng, M.; Yu, P.; Qing, T. Fluorometric determination of the breast cancer 1 gene based on the target-induced conformational change of a DNA template for copper nanoclusters. Anal. Methods 2021, 13, 712–718. [Google Scholar] [CrossRef]
- Li, Y.; Yan, Y.; Lei, Y.; Zhao, D.; Yuan, T.; Zhang, D.; Cheng, W.; Ding, S. Surface plasmon resonance biosensor for label-free and highly sensitive detection of point mutation using polymerization extension reaction. Colloids Surf. B Biointerfaces 2014, 120, 15–20. [Google Scholar] [CrossRef]
- Helmerhorst, E.; Chandler, D.J.; Nussio, M.; Mamotte, C.D. Real-time and Label-free Bio-sensing of Molecular Interactions by Surface Plasmon Resonance: A Laboratory Medicine Perspective. Clin. Biochem. Rev. 2012, 33, 161–173. [Google Scholar] [PubMed]
- Erdem, A. Nanomaterial based electrochemical DNA sensing strategies. Talanta 2007, 74, 318–325. [Google Scholar] [CrossRef]
- Lee, J.; Kim, J.; Kim, S.; Min, D. Biosensors based on graphene oxide and its biomedical application. Adv. Drug Deliv. Rev. 2016, 105, 275–287. [Google Scholar] [CrossRef]
- Arfin, T.; Rangari, S.N. Graphene oxide–ZnO nanocomposite modified electrode for the detection of phenol. Anal. Methods 2018, 10, 347–358. [Google Scholar] [CrossRef]
- Farea, M.; Mohammed, H.Y.; Sayyad, P.W.; Ingle, N.N.; Al-Gahouari, T.; Mahadik, M.M.; Bodkhe, G.A.; Shirsat, S.M.; Shirsat, M.D. Carbon monoxide sensor based on polypyrrole–graphene oxide composite: A cost-effective approach. Appl. Phys. A 2021, 127, 681. [Google Scholar] [CrossRef]
- He, Q.; Liu, J.; Liu, X.; Li, G.; Deng, P.; Liang, J.; Chen, D. Sensitive and Selective Detection of Tartrazine Based on TiO2-Electrochemically Reduced Graphene Oxide Composite-Modified Electrodes. Sensors 2018, 18, 1911. [Google Scholar] [CrossRef] [Green Version]
- Wu, X.; Mu, F.; Wang, Y.; Zhao, H. Graphene and Graphene-Based Nanomaterials for DNA Detection: A Review. Molecules 2018, 23, 2050. [Google Scholar] [CrossRef] [Green Version]
- Gomes, J.M.; Silva, S.S.; Reis, R.L. Biocompatible ionic liquids: Fundamental behaviours and applications. Chem. Soc. Rev. 2019, 48, 4317–4335. [Google Scholar] [CrossRef]
- Ranjan, P.; Singhal, A.; Yadav, S.; Kumar, N.; Murali, S.; Sanghi, S.K.; Khan, R. Rapid diagnosis of SARS-CoV-2 using potential point-of-care electrochemical immunosensor: Toward the future prospects. Int. Rev. Immunol. 2021, 40, 126–142. [Google Scholar] [CrossRef]
- Yang, L.; Zhang, B.; Xu, B.; Zhao, F.; Zeng, B. Ionic liquid functionalized 3D graphene-carbon nanotubes—AuPd nanoparticles-molecularly imprinted copolymer based paracetamol electrochemical sensor: Preparation, characterization and application. Talanta 2021, 224, 121845. [Google Scholar] [CrossRef] [PubMed]
- Hu, X.; Liu, Y.; Xia, Y.; Zhao, F.; Zeng, B. A novel ratiometric electrochemical sensor for the selective detection of citrinin based on molecularly imprinted poly (thionine) on ionic liquid decorated boron and nitrogen co-doped hierarchical porous carbon. Food Chem. 2021, 363, 130385. [Google Scholar] [CrossRef] [PubMed]
- Moghadam, F.H.; Taher, M.A.; Karimi-Maleh, H. A sensitive and fast approach for voltammetric analysis of bisphenol a as a toxic compound in food products using a Pt-SWCNTs/ionic liquid modified sensor. Food Chem. Toxicol. 2021, 152, 112166. [Google Scholar] [CrossRef] [PubMed]
- Liu, N.; Liu, J.; Niu, X.; Wang, J.; Guo, R.; Mo, Z. An electrochemical chiral sensor based on the synergy of chiral ionic liquid and 3D-NGMWCNT for tryptophan enantioselective recognition. Microchim. Acta 2021, 188, 1–13. [Google Scholar] [CrossRef]
- Silva, T.A.; Wong, A.; Fatibello-Filho, O. Electrochemical sensor based on ionic liquid and carbon black for voltammetric determination of Allura red colorant at nanomolar levels in soft drink powders. Talanta 2020, 209, 120588. [Google Scholar] [CrossRef]
- Eksin, E.; Muti, M.; Erdem, A. Chitosan/Ionic liquid composite electrode for electrochemical monitoring of the surface-confined interaction between mitomycin C and DNA. Electroanalysis 2013, 25, 1–9. [Google Scholar] [CrossRef]
- Sengiz, C.; Congur, G.; Erdem, A. Development of Ionic Liquid Modified Disposable Graphite Electrodes for Label-Free Electrochemical Detection of DNA Hybridization Related to Microcystis spp. Sensors 2015, 15, 22737–22749. [Google Scholar] [CrossRef] [Green Version]
- Yarali, E.; Kanat, E.; Erac, Y.; Erdem, A. Ionic Liquid Modified Single-use Electrode Developed for Voltammetric Detection of miRNA-34a and its Application to Real Samples. Electroanalysis 2020, 32, 384–393. [Google Scholar] [CrossRef]
- Kesici, E.; Eksin, E.; Erdem, A. An Impedimetric Biosensor Based on Ionic Liquid-Modified Graphite Electrodes Developed for microRNA-34a Detection. Sensors 2018, 18, 2868. [Google Scholar] [CrossRef] [Green Version]
- Choosang, J.; Khumngern, S.; Thavarungkul, P.; Kanatharana, P.; Numnuam, A. An ultrasensitive label-free electrochemical immunosensor based on 3D porous chitosan-graphene-ionic liquid-ferrocene nanocomposite cryogel decorated with gold nanoparticles for prostate-specific antigen. Talanta 2021, 224, 12178. [Google Scholar] [CrossRef]
- Farzin, L.; Sadjadi, S.; Shamsipur, M.; Sheibani, S. Electrochemical genosensor based on carbon nanotube/amine-ionic liquid functionalized reduced graphene oxide nanoplatform for detection of human papillomavirus (HPV16)-related head and neck cancer. J. Pharm. Biomed. Anal. 2020, 179, 112989. [Google Scholar] [CrossRef]
- Shen, Q.; Liu, M.; Lü, Y.; Zhang, D.; Cheng, Z.; Liu, Y.; Gao, H.; Jin, Z. Label-Free Electrochemical Immunosensor Based on a Functionalized Ionic Liquid and Helical Carbon Nanotubes for the Determination of Cardiac Troponin I. ACS Omega 2019, 4, 11888–11892. [Google Scholar] [CrossRef] [PubMed] [Green Version]
- Kunpatee, K.; Traipop, S.; Chailapakul, O.; Chuanuwatanakul, S. Simultaneous determination of ascorbic acid, dopamine, and uric acid using graphene quantum dots/ionic liquid modified screen-printed carbon electrode. Sens. Actuators B Chem. 2020, 314, 128059. [Google Scholar] [CrossRef]
- Kim, D.-H.; Nam, S.; Kim, J.; Lee, W.-Y. Electrochemical Determination of Capsaicin by Ionic Liquid Composite-Modified Electrode. J. Electrochem. Sci. Technol. 2019, 10, 177–184. [Google Scholar]
- Li, J.; Wang, Y.; Sun, Y.; Ding, C.; Lin, Y.; Sun, W.; Luo, C. A novel ionic liquid functionalized graphene oxide supported gold nanoparticle composite film for sensitive electrochemical detection of dopamine. RSC Adv. 2017, 7, 2315–2322. [Google Scholar] [CrossRef] [Green Version]
- Ma, J.-Y.; Hong, X.-P. Simple Fabrication of Reduced Graphene Oxide—Ionic Liquid Composite Modified Electrode for Sensitive Detection of Sulfadiazine. Int. J. Electrochem. Sci. 2020, 15, 3729–3739. [Google Scholar] [CrossRef]
- Sukumaran, P.; Vineesh, T.V.; Rajappa, S.; Li, C.-Z.; Alwarappan, S. Ionic liquid modified N-doped graphene as a potential platform for the electrochemical discrimination of DNA sequences. Sens. Actuators B Chem. 2017, 247, 556–563. [Google Scholar] [CrossRef]
- Eksin, E.; Erdem, A. Electrochemical detection of microRNAs by graphene oxide modified disposable graphite electrodes. J. Electroanal. Chem. 2018, 810, 232–238. [Google Scholar] [CrossRef]
- Congur, G.; Eksin, E.; Erdem, A. Impedimetric detection of microRNA at graphene oxide modified sensors. Electrochim. Acta 2015, 172, 20–27. [Google Scholar] [CrossRef]
- Isin, D.; Eksin, E.; Erdem, A. Graphene oxide modified single-use electrodes and their application for voltammetric miRNA analysis. Mater. Sci. Eng. C 2017, 75, 1242–1249. [Google Scholar] [CrossRef]
- Erdem, A.; Isin, D.; Eksin, E.; Polat, D. Graphene Oxide Modified Chemically Activated Graphite Electrodes for Detection of microRNA. Electroanalysis 2017, 29, 1350–1358. [Google Scholar] [CrossRef]
- Zor, E.; Eksin, E.; Findik, M.; Bingol, H.; Erdem, A. Carboxylated-Graphene Decorated Pencil Graphite Electrode as a Platform for Voltammetric Detection of DNA. J. Electrochem. Soc. 2017, 164, B723–B729. [Google Scholar] [CrossRef]
- Eksin, E.; Zor, E.; Erdem, A.; Bingol, H. Electrochemical monitoring of biointeraction by graphene-based material modified pencil graphite electrode. Biosens. Bioelectron. 2017, 92, 207–214. [Google Scholar] [CrossRef]
- Cummings, T.E.; Elving, P.J. Determination of the electrochemically effective electrode area. Anal. Chem. 1978, 50, 480–488. [Google Scholar] [CrossRef]
- Saxena, R.; Srivastava, S. An insight into impedimetric immunosensor and its electrical equivalent circuit. Sens. Actuators B Chem. 2019, 297, 126780. [Google Scholar] [CrossRef]
- Arora, K.; Prabhakar, N.; Chand, S.; Malhotra, B.D. Ultrasensitive DNA hybridization biosensor based on polyaniline. Biosens. Bioelectron. 2007, 23, 613–620. [Google Scholar] [CrossRef]
- Janek, R.P.; Fawcett, W.R.; Ulman, A. Impedance spectroscopy of self-assembled monolayers on Au (111). Langmuir 1998, 14, 3011–3018. [Google Scholar] [CrossRef]
- Miller, J.N.; Miller, J.C. Statistics and Chemometrics for Analytical Chemistry; Pearson: Harlow, London, UK, 2005; pp. 121–123. [Google Scholar]
- Li, C.; Karadeniz, H.; Canavar, E.; Erdem, A. Electrochemical sensing of label free DNA hybridization related to breast cancer 1 gene at disposable sensor platforms modified with single walled carbon nanotubes. Electrochim. Acta 2012, 82, 137–142. [Google Scholar] [CrossRef]
- Rasheed, P.A.; Sandhyarani, N. Graphene-DNA electrochemical sensor for the sensitive detection of BRCA1 gene. Sens. Actuators B Chem. 2014, 2014, 777–782. [Google Scholar] [CrossRef]
- Xu, H.; Wang, L.; Ye, H.; Yu, L.; Zhu, X.; Lin, Z.; Wu, G.; Li, X.; Liu, X.; Chen, G. An ultrasensitive electrochemical impedance sensor for a special BRCA1 breast cancer gene sequence based on lambda exonuclease assisted target recycling amplification. Chem. Commun. 2012, 48, 6390–6392. [Google Scholar] [CrossRef]
- Filippidou, M.; Loukas, C.M.; Kaprou, G.; Tegou, E.; Petrou, P.; Kakabakos, S.; Tserepi, A.; Chatzandroulis, S. Detection of BRCA1 gene on partially reduced graphene oxide biosensors. Microelectron. Eng. 2019, 216, 111093. [Google Scholar] [CrossRef]
- Wang, J.; Kawde, A.N.; Musameh, M. Carbon-nanotube-modified glassy carbon electrodes for amplified label-free electrochemical detection of DNA hybridization. Analyst 2003, 128, 912. [Google Scholar] [CrossRef] [PubMed]
- Cui, M.; Wang, Y.; Wang, H.; Wu, Y.; Luo, X. A label-free electrochemical DNA biosensor for breast cancer marker BRCA1 based on self-assembled antifouling peptide monolayer. Sens. Actuators B Chem. 2017, 244, 742–749. [Google Scholar] [CrossRef]
- Mansor, N.A.; Zain, Z.M.; Hamzah, H.H.; Noorden, M.S.A.; Jaapar, S.S.; Beni, V.; Ibupoto, Z.H. Detection of Breast Cancer 1 (BRCA1) Gene Using an Electrochemical DNA Biosensor Based on Immobilized ZnO Nanowires. Open J. Appl. Biosens. 2014, 3, 9–17. [Google Scholar] [CrossRef] [Green Version]
- Kazeroni, H.; Nassernejad, B. A Novel Biosensor Nanomaterial for Ultraselective and Ultrasensitive Electrochemical Diagnosis of Breast Cancer-Related BRCA1 Gene. Anal. Methods 2016, 8, 3069–3074. [Google Scholar] [CrossRef]
- Feng, D.; Su, J.; He, G.; Xu, Y.; Wang, C.; Zheng, M.; Qian, Q.; Mi, X. Electrochemical DNA Sensor for Sensitive BRCA1 Detection Based on DNA Tetrahedral-Structured Probe and Poly-Adenine Mediated Gold Nanoparticles. Biosensors 2020, 10, 78. [Google Scholar] [CrossRef] [PubMed]


| Oligonucleotide | Sequence |
|---|---|
| Probe (P1) | 5′-(CH2)6-GGGGGGGGGGGG 3′ |
| SH-link probe (P2) | 5′-SH-(CH2)6-GGGGGGGGGGGG-3′ |
| PO4 link probe (P3) | 5′-PO4-(CH2)6-GGGGGGGGGGGG-3′ |
| NH2 link probe (P4) | 5′-NH2-(CH2)6-GGGGGGGGGGGG-3′ |
| BRCA1 probe (I: Inosine) | 5′-NH2-(CH2)6-IATTTTCTTCCTTTTITTC-3′ |
| BRCA target | 5′-GAACAAAAGGAAGAAAATC-3′ |
| 3-base mismatch (MM) | 5′-CAACAAAAGCAACAAAATC-3′ |
| Non-complementary (NC) | 5′-TAAGCAACCTGATTTGA-3′ |
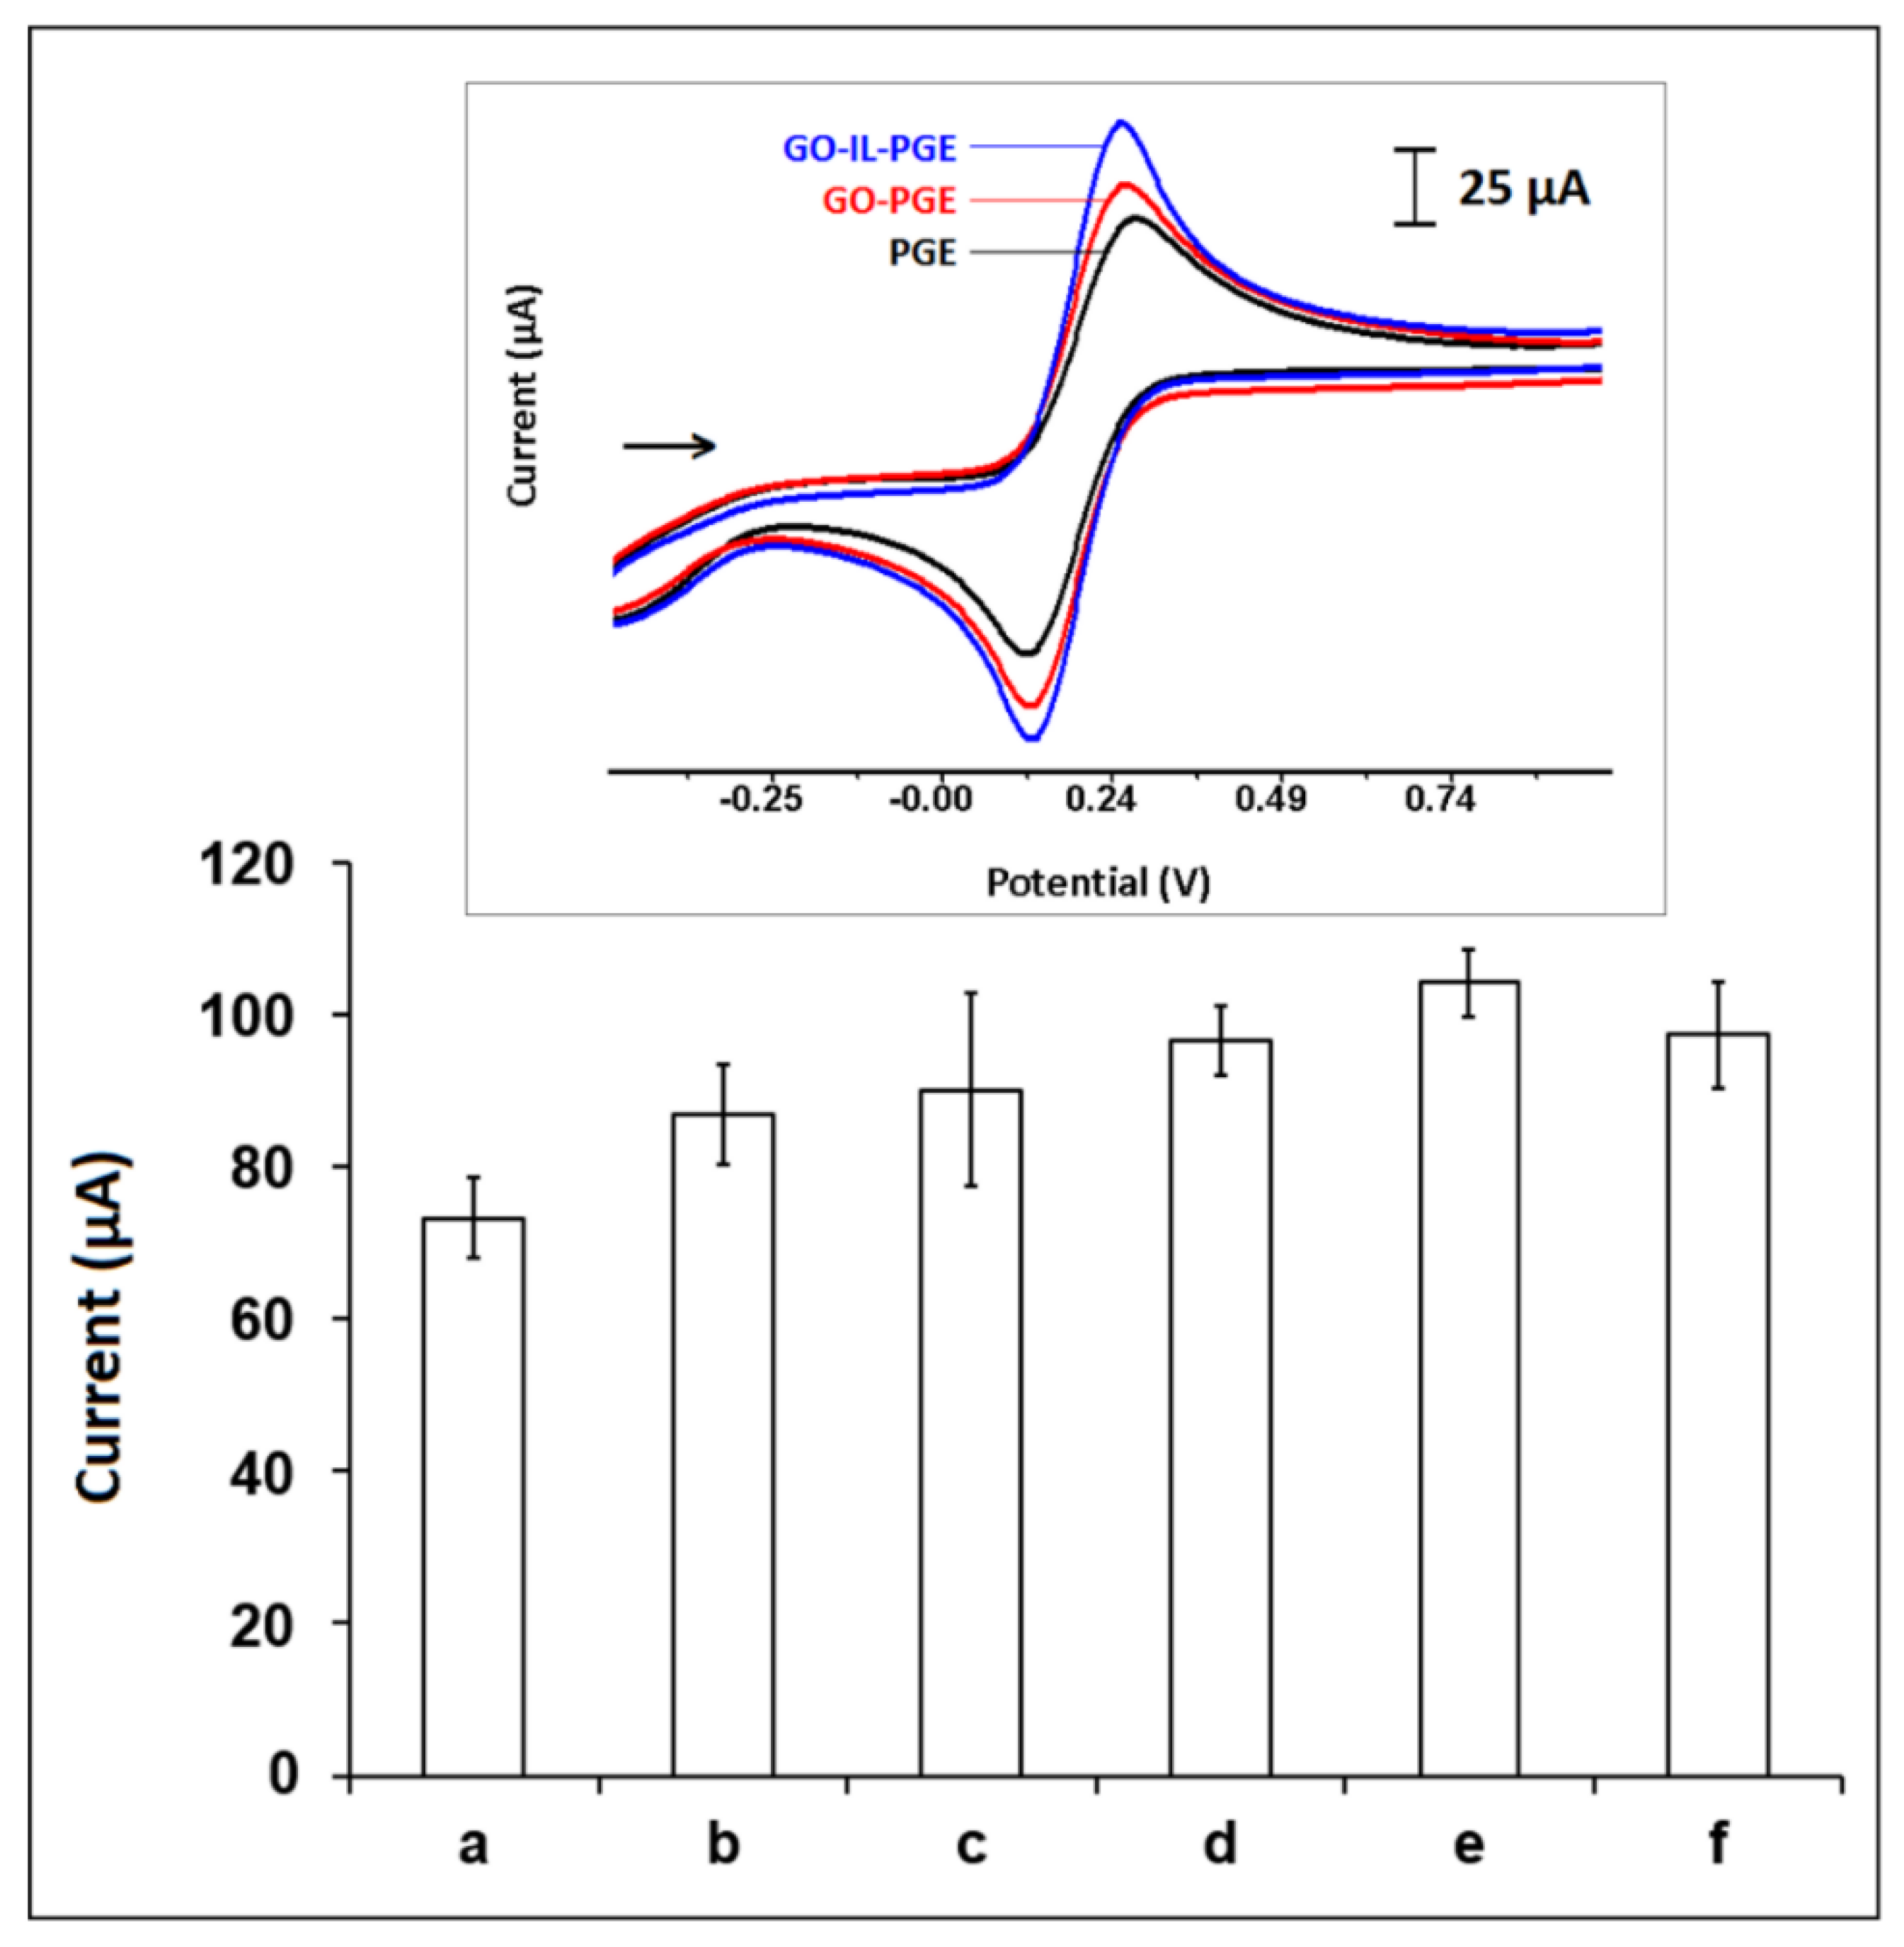
| Electrodes | Ia (µA) | Ic (µA) | Qa (mC) | Qc (mC) | ΔEp (mV) | A (cm2) |
|---|---|---|---|---|---|---|
| PGE | 73.22 ± 5.34 | 77.93 ± 6.88 | 1.73 | 0.97 | 0.173 | 0.221 |
| GO-PGE | 86.78 ± 6.61 | 90.63 ± 10.09 | 2.18 | 1.11 | 0.139 | 0.261 |
| GO-IL-PGE | 104.09 ± 4.37 | 100.61 ± 3.82 | 2.18 | 1.14 | 0.151 | 0.314 |
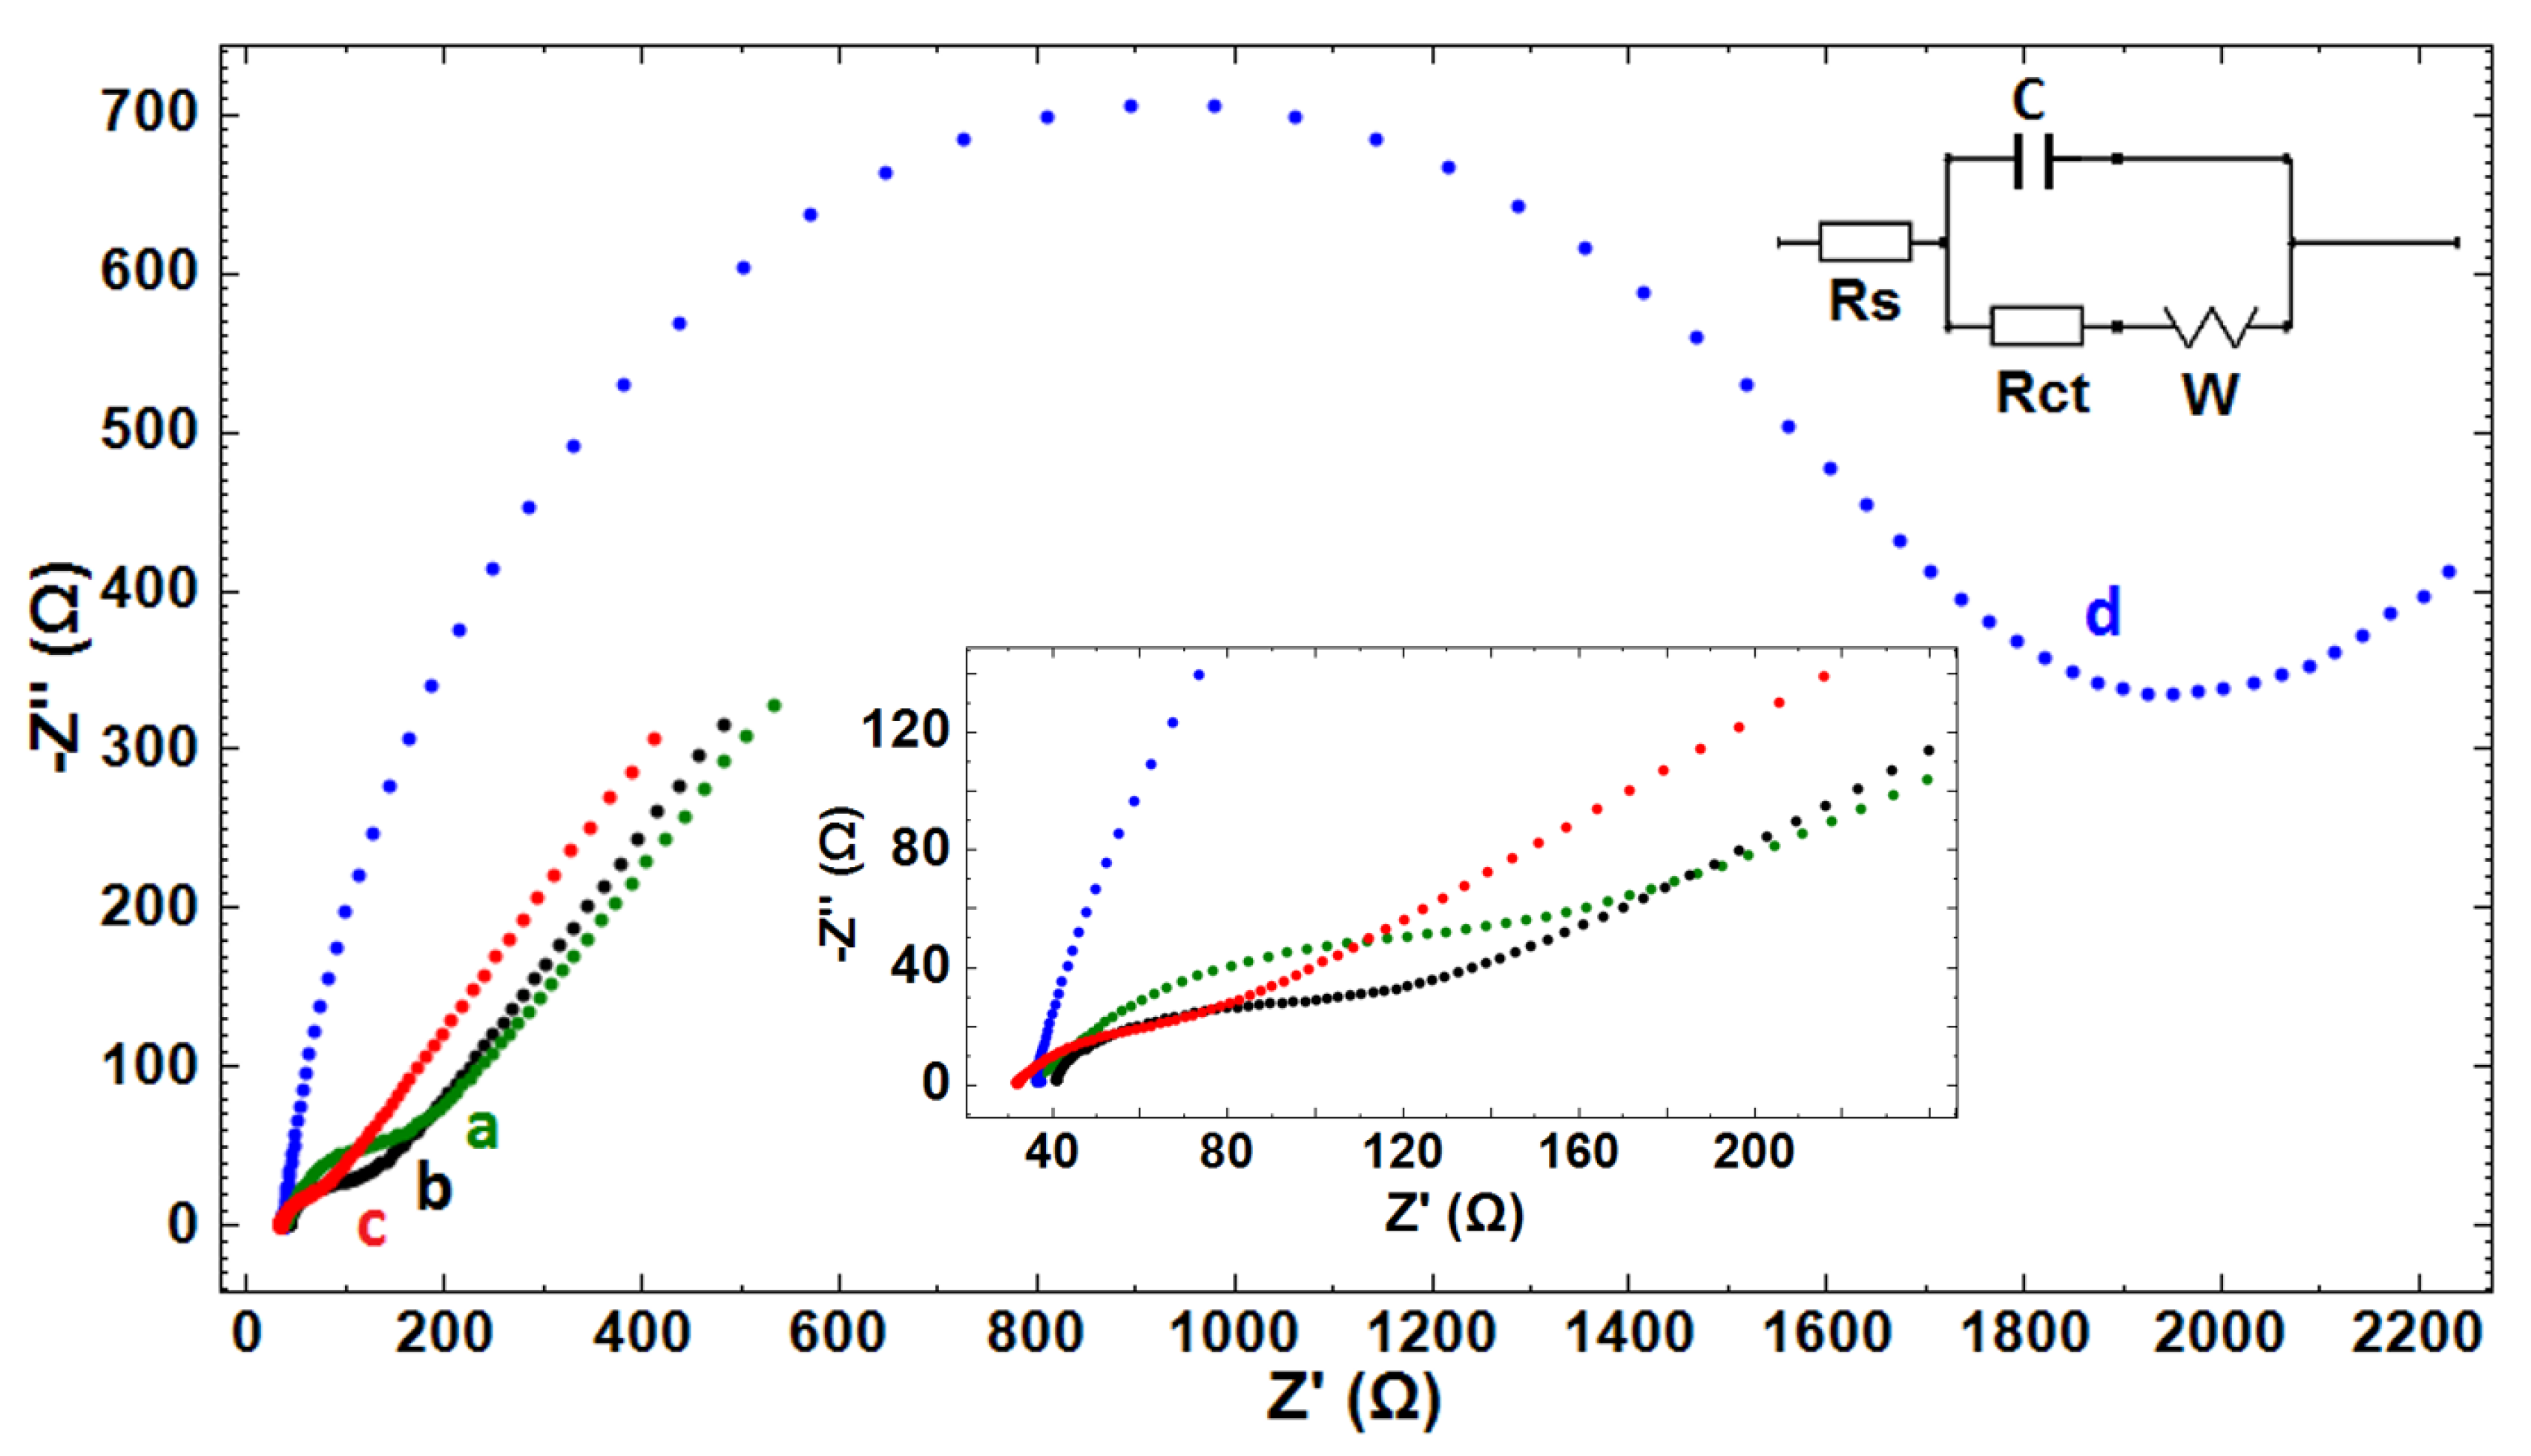
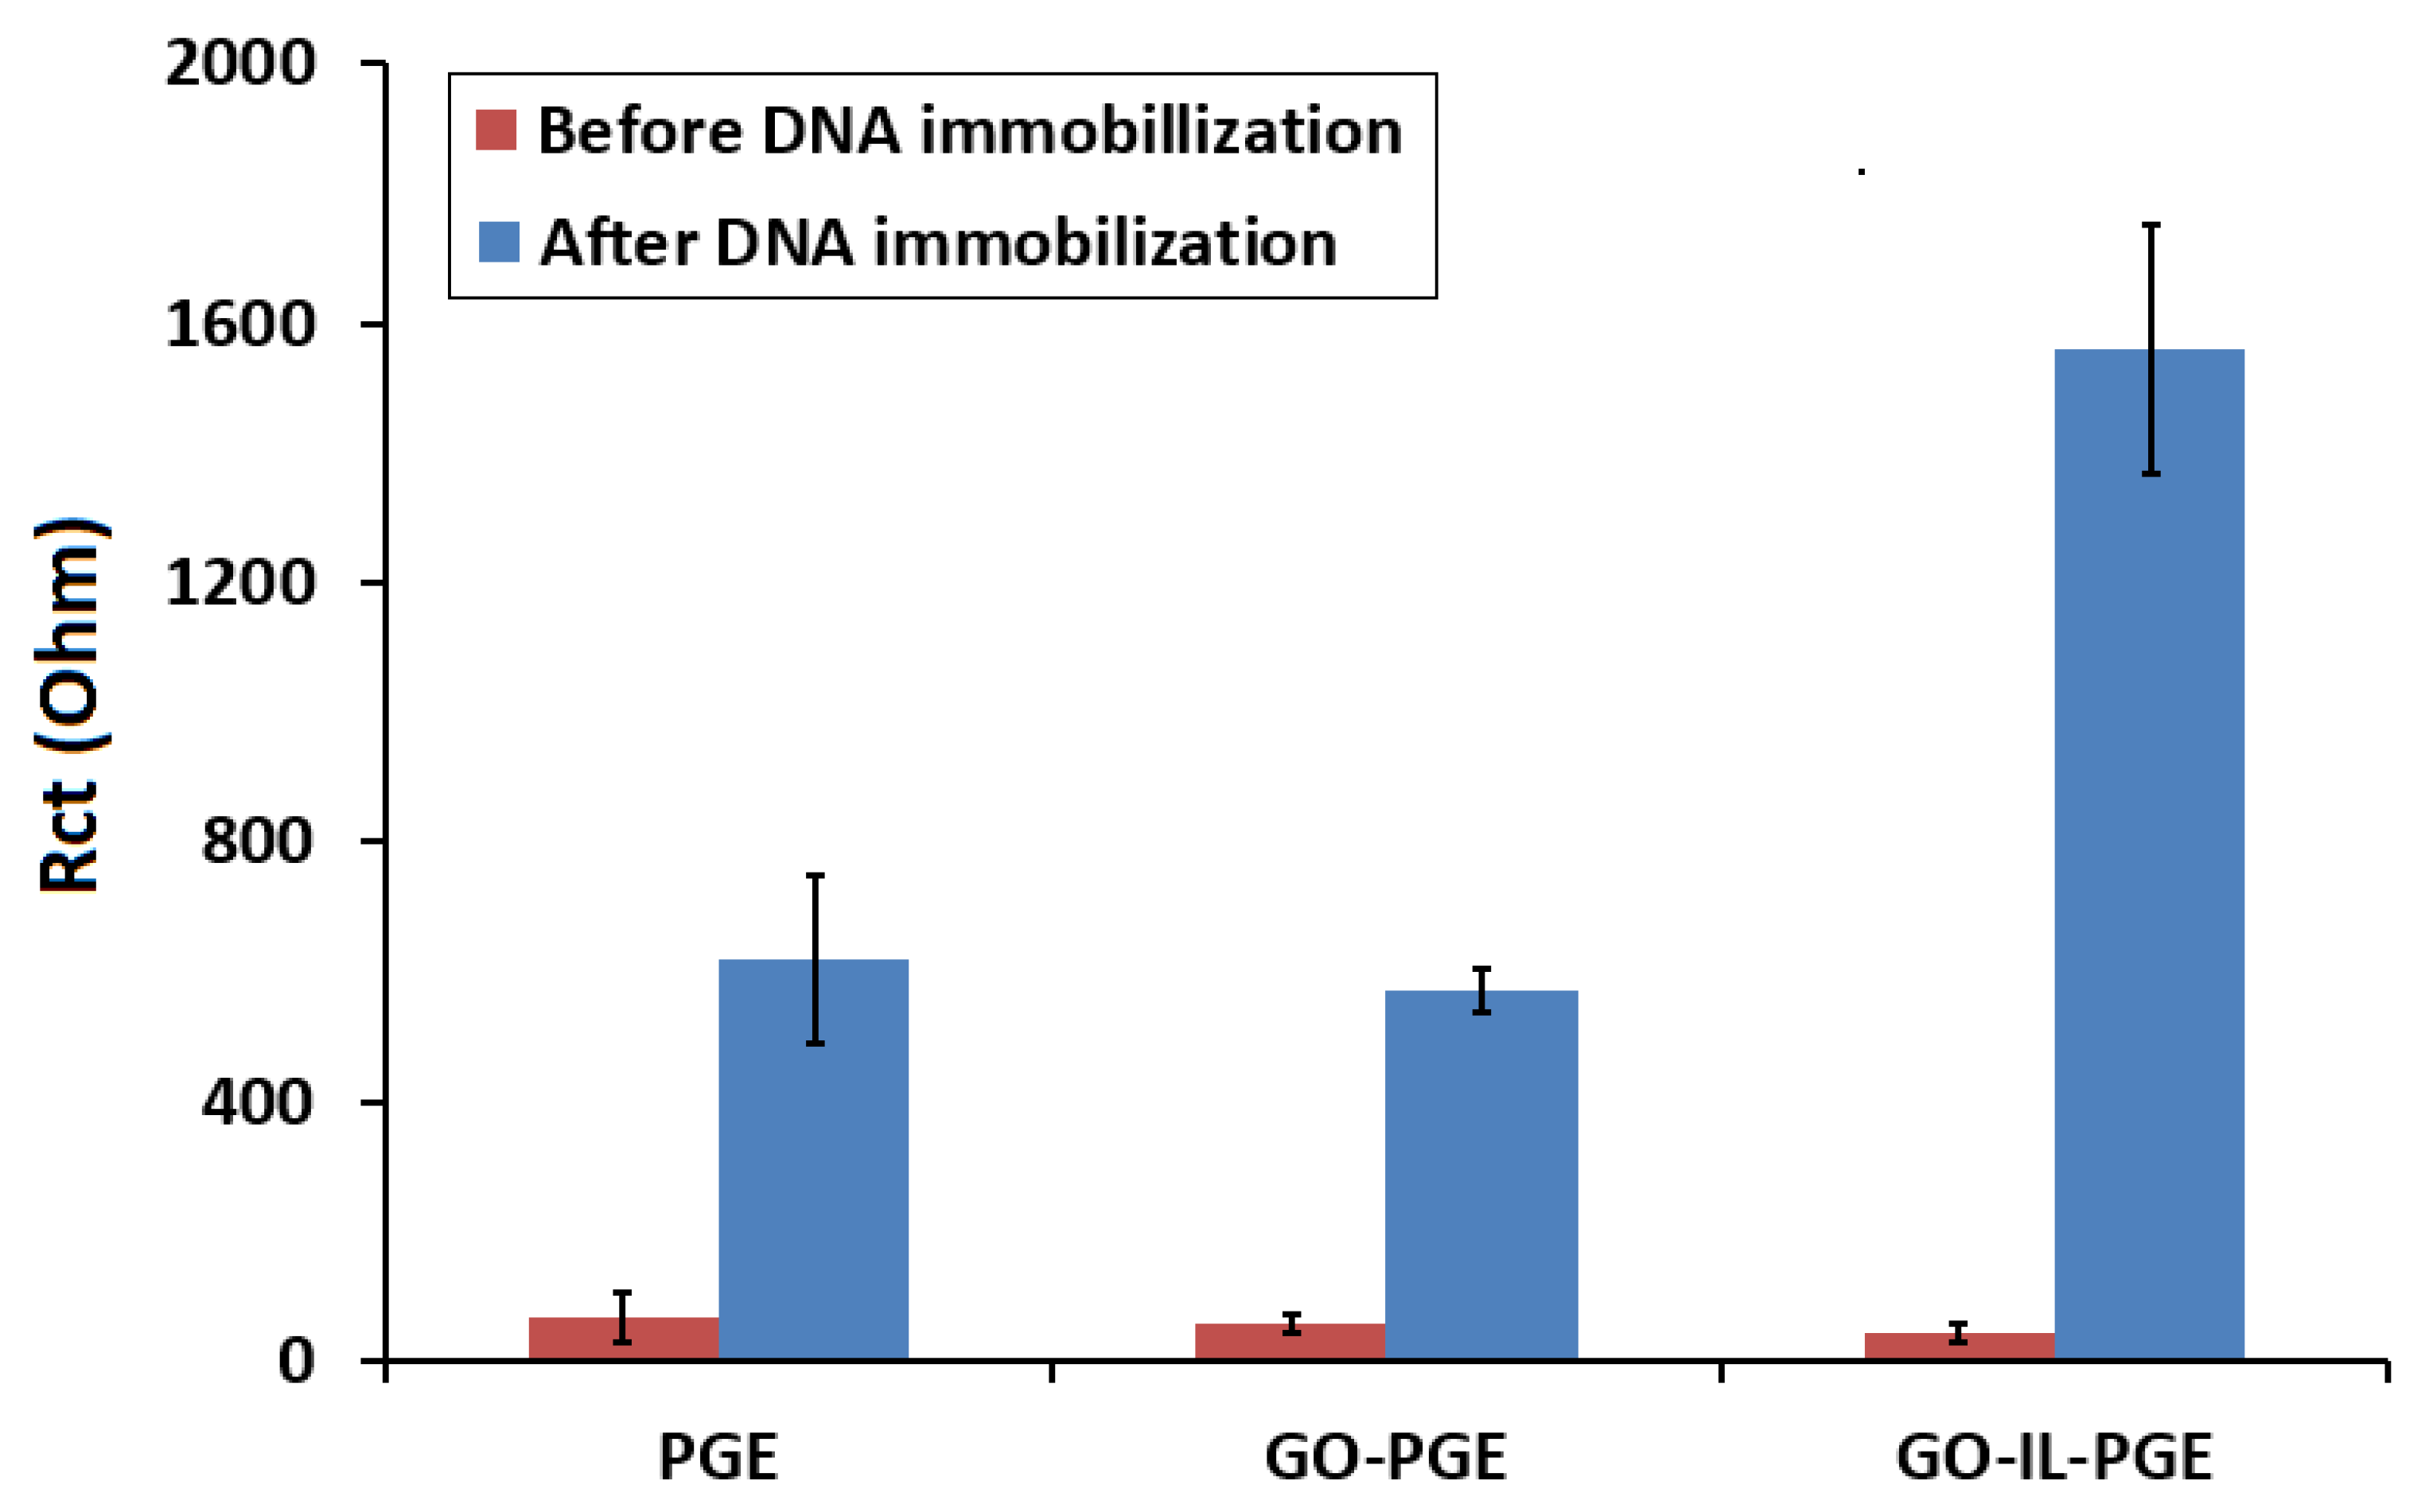
| Electrode | Rs (Ohm) | Rct (Ohm) | C (µF) | W (mMho) |
|---|---|---|---|---|
| PGE | 31.9 | 70.9 | 12.1 | 2.39 |
| GO-PGE | 40.8 | 48.3 | 6.57 | 2.14 |
| GO-IL-PGE | 29.5 | 43.2 | 11.7 | 2.72 |
| DNA-immobilized GO-IL-PGE | 37.8 | 1420 | 6.23 | 1.18 |
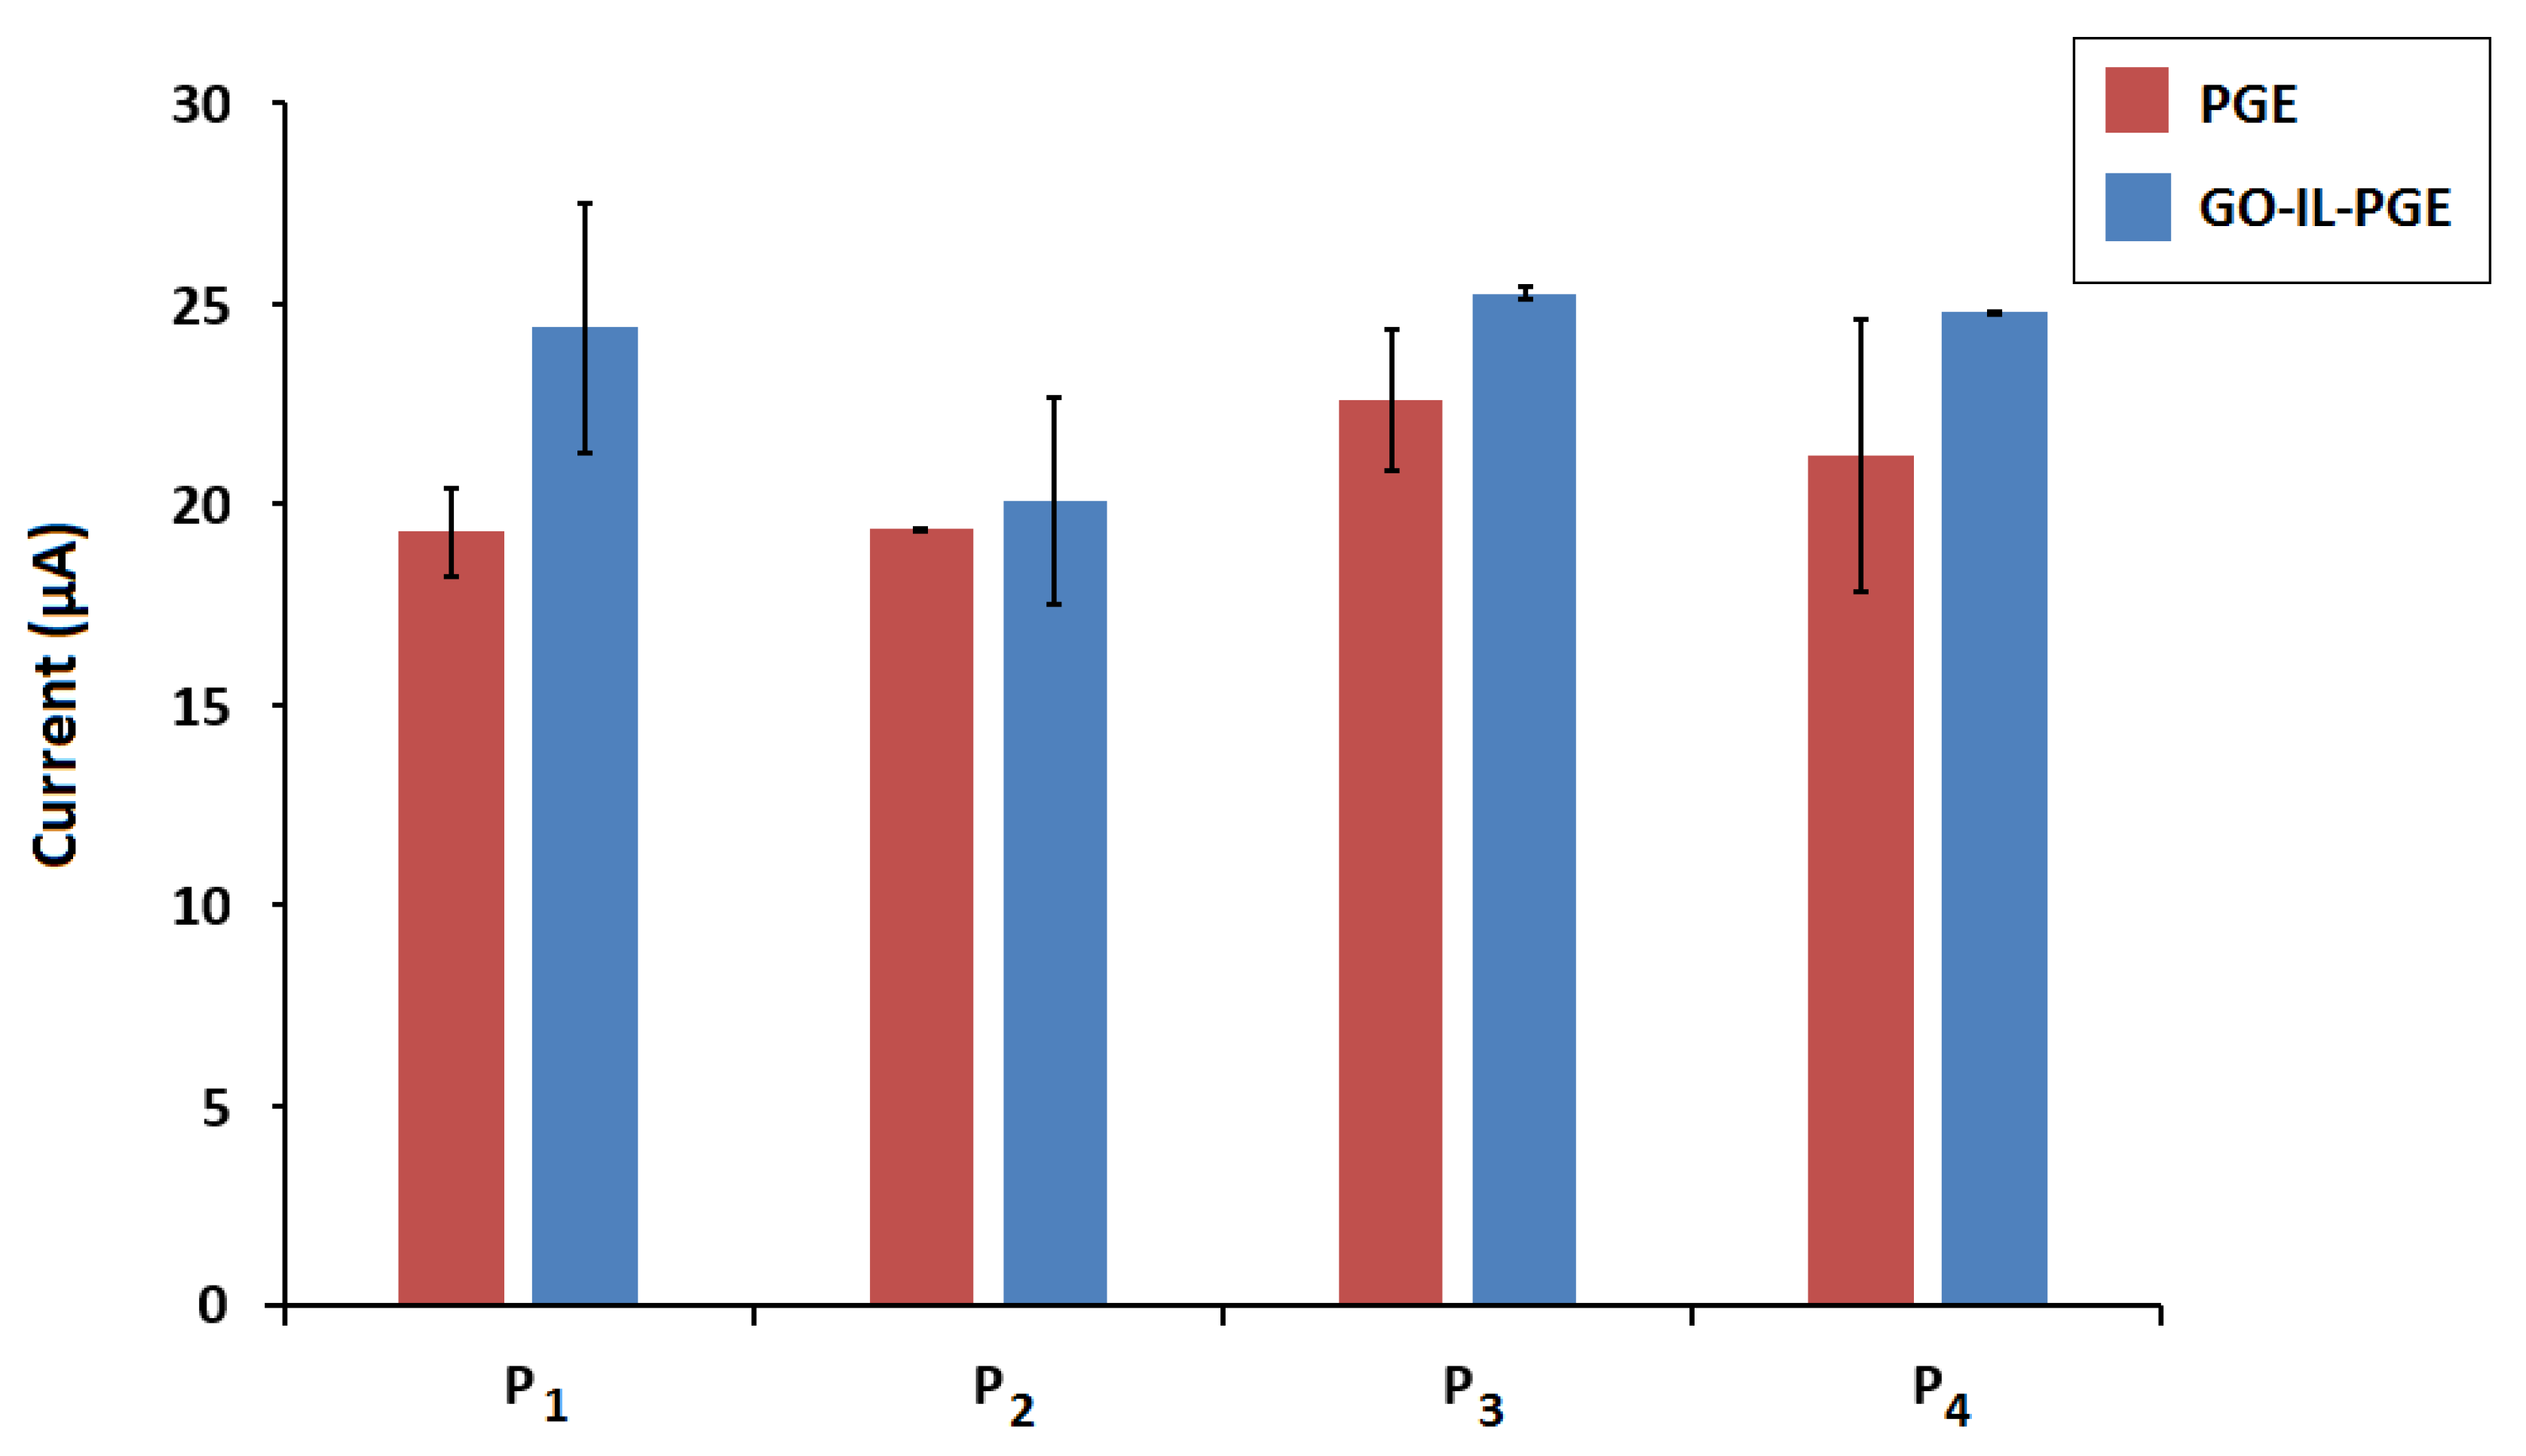
| Probe | Electrode | Current (µA) | RSD (%) | Increase (%) |
|---|---|---|---|---|
| P1 | PGE | 19.30 ± 1.12 | 5.85 | 26.4 |
| GO-IL-PGE | 24.40 ± 3.10 | 12.73 | ||
| P2 | PGE | 19.36 ± 0.05 | 0.26 | 3.74 |
| GO-IL-PGE | 20.09 ± 2.60 | 12.97 | ||
| P3 | PGE | 22.60 ± 1.76 | 7.82 | 11.77 |
| GO-IL-PGE | 25.26 ± 0.16 | 0.65 | ||
| P4 | PGE | 21.20 ± 3.40 | 16.05 | 17.05 |
| GO-IL-PGE | 24.80 ± 0.01 | 0.03 |
| Electrode | Modification | Method | LOD | Reference |
|---|---|---|---|---|
| SPE | SWCNT | EIS and DPV | 378.52 nM | [49] |
| GCE | GO/AuNP | CV and chronoamperometry | 1 fM | [50] |
| AuE | MCH | EIS and DPV | 0.05 nM | [51] |
| - | GO | 0.2 nM | [52] | |
| GCE | MWCNT | CV and chronoamperometry | 2 nM | [53] |
| AuE | Zwitterionic peptide | EIS | 0.3 fM | [54] |
| AuE | ZnONWs | DPV | 3.32 μM | [55] |
| GCE | (SIL-g-(N)GAs) | CV and DPV | 3 pM | [56] |
| SPE | AuNPs | CV and amperometry | 0.1 fM | [57] |
| PGE | GO-IL composite | DPV | 251 nM | This work |
Publisher’s Note: MDPI stays neutral with regard to jurisdictional claims in published maps and institutional affiliations. |
© 2022 by the authors. Licensee MDPI, Basel, Switzerland. This article is an open access article distributed under the terms and conditions of the Creative Commons Attribution (CC BY) license (https://creativecommons.org/licenses/by/4.0/).
Share and Cite
Işın, D.; Eksin, E.; Erdem, A. Graphene-Oxide and Ionic Liquid Modified Electrodes for Electrochemical Sensing of Breast Cancer 1 Gene. Biosensors 2022, 12, 95. https://doi.org/10.3390/bios12020095
Işın D, Eksin E, Erdem A. Graphene-Oxide and Ionic Liquid Modified Electrodes for Electrochemical Sensing of Breast Cancer 1 Gene. Biosensors. 2022; 12(2):95. https://doi.org/10.3390/bios12020095
Chicago/Turabian StyleIşın, Deniz, Ece Eksin, and Arzum Erdem. 2022. "Graphene-Oxide and Ionic Liquid Modified Electrodes for Electrochemical Sensing of Breast Cancer 1 Gene" Biosensors 12, no. 2: 95. https://doi.org/10.3390/bios12020095
APA StyleIşın, D., Eksin, E., & Erdem, A. (2022). Graphene-Oxide and Ionic Liquid Modified Electrodes for Electrochemical Sensing of Breast Cancer 1 Gene. Biosensors, 12(2), 95. https://doi.org/10.3390/bios12020095