Abstract
Superparamagnetic iron oxide nanoparticles (SPIONs) are commonly produced through wet-chemical methods that require high temperature and pressure and involve multiple synthesis steps. Our research group has developed an innovative, sustainable, and patented one-step aqueous synthesis operating at ambient temperature and pressure, enabling the direct production of SPIONs in suspension. In this work, we investigated the extension of this method to obtain polymer-coated SPIONs for biomedical imaging applications. Two water-soluble and biocompatible polymers—poly(ethylene glycol) (PEG) and poly(vinyl alcohol) (PVA)—were selected and prepared into twelve samples varying in polymer concentration and iron precursor molarity. Each formulation was characterized and compared to bare SPIONs synthesized with the same approach using X-ray diffraction (XRD), Fourier transform infrared spectroscopy (FT-IR), transmission electron microscopy (TEM), and alternating gradient magnetometry (AGM). The results confirm that the one-step method yields polymer-coated nanoparticles with a cubic spinel magnetite core. PEG produced spherical, monodisperse particles (10–30 nm) exhibiting superparamagnetic behavior but lower magnetization values (1–5 emu/g). In contrast, PVA-coated nanoparticles showed a morphology dependent on polymer concentration and reagent molarity, while maintaining an average size of ~10 nm and superparamagnetic behavior, with magnetization comparable to bare SPIONs (25–50 emu/g). A preliminary MRI evaluation of a selected PVA-coated sample revealed relaxivity values of r1 = 0.12 mM−1 s−1 and r2 = 6.44 mM−1 s−1, supporting the potential of this synthesis route for imaging-oriented nanomaterials.
1. Introduction
Iron oxide nanoparticles have emerged as highly versatile nanomaterials over the past few decades, finding applications in areas ranging from sensors, batteries, and catalysis to environmental remediation and biomedical technologies. This unique combination of magnetic properties, high surface area, safety, and biocompatibility makes them particularly attractive for biomedical applications [1,2,3,4,5]. Among these, Fe3O4 (magnetite) nanoparticles between 3 and 15 nm in size exhibit superparamagnetism, characterized by single-domain magnetization: they reach saturation under an external magnetic field yet exhibit negligible remanence once the field is removed. This property, together with their biocompatibility, underpins the widespread interest in SPIONs (superparamagnetic iron oxide nanoparticles) for applications, such as MRI contrast enhancement, drug delivery, cell labeling, and magnetic hyperthermia [6,7,8,9,10,11,12,13].
Despite their potential, producing SPIONs suitable for biomedical use remains challenging. Physical synthesis routes—including gas-phase deposition, electron beam lithography, pulsed laser ablation, laser-induced pyrolysis, ball milling, and combustion—often require complex, high-energy equipment and provide limited control over particle size, making them less ideal for clinical applications [14]. Biological approaches, using bacteria, fungi, or plant extracts, are environmentally friendly but often yield particles with poor uniformity and stability [15]. Chemical methods, such as coprecipitation, thermal decomposition, microemulsion, or hydrothermal synthesis, enable better control over particle size and monodispersity—crucial for magnetic and relaxation performance—but typically require high temperatures and multiple purification steps, limiting scalability and increasing costs [14,16,17].
Another critical factor for biomedical use is surface functionalization. Uncoated SPIONs tend to aggregate and can disrupt normal cellular functions at high local concentrations. Coating them with biocompatible polymers mitigates these issues, providing colloidal stability and enhanced biocompatibility. Both synthetic polymers (e.g., PEG, PVA, PVP, PLA) and natural polymers (e.g., dextran, chitosan, polypeptides) have been extensively explored for SPION functionalization [17,18,19,20].
To address these challenges, our group at the University of L’Aquila (Italy) developed a patented, one-step, room-temperature aqueous synthesis of monodisperse Fe3O4 nanoparticles [21,22,23]. This method operates under ambient conditions, avoids post-synthesis purification, and generates no toxic waste. Building on this platform, we further improved biocompatibility and colloidal stability by coating nanoparticles with hydrophilic polymers. PEG and PVA were selected due to their steric stabilization capabilities and proven efficacy in SPION-based biomedical applications [11,24,25,26].
Beyond improving colloidal stability and biocompatibility, polymer coatings also play a crucial role in determining the magnetic and relaxation properties of SPIONs, which directly affect their performance as MRI contrast agents. SPIONs reduce the longitudinal (T1) and transverse (T2) relaxation times of nearby water protons, with a stronger effect typically on T2, leading to signal attenuation in T2-weighted images—a hallmark of superparamagnetic agents [20,27,28]. Relaxivity parameters, r1 and r2, quantify these effects and provide standard metrics to compare formulations and evaluate the impact of different coatings. Previous studies have shown that both the thickness and chemical nature of polymer coatings can significantly influence SPION relaxivity [29,30,31]. For instance, PEG chain length and thinner PEG coatings substantially increase T2 relaxivity, while variations in r1 and r2 have been demonstrated with different biocompatible polymers such as PEG, PCL, chitosan, and dextran [32,33]. The effect of the polymer layer thickness on relaxivity has been investigated, showing that increasing coating thickness can reduce R2 due to the exclusion of water protons from the high-field region near the magnetic core [34].
The scientific literature specifically addressing PVA-coated SPIONs is considerably less extensive than that dedicated to more common coatings, such as PEG or dextran. The existing studies primarily focus on the effects of PVA on colloidal stability and magnetic properties, while quantitative MRI relaxivity data (r1 and r2) remain limited and often difficult to compare due to differences in measurement conditions [35]. This scarcity of systematic relaxivity reports makes it challenging to assess the actual impact of PVA on MRI performance and highlights the need for controlled studies, such as the one presented here.
Preliminary MRI studies on a representative PVA-coated sample synthesized via our one-step method confirmed the expected predominance of transverse over longitudinal relaxation, consistent with the behavior of superparamagnetic iron oxide nanoparticles reported in the literature. These findings highlight the potential of our sustainable synthesis route to produce polymer-coated SPIONs with relaxation properties compatible with imaging applications and motivate further investigation into the effects of polymer identity and synthesis conditions on MRI performance.
2. Materials and Methods
For the synthesis of SPIONs coated with PVA or PEG, the following reagents were considered: iron(III) chloride hexahydrate (FeCl3·6H2O) and iron(II) chloride tetrahydrate (FeCl2·4H2O) supplied by Carlo Erba Reagents (Milano, IT); anionic exchange resin, used in OH- form, (R-OH) Euroresin SAG-1 FB, supplied by Sicania Chimica (Catania, IT); polyethylene glycol (PEG) with a length chain of 2000 units (PEG-2000) with a molecular weight of 1900–2200 g/mol, and polyvinyl alcohol (PVA), with a molecular weight of 89,000–98,000 g/mol, both supplied by Sigma Aldrich (St. Louis, MO, USA). The only solvent used was distilled water.
Three weight percentages of polymer in water for each polymer were considered: (a) 25%, 50%, and 75% for PEG, and (b) 0.1%, 0.2%, and 0.3% for PVA. Then, for each kind and amount of polymer, the syntheses were carried out according to two different concentrations of iron (III) chloride in water, 0.1 M and 0.3 M. Therefore, for each polymer, six aqueous suspensions of coated SPIONs were produced, named 1PEGx and 3PEGx (x = 25, 50, 75), or 1PVAy and 3PVAy (y = 0.1, 0.2, 0.3), as summarized in Table 1. In addition, to evaluate the differences arising from the presence of polymers, a synthesis without polymers was performed (sample SPION).

Table 1.
Summary of the syntheses, in relation to PEG and PVA polymers and iron concentrations.
For each synthesis, the polymer was dissolved in water until complete solubilization. Then, the iron chlorides in a molar ratio of 2:1 of Fe (III) and Fe (II) were added. In the obtained solution was then poured an anionic resin in order to produce the Fe3O4 nanoparticles, according to the following reaction [21]:
where R-Cl indicates the resin in Chloride form, occurring after the exchange of OH/Cl.
2FeCl3 + FeCl2 + 8(R-OH) → Fe3O4 + 4H2O + 8(R-Cl)
The mixing with the anionic resin was carried out under moderate stirring (300 rpm) in air, at room temperature (25 °C) and ambient pressure, for 10 min, according to the procedure previously described [21]. After 10 min, the obtained suspension was separated from the exhaust resin by means of a sieving procedure (mesh < 200 µm). The resin in Cl-form (R-Cl) can be, in turn, regenerated by means of an 8 wt% NaOH aqueous solution, to be reused for another production, according to a cyclic procedure, as shown in Figure 1.
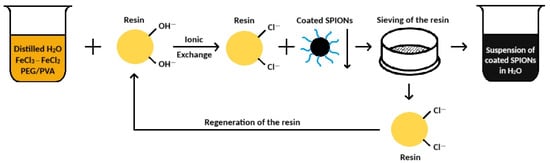
Figure 1.
The cyclic process to obtain the coated iron oxide nanoparticles.
The aqueous suspensions from PEG-SPION and PVA-SPION syntheses were characterized by X-Ray Diffraction (XRD) to analyze crystalline structure and crystallinity. Before analysis, a volume of 0.2 mL was homogenously taken from each suspension and left to dry on a zero-background sample holder. XRD scans were recorded in the range 5–80° 2θ, with a step size of 0.026° 2θ, by a PANalytical X’Pert PRO apparatus (Almelo, The Netherlands), with Cu-Kα radiation, equipped with diffracted-beam optics and a PIXCel 1D detector equipped with a monochromator to reduce noise and fluorescence signals. Each experimental diffraction pattern was elaborated by the High Score Plus softwareversion 4.6a (PANalytical, Almelo, The Netherlands), and crystalline phases were attributed by ICDD and ICSD reference databases. The crystalline domain size was estimated using the Scherrer equation, based on the full width at half maximum (FWHM) of the most intense diffraction peaks.
Infrared spectroscopy FT-IR (Nexus FT-IR, ThermoNicolet, Madison, WI, USA) was performed on the dried suspension samples, both on SPIONs and PEG-SPIONs/PVA-SPIONs, in order to analyze the polymer adsorption on the surface of Fe3O4 nanoparticles. Pure PEG and PVA FT-IR spectra were acquired as well, in order to check their contribution to the signal.
The iron concentration of the coated samples was determined by inductively coupled plasma–optical emission spectroscopy (ICP-OES 5100, Agilent Technologies, Santa Clara, CA, USA).
The weight of polymer in the obtained samples was measured by thermogravimetric analysis (TGA) with a TG-DTA Linseis L81 (Linseis, Selb, Germany). The samples were heated up to 700 °C at 10 °C/min in a static air atmosphere.
Particle size and morphology were analyzed by transmission electron microscopy (TEM Bright Field, Philips CM100, Philips, Eindhoven, The Netherlands). The samples were prepared by dropping each aqueous suspension on a suitable copper grid, which was then analyzed after the evaporation of water. ImageJ software version 1.54g was used to determine the particle size distribution as well.
Magnetic characterization was carried out by means of PMC Micromag 2900 Alternating Gradient Magnetometer (Lakeshore Cryotronics, Westerville, OH, USA). Measurements of magnetization curves up to 12 kOe (1.2 T) were taken at room temperature.
The evaluation of relaxivity parameters was carried out with a 1.0 T preclinical MRI scanner from Aspect Imaging (Shoham, Israel). For each sample, five vials with distilled water solutions at different concentrations (0.01, 0.02, 0.05, 0.1, 0.2 g/L) were prepared and analyzed along with a reference vial of distilled water. The solenoid radiofrequency coil (6.0 cm inner diameter and 10 cm length) allowed for the insertion of all six vials at the same time. For the evaluation of T1, a series of Spin Echo images were acquired, with: Field of View (FOV) of 64 × 48 mm2; 1 mm in-plane resolution; 6 mm slice thickness; Echo Time (TE) = 4.1 ms; and 12 different Repetition Time (TR) values (TR = 50, 100, 150, 250, 350, 500, 750, 1000, 1500, 3000, 5000, and 10,000 ms). T1 maps were calculated by the exponential signal recovery within each image voxel, and the T1 value of each sample was given by the average of the corresponding vial’s voxels. The unavailability of a multi-echo Spin Echo MRI sequence prevented the acquisition of T2 relaxation mapping from images. Thus, we used a whole-sample Fast Spin Echo pulse sequence with echo train length equal to 128 and disabled gradients, allowing for CPMG (Car–Purcell–Meiboom–Gill) acquisition of every single vial with TE = 4.4 ms, extracting T2 from the echoes’ amplitude exponential decay. Then, the relaxivity parameters r1 and r2 were obtained from the linear fittings of 1/T1 and 1/T2 versus the iron concentration of the vials.
3. Results and Discussion
3.1. X-Ray Diffraction (XRD)
The XRD pattern of the sample SPION is reported in Figure 2. From the analysis, it perfectly matched the cubic spinel structure of magnetite crystalline structure (ICSD standard reference code: 98-005-0273 [36]).
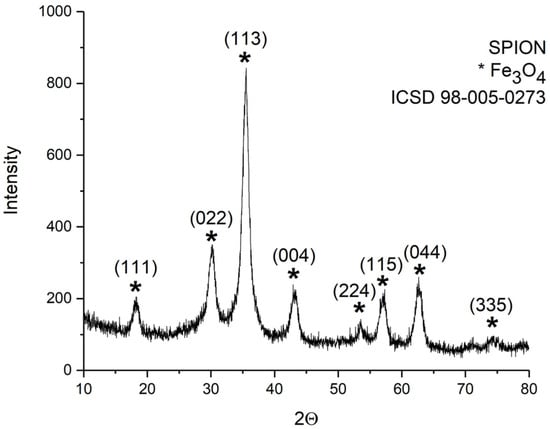
Figure 2.
XRD patterns of the dried suspension samples obtained by the synthesis performed without polymers (sample SPION). All the Bragg peaks match the cubic spinel structure of magnetite (ICSD 98-005-0273).
XRD patterns of PEG-SPIONx and PVA-SPIONy samples are reported in Figure 3 and Figure 4, respectively. In both samples, the magnetite Bragg peaks are quite recognizable and match the ICSD standard pattern. Since high-chain-length PEG is semicrystalline, the peaks that match the standard pattern of PEG (ICDD 00-049-2095) are also present in the PEG-SPIONx samples [37].
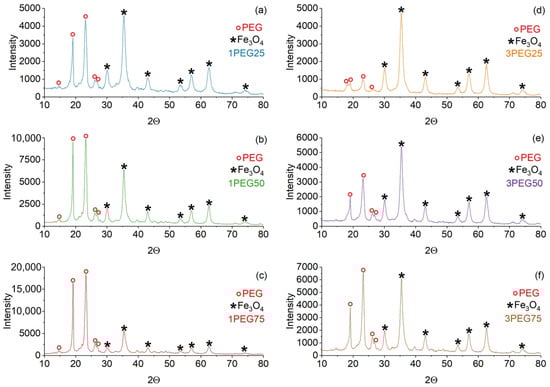
Figure 3.
XRD patterns of PEG-SPION dried samples. On the left: (a) 1PEG25; (b) 1PEG50; (c) 1PEG75. On the right: (d) 3PEG25; (e) 3PEG50; (f) 3PEG75. The red circle marker represents the PEG peaks, while the black star marker represents the Fe3O4 peaks.
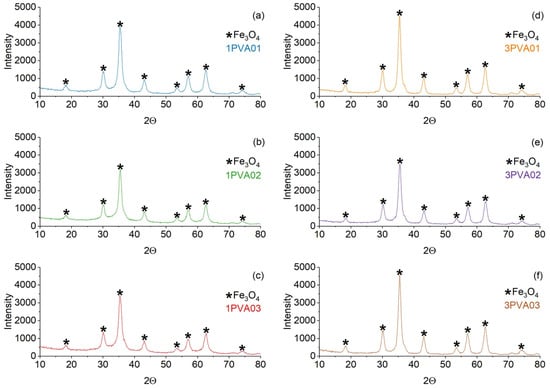
Figure 4.
Comparison of the XRD patterns of the PVA-SPION samples. On the left: (a) 1PVA01; (b) 1PVA02; (c) 1PVA03. On the right: (d) 3PVA01; (e) 3PVA02; (f) 3PVA03. The black star marker represents the Fe3O4 peaks.
Average crystallite sizes of the magnetite phase, calculated by the Scherrer formula, of each sample are reported in Table 2. From the results, we can observe that the PVA-SPIONy samples show the lowest values of average crystal size of the magnetite core (4.8–6.6 nm) with respect to PEG-SPIONx samples (8.3–10.4 nm). Remarkably, the PVA-SPIONy samples show a similar range to that of the bare SPIONs [21,22].
Table 2.
Average crystallite size of magnetite core calculated by Scherrer equation.
3.2. FT-IR Analyses
FT-IR analysis of SPION samples revealed the characteristic absorbance spectrum of the Fe-O bond in nano-magnetite, at 405 and 418 cm−1 (split of ν1 band) and 545 cm−1 (ν2 band) [38,39]. The bare PEG and PVA samples show their typical infrared absorbance peaks. Specifically, the bare PEG sample demonstrated the following: the CH out-of-plane bending vibrations at 947 cm−1 and 2871 cm−1; the CH2 vibrations at 1271 cm−1 and 1456 cm−1; and the C-O-C ether stretch and vibrations at 883 cm−1, 1138 cm−1, and 1351 cm−1 [38,39,40]. In contrast, the bare PVA sample exhibited the following: the CH deformation and stretching vibrations at 1317 cm−1 and 2904 cm−1, and the C-O stretching vibrations at 1090 cm−1 [41,42]. In addition, in all these samples, a broad band of absorbance around 3200–3500 cm−1 reveals the presence of hydroxyl groups attached to the surface [39].
The series of PEG-SPIONx samples is reported in Figure 5 and Figure 6. From these results, the Fe-O broad peak at 545 cm−1, originally observed in the SPION sample, is split into two sharper peaks, at 508 cm−1 and 528 cm−1. This change could indicate a change in the environment and the formation of bonds between the Fe3O4 and the PEG [38,39]. For the same reason, we find that the C bonds of PEG and the Fe-O bond of magnetite are present in all the PEG-SPION samples, but with a little shift.
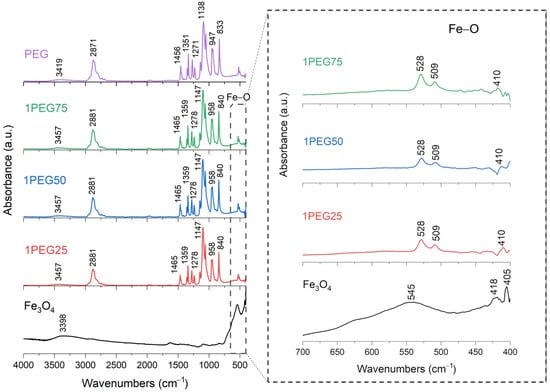
Figure 5.
FT-IR analysis of 1PEG25, 1PEG50, 1PEG75 samples. In the inset: the absorption bands of the Fe-O bond at 545 cm−1, to underline the shift towards lower wavenumbers and the splitting characteristics of PEG-SPION samples.
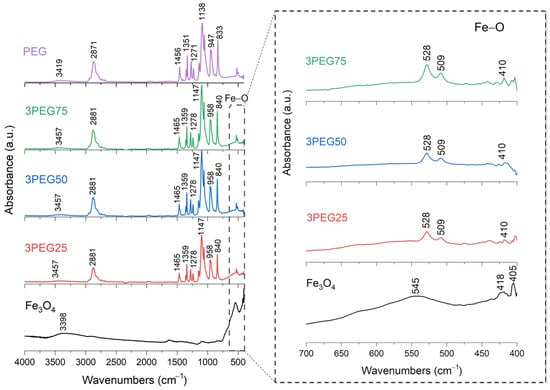
Figure 6.
FT-IR analysis of 3PEG25, 3PEG50, 3PEG75 samples. In the inset: the absorption bands of the Fe-O bond at 545 cm−1, to underline the shift towards lower wavenumbers and the splitting characteristics of PEG-SPION samples.
FT-IR results for PVA-SPIONy samples are shown in Figure 7 and Figure 8. In this case, a decrease in the absorbance band related to the Fe–O bond is observed at increasing PVA concentrations due to the formation of bonds between Fe3O4 and PVA [42].
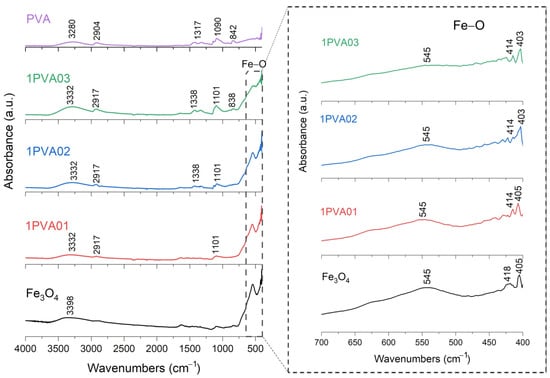
Figure 7.
FT-IR analysis of 1PVA01, 1PVA02, 1PVA03 samples. In the inset: the absorption bands of the Fe-O bond at 545 cm−1, to underline the shift towards lower wavenumbers and decreasing signal characteristics of PVA-SPION samples.
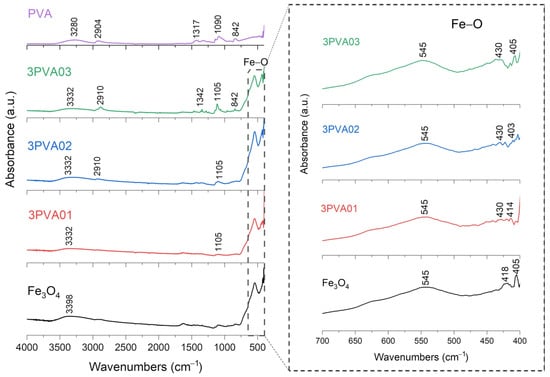
Figure 8.
FT-IR analysis of 3PVA01, 3PVA02, 3PVA03 samples. In the inset: the absorption bands of the Fe-O bond at 545 cm−1, to underline the shift towards lower wavenumbers and decreasing signal characteristics of PVA-SPION samples.
To summarize, these FT-IR results reveal distinct interactions between Fe3O4 and each polymer. For the PEG-SPIONx sample, the splitting of the Fe-O band suggests a modification of the local environment around the Fe–O bonds, and PEG-specific C bands remain present but exhibit slight shifts; in contrast, PVA-SPIONy shows a decrease in the Fe-O band absorbance with increasing PVA. Overall, these observations imply that PEG coating modifies the Fe–O environment while maintaining its spectral visibility, whereas PVA coating results in the partial suppression of Fe–O vibrations.
3.3. ICP-OES Analyses
The iron concentration of the polymer-coated samples was determined by ICP-OES. The results showed that the mass percentages of Fe to the total weight of the coated samples were under 50% for the PEG-SPIONx series and above 55% for the PVA-SPIONy series. These results indicate that for the PEG-SPIONx samples, the quantity of magnetite, in weight, is lower than that of the PVA-SPIONy samples, probably due to the higher concentrations of PEG used.
The exact percentages for all samples are reported in Table 3.
Table 3.
Mass percentages of Fe in the PEG-SPIONx and PVA-SPIONy samples.
3.4. TGA
The amount of polymer in each sample was determined by TGA, measured as the loss of weight of every sample at the end of the analysis, which was conducted up to 700 °C to ensure the total combustion of the polymer [38,41]. The polymer amount for the PEG-SPIONx series was more than 50% for all samples, while for the PVA-SPIONy series, the polymer amount was under 10%. These results confirm that PEG-SPIONx samples contain, in weight, lower amounts of magnetite than PVA-SPIONy, as seen in the ICP-OES analyses.
The exact percentages for all samples are reported in Table 4.
Table 4.
Polymer amount percentages of PEG-SPIONx and PVA-SPIONy samples.
3.5. TEM Analyses
The morphologies and sizes of the prepared polymer-modified magnetite were analyzed by TEM. For this aim, at first, we observed the prepared magnetite (Fe3O4) NPs alone, as shown in Figure 9. Both the morphology and monodispersed distribution of the magnetite particles offer an important starting point, allowing for a uniform surface area for coating and conjugation of targeting ligands or therapeutic agents.
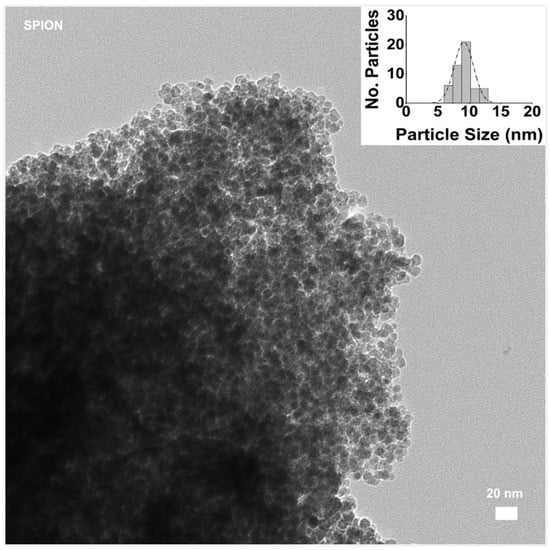
Figure 9.
TEM image of SPION sample without polymer addition, bar size 20 nm. (In the inset, the distribution of particle size evaluated with ImageJ software).
TEM images of the PEG-SPIONx and PVA-SPIONy samples allowed for evaluating how morphologies and particle sizes changed with the addition of polymers, as shown in Figure 10 and Figure 11, respectively.
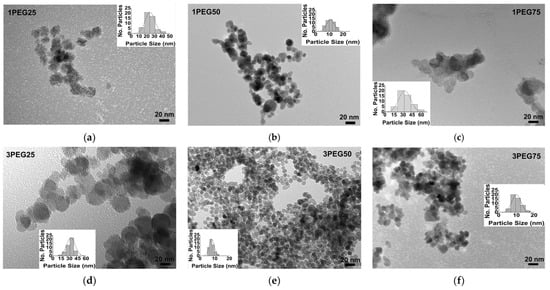
Figure 10.
TEM images of PEG-SPIONx samples: (a) sample 1PEG25, bar size 20 nm; (b) sample 1PEG50, bar size 20 nm; (c) sample 1PEG75, bar size 20 nm; (d) sample 3PEG25, bar size 20 nm; (e) sample 3PEG50, bar size 20 nm; (f) sample 3PEG75, bar size 20 nm. The evaluation of the size distribution of the particles with ImageJ software is reported in the inset of every figure.
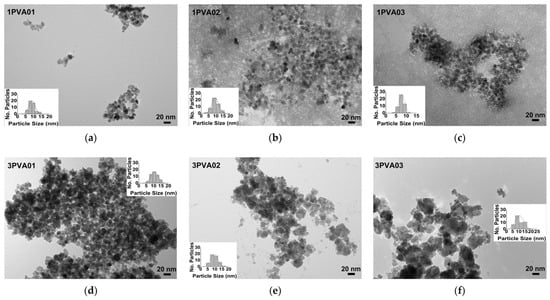
Figure 11.
TEM images of PVA-SPIONy samples: (a) sample 1PVA01, bar size 20 nm; (b) sample 1PVA02, bar size 20 nm; (c) sample 1PVA03, bar size 20 nm; (d) sample 3PVA01, bar size 20 nm; (e) sample 3PVA02, bar size 20 nm; (f) sample 3PVA03, bar size 20 nm. The evaluation of the size distribution of the particles with ImageJ software is reported in the inset of every figure.
The TEM images revealed a spherical morphology of all PEG-SPION particles, independent of the different synthesis conditions, revealing an equiaxial homogeneous coverage of each particle. However, the particles appeared joined to one another, except for the 3PEG50 sample (Figure 10e). In addition, these observations showed a strong influence of PEG amounts and molar concentration of the iron aqueous solutions (0.1 M or 0.3 M) on the particle’s dimensions. Specifically, at a low polymer amount and at the highest iron molar concentration, an increase in particle size was observed; as the polymer amount increased, a slight decrease in dimension was visible at the highest iron molar concentration. The combination of 50% PEG and the highest iron molar concentration (0.3 M) achieved a monodispersed distribution of PEG-SPIONs, less than 10 nm in size.
The observation of PVA-SPIONs samples (Figure 11) showed similar particle sizes when the lowest iron molar concentration and the lowest PVA concentration were considered, with spherical particles having a monodispersed distribution. On the contrary, in the 1PVA02 sample and 1PVA03 sample (Figure 11b,c), the particles appeared surrounded by uniform polymer distribution, as also observed in previous studies, indicating that, at this molar concentration of the reagents, the presence of PVA may promote the growth of colloidal nanocrystal clusters (CNCs) [43]. In the 3PVA02 and 3PVA03 samples (Figure 11e,f), similar agglomerates of overlapping pseudohexagonal particles were observed, underlining a well-defined influence of the polymer concentration on particle morphology.
The average values of particle size, with the respective standard deviations, are reported in Table 5. A graphic visualization of the change in particle size due to the variation in polymer concentration is shown in Figure 12.
Table 5.
Mean values of particles’ dimensions evaluated from TEM images at low magnification.
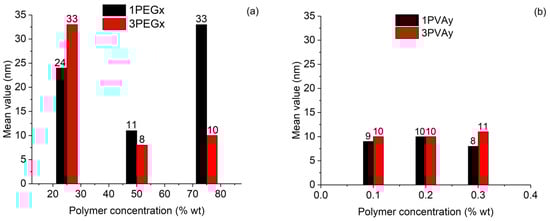
Figure 12.
Influence of polymer concentration on size dimension of particles: (a) PEG-SPIONs samples; (b) PVA-SPIONs samples.
From these results, we can observe that, when PEG was considered, strong deviations from the 50 wt% addition increased the particle dimensions obtained at low iron concentration. On the contrary, high iron concentration allowed for the particle size to remain around 10 nm only if PEG addition was equal to or higher than 50 wt%. In the case of a PVA addition, a more stable particle size around 10 nm was observed, with a slight average decrease when a low iron concentration was considered.
3.6. AGM
The AGM measurements are reported below (Figure 13), with specific magnetizations of the samples normalized using the total mass of the samples.
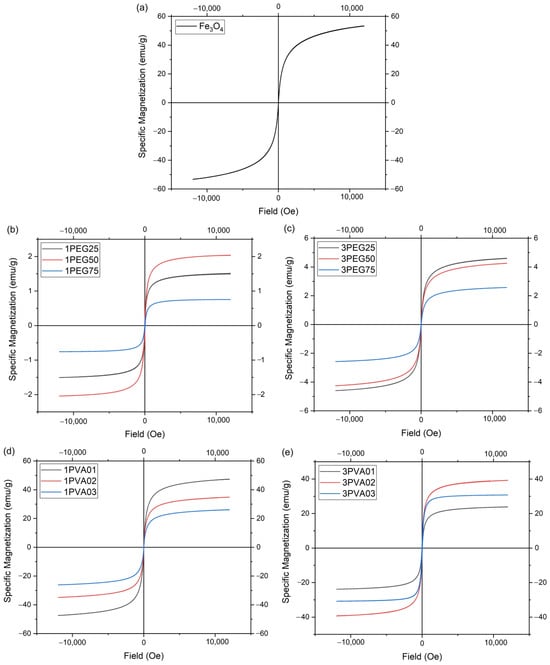
Figure 13.
AGM measurements: (a) bare SPIONs; (b) 1PEGx; (c) 3PEGx; (d) 1PVAy; (e) 3PVAy.
The 1PEG and 3PEG samples (Figure 13b,c) showed no hysteresis loop at each concentration, which meant that the particles exhibit superparamagnetic behavior. The 1PEG50 sample exhibited the highest magnetization value of the 1PEG series, while the 3PEG series had a decrease in the magnetization value across increasing polymer concentrations. The 3PEG series had higher magnetization values than the 1PEG series, but all the samples had a much lower magnetization value than the bare magnetite nanoparticles produced with the patented method [21,22]. This can be explained in part by the low ratio of Fe, as seen by ICP-OES analysis, and the great fraction of PEG present in the samples, as seen by the TGA, as the magnetic saturation of magnetite nanoparticles decreased significantly with the increasing coating thickness of the non-magnetic layer [38], in part due to other causes. For example, the contamination and deterioration of surface spins of the magnetite core caused by the polymer coating, as seen in similar cases [37].
The 1PVA and 3PVA series of samples (Figure 13d,e), like all the other samples, showed no hysteresis loop at each concentration, confirming the presence of superparamagnetic behavior. The sample 1PVA01 was the one with the maximum magnetization value of the 1PVA series, very close to the value of the bare nanoparticles. In the 3PVA series, the curve for the 3PVA03 sample had a large initial slope (the so-called initial susceptibility), which indicates a larger average particle size with respect to the other 3PVA samples.
Table 6 shows the value of magnetic saturation (Ms), magnetic remanence (Mr), the ratio Mr/Ms, and coercivity for all samples.
Table 6.
Value of magnetic saturation, magnetic remanence, their ratio, and coercivity of all samples.
3.7. MRI Acquisitions
This section reports on the evaluation of relaxivity parameters for the 3PVA02 sample. As shown in Figure 14a, r1 is equal to 0.126 ± 0.002 mM−1s−1 with the regression coefficient of the linear fit R2 = 0.998. As shown in Figure 14b, r2 is equal to 6.45 ± 0.35 mM−1s−1 with the regression coefficient of the linear fit R2 = 0.985. As expected from the literature [27,29], the particles are more effective in reducing the T2 than the T1.
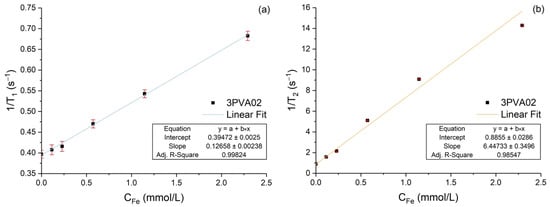
Figure 14.
Relaxation rates versus iron molar concentration of the sample 3PVA02: (a) longitudinal (1/T1), (b) transverse (1/T2). The lines are the data linear fits, and the insets report the relaxivity values as well as the regression coefficients.
These results, combined with the small dimensions of the particles (around 10 nm, as seen from Table 5), and the excellent biocompatibility and biodegradability of polyvinyl alcohol (PVA) in human tissues, demonstrate the potential of this innovative synthesis method to generate coated SPIONs suitable for MRI applications, especially in in vivo imaging [20].
4. Conclusions
Superparamagnetic iron oxides remain an important subject of research due to their unique magnetic properties, particularly for biomedical applications. The physical, chemical, and biological routes commonly used to obtain these nanoparticles offer various advantages and disadvantages, often making large-scale production challenging.
Our research group at the University of L’Aquila developed a patented, sustainable, one-step, and scalable synthesis method for producing monodisperse SPIONs, offering a promising solution to these limitations. In this work, we investigated whether polymer-coated SPIONs could be produced directly during synthesis while preserving the one-step nature of the process. Water-soluble polymers, poly(ethylene glycol) (PEG) and poly(vinyl alcohol) (PVA), were selected for their compatibility with the patented method and their well-established use in pharmaceutical and biomedical applications.
Twelve reactions were carried out—six for each polymer—by varying the polymer concentration and the concentration of iron chloride reagents. The resulting twelve samples were analyzed and compared with bare SPIONs using X-ray diffraction (XRD), infrared spectroscopy (FT-IR), inductively coupled plasma–optical emission spectroscopy (ICP-OES), transmission electron microscopy (TEM), and magnetometry (AGM). The XRD results showed that the addition of polymer did not alter the cubic spinel crystal structure of the magnetite core. The FT-IR spectra confirmed successful bonding of PEG and PVA to the surface of the magnetite nanoparticles. The TEM images of PEG-SPIONx samples revealed spherical particles with homogeneous equiaxial coatings, whereas PVA-SPIONy samples exhibited morphologies that varied with iron chloride molarity and PVA concentration, ranging from monodispersed particles to colloidal nanocrystal clusters. The AGM measurements confirmed the superparamagnetic behavior of all samples, with the PVA-SPIONy series showing higher magnetization values. The MRI relaxivity measurements demonstrated a clear enhancement in T2 relaxation.
Importantly, while PEG is widely reported in the literature as a coating material for SPIONs, studies employing PVA as a surface modifier remain comparatively limited. Our findings, therefore, contribute valuable insight into the structural, magnetic, and MRI-relevant properties of PVA-coated SPIONs, helping address a gap in the current knowledge regarding this less-explored polymer.
In conclusion, polymer-coated SPIONs can be successfully synthesized using a sustainable, one-step, and scalable method. These nanoparticles show promising potential for biomedical applications, particularly as T2 contrast agents for MRI, and offer new perspectives for the use of PVA in SPION surface engineering.
Author Contributions
Conceptualization: G.T.; investigation: L.T., G.T., A.G., F.D. and V.D.; data curation: L.T., A.G., F.D. and G.T.; writing—original draft preparation: L.T. and G.T.; writing—review and editing: G.T. and L.T.; visualization: L.T., F.D., A.G. and G.T.; supervision: G.T. All authors have read and agreed to the published version of the manuscript.
Funding
This research received no external funding.
Data Availability Statement
The original contributions presented in this study are included in the article. Further inquiries can be directed to the corresponding author.
Acknowledgments
The authors would like to thank Fabiola Ferrante for the FT-IR and TGA measurements, as well as Lorenzo Arrizza and Angelo Sarra for the TEM images acquisition. F.D. also acknowledges the financial support of the Italian Ministry of University and Research (MUR) National Innovation Ecosystem, under Grant ECS00000041—VITALITY (CUP: E13C22001060006).
Conflicts of Interest
The authors declare no conflicts of interest.
References
- Senthil Rathi, B.; Ewe, L.S.; Sanjay, S.; Sujatha, S.; Yew, W.K.; Baskaran, R.; Tiong, S.K. Recent Trends and Advancement in Metal Oxide Nanoparticles for the Degradation of Dyes: Synthesis, Mechanism, Types and Its Application. Nanotoxicology 2024, 18, 272–298. [Google Scholar] [CrossRef] [PubMed]
- Losito, D.W.; Souza, N.I.N.; Martins, T.S.; Britos, T.N.; Schumacher, M.L.; Haddad, P.S. A Review of Superparamagnetic Nanoparticles Applications and Regulatory Aspects in Medicine and Environmental Areas. J. Mater. Sci. 2024, 59, 16038–16068. [Google Scholar] [CrossRef]
- Sathish, T.; Ahalya, N.; Thirunavukkarasu, M.; Senthil, T.S.; Hussain, Z.; Haque Siddiqui, M.I.; Panchal, H.; Kumar Sadasivuni, K. A Comprehensive Review on the Novel Approaches Using Nanomaterials for the Remediation of Soil and Water Pollution. Alex. Eng. J. 2024, 86, 373–385. [Google Scholar] [CrossRef]
- Ansari, K.; Ahmad, R.; Tanweer, M.S.; Azam, I. Magnetic Iron Oxide Nanoparticles as a Tool for the Advancement of Biomedical and Environmental Application: A Review. Biomed. Mater. Devices 2024, 2, 139–157. [Google Scholar] [CrossRef]
- Eremeeva, N.B. Nanoparticles of Metals and Their Compounds in Films and Coatings: A Review. Foods Raw Mater. 2024, 12, 60–79. [Google Scholar] [CrossRef]
- Wu, W.; Jiang, C.Z.; Roy, V.A.L. Designed Synthesis and Surface Engineering Strategies of Magnetic Iron Oxide Nanoparticles for Biomedical Applications. Nanoscale 2016, 8, 19421–19474. [Google Scholar] [CrossRef]
- Samrot, A.V.; Sahithya, C.S.; Selvarani, A.J.; Purayil, S.K.; Ponnaiah, P. A Review on Synthesis, Characterization and Potential Biological Applications of Superparamagnetic Iron Oxide Nanoparticles. Curr. Res. Green. Sustain. Chem. 2021, 4, 100042. [Google Scholar] [CrossRef]
- Xiao, Y.; Du, J. Superparamagnetic Nanoparticles for Biomedical Applications. J. Mater. Chem. B 2020, 8, 354–367. [Google Scholar] [CrossRef]
- Vuong, Q.L.; Gillis, P.; Roch, A.; Gossuin, Y. Magnetic Resonance Relaxation Induced by Superparamagnetic Particles Used as Contrast Agents in Magnetic Resonance Imaging: A Theoretical Review. Wiley Interdiscip. Rev. Nanomed. Nanobiotechnol. 2017, 9, e1468. [Google Scholar] [CrossRef]
- Wallyn, J.; Anton, N.; Vandamme, T.F. Synthesis, Principles, and Properties of Magnetite Nanoparticles for in Vivo Imaging Applications—A Review. Pharmaceutics 2019, 11, 601. [Google Scholar] [CrossRef]
- Schneider, M.G.M.; Martín, M.J.; Otarola, J.; Vakarelska, E.; Simeonov, V.; Lassalle, V.; Nedyalkova, M. Biomedical Applications of Iron Oxide Nanoparticles: Current Insights Progress and Perspectives. Pharmaceutics 2022, 14, 204. [Google Scholar] [CrossRef] [PubMed]
- Silva, A.K.A.; Espinosa, A.; Kolosnjaj-Tabi, J.; Wilhelm, C.; Gazeau, F. Medical Applications of Iron Oxide Nanoparticles. In Iron Oxides: From Nature to Applications; Wiley: Hoboken, NJ, USA, 2016; pp. 425–471. ISBN 9783527691395. [Google Scholar]
- Fu, C.; Ravindra, N.M. Magnetic Iron Oxide Nanoparticles: Synthesis and Applications. Bioinspired Biomim. Nanobiomaterials 2012, 1, 229–244. [Google Scholar] [CrossRef]
- Gareev, K.G. Diversity of Iron Oxides: Mechanisms of Formation, Physical Properties and Applications. Magnetochemistry 2023, 9, 119. [Google Scholar] [CrossRef]
- Mondal, A.; Mukherjee, A.; Pal, R. Phycosynthesis of Nanoiron Particles and Their Applications—A Review. Biocatal. Agric. Biotechnol. 2024, 55, 102986. [Google Scholar] [CrossRef]
- Kumar, M.; Rani, M.; Ansari, J.R. Chemical Methods for Producing Iron Oxide Magnetic Nanoparticles: A Review. Iran. J. Chem. Chem. Eng. 2024, 43, 1850–1871. [Google Scholar]
- Araújo, E.V.; Carneiro, S.V.; Neto, D.M.A.; Freire, T.M.; Costa, V.M.; Freire, R.M.; Fechine, L.M.U.D.; Clemente, C.S.; Denardin, J.C.; dos Santos, J.C.S.; et al. Advances in Surface Design and Biomedical Applications of Magnetic Nanoparticles. Adv. Colloid. Interface Sci. 2024, 328, 103166. [Google Scholar] [CrossRef]
- Sun, S.N.; Wei, C.; Zhu, Z.Z.; Hou, Y.L.; Venkatraman, S.S.; Xu, Z.C. Magnetic Iron Oxide Nanoparticles: Synthesis and Surface Coating Techniques for Biomedical Applications. Chin. Phys. B 2014, 23, 037503. [Google Scholar] [CrossRef]
- Gupta, A.K.; Gupta, M. Synthesis and Surface Engineering of Iron Oxide Nanoparticles for Biomedical Applications. Biomaterials 2005, 26, 3995–4021. [Google Scholar] [CrossRef]
- Gu, H.; Fu, S.; Cai, Z.; Ai, H. Polymer/Iron Oxide Nanocomposites as Magnetic Resonance Imaging Contrast Agents: Polymer Modulation and Probe Property Control. J. Polym. Sci. 2024, 62, 3103–3121. [Google Scholar] [CrossRef]
- Taglieri, G.; Daniele, V.; Macera, L. Procedimento per la Sintesi di Nanoparticelle di Ferridrite o di Magnetite Mediante Resine a Scambio Ionico. Italian Patent 102019000017981, 4 October 2019. [Google Scholar]
- Macera, L.; Daniele, V.; Mondelli, C.; Capron, M.; Taglieri, G. New Sustainable, Scalable and One-Step Synthesis of Iron Oxide Nanoparticles by Ion Exchange Process. Nanomaterials 2021, 11, 798. [Google Scholar] [CrossRef]
- Macera, L.; Taglieri, G.; Daniele, V.; Passacantando, M.; D’orazio, F. Nano-Sized Fe(III) Oxide Particles Starting from an Innovative and Eco-Friendly Synthesis Method. Nanomaterials 2020, 10, 323. [Google Scholar] [CrossRef] [PubMed]
- Vangijzegem, T.; Lecomte, V.; Ternad, I.; Van Leuven, L.; Muller, R.N.; Stanicki, D.; Laurent, S. Superparamagnetic Iron Oxide Nanoparticles (SPION): From Fundamentals to State-of-the-Art Innovative Applications for Cancer Therapy. Pharmaceutics 2023, 15, 236. [Google Scholar] [CrossRef] [PubMed]
- Anuje, M.; Pawaskar, P.; Khot, V.; Sivan, A.; Jadhav, S.; Meshram, J.; Thombare, B. Synthesis, Characterization, and Cytotoxicity Evaluation of Polyethylene Glycol-Coated Iron Oxide Nanoparticles for Radiotherapy Application. J. Med. Phys. 2021, 46, 154–161. [Google Scholar] [CrossRef] [PubMed]
- Principe, G.; Lezcano, V.; Tiburzi, S.; Miravalles, A.B.; Rivero, P.S.; Montiel Schneider, M.G.; Lassalle, V.; González-Pardo, V. In Vitro Studies of Pegylated Magnetite Nanoparticles in a Cellular Model of Viral Oncogenesis: Initial Studies to Evaluate Their Potential as a Future Theranostic Tool. Pharmaceutics 2023, 15, 488. [Google Scholar] [CrossRef]
- Lapusan, R.; Borlan, R.; Focsan, M. Advancing MRI with Magnetic Nanoparticles: A Comprehensive Review of Translational Research and Clinical Trials. Nanoscale Adv. 2024, 6, 2234–2259. [Google Scholar] [CrossRef]
- Stephen, Z.R.; Kievit, F.M.; Zhang, M. Magnetite Nanoparticles for Medical MR Imaging. Mater. Today 2011, 14, 330–338. [Google Scholar] [CrossRef]
- Ittrich, H.; Peldschus, K.; Raabe, N.; Kaul, M.; Adam, G. Superparamagnetic Iron Oxide Nanoparticles in Biomedicine: Applications and Developments in Diagnostics and Therapy. RoFo Fortschritte Auf Dem Geb. Der Rontgenstrahlen Und Der Bildgeb. Verfahr. 2013, 185, 1149–1166. [Google Scholar] [CrossRef]
- Aboushoushah, S.F.O. Iron Oxide Nanoparticles Enhancing Magnetic Resonance Imaging: A Review of the Latest Advancements. J. Sci. Adv. Mater. Devices 2025, 10, 100876. [Google Scholar] [CrossRef]
- Ahmadpoor, F.; Masood, A.; Feliu, N.; Parak, W.J.; Shojaosadati, S.A. The Effect of Surface Coating of Iron Oxide Nanoparticles on Magnetic Resonance Imaging Relaxivity. Front. Nanotechnol. 2021, 3, 644734. [Google Scholar] [CrossRef]
- Tong, S.; Zhu, H.; Bao, G. Magnetic Iron Oxide Nanoparticles for Disease Detection and Therapy. Mater. Today 2019, 31, 86–99. [Google Scholar] [CrossRef] [PubMed]
- Khalkhali, M.; Rostamizadeh, K.; Sadighian, S.; Khoeini, F.; Naghibi, M.; Hamidi, M. The Impact of Polymer Coatings on Magnetite Nanoparticles Performance as MRI Contrast Agents: A Comparative Study. DARU J. Pharm. Sci. 2015, 23, 45. [Google Scholar] [CrossRef] [PubMed]
- LaConte, L.E.W.; Nitin, N.; Zurkiya, O.; Caruntu, D.; O’Connor, C.J.; Hu, X.; Bao, G. Coating Thickness of Magnetic Iron Oxide Nanoparticles Affects R 2 Relaxivity. J. Magn. Reson. Imaging 2007, 26, 1634–1641. [Google Scholar] [CrossRef]
- Kushwaha, P.; Chauhan, P. Facile Synthesis of Water-Soluble Fe3O4 and Fe3O4@PVA Nanoparticles for Dual-Contrast T1- and T2-Weighted Magnetic Resonance Imaging. Magn. Reson. Imaging 2023, 95, 50–58. [Google Scholar] [CrossRef] [PubMed]
- NIST 98-005-0273; NIST Inorganic Crystal Structure Database (ICSD). NIST: Gaithersburg, MD, USA, 2002.
- Park, J.Y.; Daksha, P.; Lee, G.H.; Woo, S.; Chang, Y. Highly Water-Dispersible PEG Surface Modified Ultra Small Superparamagnetic Iron Oxide Nanoparticles Useful for Target-Specific Biomedical Applications. Nanotechnology 2008, 19, 365603. [Google Scholar] [CrossRef]
- Karimzadeh, I.; Dizaji, H.R.; Aghazadeh, M. Preparation, Characterization and PEGylation of Superparamagnetic Fe3O4 Nanoparticles from Ethanol Medium via Cathodic Electrochemical Deposition (CED) Method. Mater. Res. Express 2016, 3, 095022. [Google Scholar] [CrossRef]
- Masoudi, A.; Madaah Hosseini, H.R.; Shokrgozar, M.A.; Ahmadi, R.; Oghabian, M.A. The Effect of Poly(Ethylene Glycol) Coating on Colloidal Stability of Superparamagnetic Iron Oxide Nanoparticles as Potential MRI Contrast Agent. Int. J. Pharm. 2012, 433, 129–141. [Google Scholar] [CrossRef]
- Wang, J.; Zhang, B.; Wang, L.; Wang, M.; Gao, F. One-Pot Synthesis of Water-Soluble Superparamagnetic Iron Oxide Nanoparticles and Their MRI Contrast Effects in the Mouse Brains. Mater. Sci. Eng. C 2015, 48, 416–423. [Google Scholar] [CrossRef]
- Darwish, M.S.A.; Al-Harbi, L.M.; Bakry, A. Synthesis of Magnetite Nanoparticles Coated with Polyvinyl Alcohol for Hyperthermia Application. J. Therm. Anal. Calorim. 2022, 147, 11921–11930. [Google Scholar] [CrossRef]
- Lee, J.; Isobe, T.; Senna, M. Preparation of Ultrafine Fe3O4 Particles by Precipitation in the Presence of PVA at High PH. J. Colloid Interface Sci. 1996, 177, 490–494. [Google Scholar] [CrossRef]
- Mahmoudi, M.; Simchi, A.; Imani, M.; Milani, A.S.; Stroeve, P. Optimal Design and Characterization of Superparamagnetic Iron Oxide Nanoparticles Coated with Polyvinyl Alcohol for Targeted Delivery and Imaging. J. Phys. Chem. B 2008, 112, 14470–14481. [Google Scholar] [CrossRef]
Disclaimer/Publisher’s Note: The statements, opinions and data contained in all publications are solely those of the individual author(s) and contributor(s) and not of MDPI and/or the editor(s). MDPI and/or the editor(s) disclaim responsibility for any injury to people or property resulting from any ideas, methods, instructions or products referred to in the content. |
© 2025 by the authors. Licensee MDPI, Basel, Switzerland. This article is an open access article distributed under the terms and conditions of the Creative Commons Attribution (CC BY) license (https://creativecommons.org/licenses/by/4.0/).