Abstract
Invar alloy sheet was welded by resistance seam welding (RSW) with a constant electrode force and three different welding currents. Tensile properties were evaluated using instrumented indentation testing (IIT) with a spherical indenter and microstructure observations were obtained under an optical microscope. IIT performed on the base material at room temperature (RT) and −163 °C, a cryogenic temperature (CT), gave results in good agreement with those of tensile testing. The strength of each zone was higher in the order of heat-affected zone (HAZ) < weld nugget (WN) < base material (BM) because the amount of cold working was least in the BM, heavy metal elements and carbon vaporized during melting, and the WN was formed more tightly than the HAZ, effectively constraining the plastic zone generated by the indentation. As for the welding current, the nugget, which becomes larger and tighter as the current increases, more effectively constrained the plastic zone in the indentation, and this soon increased the strength. Generally, Invar is known to consist of single-phase austenite, and microstructure observations have confirmed that the average grain size is ordered as BM < HAZ < WN. Fan-like columnar grains developed in the direction of the temperature gradient, and equiaxed grains were observed near the BM. It was confirmed that the grain size in the WN also increases as the current is increased. Interestingly, the constraint effect with increasing nugget size was more important for strength than the grain size.
1. Introduction
The demand for liquefied natural gas (LNG) continues to rise with the recent sharp increase in crude oil prices, and the concomitant construction of LNG storage tanks is also on the rise [1]. Alloys such as stainless steel, nickel steel, aluminum, and Invar alloys are used for LNG tanks. Since these tanks are exposed to extremely low temperatures (as low as −163 °C), it is essential to use cryogenic-temperature (CT) alloys with excellent mechanical properties at CT, especially high strength [2].
In the International Maritime Organization (IMO) classification, existing LNG carriers are classified as integrated or membrane-type (Mark-III and NO 96) and independent (Moss and SPB). Of these, membrane-type NO 96 LNG tanks (Figure 1) are most widely used because they are relatively inexpensive to produce [3]. The most important feature of this NO 96 type of tank is that both primary and secondary barriers use Invar sheets; the total weld length in the LNG carrier is about 250 km, of which 95% is welded automatically and 5% manually, and 90% of these automatic welds are resistance seam-welded (RSWed). In other words, the quality of the seam weld, which accounts for the bulk of the LNG carrier welds, has a great impact on the structural strength of the entire membrane. Nevertheless, while the reliability of the Invar base by fatigue property evaluation has been assessed by several researchers, tensile property evaluation of RSWed Invar welds itself has not yet been attempted because sampling of welds itself for tensile testing is not possible.
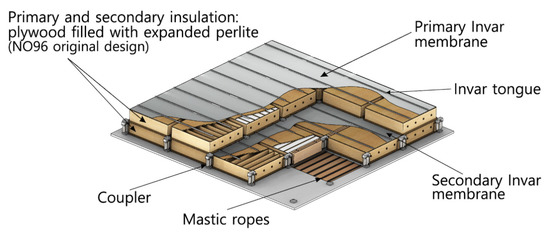
Figure 1.
Configuration of GTT NO 96 membrane containment system.
Therefore, we evaluated the tensile properties of Invar welds using IIT which does not require sample extraction and requires only a small area to test. IIT is a test developed from the hardness test that can non-destructively evaluate various mechanical properties [4,5], such as tensile property, residual stress, and fracture toughness, by analyzing a continuously measured load displacement curve [6,7]. IIT can assess material properties in situ and locally because samples need not be extracted, the test preparation and procedure are simple, and only a small area is necessary for testing. Due to these advantages, several researchers have used IIT for mechanical property assessment [8].
Tabor suggested a relationship between mean pressure in a spherical indentation and flow properties in tension testing by introducing a plastic constraint factor. Many researchers used the expanding cavity model (ECM) to study the relationship between mean pressure in a spherical indentation and flow properties in tension testing. Johnson [9] developed the ECM assuming the conversion of the core volume for a spherical indentation. In recent years, Kang et al. extended the model to work-hardening materials by introducing a scaling factor.
In this study, the tensile properties of RSWed Invar alloy at RT and CT were evaluated using a spherical indentation. The validity of the tensile property evaluation using IIT was first verified by comparing tensile test results of the BM at RT and CT; the results were confirmed to match well and were extended to the WN of Invar alloy. In addition, the changes in strength evaluated using IIT by zone and welding current were assessed by microstructure observation.
2. Theoretical Background
2.1. Determination of Strain-Hardening Exponent and Yield Strength
In order to evaluate tensile properties such as flow curve and strength, determination of the strain-hardening exponent is important. Previous research [10] has shown that this exponent can be estimated by the ratio-of-slope method. Kang et al. [10] rewrote the loading curve function and derived the indentation load L with respect to the contact radius a. To express strain hardening in materials, the ratio of slopes p is determined at two arbitrary contact radii, and (fixed as :
Using the strain-hardening exponent from the ratio-of-slope method, we can estimate the yield strength from a modified Meyer equation. Meyer [11] found the relation between yield strength and Brinell hardness, and then George et al. [12] suggested an empirical relation between yield strength and a material constant:
where is a parameter describing the material class. This modified Meyer equation [12] provides good agreement with yield strength from the indentation load displacement curve.
2.2. Determination of Contact Area
The contact area is derived from the actual contact depth and is obtained from the geometrical shape of the spherical indenter. When materials are indented by this rigid indenter, elastic deflection and plastic pileup occur beneath it because of elastic and plastic deformation. Oliver and Pharr [13] suggested a contact depth equation by calibrating the elastic deflection from the indentation load displacement curve:
where is the contact depth and and are the maximum depth and elastic contact.
Unlike elastic contact, plastic pileup is complex to calculate and no universal equation exists. Kim et al. [14] suggested a contact depth equation with plastic pileup using finite element analysis of the change with the indentation depth, indenter radius R, and strain-hardening exponent n:
The elastic deflection is affected by stiffness from the unloading slope and the plastic pileup is affected by the strain-hardening exponent. Based on the geometrical shape of the spherical indenter, the contact area is estimated from the indentation contact depth and indenter radius as:
2.3. Representative Stress and Strain
A spherical indenter is used to evaluate tensile properties because it lacks self-similarity, which can express the change in strain. On the other hand, Vickers and conical tips cannot express the change in strain because these tips are geometrically self-similar: the contact angle during indentation remains the same. For a spherical indenter, the contact angle changes continuously during indentation, as does the stress field. Therefore, different representative stresses and strains can be estimated during indentation.
Tabor [15] suggested a relation between flow properties in tension and mean pressure in a spherical indentation using a plastic constraint factor :
where and are flow stress and strain in a uniaxial tensile test, L is the indentation load, and A and are the projected contact area and contact radius. The plastic constraint factor is known to be about 3, but many researchers have shown that the strain-hardening exponent affects the plastic constraint factor. In previous work, the ECM was used to estimate the plastic constraint factor and investigate the relation between tension and mean pressure. Using this model, Gao [16] analyzed the stress and strain fields beneath the indenter based on strain gradient plasticity and obtained a representative stress with the plastic constraint factor and strain. Recently, Kang et al. [10] suggested a scaling factor k to adapt this model to strain-hardening materials.
The representative strain is defined based on the sine function (Equation (8)) by analyzing the strain field beneath the indenter using the ECM:
The constant is determined by the ECM and has the value 0.25. The indentation strain depends on the contact radius only. Unlike sharp-tip indenters, here changes continuously during indentation and we can detect the change in indentation strain.
2.4. Determination of Tensile Properties
The strain-hardening shape of the tensile curve is expressed using the representative stress and strain obtained from the indentation test. Thus, the tensile curve can be described using the constitutive equation from the representative stress and strain points. The Hollomon equation is generally used to obtain the plastic flow curve:
where K is a strength coefficient. The tensile strength is measured from tensile strain using the instability in tension:
We can use the constitutive equation to evaluate the tensile strength from the indentation test. Thus, tensile properties such as the yield strength, tensile strength, and flow curve can be evaluated from these four stages using an instrumented indentation test [17,18].
3. Materials and Methods
3.1. Material
Here, Invar alloy, which has a single austenitic phase, was used as the BM. In addition to high elongation and toughness similar to existing austenitic steel, Invar alloy has many additional advantages, such as high strength and good weldability [19]. It is also suitable for use in areas where precise dimensions are required, especially because it has a very low shrinkage coefficient (about ten times below that of general steel) [20]. Table 1 shows the chemical composition of Invar alloy.

Table 1.
Chemical composition of Invar alloy (wt%).
3.2. Resistance Seam Welding
Resistance seam welding (RSW) is a method widely used in sheet joining. The material is placed between two rotating electrodes, melted using heat generated by electrical resistance, and then welded. The weld produced at this time is called the nugget. Pressure is applied along with the electric current for good joint adhesion. Resistance seam welding is often used in automated welding because high-quality welds can be obtained quickly without requiring consumable electrodes, protective gas, or solvents. The actual welding process and schematic diagram of Invar membrane sheet joint are shown in Figure 2.
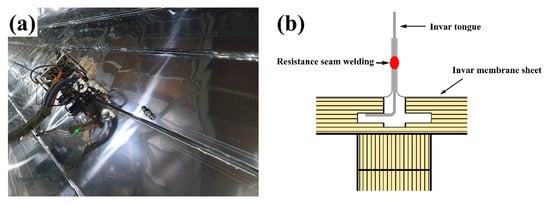
Figure 2.
Resistance seam welding (RSW) of Invar membrane sheet at the tongue: (a) actual RSW in liquefied natural gas (LNG) cargo containment system construction; (b) schematic diagram of Invar membrane sheet joint.
In this study, three Invar alloy sheets of thickness 0.7/0.5/0.7 mm were welded to form a lap joint. Two cylindrical electrodes were used of diameter 62 mm. The resistance seam welding parameters were a constant 5-bar electrode force, welding current of 3500A/3900A/4300A, a 15 ms electric current application time, and a 5 ms pause between alternating pulses [21]. Figure 3 shows schematic diagram of the resistance seam welding cycle.
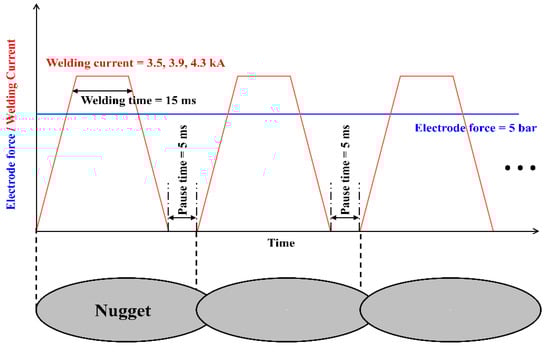
Figure 3.
The resistance seam welding cycle.
3.3. Tensile Test and Instrumented Tensile Test
Tensile and instrumented indentation tests for Invar alloy samples were carried out. For tensile tests, rectangular tensile samples with a gauge length of 57 mm, thickness of 1.5 mm, and width of 40 mm were prepared according to ASTM E8/E8M [22]. Five repeatable tensile tests at RT and three repeatable tensile tests at CT were performed for the Invar base at a crosshead speed of 2 mm/min in displacement control mode with an Instron 5582 (Instron Inc., Norwood, MA, USA).
For IITs, the RSWed Invar alloy was cut and mounted and then mechanically polished using SiC paper up to grit number #2200 according to ISO14577-1 [23]. In total, nine mounting samples for three test temperatures (RT, −100 °C, −163 °C) and three weld currents (3500A, 3900A, 4300A) were prepared. Then, three repeatable instrumented indentation tests were performed for each region (BM, HAZ, WN) in one sample, using an AIS3000 (Frontics Inc., Korea), which has 0.1 µm displacement resolution and 0.002 kgf load resolution. The indenter is a 250 µm radius spherical type made of tungsten carbide. The indentation speed was 0.3 mm/min, and 15 multiple unloadings (up to 50% of maximum load) were performed in 150 µm depth control mode. As shown in Figure 4a, The low-temperature environment chamber was used for the low-temperature indentation test, and the target temperature was secured through cooling by liquid nitrogen and heating using a heating chuck beneath the stage in a vacuum atmosphere. At this time, thermal grease was applied to the mounted sample floor to increase heat conduction. The indentation load and depth curves of RSWed Invar alloy at different welding currents and temperatures are shown in Figure 5.
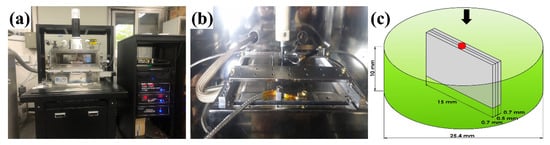
Figure 4.
Low-temperature indentation system equipped with environment chamber: (a) photograph of the system; (b) the stage in the chamber; (c) sample mounted for low-temperature indentation test.
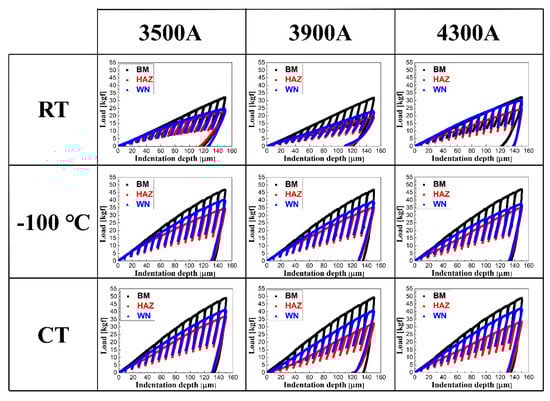
Figure 5.
Indentation load and depth curves of RSWed Invar alloy at different welding currents and temperatures.
3.4. Examination of Microstructure
The Invar surface was observed by an optical microscope to examine the BM and WN microstructure. After cutting and mounting the Invar alloy as in Figure 4c, a mirror surface was obtained by mechanical polishing; etching was performed for 30 s using an etchant, and microstructures were observed by an optical microscope.
4. Results and Discussion
4.1. Tensile Properties
4.1.1. Base Material (BM)
Figure 6 compares the stress–strain curve for the BM from tensile testing with that obtained by IIT; Table 2 shows the tensile properties of the BM obtained from tensile testing and IIT. It is seen that the yield and tensile strengths obtained from IIT are within 10% of the results from tensile testing both at RT and −163 °C (CT). That the results of the two tests on the BM were well matched confirms the appropriateness of using IIT on the WN where tensile testing is not possible.
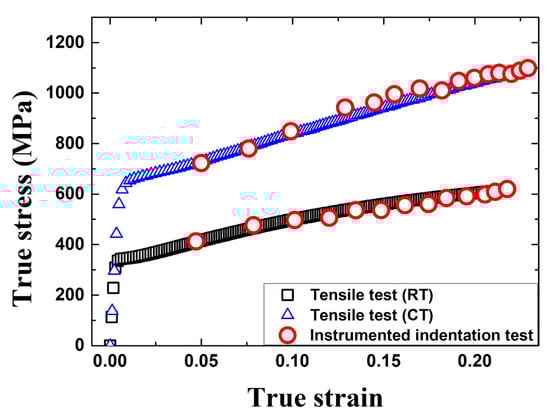
Figure 6.
Stress–strain curves evaluated by tensile testing and instrumented indentation testing for the base material (BM) at room temperature (RT) and cryogenic temperature (CT).
Table 2.
Comparison of tensile properties results for BM.
4.1.2. HAZ and WN
Since the results of IIT on the BM were well verified, IIT was applied to the Invar welds where tensile testing was not possible. IIT was conducted on the HAZ, which is 2 mm away from the WN center.
Looking at the distribution of strength by zones as in Figure 7 and Figure 8, we can see that both YS and UTS are high and are ordered HAZ < WN < BM at all three temperatures. There are two reasons why the WN has lower strength than the BM. First, while the BM was cold-worked by rolling during sheet making, there was little work hardening by cold working in the WN because it is a casting microstructure made by melting and solidification. Second, RSW does not supplement weldments during welding, so the high welding temperatures can vaporize heavy metal elements or carbon that affect the strength in the weld pool and decrease the strength of the WN [24].
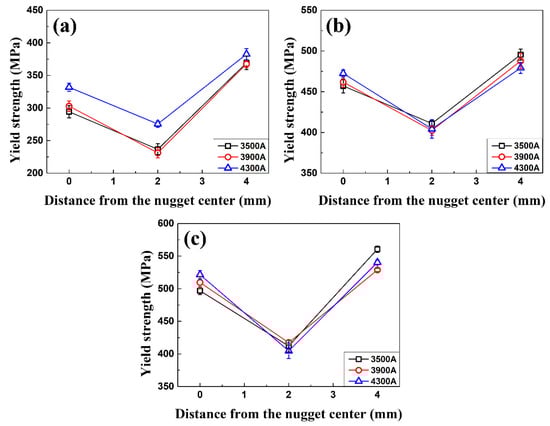
Figure 7.
Yield strength distribution along the different weld zones of RSWed Invar alloy: (a) RT; (b) −100 °C; (c) CT.
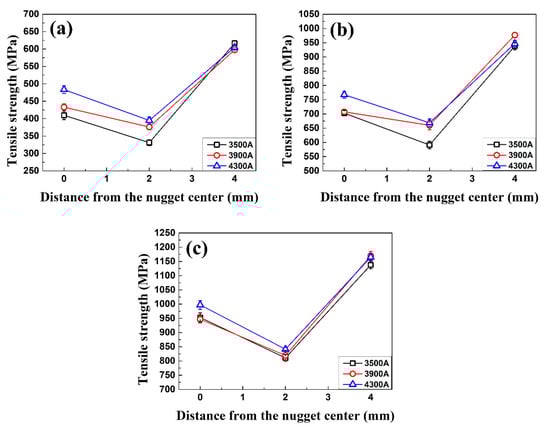
Figure 8.
Tensile strength distribution along the different weld zones of RSWed Invar alloy: (a) RT; (b) −100 °C; (c) CT.
The HAZ’s strength is below that of the WN because, by the nature of the RSWed sample, the rest of the area is only physically in contact, except in the WN formed by direct melting of the BM. When indentation was performed on the WN, the plastic zone formed is completely constrained by the WN. However, in the HAZ indentation (Figure 9), the unfilled gaps around the HAZ zone, unlike in the weld, make the plastic zone incompletely constrained and result in a smaller resistance, leading to lower strength than when the indentation was made into the WN.
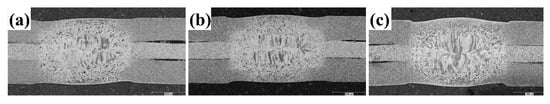
Figure 9.
Macro-examination of RSWed Invar alloy at different welding currents: (a) 3500A; (b) 3900A; (c) 4300A.
As for the change in strength due to the weld current, the strength of WNs increases as the current increases at all three temperatures. This is because, as mentioned earlier, the increase in welding current increases the heat input, creating a larger WN that more effectively constrains the plastic zone produced by the indentation. For HAZ, the strength also increases as the weld current increases overall, although not as distinctly as the WN, and the BM shows only the deviation of the IIT test itself, since it is not heated by the welding current.
4.2. Examination of Microstructure
First of all, the distribution of microstructures over the zones shows that the average grain size is large (ordered BM < HAZ < WN (Figure 10)) because joule heating during welding depends on the distance from the WN. Grain growth was greatest in the WN, which received the heat input most directly; the less heated HAZ shows less growth, and the BM, heated least of all due to distance, maintains its original grain size. In addition, the HAZ and WN in Figure 10 show that the typical fan-like columnar structure develops radially [25], regardless of welding current. This can be attributed to the radial spread of the heat flux in the Invar melted during welding. In other words, the direction of grain growth matches the temperature gradient [26], and equiaxed grains develop near the BM where the heat flux is almost nonexistent. At this time, the BM is made up of fine austenite grains [27] with an average crystal size of about 6 , independent of welding current.
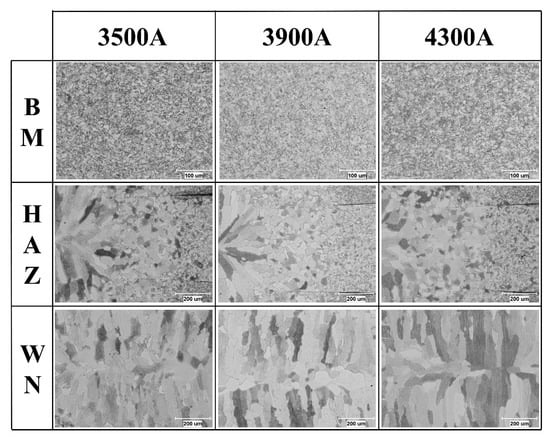
Figure 10.
Microstructures of RSWed Invar alloy at different welding currents over the different zones.
The microstructural changes with welding current in the same area can also be seen in Figure 10. As the current increases, the size of the WN increases and its grain size increases as well. Generally, since grain size and strength are known to be in inverse proportion (Hall–Petch equation) [28], the strength would also be expected to decrease as the welding current increases, but Figure 7 and Figure 8 show that the actual strength increases with the welding current. This unexpected result is due to the change in the constraint effect in the WN, as described above. The WN formed in the 3500 A view is small and does not fully constrain the plastic zone produced by indentation, but the increases in weld current produce a larger WN and a greater constraint effect [29].
5. Conclusions
In this study, the tensile properties from RT to CT of RSWed Invar alloy were measured by instrumented indentation testing and microstructure observations were performed. The results are as follows:
- IIT was performed on the BM at RT and −163 °C to verify the validity of the tensile property evaluation. Comparison of the stress–strain curve from tensile testing with the IIT results confirms that the IIT yield and tensile strength were within 10% of the results from the tensile test at RT and −163 °C.
- The distribution of strength over the zones was high for both YS and UTS at the three temperatures and is ordered HAZ < WN < BM. At this time, there are two main reasons why the WN has lower strength than the BM. First, because the WN is a casting microstructure made by melting and solidification, it undergoes little work hardening by cold working compared to the BM. Second, because RSW does not supplement weldments, vaporization of heavy metals or carbon affecting the strength in the weld pool during welding can reduce the strength of the WN.
- The effect of the weld current on strength was examined. In the WN and HAZ, as the current increases at all three test temperatures, the larger nuggets created more effectively constrain the plastic zone produced by indentation, resulting in increased strength. Since the BM is not heated by the welding current, it represents only the deviation of the IIT test itself, regardless of welding current.
- Microstructure observation shows that the Invar alloy consists of single-phase austenite, and the degree of heat received during welding depends on the distance from the WN, so the average grain size is ordered BM < HAZ< WN. Regardless of welding current, fan-like columnar grains developed in the direction of the temperature gradient of molten Invar during solidification, and equiaxed grains were observed near the BM, where the heat flux barely reached.
- This microstructure change occurred according to the welding current. As the current increases, the size of the WN increases and the grain size in the WN increases as well. Unlike the usual relationship between grain size and strength (Hall–Petch), here grain size and strength are proportional, since the constraint on the plastic zone of the WN increases with the welding current.
Author Contributions
S.C., J.W. and J.-J.L. contributed equally to this study. Conceptualization, S.C. and J.W.; methodology, S.C.; validation, J.W.; investigation, J.-J.L., S.C.; resources, J.-J.L., C.C.; data curation, C.C.; writing—original draft preparation, S.C. and J.W.; writing—review and editing, H.-K.L. and S.-M.K.; visualization, C.C.; supervision, S.-M.K., D.K. All authors have read and agreed to the published version of the manuscript.
Funding
This work was supported by the National Research Foundation of Korea (NRF) grant funded by the Korea Government (MSIT) (No. 2020R1A5A6017701) and the Korea Institute of Energy Technology Evaluation and Planning (KETEP) and the Ministry of Trade, Industry & Energy (MOTIE) of the Republic of Korea (No. 20171520000360).
Conflicts of Interest
The authors declare no conflict of interest.
References
- Oh, D.J.; Lee, J.M.; Noh, B.J.; Kim, W.S.; Ryuichi-Ando; Toshiyuki-Matsumoto; Kim, M.H. Investigation of Fatigue Performance of Low Temperature Alloys for Liquefied Natural Gas Storage Tanks. Proc. Inst. Mech. Eng. Part C J. Mech. Eng. Sci. 2015, 229, 1300–1314. [Google Scholar] [CrossRef]
- Han, S.; Lee, J.Y.; Park, Y.I.; Che, J. Structural Risk Analysis of an No96 Membrane-Type Liquified Natural Gas Carrier in Baltic Ice Operation. Proc. Inst. Mech. Eng. Part M J. Eng. Marit. Environ. 2008, 222, 179–194. [Google Scholar] [CrossRef]
- Korobkin, A.A.; Khabakhpasheva, T.I.; Malenica, S. Maximum Stress of Stiff Elastic Plate in Uniform Flow and Due to Jet Impact. Phys. Fluids 2017, 29, 072105. [Google Scholar] [CrossRef]
- Doerner, M.F.; Nix, W.D. A Method for Interpreting the Data from Depth-Sensing Indentation Instruments. J. Mater. Res. 1986, 1, 601–609. [Google Scholar] [CrossRef]
- Oliver, W.C.; Pharr, G.M. Measurement of Hardness and Elastic Modulus by Instrumented Indentation: Advances in Understanding and Refinements to Methodology. J. Mater. Res. 2004, 19, 3–20. [Google Scholar] [CrossRef]
- Jeon, E.C.; Kim, J.Y.; Baik, M.K.; Kim, S.H.; Park, J.S.; Kwon, D. Optimum Definition of True Strain beneath a Spherical Indenter for Deriving Indentation Flow Curves. Mater. Sci. Eng. A 2006, 419, 196–201. [Google Scholar] [CrossRef]
- Jeon, E.C.; Baik, M.K.; Kim, S.H.; Lee, B.W.; Kwon, D.I. Determining Representative Stress and Representative Strain in Deriving Indentation Flow Curves Based on Finite Element Analysis. Key Eng. Mater. 2005, 297–300, 2152–2157. [Google Scholar] [CrossRef]
- Won, J.; Kim, S.; Kwon, O.M.; Kim, Y.C.; Kwon, D. Evaluation of Tensile Yield Strength of High-Density Polyethylene in Flat-Ended Cylindrical Indentation: An Analytic Approach Based on the Expanding Cavity Model. J. Mater. Res. 2020, 35, 206–214. [Google Scholar] [CrossRef]
- Johnson, K.L. The Correlation of Indentation Experiments. J. Mech. Phys. Solids 1970, 18, 115–126. [Google Scholar] [CrossRef]
- Kang, S.K.; Kim, Y.C.; Kim, K.H.; Kim, J.Y.; Kwon, D. Extended Expanding Cavity Model for Measurement of Flow Properties Using Instrumented Spherical Indentation. Int. J. Plast. 2013, 49, 1–15. [Google Scholar] [CrossRef]
- Meyer, E. Investigations of Hardness Testing and Hardness. Phys. Z 1908, 9, 18. [Google Scholar]
- George, R.A.; George, R.A.; Kasper, A.S. Estimating Yield Strength from Hardness Data. Metal Progr. 1976, 109, 30–33. [Google Scholar]
- Oliver, W.C.; Pharr, G.M. An Improved Technique for Determining Hardness and Elastic Modulus Using Load and Displacement Sensing Indentation Experiments. J. Mater. Res. 1992, 7, 1564–1583. [Google Scholar] [CrossRef]
- Kim, S.H.; Baik, M.K.; Kwon, D. Determination of Precise Indentation Flow Properties of Metallic Materials through Analyzing Contact Characteristics beneath Indenter. J. Eng. Mater. Technol. 2005, 127, 265–272. [Google Scholar] [CrossRef]
- Tabor, D. The Hardness of Metals; Chapter 2; Clarendon Press: Oxford, UK, 1951. [Google Scholar]
- Gao, X.-L. Strain Gradient Plasticity Solution for an Internally Pressurized Thick-Walled Spherical Shell of an Elastic–Plastic Material. Mech. Res. Commun. 2003, 30, 411–420. [Google Scholar] [CrossRef]
- Kim, K.H.; Kim, Y.C.; Jeon, E.C.; Kwon, D. Evaluation of Indentation Tensile Properties of Ti Alloys by Considering Plastic Constraint Effect. Mater. Sci. Eng. A 2011, 528, 5259–5263. [Google Scholar] [CrossRef]
- Kim, Y.C.; Kang, S.K.; Kim, J.Y.; Kwon, D. Contact Morphology and Constitutive Equation in Evaluating Tensile Properties of Austenitic Stainless Steels through Instrumented Spherical Indentation. J. Mater. Sci. 2013, 48, 232–239. [Google Scholar] [CrossRef]
- Zhan, X.; Liu, X.; Wei, Y.; Chen, J.; Chen, J.; Liu, H. Microstructure and Property Characteristics of Thick Invar Alloy Plate Joints Using Weave Bead Welding. J. Mater. Process. Technol. 2017, 244, 97–105. [Google Scholar] [CrossRef]
- Kim, J.H.; Park, D.H.; Lee, C.S.; Park, K.J.; Lee, J.M. Effects of Cryogenic Thermal Cycle and Immersion on the Mechanical Characteristics of Phenol-Resin Bonded Plywood. Cryogenics 2015, 72, 90–102. [Google Scholar] [CrossRef]
- Ao, S.; Li, C.; Huang, Y.; Luo, Z. Determination of Residual Stress in Resistance Spot-Welded Joint by a Novel X-Ray Diffraction. Measurement 2020, 107892. [Google Scholar] [CrossRef]
- ASTM E 8/E 8M, Standard Test Methods for Tension Testing of Metallic Materials; ASTM International: West Conshohocken, PA, USA, 2002.
- ISO 14577-1. Metallic Materials—Instrumented Indentation Test for Hardness and Materials Parameters—Part 1: Test Method; ISO: Geneva, Switzerland, 2015. [Google Scholar]
- Kuroda, T.; Ikeuchi, K.; Ikeda, H. Flash Butt Resistance Welding for Duplex Stainless Steels. Vacuum 2006, 80, 1331–1335. [Google Scholar] [CrossRef]
- Qiu, C.; Adkins, N.J.; Attallah, M.M. Selective Laser Melting of Invar 36: Microstructure and Properties. Acta Mater. 2016, 103, 382–395. [Google Scholar] [CrossRef]
- Zhan, X.; Zhang, D.; Wei, Y.; Wang, Y. Research on the Microstructure and Properties of Laser-Mig Hybrid Welded Joint of Invar Alloy. Opt. Laser Technol. 2017, 97, 124–136. [Google Scholar] [CrossRef]
- Yu, Y.; Chen, W.; Zheng, H. Research on the Hot Ductility of Fe-36ni Invar Alloy. Rare Metal Mater. Eng. 2014, 43, 2969–2973. [Google Scholar]
- Sato, Y.S.; Urata, M.; Kokawa, H.; Ikeda, K. Hall–Petch Relationship in Friction Stir Welds of Equal Channel Angular-Pressed Aluminium Alloys. Mater. Sci. Eng. A 2003, 354, 298–305. [Google Scholar] [CrossRef]
- Aslanlar, S. The Effect of Nucleus Size on Mechanical Properties in Electrical Resistance Spot Welding of Sheets Used in Automotive Industry. Mater. Des. 2006, 27, 125–131. [Google Scholar] [CrossRef]
Publisher’s Note: MDPI stays neutral with regard to jurisdictional claims in published maps and institutional affiliations. |
© 2020 by the authors. Licensee MDPI, Basel, Switzerland. This article is an open access article distributed under the terms and conditions of the Creative Commons Attribution (CC BY) license (http://creativecommons.org/licenses/by/4.0/).