Abstract
Offshore monopile foundations endure complex loads during service. They bear vertical loads from the superstructure’s self-weight and lateral cyclic loads (e.g., wind, waves), while near-coastal seabeds are usually sloped. To resolve these issues, model pile tests under combined vertical and lateral cyclic loads were carried out to study how slope angle and vertical load affect monopile deformation. A numerical model was validated via comparison with test results and then used to reveal the development of cumulative deformation in offshore sloped monopiles under the above combined loads. The results show that, below 1000 cycles, the cumulative displacement of the pile increases logarithmically with the number of cycles. As the slope angle increases, the cumulative deformation increases. In these tests, the cumulative deformation of the pile increases by 114% compared to the results of the flat site, but it decreases with an increase in vertical load. As such, when a 3 N vertical load is applied to the pile top, its deformation at the flat site decreases by 20%, but its deformation at a 20° slope site decreases by 10%. Finally, a predicted formula is proposed for offshore monopiles with the effect of slope angle, and this formula can provide a preliminary assessment method of cumulative.
1. Introduction
Ocean environmental loads are very complex, especially for pile foundations in offshore engineering. On the one hand, monopiles are acted by vertical–lateral load combinations; on the other hand, the seafloor can be sloped [1]. In this condition, monopiles are acted by considerable vertical gravity combined with lateral cyclic loading from wind and waves. At the same time, the seafloor slope has a non-negligible effect on the stability of the monopile. Therefore, understanding the lateral response of offshore monopile to slope, vertical load and lateral cyclic load is highly significant.
It is well known that slopes cause asymmetric stress distributions. The lateral bearing capacity and responses of piles on slopes have been revealed by many researchers. Jiang et al. [2] and Georgiadis [3,4] investigated the effect of slope on soil’s ultimate resistance using a theoretical method. According to the law of soil’s ultimate resistance, an analysis method for a rigid pile was then proposed. Liu et al. [5] investigated the difference in soil’s ultimate resistance between front and back piles under the effect of lateral load. Peng et al. presented an asymmetric failure mode of soil to investigate the bearing capacity of laterally loaded piles at the slope crest [6]. In some studies, model tests were conducted to evaluate the bearing capacity of piles on a slope. Rathod et al. [7] conducted sloped pile model tests to investigate the effect of slenderness ratio and slope angle on the lateral deformation of a sloped pile. It was found that, when the slope angle was less than 11.3°, the slope effect was negligible. Zhang et al. [8] conducted model tests to study the effect of slope on the cyclic lateral response of a pile. Yue et al. [9] compared the cyclic lateral response of a pile on a downslope and an upslope by using the test method and found that the slope effect is significant in the downslope condition. Numerical simulations are also used to study the bearing capacity of slope piles. Sawant et al. [10] and Ng et al. [11] analyzed slope-induced pile model deformation via numerical calculations. Numerical simulations further explored how relative soil stiffness affects sloped pile response. Pang et al. [12] meanwhile studied slope angle’s impact on soil ultimate resistance and p-y curve initial stiffness. A nonlinear method was proposed for calculating the initial stiffness of p-y curves. In the above studies, the effect of slope was among the lateral response characteristics of piles. Nevertheless, in practical offshore monopile projects, pile foundations bear combined vertical loads derived from gravity and lateral loads induced by waves, and they are situated in sloped areas—these conditions call for further investigation.
The lateral bearing capacity of piles under vertical–lateral load combinations has been studied by some researchers. It was found that the P-∆ effect was caused by vertical load, meaning an additional bending moment was introduced, so the lateral deformation of the pile was increased and the lateral ultimate capacity was decreased. Based on model analyses, Goryunov et al. [13] and Liang et al. [14] found that the lateral deformation of a pile increases with an increase in vertical load. Zhang et al. [15] proposed an elastoplastic solution for calculating the lateral deformation of a pile under vertical–lateral load using the subgrade reaction method, and found that the lateral deformation and bending moment of the pile increased with an increase in vertical load. Vertical–lateral cyclic load pile model tests were conducted by Liu et al. [16], who found that vertical load increases the lateral cyclic deformation of a pile. However, some researchers found that vertical compression decreased the deformation and bending moment of a pile to some degree. Lu et al. [17] conducted a series of vertical–lateral load pile centrifuge tests, and by comparing the pile deformation and bending moment, they found that soil densification was caused by vertical compression. Drawing on findings from model experiments, Mu et al. [18] concluded that pre-imposed vertical loads enhance the soil’s resistance stress; analogous outcomes were observed in field-based pile experiments conducted by Karasev et al. [19] and Bartolomey [20]. Through numerical simulations, Karthigeyan et al. [21], Taheri et al. [22], and Lu et al. [23] demonstrated that the ultimate soil resistance associated with the p-y curve rises as the vertical load increases. The influence of vertical loads on the horizontal deformation of pile foundations has been systematically investigated in the above studies, the majority of these studies concentrated on pile foundations situated on flat ground. The impact of vertical load on the lateral displacement of pile foundations located on sloped terrain remains unstudied.
In summary, the influence of vertical load and slope angle on the lateral bearing capacity of offshore monopiles should be revealed, but little research has been performed in this area. As such, a series of vertical–lateral load pile model tests were conducted. The effect of vertical load and slope angle on the lateral cyclic deformation of a pile was investigated. Then, a numerical model was created and validated by comparing the results of model tests. Finally, by using this numerical model, the effects of slope angle, vertical load, and pile diameter on the cyclic deformation were revealed, and the cumulative deformation characteristics were studied.
2. Model Tests of Pile Under Vertical Load and Lateral Load
2.1. Apparatus of Model Tests
A specific apparatus was made to conduct model tests of a pile, as shown in Figure 1. This apparatus consists of a model box, a model pile, an actuator system, and a monitoring system. The dimensions of the model box are 600 mm in length, 600 mm in width, and 800 mm in height. This model pile is used to simulate an offshore monopile. The prototype size of the steel monopile is 50 m in length and 3 m in diameter. Within the present research, the 1:100 scale ratio was employed to underpin core analytical and validation processes. The model pile is made of aluminum, with dimensions of 30 mm in diameter and 500 mm in length. The actuator system applies lateral cyclic loading, while the monitoring system measures the lateral displacement and strain. As reported by Leblanc et al. [24], the relative stiffness of the prototype pile and model pile was determined to be 0.00776 and 0.00853, respectively. This near-identical stiffness characteristic translates to consistent deformation responses between the two, and the specific relational parameters are tabulated in Table 1.

Figure 1.
Apparatus of model tests.

Table 1.
Similar relation of prototype pile and model pile.
A concentrated mass block was applied to the top of the model pile, as shown in Figure 2. The capacity of the prototype wind turbine is 5 MW, and the mass of the blade and turbine is about 300 t. The same scale reduction ratio as the test pile (1:100) was used; accordingly, the mass of the upper structure was about 3 N.
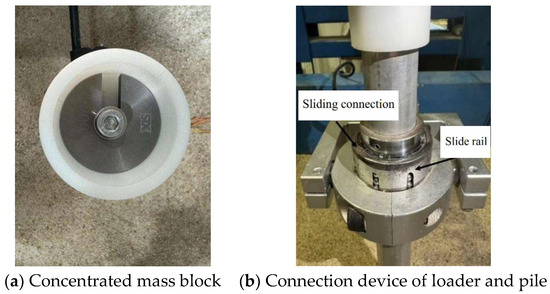
Figure 2.
Diagram of vertical load application method.
For the model test program, Fujian standard sand was selected as the foundation soil material, with a mean particle size of 0.47 mm and a void ratio of 0.68. This sand’s key physical properties, including additional detailed parameters, are summarized in Table 2. Distribution curve of the sand particle sizes is shown in Figure 3. The rainfall method was used for layering and filling sand, with a 50 mm filling depth for each layer. The relative density of sand in the model tests was controlled at 65%. After completing the filling of sand, the test soil was left stationary for one hour. The influence of soil stress on the model tests was eliminated. If the sand in the model tests was sloped, the slope was adjusted to a specific angle. After this step, sand was again subjected to static conditions for one hour.
Table 2.
Basic parameters of sand in model test.
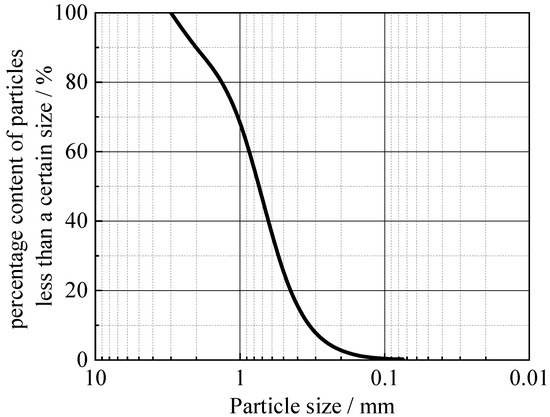
Figure 3.
Particle size distribution curve for Fujian standard sand.
In the model tests, a strain gauge, soil pressure sensor, and displacement sensor were used to measure the displacement of the pile and the change in soil stress. Six pairs of strain gauges were attached to the surface of the pile body at a spacing of 60 mm, and three pairs of soil pressure sensors were placed in the soil surrounding the pile. A layout diagram of the sensors is shown in Figure 4.
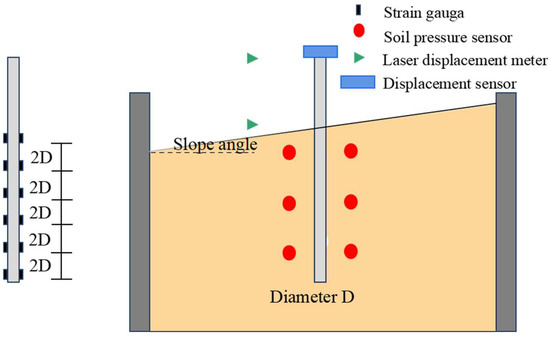
Figure 4.
Sensor positional layout for model tests.
2.2. Scheme of Model Tests
Wind turbine structures are usually knocked by cyclic loads such as wind and waves. Under this cyclic loading condition, the pile foundation is within the serviceability limit [25]. Cyclic load ratio ξ is used to define the magnitude of cyclic load. A value of ξ within the range of 0 to 0.3 represents frequent wind and wave loads [26]. In this study, a cyclic load ratio ξ of 0.3 is chosen. According to static load tests, the lateral limit bearing capacity is about 53 N, so the amplitude of cyclic load is about 16 N. Andersen [27] and Nikitas et al. [28] found that the period of cyclic load is about 10 s, so its frequency is determined to be 0.1 Hz. A waveform diagram of the cyclic load is shown in Figure 5.
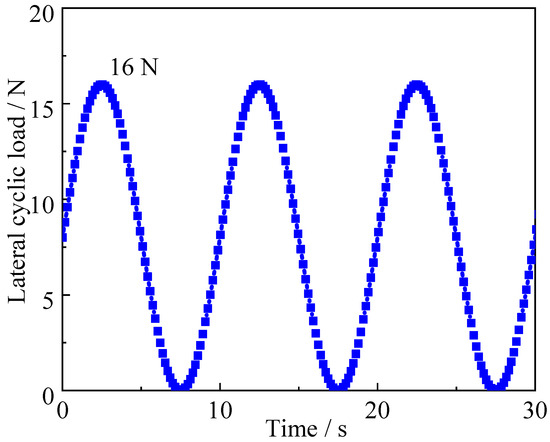
Figure 5.
Cyclic lateral loading schematic.
In the model pile tests with combined vertical and lateral cyclic loads, slope angles of 0°, 10°, and 20° were used for the soil foundation. A vertical load of 3 N and 0 N was applied to the pile top. This vertical load was used to simulate the mass of the superstructure. The detailed test program is shown in Table 3.
Table 3.
Program of model pile tests under vertical load and lateral cyclic load.
3. Analysis of Model Test Results
3.1. Effect of Vertical Load
The effect of vertical load on the lateral displacement of the pile top is shown in Figure 6. After the first cyclic load, the lateral displacement of the pile top without the effect of vertical load was 55 mm. However, when a vertical load of 3 N was applied to the pile top, the lateral displacement of the pile top was 0.44 mm. It was found that vertical load induced a decrease in the lateral displacement. After the 5000th cyclic load, the lateral displacement of the pile top without the effect of vertical load was 2.73 mm. However, the lateral displacement of the pile top with vertical load was 2.19 mm, indicating that lateral load increases the lateral bearing capacity.
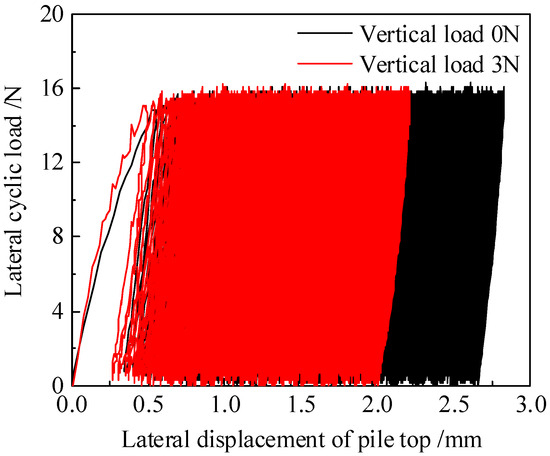
Figure 6.
Accumulated lateral displacement at the pile top under vertical load action.
3.2. Effect of Slope Angle
A comparison of the lateral displacement of the pile top under the effect of slope angle is shown in Figure 7. It shows that as the slope angle increases, the cumulative lateral displacement of the pile top increases. When the cyclic number is 5000, the lateral displacement of the pile top is 2.73 mm on flat ground. The lateral displacement values of the pile top on the 10° slope and 20° slope are 3.76 mm and 6.06 mm, respectively. Compared with the displacement of the pile top at the flat site, the displacement at the top of the pile increased by 32.8% and 114.8%, respectively. The reason is that as the slope angle increases, the loss of soil in front of the pile becomes more obvious, and the slope effect has a more pronounced influence on lateral bearing capacity.
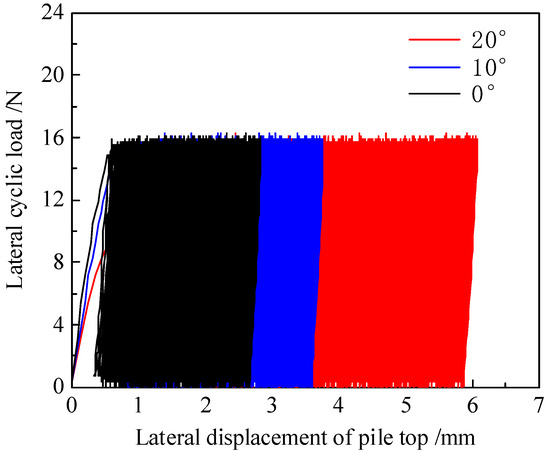
Figure 7.
Cumulative lateral displacement at the pile top under slope angle action.
4. Numerical Model of Pile Under Vertical Load and Lateral Load
4.1. Establishment of the Numerical Model
Based on the results of model tests, a numerical model is created to investigate the development of cumulative lateral displacement of the pile at different slope angles. In the established numerical model, structured grids are adopted. The soil grids adjacent to the pile body are dense, whereas those distant from it are sparse. The model comprises a total of 40,040 nodes and 43,056 elements.A schematic diagram of the numerical model is shown in Figure 8. The surrounding boundaries and the bottom boundary are fixed. The Mohr–Coulomb model is used to simulate the stress–strain relationship of the soil. An elastic model is used to reflect the deformation of the pile, with an elastic modulus of 50 GPa and a Poisson ratio of 0.3. An interface element is adopted to simulate nonlinear pile–soil interactions. The parameters of the interface are 0.5 times those of the soil parameters. In the numerical model, Equation (1) is embedded to reflect the nonlinear relationship between the elastic modulus and the confining pressure [29]. Detailed parameters of the soil and pile in the numerical model are shown in Table 4.
where k is the influence coefficient of the soil elastic modulus, λ is the influence coefficient of depth, σ3 is the minimum principal stress of soil (kPa), and σat is the atmospheric pressure (101 kPa).
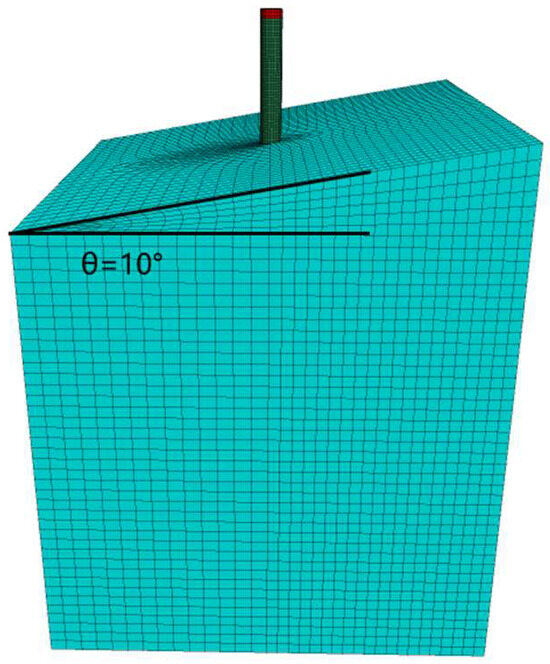
Figure 8.
Diagram of the numerical model.
Table 4.
Parameters of soil in the model tests.
A vertical load is applied to the pile top using a concentrated mass. The cumulative deformation of the pile due to the effect of cyclic load is calculated by using the stiffness attenuation model, which was proposed by Achmus et al. [30] using the attenuation modulus obtained from a cyclic triaxial test. The relationship of the attenuation modulus with cyclic number is shown in Equation (2).
where N is the cyclic number, EsN is the elastic modulus after the Nth cycle, Es1 is the elastic modulus after the 1st cycle, εp,N=1 is the axial strain after the 1st cycle, εp,N is the axial strain after the Nth cycle, X is the stress ratio of soil, and b1 and b2 are the relevant parameters.
In accordance with Achmus et al. [30] and Yang et al. [31], the characteristic cyclic stress ratio Xc is defined to reflect the change in soil stress under the effect of cyclic load.
where X(0) is the stress ratio of the initial condition in the numerical model, X(1) is the stress ratio of the initial condition in the load stage, σ1 is the major principal stress in the numerical model, σ1, sf is the major principal stress at the static failure state, σ3 is the minor principal stress in the numerical model, and φ is the internal friction angle of soil.
Based on the above theory and equations, modulus attenuation due to the effect of cyclic load is embedded in the numerical model. The numerical model is then used to calculate the cumulative deformation of the pile. The detailed flow diagram is shown in Figure 9.
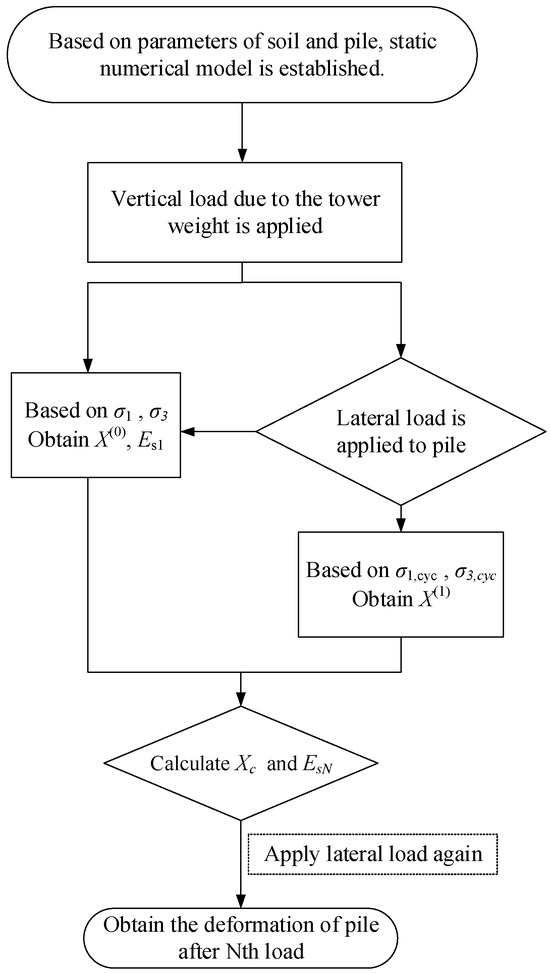
Figure 9.
Flow diagram of the calculated cumulative deformation.
4.2. Validation of the Numerical Model
In this section, the established numerical model is validated by comparing its results with those of model tests. The lateral deformation of the pile top in 0° and 10° model tests is reproduced with the established numerical model, and the comparison is shown in Figure 10. When there is no vertical load, the differences between model tests and numerical results are about 8% and 3%, respectively, for the 0° and 10° sites. When a 3 N vertical load is applied to the pile top, the differences between model tests and numerical results are about 6% and 4%, respectively, for the 0° and 10° sites. This indicates that the numerical results are in good agreement with the results of model tests.
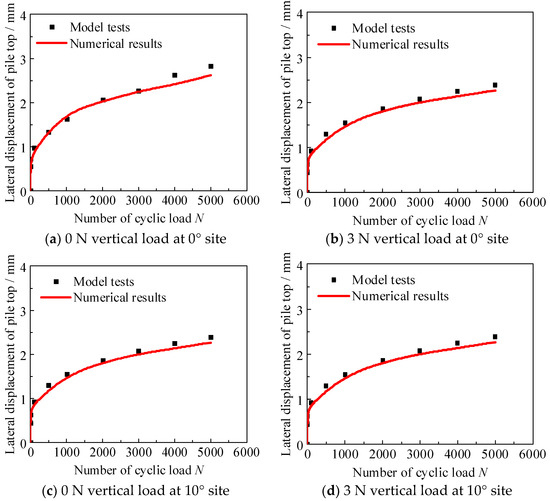
Figure 10.
Comparative analysis of outcomes between model experiments and numerical computations.
4.3. Numerical Model of Offshore Monopile
Based on the verified numerical model, a numerical model of an offshore monopile under vertical and lateral loads is established. The cumulative deformation of the offshore monopile is investigated at different relative densities of sand and slope angles. The numerical model of different slope angles is shown in Figure 11.

Figure 11.
Numerical model of different slope angles.
This numerical model uses relative densities of 60%, 75%, and 90%, and slope angles of 0°, 10°, and 20°. The monopile’s dimensions are 50 m in length, 5 m in diameter, and 5 cm in wall thickness, and its elastic modulus is 210 GPa. Vertical loads of 1 MN and 3 MN are applied on the pile top. The detailed parameters of sand are shown in Table 5.
Table 5.
Parameters of sand with different relative densities.
5. Influence Analysis of Large-Diameter Monopile Under Vertical Load and Lateral Load
5.1. Influence of Relative Density
A pile of 5 m diameter at the flat site is chosen to investigate the effect of relative density on the cumulative deformation of the pile. Firstly, the lateral ultimate bearing capacity is calculated to define the magnitude of cyclic load. The lateral displacement of the pile under different lateral loads is shown in Figure 12. In accordance with Barari et al. [26], lateral displacement of 0.1 times the diameter (0.1 D) is used to determine the lateral ultimate force. The ultimate forces at 60%, 75%, and 90% relative density are about 18 MN, 21 MN, and 26 MN. It is found that as the relative density increases, the ultimate force increases. When compared with 60% relative density, there is an increase of 15% and 40%.
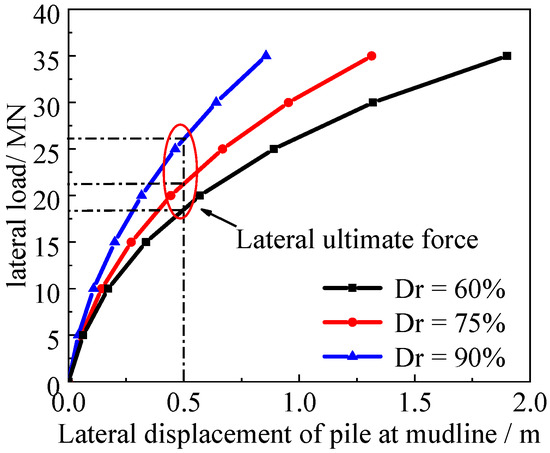
Figure 12.
Load–displacement curve of pile at different relative densities.
Based on the study by Sun et al. [32], a lateral ultimate force of 0.3 times was chosen as the amplitude of the cyclic load. The amplitudes of the cyclic load for different relative densities are 5.4 MN, 6.3 MN, and 7.8 MN. The cumulative displacement of the pile at different relative densities is shown in Figure 13, which shows that most of the cumulative deformation is produced within 1000 cyclic loads. After that, the growth rate of cumulative deformation decreases. At the same amplitude level of cyclic load, as the relative density increases, the cumulative deformation of the pile decreases. At the 10,000th cyclic load, the cumulative deformations of the pile at relative densities of 60%, 75%, and 90% are 0.37 m, 0.28 m, and 0.19 m. Compared with the deformation of the pile at the 60% site, the deformation at the 75% and 90% sites decreases by 24% and 48%.
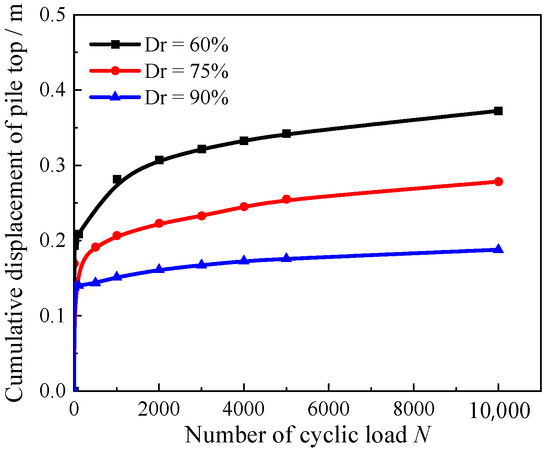
Figure 13.
Cumulative displacement curve of the pile at different relative densities.
5.2. Influence of Slope Angle
Sand of 75% relative density is used to calculate the cumulative deformation at different slope angles. The same method is used in this section. The lateral ultimate force of the pile at different slope angles is calculated, revealing values of about 21 MN, 18 MN, and 15 MN for 0°, 10°, and 20°. Based on the results of lateral ultimate force, the amplitudes of cyclic load at different slope angles are determined to be 6.3 MN, 5.4 MN, and 4.5 MN. The cumulative deformation of the pile is shown in Figure 14. It can be seen that the cumulative deformation of the pile at the 0° and 10° sites is mostly stable after the 1000th cyclic load, but that of the pile at the 20° site still increases with the number of cyclic loads. At the 1000th cyclic load, the deformation of the pile at the 0° and 10° sites is about 0.28 m and 0.54 m. However, the deformation of the pile at the 20° site is up to 1.28 m. It is indicated that, below 10°, the slope has no remarkable effect on the deformation of the pile. At the 20° site, the cumulative deformation of the pile remarkably increases due to the slope effect.
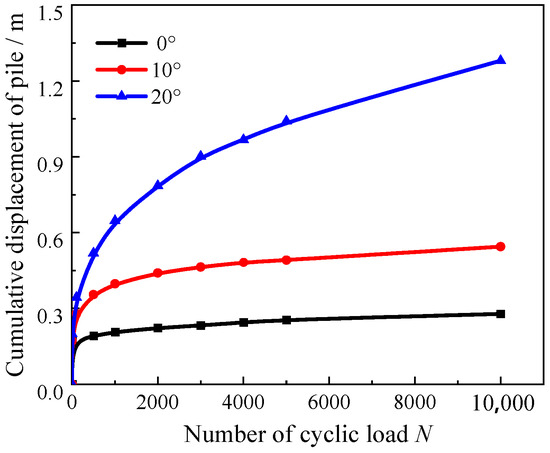
Figure 14.
Cumulative displacement curve of pile at different slope angles.
To further explore the influence of slope angle on pile deformation, the scenario with a cyclic load of 6.3 MN and a cyclic number of 6000 was selected to compare the range of soil deformation, as illustrated in Figure 15. It is observed that with the increase in slope angle, the range of identical soil deformation expands, which suggests that the extent of soil stiffness attenuation is enhanced. Specifically, the extent of stiffness attenuation at a slope angle of 20° is 50% greater than that at the flat site. These results demonstrate that an increase in slope angle aggravates the stiffness attenuation of the surrounding soil.

Figure 15.
Analysis results of numerical models for different slope angles.
5.3. Influence of Vertical Load
Sand of 75% relative density is used to calculate the cumulative deformation with different vertical loads. The cumulative deformation of the pile is shown in Figure 16. Most of the cumulative deformation of the pile at different vertical loads is produced within 1000 cyclic loads. The effect of vertical load is a decrease in the cumulative deformation of the pile. At the 10,000th cyclic load, the deformation of the pile is about 0.35 m under a 1 MN vertical load, whereas under a 3 MN vertical load, the cumulative deformation of the pile is 0.28 m, a decrease of 20%.
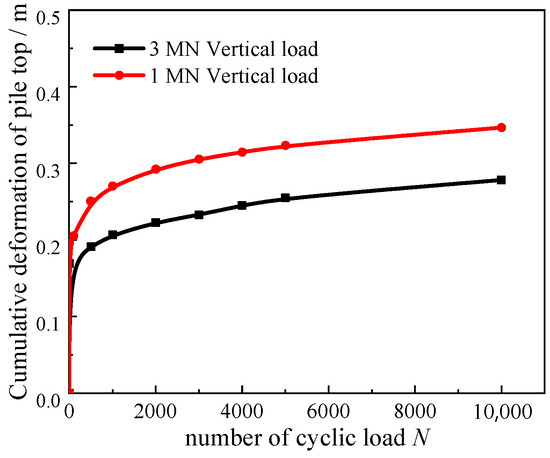
Figure 16.
Cumulative displacement curve of pile at different vertical loads.
6. Prediction of Cumulative Displacement for Large-Diameter Monopile
Based on the results of the above numerical calculations, the relationship between cumulative deformation of the pile top and the number of cyclic loads is investigated. When dividing by the lateral displacement of the pile top under the first lateral cyclic load, its cumulative deformation is dimensionless. The detailed equation is shown in Equation (7).
where y0,N is the dimensionless displacement of the pile top, yN is the displacement of the pile top after the Nth cyclic load, and y1 is the displacement of the pile top after the first cyclic load.
As shown in Figure 17, as the logarithm of the number of cyclic loads increases, the dimensionless displacement of the pile top linearly increases. At the same time, with an increase in the relative density, the slope of the line decreases. As the slope angle increases, the slope of the line increases. Based on these results, the cumulative deformation can be predicted using the following proposed equation:
where t is the exponential parameter of the cumulative deformation formula.
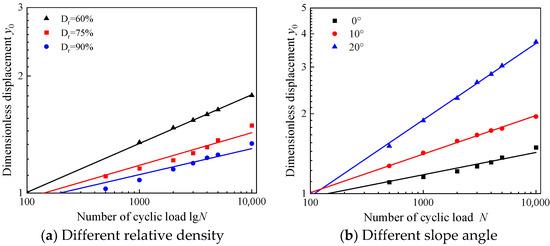
Figure 17.
Relationship curve of non-dimensional displacement y0 and number of cyclic loads.
By conducting a regression analysis of the above results, the parameters of the predicted formula are determined, and the results are shown in Figure 18. The relationship between the exponential parameter and relative density is shown in Equation (9). The relationship between the exponential parameter and slope angle is shown in Equation (10). In engineering design, the calculated results of piles are obtained for flat sites without accounting for the slope. By incorporating the relative density of sand and slope angle into the proposed formula, the cumulative deformation of slope-side piles can be rapidly derived based on the calculated results of piles in flat sites.
where Dr is the relative density of sand and θ is the slope angle.
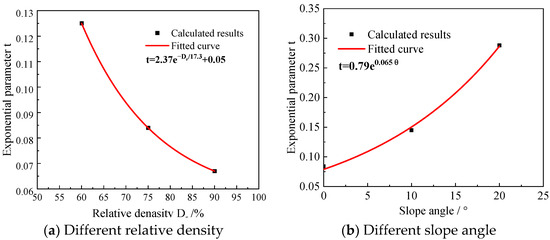
Figure 18.
Parameter analysis of exponential parameter for cumulative deformation formula.
7. Conclusions
Model tests of a pile under vertical and lateral cyclic loads are conducted to determine the effects of slope angle and vertical load on its cumulative deformation. Based on the results of model tests, a numerical model of the pile is verified. A numerical model of an offshore monopile is then created. A series of numerical calculations are performed to determine the effect of relative density, slope angle, and vertical load on the cumulative deformation of the pile top. Finally, the development of cumulative deformation is investigated and a formula for predicting the cumulative deformation of a pile is proposed. The main conclusions are as follows:
- (1).
- The cumulative displacement of the pile increases logarithmically with the number of cyclic loads. Deformation of the pile is produced within 1000th cycles. After the 1000th cycle, the deformation of the pile is largely stable.
- (2).
- As the slope angle increases, the cumulative horizontal displacement of the single-pile foundation also increases. Compared to flat ground, the cumulative displacement of the pile at 10° and 20° slope sites increases by 32.8% and 114.8%, respectively.
- (3).
- As the vertical load increases, the cumulative horizontal displacement of the single-pile foundation decreases. When the vertical load is 3 N, the cumulative displacement at 0°, 10°, and 20° decreases by 19.7%, 17.6%, and 10.7%.
- (4).
- For large-diameter offshore monopiles situated on sloped sites under vertical-horizontal combined loading, cumulative displacement demonstrates a logarithmic growth characteristic with the increment of cycle counts. A predictive formula for cumulative deformation is developed, serving as a preliminary evaluation approach for such deformation. On account of insufficient cases from numerical computations and model tests, additional investigations are needed to optimize the developed model.
Author Contributions
Conceptualization, Y.L. and G.X.; methodology, B.H. and Y.S.; software, Y.S., K.L. and Y.L.; validation, Y.S. and G.X.; formal analysis, L.G.; investigation, Y.S. and K.L.; resources, Y.L.; data curation, Y.S.; writing—original draft preparation, Y.S.; writing—review and editing, L.G.; visualization, Y.L.; supervision, L.G. All authors have read and agreed to the published version of the manuscript.
Funding
This research was funded by the National Natural Science Foundation of China (Grant No.: 52301343), the Natural Science Foundation of Zhejiang Province (Grant No.: LQ23E090003), the “Leading Goose” R&D Program of Zhejiang (Grant No.: 2023C03122), the National Natural Science Foundation of China (Grant No.: 52408387), and the Zhejiang Provincial Natural Science Foundation of China (Grant No.: LQ24E080013) and Zhejiang Provincial Department of Education Project (Grant No.: Y202351968).
Data Availability Statement
The original contributions presented in this study are included in the article. Further inquiries can be directed to the corresponding author(s).
Acknowledgments
The findings presented in this article were made possible through the diligent. guidance of the authors’ supervisor and the invaluable assistance of classmates, as well as the care and help of the teachers in the research group. With their collective help, the authors were able to obtain the lake test data. The unwavering support of the family and girlfriend of one of the authors was also instrumental. The authors extend sincere gratitude to all of them.
Conflicts of Interest
Authors Yongqing Lai, Gen Xiong and Ben He were employed by the company Power China Huadong Engineering Co., Ltd. Author Kaiyuan Liu was employed by the company China Three Gorges Corporation. The remaining authors declare that the research was conducted in the absence of any commercial or financial relationships that could be construed as a potential conflict of interest.
References
- Lin, M.; Jiang, C.; Chen, Z.; Liu, P.; Pang, L. A method for calculating lateral response of offshore rigid monopile in sand underslope effect. Ocean Eng. 2022, 259, 111812. [Google Scholar] [CrossRef]
- Jiang, C.; Zhang, Z.; He, J. Nonlinear analysis of combined loaded rigid piles in cohesionless soil slope. Comput. Geotech. 2020, 117, 103225. [Google Scholar] [CrossRef]
- Georgiadis, K.; Georgiadis, M. Undrained lateral pile response in sloping ground. J. Geotech. Geoenviron. Eng. 2010, 136, 1489–1500. [Google Scholar] [CrossRef]
- Georgiadis, K.; Georgiadis, M.; Anagnostopoulos, C. Lateral bearing capacity of rigid piles near clay slopes. Soils Found. 2013, 53, 144–154. [Google Scholar] [CrossRef]
- Liu, P.; Jiang, C.; Lin, M.; Chen, L.; He, J. Nonlinear analysis of laterally loaded rigid piles at the crest of clay slopes. Comput. Geotech. 2020, 126, 103715. [Google Scholar] [CrossRef]
- Peng, W.; Zhao, M.; Zhao, H.; Yang, C. Effect of slope on bearing capacity of laterally loaded pile based on asymmetric failure mode. Comput. Geotech. 2021, 140, 104469. [Google Scholar] [CrossRef]
- Rathod, D.; Muthukkumaran, K.; Thallak, S. Experimental Investigation on Behavior of a Laterally Loaded Single Pile Located on Sloping Ground. Int. J. Geomech. 2019, 19, 04019021. [Google Scholar] [CrossRef]
- Zhang, L.; Yue, S.; Peng, W.; Zhou, S. Experimental study on cyclic lateral response of piles in sandy sloping ground. Ocean Eng. 2023, 282, 115056. [Google Scholar] [CrossRef]
- Yue, S.; Zhang, L.; Zhou, S.; Peng, W.; Wu, G.; Zhao, M. Experimental investigation into effects of slope and loading characteristics on cyclic laterally loaded monopile in sand. Ocean Eng. 2024, 294, 116784. [Google Scholar] [CrossRef]
- Sawant, V.; Shukla, S. Three-dimensional finite element analysis of laterally loaded piles in sloping ground. Indian Geotech. J. 2012, 42, 278–286. [Google Scholar] [CrossRef]
- Ng, C.W.W.; Zhang, L. Three-dimensional analysis of performance of laterally loaded sleeved piles in sloping ground. J. Geotech. Geoenviron. Eng. 2001, 127, 499–509. [Google Scholar] [CrossRef]
- Pang, L.; Jiang, C.; Chen, L.J. Nonlinear Predictive Framework of the Undrained Clay Slope Effect on the Initial Stiffness of py Curves of Laterally Loaded Piles by FEM. J. Mar. Sci. Eng. 2022, 10, 1684. [Google Scholar] [CrossRef]
- Goryunov, B. Analysis of piles subjected to the combined action of vertical and horizontal loads (discussion). Soil Mech. Found. Eng. 1973, 10, 10–13. [Google Scholar] [CrossRef]
- Liang, F.Y.; Liao, C.C.; Mao, L.; Bai, W. Model tests on the behavior of a single pile under vertical-horizontal load. Build. Struct. 2013, 43, 92–94. [Google Scholar]
- Zhang, L.; Gong, X.-N.; Yang, Z.-X.; Yu, J.-L. Elastoplastic solutions for single piles under combined vertical and lateral loads. J. Cent. South Univ. Technol. 2011, 18, 216–222. [Google Scholar] [CrossRef]
- Liu, T.; Lai, Y.; He, B.; Lv, N. Influence of Vertical Load on the Lateral Response of Piles in Normally Consolidated and Over-Consolidated Clay: Centrifuge and Numerical Modelling. Front. Phys. 2022, 10, 908181. [Google Scholar] [CrossRef]
- Lu, W.; Zhang, G. Influence mechanism of vertical-horizontal combined loads on the response of a single pile in sand. Soils Found. 2018, 58, 1228–1239. [Google Scholar] [CrossRef]
- Mu, L.; Kang, X.; Feng, K.; Huang, M.; Cao, J. Influence of Vertical Loads on Lateral Behaviour of Monopiles in Sand. Eur. J. Environ. Civ. Eng. 2018, 22 (Suppl. S1), s286–s301. [Google Scholar] [CrossRef]
- Karasev, O.; Talanov, G.; Benda, S. Investigation of the Work of Single Situ-cast Piles Under Different Load Combinations. Soil Mech. Found. Eng. 1977, 14, 173–177. [Google Scholar] [CrossRef]
- Bartolomey, A. Experimental Analysis of Pile Groups Under Lateral Loads. In Proceedings of the Special Session 10 of the Ninth International Conference on Soil Mechanics and Foundation Engineering, Tokyo, Japan, 10–15 July 1977; pp. 187–188. [Google Scholar]
- Karthigeyan, S.; Ramakrishna, V.; Rajagopal, K. Influence of vertical load on the lateral response of piles in sand. Comput. Geotech. 2006, 33, 121–131. [Google Scholar] [CrossRef]
- Taheri, O.; Moayed, R.Z.; Nozari, M. Lateral soil-pile stiffness subjected to vertical and lateral loading. J. Geotech. Transp. Eng. 2015, 1, 30–37. [Google Scholar]
- Lu, W.; Zhang, G. New p-y curve model considering vertical loading for piles of offshore wind turbine in sand. Ocean Eng. 2020, 203, 107228. [Google Scholar] [CrossRef]
- Leblanc, C.; Houlsby, G.; Byrne, B. Response of stiff piles in sand to long-term cyclic lateral loading. Géotechnique 2010, 60, 79–90. [Google Scholar] [CrossRef]
- DNV-OS-J101; Offshore Standard: Design of Offshore Wind Turbine Structures. Det Norske Veritas: Hovek, Norway, 2013.
- Barari, A.; Bagheri, M.; Rouainia, M.; Ibsen, L.B. Deformation mechanisms for offshore monopile foundations accounting for cyclic mobility effects. Soil Dyn. Earthq. Eng. 2017, 97, 439–453. [Google Scholar] [CrossRef]
- Andersen, K. Cyclic soil parameters for offshore foundation design. Front. Offshore Geotech. III 2015, 5, 5–82. [Google Scholar]
- Nikitas, G.; Arany, L.; Aingaran, S.; Vimalan, J.; Bhattacharya, S. Predicting long term performance of offshore wind turbines using cyclic simple shear apparatus. Soil Dyn. Earthq. Eng. 2017, 92, 678–683. [Google Scholar] [CrossRef]
- Duncan, J.M.; Chang, C.Y. Nonlinear analysis of stress and strain in soils. J. Soil Mech. Found. Div. 1970, 96, 1629–1653. [Google Scholar] [CrossRef]
- Achmus, M.; Kuo, Y.; Abdel-Rahman, K. Behavior of monopile foundations under cyclic lateral load. Comput. Geotech. 2009, 36, 725–735. [Google Scholar] [CrossRef]
- Yang, Y.; Sun, Y.; Xu, C.; Iqbal, K.; DU, X. Predicting accumulated deformation of offshore large-diameter monopile using hollow cylinder apparatus. Ocean Eng. 2022, 261, 111984. [Google Scholar] [CrossRef]
- Sun, Y.; Xu, C.; Naggar, M.H.E.; Du, X.; Dou, P. Cumulative cyclic response of offshore monopile in sands. Appl. Ocean Res. 2023, 133, 103481. [Google Scholar] [CrossRef]
Disclaimer/Publisher’s Note: The statements, opinions and data contained in all publications are solely those of the individual author(s) and contributor(s) and not of MDPI and/or the editor(s). MDPI and/or the editor(s) disclaim responsibility for any injury to people or property resulting from any ideas, methods, instructions or products referred to in the content. |
© 2025 by the authors. Licensee MDPI, Basel, Switzerland. This article is an open access article distributed under the terms and conditions of the Creative Commons Attribution (CC BY) license (https://creativecommons.org/licenses/by/4.0/).