Abstract
Fines migration and clogging in porous media have significant implications for engineering applications. For example, during the extraction of marine gas hydrates, fines migration can lead to pore clogging and reduced permeability. This study combines micromodel experiments with DEM-CFD simulations to investigate the effects of fine type (latex/mica), fine shape (spherical/flake), pore size (50 to 700 μm), and pore fluid composition (DW/brine) on fines migration, fine clogging behavior, and the evolution of host sediment porosity. Experiments demonstrate that clogging is geometrically influenced by the relationship between pore size and fines dimensions. Even when the size of fines (mica) is smaller than the pore throat size, their aggregates can still lead to clogging at very low concentrations (0.1–0.2%). The aggregate size of irregular mica is affected by changes in pore fluid properties, which may occur due to the freshening of pore water during hydrate dissociation. Furthermore, a moving gas/liquid interface concentrates fines, thereby increasing the risk of pore clogging. Simulations further reveal that fines migration causes dynamic changes in porosity, which requires a comprehensive consideration of the coupled effects of fine type, fluid velocity, pore size, and fluid chemistry. This study elucidates the microscopic mechanisms and quantifies the macroscopic effects of fines migration behavior in porous media, providing a theoretical foundation for further research.
1. Introduction
The migration of fine particles (fines) within porous media plays a crucial role in both scientific research and industrial applications. It can induce adverse effects such as formation damage and permeability impairment during hydrocarbon extraction, and the strategic utilization of fines migration under controlled conditions demonstrates potential benefits including selective particle retention and improved recovery efficiency in enhanced oil recovery operations [1,2,3,4]. These fine-grained particles (fines), typically defined as solids smaller than 75 μm (ASTM D2487) [5], exist in marine hydrate-bearing sediments. Their mobility—driven by fluid flow, chemical interactions, and mechanical forces—can significantly alter the performance of underground sediments [6,7]. This work synthesizes the current understanding of fines migration behavior in porous media, focusing on its geometrical and colloidal characterization, clogging mechanisms, and implications for marine gas hydrate production.
Fine particles exist in nearly all marine sedimentary environments, even within predominantly coarse-grained hydrate reservoirs [8,9]. In the marine gas hydrate system shown in Figure 1, fines exist as (1) dispersed particles within sandy layers, (2) interbeds between hydrate-bearing strata, or (3) co-existing components with hydrates in the reservoir [3,10]. Their presence becomes critical during methane gas production, where depressurization-induced fluid flow, pore-water freshening, and evolving gas/water interfaces mobilize fines, potentially clogging pore throats and redirecting gas migration paths [3,10,11]. Such processes can affect permeability, reduce production efficiency, or, conversely, stabilize flow channels through controlled clogging and subsequent fracture [10]. Marine gas hydrate production involves complex fines migration dynamics that present both technical challenges and potential optimization opportunities. These fine particles—typically ranging from 0.1 to 75 μm in size—are common components of natural sediments occurring in marine hydrate reservoirs. Resolving these uncertainties is essential for optimizing marine methane recovery while minimizing formation damage [12]. Three primary mechanisms govern fines behavior during methane gas extraction [13,14,15]: (1) fluid flow patterns (flow rate variation) established during depressurization-induced methane release, (2) chemical alterations (water freshening) in pore fluids resulting from hydrate dissociation, and (3) the influence of fines physical properties (size, shape, and concentration) on permeability as liberated methane migrates toward production wells.
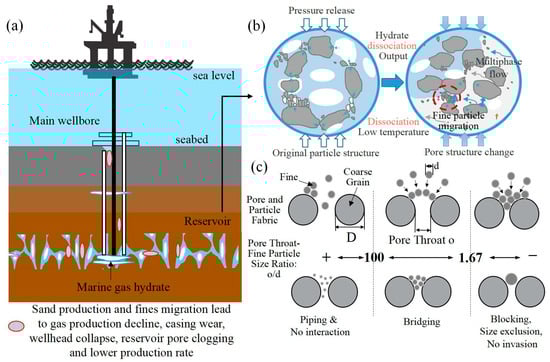
Figure 1.
The impact of fine particle migration on gas hydrate production, showing the dependence of the clogging threshold on the pore throat-to-particle size ratio (o/d), fine particle concentration, and flow rate. (a) Schematic of hydrate production: showing sand production and fines migration leading to gas production decline and pore clogging. (b) Hydrate dissociation and fines migration: hydrate dissociation process due to pressure release and low temperature, causing fine particle migration and pore structure changes. (c) Pore and particle interaction: fine particle behavior governed by the ratio of pore throat-to-particle size (o/d) (data from [16,17]).
Fine particles exhibit both geometric and colloidal heterogeneity. Geometrically, their sizes range from 0.1 to 75 μm and consist of clay minerals (such as kaolinite, montmorillonite, and illite) as well as non-clay particulates (including feldspars, carbonates, mica, and organic and biological components). Generally, the shape of clay fines is characterized by plate-like, blade-like, needle-like, or flaky forms [18]. In contrast, fine silt particles, along with organic and biological fines, tend to have less irregular shapes compared to clay fines. None of the natural fine particles are perfectly spherical. Their irregular shapes—platelets, flakes, or needles—complicate size quantification, particularly when transitioning between dry and suspended states [19,20,21]. Colloidally, fines exhibit surface charges that govern interactions with pore fluids. These charges, sensitive to pH and ionic strength, dictate aggregation tendencies and mobility [14]. For instance, in brine–freshwater mixing zones during hydrate dissociation, charge destabilization can trigger fines release and migration [21,22,23]. To better understand the mechanisms of particle migration and clogging in porous media, the methodologies and key findings from several related studies are summarized in Table 1. This table highlights the various approaches used to investigate particle behavior, migration, and the impact of pore fluid chemistry on clogging mechanisms.

Table 1.
Comparison of research methods and findings on fines migration.
Fines migration and clogging procedure represents a multiscale phenomenon where microscale pore–throat interactions manifest as macroscopic permeability alterations [35,36]. As Figure 1 shows, three fundamental mechanisms govern this process: (1) sieving, where particles exceeding pore throat dimensions become physically trapped; (2) bridging, where fines form arch-like structures across flow channels; and (3) aggregation, where colloidal forces induce particle clustering and subsequent pore blocking [16]. The primary mechanism depends on the critical value of o/d. Bridging typically occurs when o/d ranges from 3 to 10, while aggregation is more common under high ionic strength or low flow velocity conditions [37]. Modern microscopy advancements have the enabled real-time visualization of these processes, elucidating how cyclical clogging and unclogging events ultimately regulate bulk permeability [37]. Earlier laboratory studies have employed 3D porous media to examine the movement of fine particles and their impact on bridging and/or clogging within the porous structure [10,17,31,38,39,40]. Experimental studies have explored the main factors affecting fine particle migration, such as particle size distribution, pore throat geometry, fluid flow velocity, and particle concentration [37]. These studies have established critical relationships between flow conditions and clogging behavior. For instance, research on gravel pack systems demonstrates that fluid permeability is highly sensitive to flow rate, with the dominant pore-blocking mechanism dictating the overall permeability evolution [37]. Furthermore, extensive work has quantified the predictive capability of the o/d ratio for particle retention efficiency, with distinct threshold values associated with specific clogging mechanisms [41]. However, a critical gap in existing studies lies in the insufficient consideration of the intrinsic properties of natural fines and their influence on migration and clogging behavior. Unlike idealized laboratory particles, natural fines often carry heterogeneous surface charges and exhibit complex electrochemical interactions with pore fluids—particularly in gas hydrate systems where changing salinity and fluid flow conditions during dissociation can significantly alter particle-surface charge distributions [17]. These electrical interactions, including double-layer repulsion/attraction and van der Waals forces, may dominate fines mobility at low flow velocities or in low-ionic-strength environments (e.g., during pore-water freshening post-hydrate dissociation). For instance, mica (common in marine sediments) are platy phyllosilicate particles with a high specific surface and low plasticity index that can undergo charge reversal under varying pore fluid chemistry, switching from stabilizing to aggregating behavior [21]. Current fines clogging models (e.g., sieving/bridging thresholds based on o/d ratios) often overlook these dynamics, potentially misrepresenting the field-scale fines behavior where electrochemical effects may override purely geometric controls [37]. Therefore, integrate in situ surface charge characterization and coupled electro-hydrodynamic simulations can better predict fines migration in natural systems.
To address these challenges, researchers have increasingly adopted multiphysics-coupled numerical simulations. The CFD-DEM coupling method, for instance, effectively models fines migration in hydrate reservoirs by capturing fluid–particle interactions and pore geometry effects [42,43,44]. Traditional theoretical models mainly focus on fundamental physical processes such as inter-particle forces, particle–medium interactions, and sedimentation behavior in fluid flow [45]. Recent studies suggest that the migration of fines in sediments containing hydrates is affected by factors like pore geometry, particle surface charge, and variations in pore fluid chemistry at the sediment–fluid interface [46,47]. On the other hand, some researchers have proposed thermal-hydro-mechanical coupling analysis models based on continuum theory [48,49]. The research results reveal that fines migration can cause clogging near the sand control medium and near the wellbore. Additionally, some researchers have established a continuous-discrete coupling prediction model, integrating continuum medium schemes such as TOUGH + HYDRATE + FLAC3D with the discrete element method of particle flow (PFC3D) [44,50]. However, these methods still fail to evaluate the influence mechanism of fines migration on key variables such as the internal structure and pore fluid chemistry changes in the sample from a microscopic scale. Therefore, these complexities need more integrated and dynamic modeling approaches to accurately simulate the particle behavior under hydrate extraction conditions.
This study implements both experimental and computational methodologies to examine fines migration and clogging mechanisms in porous media systems. Special emphasis is placed on characterizing the sensitivity behavior of both engineered spherical particles and natural fines, with particular attention to their impacts on critical marine reservoir performance parameters including fine particle type and geometry, pore fluid chemistry variation, flow rate changes due to depressurization procedures, and porosity evolution. The experimental component employs a novel micromodel platform designed to systematically investigate fluid flow interactions with fines. Key experimental parameters include the critical relationship between pore throat size (o) and particle size (d), which controls the initiation of clogging, along with the interaction between particle surface characteristics and multiphase fluid dynamics. The research also employs coupled Discrete Element Method-Computational Fluid Dynamics (DEM-CFD) approaches to characterize fundamental transport mechanisms and distinctive migration patterns through porous networks. Through this parametric investigation, quantitative correlations are established between these fundamental variables and clogging characteristics, yielding novel insights into fines migration and clogging processes under dynamic conditions. This research outcome is expected to effectively reveal the mechanism of the migration and clogging behavior of different fines as well as providing important theoretical support for the study of the evolution of reservoir porosity and permeability due to fines migration during the extraction of methane hydrates.
2. Materials and Methods
2.1. Experimental Test
2.1.1. Apparatus and Materials
A schematic representation of the experimental setup is shown in Figure 2. The microfluidic model (micromodel) was placed under a microscope. The micromodel was constructed using standard photolithography techniques followed by soft lithography [51]. In this study, a homogeneous pore network was composed of patterns of varying sizes to represent different pore throat sizes. The depth of the pore channel was designed as 100 μm, and the value of o varied across the micromodel, with values of 50 μm, 60 μm, 100 μm, 300 μm, and 700 μm.
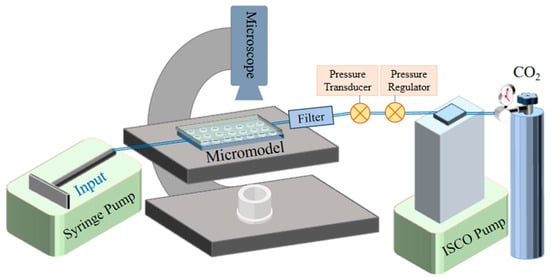
Figure 2.
Schematic diagram of the micromodel experimental setup (not to scale).
The microscope (Olympus IX51-long-working-distance 4X/0.1) was employed to capture images and videos of the pore network within the micromodel. The micromodel was connected to a syringe pump (Harvard Apparatus, PHD-2000, Holliston, MA, USA). And, it was also linked to an additional ISCO pump (Teledyne, D-series, Lincoln, NE, USA) used for injecting the gas phase (CO2, 99.99%) (Airgas, Wayne, PA, USA). The system pressure was maintained at 10 kPa by a customized pressure regulator (Swagelok, Solon, OH, USA) coupled with the ISCO pump, and monitored by a pressure transducer (Omegadyne, Inc., PX309, Sunbury, OH, USA). A filter was incorporated into the system to keep particles from entering the pressure system. Fine suspensions (ranging from 0.5 to 50 wt%) were prepared using either deionized water (DW) or an aqueous solution of 2 mol/L NaCl (brine). The injection flow rate (50 μL/min = 0.05 mm/s) was regulated by the syringe pump. As shown in Table 2, one set of experiments used spherical polystyrene latex particles with DW to study the uniform fine particle migration behavior; these served as the control experiments. The other set used DW and a 2 mol/L brine solution combined with natural mica particles to investigate the migration behavior of non-spherical, natural mica particles.
Table 2.
Characteristics of the fine particles used in this study.
Table 2 presents the characteristics of the fine particles used in this research. Figure 3 shows the distribution of particle sizes for the fines, where the horizontal line labeled D50 represents the median particle size, i.e., the median of the particle size distribution. Polymethyl methacrylate (PMMA) latex (Magsphere, Inc., Pasadena, CA, USA) was chosen to model the uniform-shaped fines in experiments. These latex particles have an average diameter of 19.2 μm. The latex suspensions were prepared at 0.5%, 1%, 2%, 5%, and 10% in DW. Mica (Kings Mountain, NC, USA) with a median particle size D50 of 17.0 μm was selected as the major natural fines existing in hydrate-bearing sediments to illustrate the effect of pore fluid variation (DW and 2 mol/L brine) and the irregularly shaped fines in geological reservoirs. The mineral mica are considered to have a different particle geometry from polystyrene latex particles. Due to its greater tendency to agglomerate compared to latex, mica was tested at lower concentrations in each pore fluid (DW and brine). The concentrations (w/w%) were set to 0.1%, 0.2%, 0.5%, 1.0%, 2.0%, 5.0%, and 10.0%.
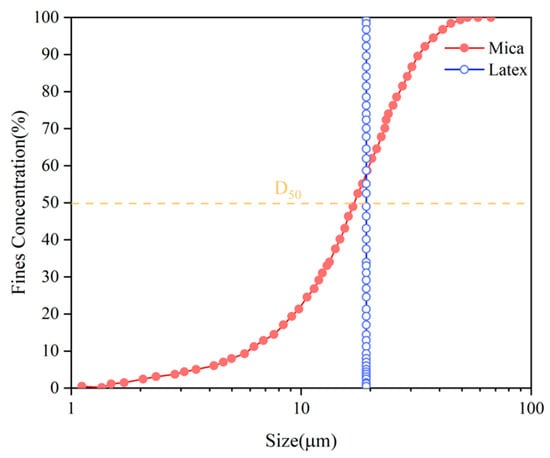
Figure 3.
Fine particle size distribution curve used in the experiments (data from manufacturer).
2.1.2. Experimental Procedure
Each micromodel was designed as a single-use device for the experiments in this study. Before testing, the micromodels were cleaned by injecting 70% ethanol (Mallinckodt Baker, Inc., ACS reagent grade, Phillipsburg, NJ, USA), followed by flushing with 30 mL of deionized water (DW), purging with CO2 gas, and drying at room temperature. Following cleaning, the micromodel was assembled into the system (Figure 2) with all components including transparent tubing connected to the micromodel. The micromodel was first saturated with DW or brine. The system pressure was raised to 10 kPa using the ISCO pump connected to CO2. Fine particles were then injected at varying concentrations with the syringe pump, while the pressure was maintained constant at 10 kPa throughout the injection of the suspension. For the CO2 injection, the procedure followed the same principle as single-phase flow, requiring only the withdrawal of the syringe pump while adjusting the pressure regulator. Flow rate was controlled at 50 μL/min (converted to 0.05 mm/s and divided by syringe cross area) using the syringe pump. For single fluid flow experiments, the flow process was terminated when more than one clogging point was observed in the micromodel viewing section; while for CO2 flooding tests, the experiment was stopped after a complete gas breakthrough was achieved in the observation area. The microscope captured both videos and images during drainage process. Selected frames from these videos were analyzed to observe the behavior of the fines within the micromodel.
2.2. CFD-DEM Simulation
2.2.1. Governing Equations
The DEM-CFD method, which was first introduced by Tsuji et al. [53], has undergone significant refinement and is now widely utilized to investigate flow phenomena [16,41]. This approach divides the fluid into cells and solves the governing equations of fluid motion. In this study, the CFD module of PFC is employed for fluid–structure interaction, with FiPy (National Institute of Standards and Technology, Gaithersburg, MD, USA) serving as the solver for CFD analysis [54]. FiPy, a finite volume method-based PDE solver, is recognized for its scalability and efficiency. It is integrated with the CFD module to facilitate information exchange between PFC and CFD.
Particle motion consists of two components: translation and rotation. The forces acting on the particles result from interactions among the particles, between the particles and fluid, and between the particles and the walls [55,56]. At each time step, acceleration is determined from the contact forces and particle mass, and positions are updated by directly applying Newton’s second law. When fluid is present, the DEM module integrates with the CFD module, allowing the interaction between particles and the surrounding fluid to facilitate the exchange of momentum and energy. In this study, the motion of a single particle is described using Newton’s second law. At any time t, the translational and rotational equations for particle i with mass are
where is the mass of particle i, kg; is the velocity of particle i, m/s; is the particle–fluid interaction force, N; is the viscous force, N; and the tangential and normal contact forces between particles i and j, N, respectively; and are the tangential and normal cementing forces i and j, N, respectively; represents the particle’s moment of inertia, N; is the rotational angular velocity vector of the particles, rad/s; and are the contact moment caused by contact force and rolling, N·m, respectively.
By utilizing the porosity of the element within the fluid–structure interaction framework, both the continuity equation and the Navier–Stokes equations are locally averaged. By introducing the concepts of local average velocity and pressure, the fluid phase is modeled as a spatially continuous field [9]. The equations governing mass and momentum conservation in the fluid are given as follows:
where denotes the fluid density; represents the fluid element porosity; is the fluid velocity vector; is the mechanical calculation time; is the vector of gravitational acceleration; and is the volumetric force exerted by all particles in the fluid element per unit volume.
is calculated by the following formula:
where denotes the hydrodynamic viscosity, Pa·s.
The models by Xu and Yu, (1997) [57] or Ergun (1952) [58] are commonly used for calculations and are presented as follows:
where represents the volume of the fluid element; denotes the drag force exerted by the fluid on an individual particle within the element.
When simulating the interaction between particle and fluid, information exchange is achieved through the separate calculation of the solid phase and the fluid phase in the coupling term of the particle–fluid interaction force . The particle–fluid interaction force is independently applied to each particle within the fluid unit. Particles may exist in fluid units. This study determines the magnitude of the fluid drag force based on the overlapping region between the particles and the fluid unit. The force exerted on the particles by the fluid is applied at the particles’ center of mass, with the bending moment being neglected. For the computation of particle–fluid interactions, the PFC3D 6.0 software treats clumps as spheres with equivalent radii, which are calculated based on their volumes. represents the interaction force between fluids and particles. It can be calculated by the following formula:
where is the volume of the fluid unit, m3; n represents the number of particles in each fluid calculation unit; is the pressure gradient force applied to particle i, N; is the drag force applied to particle i, N. The dragging force can be calculated and expressed by the following formula:
where is the drag coefficient, dimensionless; is the particle velocity, m/s; is the fluid velocity, m/s; is the fluid density, kg/m3; r represents the particle radius, m; is a correction coefficient, dimensionless. Among them, the drag coefficient is related to the particle Reynolds number and can be expressed by the following empirical formula:
where is the Reynolds number, which describes the motion behavior of particles in a fluid. This is expressed by the following formula:
The porosity χ in the correction term is calculated as following formula:
Figure 4 shows the main flow in the CFD-DEM coupled model. In this study, solid particles were generated using PFC3D, and the solution of seepage was achieved by utilizing the CFD module and Python 3.10 script in PFC3D.
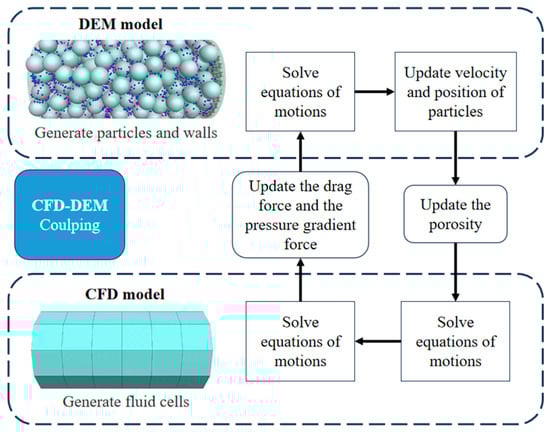
Figure 4.
Flow diagram of CFD–DEM coupling (The arrows indicate the sequence of the process).
2.2.2. DEM-CFD Models
Figure 5 evidences the cylindrical fine migration simulation model adopted in this study, and its geometric configuration and boundary condition settings follow the numerical stability requirements of the CFD-DEM coupling model. The main model is a cylindrical cavity with a length of 4 mm and a radius of 0.5 mm. Circular loading walls are, respectively, set at the left and right ends. The right wall adopts a cylindrical permeable structure (the diameter at the right end of the permeable plate is 0.05 mm). The DEM solid phase is composed of a multi-particle system, as shown in Figure 5, containing coarse grains with an uniform diameter of 0.20 mm and fine grains with average diameters of 19.2 μm (Latex) and 17 μm (Mica), respectively.
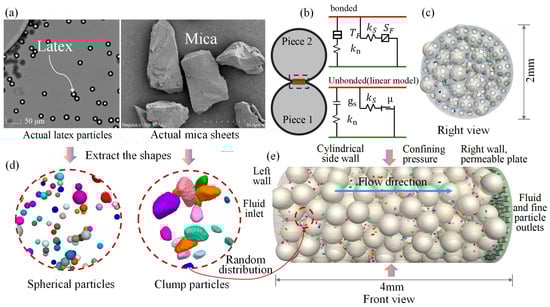
Figure 5.
CFD-DEM coupled fines migration models: (a) Latex and mica particles: microscope images of actual latex particles (left) and SEM image of mica sheets (right). (b) Linear contact bond model. (c) Right view of the particle arrangement (permeable plate). (d) Shape extraction of spherical and clump particles: particle shapes extracted for spherical (left) and clump particles (right) based on real images. (e) Flow simulation setup: 3D simulation setup showing flow direction and boundary conditions, including cylindrical side walls, confining pressure, and fluid and fine particle outlets. (Clump particles were created to simulate the irregular shape of fines based on scanning electron microscope (SEM) images of Mica dry samples, which were observed using a Tescan Mira4 SEM (TESCAN GROUP, a.s., Brno, Czech Republic) at Suzhou Chongyan Technology Co., Ltd., Suzhou, Jiangsu, China, at a magnification of 20,000×).
To better simulate the migration behavior of two representative fines in a porous medium, taking into account the particle shape and the synergistic effect of pore fluids chemistry on the surface charge of the fine particles, and based on the microscopic morphology of the fines migration behavior observed in the micromodel experiment, the model adopts two different fine particle models. One fine particle model represents latex, which has a smooth surface and a regular spherical shape, and the other fine particle model represents the natural mineral mica. The irregular shape of individual fine-grained particles (represented as Mica) can be modeled through scanning electron microscope (SEM) scanning technology. However, it is neither necessary nor feasible to scan and model all the particles in each test sample. Therefore, in this study, mica particles were randomly selected for three-dimensional scanning to establish a library of different particle shapes. Based on this shape library, non-spherical particles of the same particle size group were simulated, as shown in Figure 5.
The model parameters used in the CFD-DEM simulation are provided in Table 3. Sand is modeled using a linear model. This model primarily describes the elastic contact forces between particles through normal and shear stiffness, making it suitable for particles with higher rigidity. Fine particles are simulated using the linear bond model, which adds a parallel bond to the linear model to simulate the adhesive forces between particles. This enables the linear bond model to capture tensile and shear failure between particles, reflecting the loss of contact forces and changes in bonding forces [59,60]. In addition, using the clump function in PFC, fine particles are replaced with particle clusters generated from STL geometric models. The diameter, density, and rotation angle of each clump are set based on the characteristics of the fine particles, and their rotation axes are randomized.
Table 3.
Parameters of the model employed in the CFD-DEM simulation.
2.2.3. Simulation Cases
The numerical simulations mainly focused on the migration behavior of fines. These simulations primarily investigate the sensitivity of two representative fines (latex and mica) to different pore sizes, fine types, fine shapes, and pore water effects. To better simulate the actual geological conditions, the initial conditions are set as fluid pressure P = 12 MPa; overlying effective stress σ = 2 MPa (based on [34,64]). The total simulation duration is controlled to be 10 s. Table 4 lists the simulation control parameters and boundary condition settings of all cases in detail. The pore fluids used in the simulation are DW and brine. The inlet fluid velocity is set to 0.002 m/s, with outlet pressure at 0 m/s, satisfying fixed-velocity and zero-gradient boundary conditions [34]. The wall adopted a non-slip boundary to simulate the friction between the particles and pipe wall. The simulation duration is 0 to 5 s, which is used to capture the migration process of fines from the inlet to the outlet. Table 4 lists the simulation cases for fines migration in a porous medium (coarse-grained sand pack), and the results were compared with micromodel test data.
Table 4.
Physical and index properties of fines.
3. Results and Discussion
3.1. Fines Migration in Micromodel Test
3.1.1. Fine Geometry and Concentration
Figure 6 presents partial snapshots of the injection of DW suspension with varying concentrations of latex (0.5%, 1%, 2%, 5%, and 10%) and mica (0.1% and 0.2%) into the micromodel. Results show that, at the same pore throat size (e.g., o = 100 μm), mica forms clogging at 0.2% while latex does not clog even when its concentration reaches 5% to 10%. In addition, the experimental results indicate that the critical clogging concentration of latex at a pore throat of 50 μm was 5% to 10%, while that of mica was 0.2%. Figure 7 compares all the experimental data from this study, delineating the clogging/non-clogging boundary against the o/d ratio and fine concentration for both latex and mica. As Figure 7 shown, the test results demonstrate that latex and mica exhibit significant differences. The presence of pore fluid is observed that changes the fraction of platy or flaky specimens (mica) and cause lager clusters to clog the pore throat.
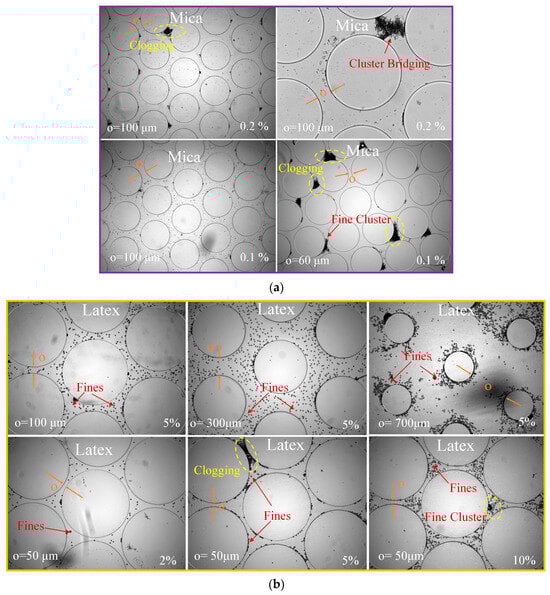
Figure 6.
DW injection with fine particles into micromodels. (a) Mica + DW: clogging and bridging occur at low particle concentrations (0.1% and 0.2%) with o = 100 µm and 60 µm. (b) Latex + DW: exhibits fines migration without clogging at concentrations of 2% and 5% fines when o = 100 µm, 300 µm, and 700 µm, until the concentration reaches 5% with o = 50 µm.
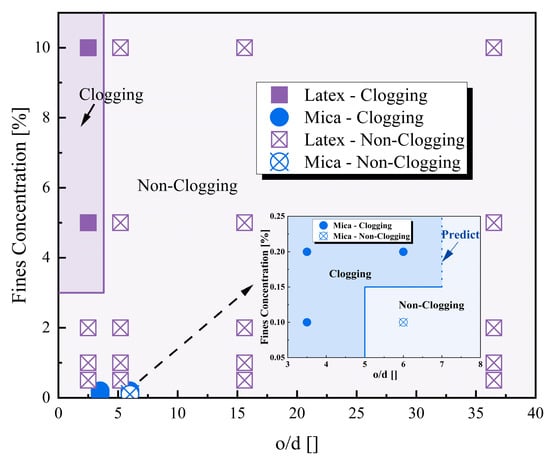
Figure 7.
Experimental clogging/non-clogging boundary for latex and mica as a function of the o/d ratio and fine concentration (flow rate = 50 µL/min (0.05 mm/s); mica concentration: 0.1% and 0.2%; latex concentration: 0.5%, 1%, 2%, 5%, and 10%).
The micromodel experiments mentioned above observed that the simple approach of determining clogging in pores based on particle size is no longer valid. In this study, the two selected fine particles have similar sizes, but their migration and clogging mechanisms in the pores are completely different. Although standard measurements indicate that the sizes of dry mica and latex particles are comparable, mica exhibits clogging at a concentration of 0.2% even with the same pore throat size, as its shape and behavior in DW make it more prone to cluster formation. Even when the concentration of latex particles reaches 5% to 10%, they do not clog the pore throat. This is because the bond-breaking positions at the edges of mica particles exhibit local hydrophobicity in DW. The hydrophobic interaction promotes the aggregation of particle edges to reduce the free energy of the system. In addition, the flaky structure of mica (diameter-to-thickness ratio > 100) makes it easier to form card-house structures through face-edge contact during Brownian motion, and the low viscosity of pure water cannot effectively prevent this directional aggregation.
3.1.2. Pore Fluid Chemistry and Flow Rate
Figure 8a,b illustrates the impact of pore fluids on mica clogging in 2 mol/L brine, under both CO2-present and CO2-absent conditions. The injected brine containing fines percolated through the micromodel within 1 s. The results illustrate the obvious clogging of mica in brine at 0.2% in 100 μm pore throat and 0.1% in 60 μm pore throat. As shown in Figure 9, the mica concentration did not become the decisive factor controlling whether the pore was clogged, because even at very low mica concentrations, pore fluids would promote several uneven mica clusters of fine particles.
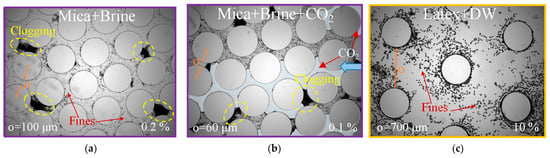
Figure 8.
Snapshots of brine/DW and CO2 injection with fine particles. (a) Mica + brine: fine particles (0.2%) cause clogging at o = 100 µm. (b) Mica + brine + CO2: CO2 invades the micromodel (o = 60 µm) containing 0.1% fine particle. (c) Latex + DW: no clogging occurs with up to 10% fine particles in a micromodel with o = 700 µm. (Blue arrow indicates the flow direction of CO2).
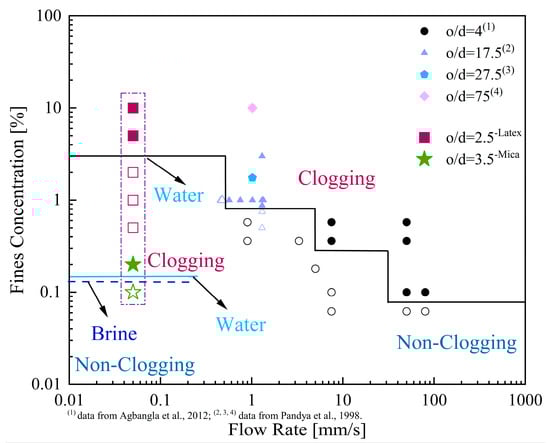
Figure 9.
Clogging/non-clogging boundary as a function of o/d ratio, flow rate, and fine concentration, with concentrations ranging from 0.062% to 10% and o/d values between 2.5 and 75 (partial data obtained from [30,31]). (Solid and hollow symbols denote data in the clogging and non-clogging ranges, respectively).
Figure 9 compares the data obtained from the literature and the results obtained from this study. Incorporating the findings from this study, an adjustment was made to the clogging/non-clogging boundary based on the o/d ratio, fluid flow rate, and fines concentration. The results highlight the distinction between natural fine sediments (green star symbols) and artificial fines, which, despite having similar o/d ratio, cause different clogging behaviors in pores. In contrast, latex particles did not form clusters in pore fluids and showed uniform distribution (Figure 8c). At this time, the particle concentration became the key factor controlling whether the pore throat was clogged. In addition, regardless of whether the pore fluid was DW or brine, CO2 (gas phase) enhanced the clogging of fines at the pore throat.
3.1.3. Liquid–Gas Meniscus Effects
Figure 10 illustrates the mica migration in a CO2-invading flow system. Figure 10a shows the result after brine injection, which included 0.2% mica particles (o = 100 μm). The micromodel was initially filled with 2 mol/L brine containing 0.2% mica. Following this, CO2 was injected (Figure 10b). As CO2 was injected, the local mica concentration increased, while the flow path remained clear during the early stage of injection (30 s). However, as a liquid–gas meniscus formed in the observation section, clogging occurred due to the accumulation of fines (Figure 10c). Mica was observed migrating along the liquid–gas interface, leading to an increased concentration of fine particles (Figure 10d–f). As the mica concentration grew, larger clogging areas appeared within the pores. Then, mica continued to migrate, despite the formation of clogging spots caused by mica clusters in the brine flow (Figure 10b). However, the CO2 injection resulted in more pronounced clogging due to the liquid–gas meniscus effect and the increased fine particle concentration within the pores.
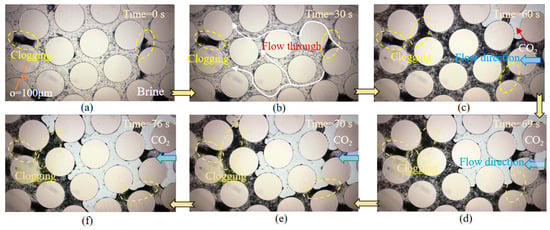
Figure 10.
Snapshots of mica particles (0.2%) migration in a liquid–gas (brine-CO2) flow. (a,b) Mica migration in brine flow. (c) CO2 invading the brine-saturated micromodel leads to enhanced pore clogging. (d–f) Enhanced local fine concentration and more residual brine around the clogged pore throat. The light blue area represents the injected CO2, and yellow circles highlight the clogged pore throats. (The light blue area represents the CO2 invasion front, yellow circles mark the clogged pore throats, and yellow arrows indicate the direction of the test progress).
Under real geological conditions, clogging-induced pressure changes trigger fines migration, thereby locally altering pore geometry through the displacement of host particles [65]. When the pore pressure surpasses the total stress within the sediments, both coarse and fine particles may become mobile, potentially leading to fracture formation. This study reveals that fines migrate along the interface of liquid and gas, leading to localized concentration increases and subsequent pore clogging. Based on the results of this experiment, the study found that the findings are consistent with previous related research [32,66,67], indicating the importance of fine particles in the hydrate extraction process and emphasizing the significance of clarifying the control mechanisms of fine particle migration during hydrate gas production. These results offer an essential understanding of the mechanisms behind gas-driven fracturing in fine-grained sediments containing hydrates during the gas extraction process.
3.2. Fines Migration with DEM-CFD Silmulation
3.2.1. Effect of Fines Type and Concentration on Porosity
In this study, the migration behavior of latex and mica particles under DW flow conditions was analyzed, and the effect of fines content (0.02% and 0.2%) on porosity changes was investigated, particularly at the outlet location. Through a comparative analysis of model diagrams and porosity data, the synergistic effects of fluid properties and particle physical characteristics on particle migration, deposition, and ultimate pore volume changes were revealed.
As shown in Figure 5, latex particles are simulated by relatively uniform, spherical particles with a small specific surface area and good fluidity based on micromodel test findings. Under DW flow conditions, the low viscosity of water results in good fluidity, allowing the fluid to easily carry particles during migration. These particles encounter minimal resistance during flow, maintaining a good suspension state. In Figure 11, the porosity at the outlet location for latex continues to rise, reaching approximately 0.39. This indicates that there is no significant accumulation of particles during flow, and the fluid can effectively flow in pores, leading to a gradual increase in porosity. This result suggests that smaller and more uniform particles experience less interaction with the fluid during migration, preventing rapid deposition and thereby maintaining or enhancing porosity.
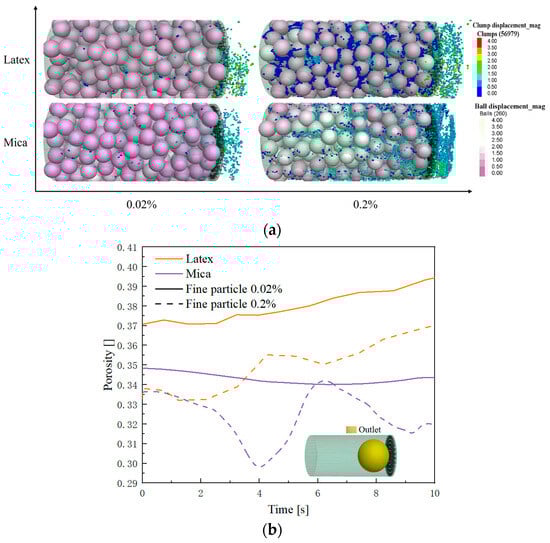
Figure 11.
Influence of fines types and concentrations on porosity of simulate porous medium: (a) Fines migration and clogging process; (b) Porosity changes with time.
As shown in Figure 11, unlike latex particles, mica particles have a larger specific surface area and layered structure, and their density is lower, which results in a different behavior in the fluid compared to latex. Under DW flow conditions, mica exhibit distinct migration patterns. When the fine content is 0.02%, mica particles migrate smoothly. Despite their larger size due to cluster formation, irregular surfaces, and poorer fluidity, their migration in the fluid is not significantly inhibited due to the low fine particle content. At the outlet, porosity remains between 0.34 and 0.35 with minimal variation, indicating that most particles remain suspended and do not undergo significant accumulation or deposition. However, when the mica content increases to 0.2%, particle accumulation becomes more pronounced, particularly in the outlet region. Due to the large specific surface area of mica particles, they may form aggregates in the fluid through electrostatic attraction or physical collisions. As the fine content increases, the formation of these aggregates becomes more frequent, leading to particles easily depositing in areas with slower flow rates, especially in the outlet region, where particles tend to aggregate and form accumulation zones. This results in a significant decrease in porosity, ultimately reducing it to approximately 0.32. This indicates that a higher fine particle content makes the mica particles more prone to aggregation and deposition, especially in the low-velocity exit region, increasing particle-to-particle interactions and leading to a significant decrease in porosity. The simulation results are consistent with the micromodel test results for both latex and mica.
These results indicate that the physical properties of particles (such as the specific surface area, density, and morphology) and fine particle content have a significant impact on particle migration, accumulation behavior, and changes in porosity. Especially under conditions of high fine particle content, particles are more prone to deposition, leading to a decrease in porosity and an increased risk of clogging.
3.2.2. Role of Pore Fluid Type in Governing Dynamic Fines Migration
This study explores the impact of pore fluid on the migration behavior of mica and the changes in porosity. In reality, the hydrate dissociation can release large amounts of fresh water, which affects mica in seawater. Based on the experimental test, mica particles, as a type of mineral particle with a layered structure, exhibit significant differences in their migration and deposition behavior in different fluids due to their physical properties. Research shows that salinity significantly controls the dispersibility (i.e., migration ability) of mica by affecting the electric double layer on its surface.
As shown in Figure 12a, brine has lower flowability. The high viscosity of brine causes mica particles to encounter greater resistance during flow, thereby slowing their migration speed. At the inlet location, the porosity decreases significantly in the later stages, indicating that particle migration is inhibited. Although the porosity remains relatively stable between 0.32 and 0.34 in the intermediate region, the sedimentation and accumulation of particles become prominent in the outlet region, leading to a significant decrease in porosity and potentially causing clogging.
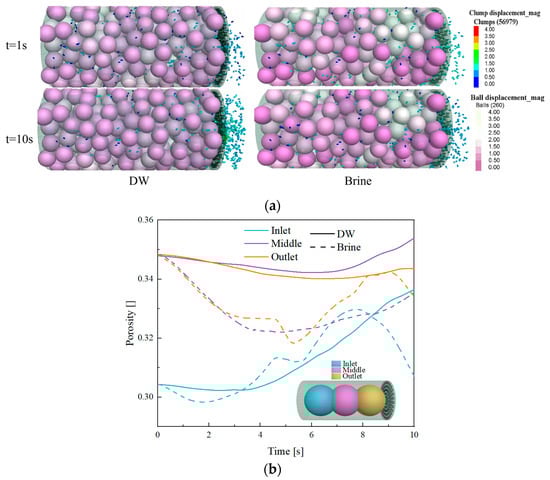
Figure 12.
Impact of pore fluid chemistry on porosity of simulate porous medium: (a) Fines migration and clogging process; (b) Porosity changes with time.
Compared to DW flow conditions, mica particles can move smoother in DW, resulting in faster migration speeds. At the inlet position, DW flow ensures good particle migration, with porosity rapidly increasing after 4 s. Mica particles are carried away by the fluid flow at a faster rate, and their migration and distribution within the fluid are relatively uniform. In the intermediate and outlet regions, fine migration within the fluid is also relatively smooth. At this location, most particles remain in a suspended state, and the fluid effectively drives the particles to continue migrating, making it unlikely for them to settle or aggregate. This indicates that the DW enables the fluid to effectively drive mica particles, maintaining their relatively uniform distribution. This is consistent with the results observed in the experiment and literature [67,68].
In addition, when compared with latex, it can be seen that mica are prone to pore clogging in both DW and brine based on porosity (Figure 12b). Therefore, it can be boldly speculated that, if a large amount of pure water is present during the extraction of hydrates, this will help alleviate mica clogging. In summary, the chemistry of pore fluids has a significant impact on the migration behavior of mica particles. The pure water released during the dissociation of hydrates may cause fines to migrate within pores, leading to reduced porosity and potential pore clogging. However, for mica clusters already present in the in situ seawater, the released pure water may also enhance their mobility within the pores.
Based on experiments and the numerical simulation results from this study, Figure 13 illustrates the rate of change in the porosity of the mica migration in this study under the influence of DW, providing insights into the phenomenon of water freshening during the dissociation of gas hydrates. At the same time, the central position of the simulation is correlated with micromodel data. It can be seen that, when the mica sample is subjected to DW (simulating the water freshening phenomenon during gas hydrate dissociation), the change in porosity is approximately 10%, and the critical clogging concentration decreases dramatically when the pore size is less than or equal to 60 μm. These combined findings from the experiment and simulation provide data support for predicting porosity in gas hydrate reservoirs. It is, of course, important to mention that these findings have limitations, and readers should reassess them according to specific working conditions. In the future, a comprehensive analysis of various types of mineral deposits can be conducted to identify the most sensitive factors for focused evaluations.
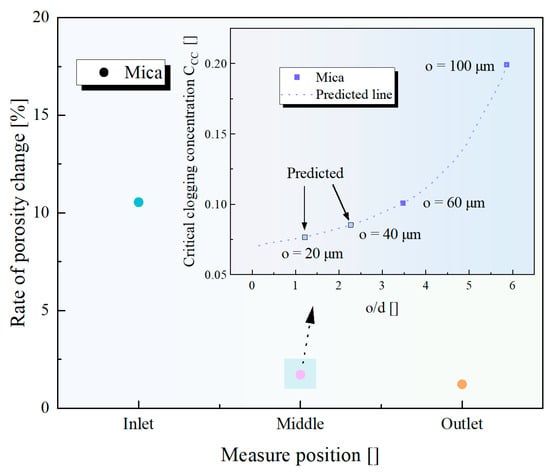
Figure 13.
DEM-CFD simulated porosity changes caused by mica migration in DW. (Critical clogging concentration was obtained from micromodel test: 0.1–0.2% for a pore throat size range of 60–100 μm).
4. Conclusions
To assess the mechanism of fines migration and clogging behavior in porous media, this study employed a two-dimensional micromodel and CFD-DEM simulation methods to conduct a series of experiments and numerical simulations. These studies focused on the effects of particle type, particle shape, pore fluid, and pore throat size. Experiments involving gas phase invasion were also conducted to explore how a moving meniscus influences fines migration behavior. The fines included mica (irregular shape) and artificial latex (spherical shape), while the pore fluids were deionized water (DW) and 2 mol/L brine. The two-dimensional micromodel, which simulated the porous medium, was designed with varying pore throat widths. For numerical simulations, the model of the porous medium consisted of coarse grains arranged in a sand pack within a defined domain.
This study reveals that, besides the expected relationship between clogging and o/d ratio, the chemical properties of pore fluids also play a crucial role. The agglomeration tendencies of fines are governed by the interaction between specific particle types and pore fluids, which effectively increases their apparent “size” relative to the pore size. Clogging becomes more likely when the o/d ratio is low and particle concentrations are high. As Figure 14 shows, the presence of saltwater alters the distribution state of these plate-like particles (such as mica), promoting their flocculation into face-to-face structures—a configuration that is fundamentally different from the edge-to-face structures formed in DW. This structural change results in a reduction in the size of the flake or platy-like fines, meaning that higher concentrations are required for clogging compared with the spherical shape of fines. Thus, the chemical properties of pore fluids directly affect the agglomeration potential of particles. Moreover, for all particle types, the gas/liquid interface universally increases the risk of clogging. As the interface advances, particles continuously accumulate and concentrate. When gas is injected or flows through flow through a porous medium containing trace particles, the gas/liquid interface exerts forces on the particles, causing their movement and ultimately resulting in bridging and clogging (Figure 14).
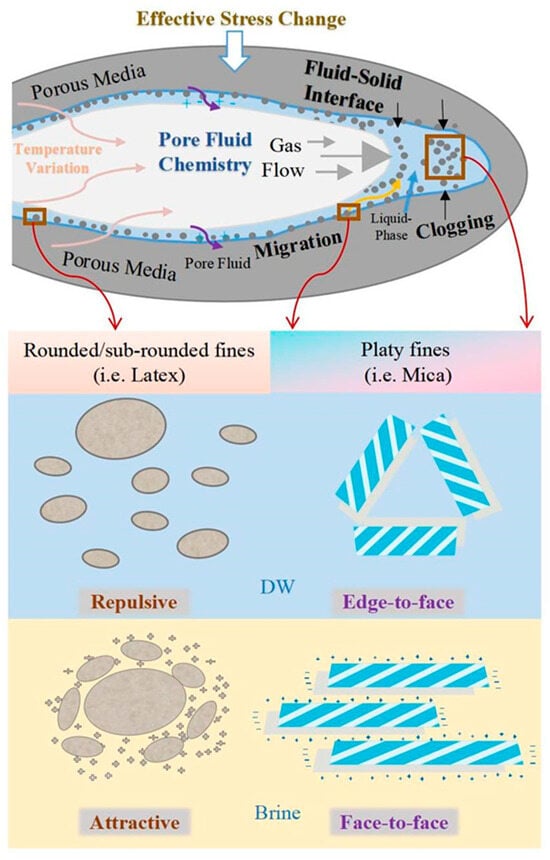
Figure 14.
Behavior and mechanisms of fines migration and clogging in porous medium. (The “+” and “−” symbols represent positive and negative charges, respectively, indicating the electrostatic interactions between particles).
This study clarified three key fines migration and clogging mechanisms dependencies: (1) The geometric dependence of clogging on the ratio of fine particle size to pore throat width. Even when fine particles are small, certain fines can still form bridging or blocking structures through agglomeration, leading to pore throat clogging. Additionally, clogging can occur even when fine concentrations are very low (e.g., mica: below 0.2%). When studying the clogging mechanisms of fine-grained sediment in marine gas hydrates, one must not overlook the variations in clogging capacity associated with different mineral shapes and their dynamic migration processes within fluids; (2) The dependence of fines migration and clogging on pore fluid chemistry alters the aggregation of fines into larger particles (with greater clogging potential). The freshening of pore water caused by hydrate decomposition inhibits the aggregation of specific fine particles, reducing their clogging potential. However, specific fine particles may form larger aggregates in freshwater than in saline water, resulting in an increase in their clogging potential as pore water desalinates. Additionally, the effect of pore water freshening is to promote the detachment of fines from the walls of porous media or larger particle surfaces. This requires researchers to utilize the inherent properties of pore fluids in mineral deposits to control the key triggers of pore clogging when assessing the clogging mechanisms of fine-grained sediments; (3) The dependence of clogging on the ability of the moving gas/liquid interface to collect and concentrate fine particles at the pore throat. As natural gas is produced from decomposing hydrates, the free gas phase begins to flow toward the production well along with desalinated pore water. When gas is injected into a micromodel containing liquid and fine particles, the fine particles aggregate along the gas–liquid interface and move with it. At the leading edge of the interface, the concentration of fines in the pores increases. Both of these particle concentration mechanisms enhance the clogging effect in both fresh and saline water, promoting bridging and clogging at the pore throat. Regardless of the type of fine particles involved, this aggregation and concentration effect inherently exacerbates clogging. The limitation of this study is that the microfluidic chip used in the experiment cannot withstand the high pressure of the real environment because the chip is only designed to handle pressures up to 10 kPa. Additionally, the two-dimensional nature of the physical model limits its ability to fully capture the complex particle behaviors in a three-dimensional porous medium. Future simulations could incorporate more complex multi-phase flow-coupled solid interfaces to better achieve the realism and effectiveness of simulation modeling.
Author Contributions
Conceptualization, S.C.C. and J.J.; methodology, S.C.C. and M.C.; software, M.C.; validation, J.J. and X.L.; formal analysis, S.C.C. and M.C.; investigation, S.C.C.; resources, X.L.; data curation, M.C. and Y.Y.; writing—original draft preparation, S.C.C.; writing—review and editing, S.C.C., M.C. and Y.Y.; visualization, J.J.; supervision, X.L.; project administration, S.C.C. and X.L.; funding acquisition, S.C.C., J.J. and X.L. All authors have read and agreed to the published version of the manuscript.
Funding
This research was funded by the Jiangsu Basic Research Program Natural Science Foundation Youth Fund (No. SBK2023044900), the National Natural Science Foundation of China Youth Project (No. 42306234), and the General Projects of the National Natural Science Foundation of China (Nos. 42477142, 42277154).
Data Availability Statement
The original contributions presented in this study are included in the article. Further inquiries can be directed to the first author and corresponding author.
Acknowledgments
Acknowledgments extended to the Changzhou University High-level Talent Introduction Program. We thank Shu Gao and Yunfei Sun for technical support with coding work.
Conflicts of Interest
The authors declare no conflicts of interest.
References
- Sherard, J.L.; Asce, F.; Dunnigan, L.P.; Talbot, J.R. Basic Properties of Sand and Gravel Filters. Geotech. Eng. 1984, 116, 684–700. [Google Scholar] [CrossRef]
- Datta, S.; Redner, S. Gradient Clogging in Depth Filtration. Phys. Rev. E 1998, 58, R1203–R1206. [Google Scholar] [CrossRef]
- Shin, H.; Santamarina, J.C. Fluid-Driven Fractures in Uncemented Sediments: Underlying Particle-Level Processes. Earth Planet. Sci. Lett. 2010, 299, 180–189. [Google Scholar] [CrossRef]
- Sanderson, S.L.; Cheer, A.Y.; Goodrich, J.S.; Graziano, J.D.; Callan, W.T. Crossfow Filtration in Suspension-Feeding Fishes. Nature 2001, 412, 6845. [Google Scholar] [CrossRef]
- ASTM D2487-17; Standard Practice for Classification of Soils for Engineering Purposes (Unified Soil Classification System). Advancing Standards Transforming Markets: West Conshohocken, PA, USA, 2020.
- Li, Y.; Hu, Q.; Wu, N.; Wang, H.; Sun, X.; Hu, G.; Sun, Z.; Jiang, Y. Acoustic Characterization for Creep Behaviors of Marine Sandy Hydrate-Bearing Sediment. Sci. Rep. 2023, 13, 22199. [Google Scholar] [CrossRef] [PubMed]
- Li, Y.; Liu, L.; Jin, Y.; Wu, N. Characterization and Development of Marine Natural Gas Hydrate Reservoirs in Clayey-Silt Sediments: A Review and Discussion. Adv. Geo-Energy Res. 2021, 5, 75–86. [Google Scholar] [CrossRef]
- Takahashi, N.; Kodaira, S.; Ito, A.; Shiobara, H.; Sugioka, H.; Kerr, B.; Vlad, I.; Klemperer, S.; Kaneda, Y.; Suyehiro, K. Deep Seismic Profiling across the Mariana Arc—Backarc System. J. Deep Sea Res. 2003, 23, 55–68. [Google Scholar]
- Anderson, B.J.; Kurihara, M.; White, M.D.; Moridis, G.J.; Wilson, S.J.; Pooladi-Darvish, M.; Gaddipati, M.; Masuda, Y.; Collett, T.S.; Hunter, R.B.; et al. Regional Long-Term Production Modeling from a Single Well Test, Mount Elbert Gas Hydrate Stratigraphic Test Well, Alaska North Slope. Mar. Pet. Geol. 2011, 28, 493–501. [Google Scholar] [CrossRef]
- Jung, J.-W.; Wan, J. Supercritical CO2 and Ionic Strength Effects on Wettability of Silica Surfaces: Equilibrium Contact Angle Measurements. Energy Fuels 2012, 26, 6053–6059. [Google Scholar] [CrossRef]
- Ma, H.L.; Feng, X.; Liu, L.; Zhang, A.; Wang, D. Changes in the effective absolute permeability of hydrate-bearing sands during isotropic loading and unloading. Petroleum Sci. 2025, in press. [Google Scholar] [CrossRef]
- Winters, W.J.; Dugan, B.; Collett, T.S. Physical Properties of Sediments from Keathley Canyon and Atwater Valley, JIP Gulf of Mexico Gas Hydrate Drilling Program. Mar. Pet. Geol. 2008, 25, 896–905. [Google Scholar] [CrossRef]
- Jang, J.; Carlos Santamarina, J. Fines Classification Based on Sensitivity to Pore-Fluid Chemistry. J. Geotech. Geoenviron. Eng. 2016, 142, 06015018. [Google Scholar] [CrossRef]
- Haigh, S.K.; Vardanega, P.J.; Bolton, M.D. The Plastic Limit of Clays. Géotechnique 2013, 63, 435–440. [Google Scholar] [CrossRef]
- Sridharan, A.; Nagaraj, H.B. Coefficient of Consolidation and Its Correlation with Index Properties of Remolded Soils. Geotech. Test. J. 2004, 27, 469–474. [Google Scholar] [CrossRef]
- Bigna, Y.; Oyeneyin, M.S.; Peden, J.M. Investigation of Pore-Blocking Mechanism in Gravel Packs in the Management and Control of Fines Migration. In Proceedings of the SPE Formation Damage Control Symposium, Lafayette, LA, USA, 7 February 1994. [Google Scholar]
- Khilar, K.C.; Fogler, H.S. Colloidally Induced Fines Migration in Porous Media. Rev. Chem. Eng. 1987, 4, 213–221. [Google Scholar] [CrossRef]
- Pratama, M.A.; Khan, H.J.; Daigle, H. A Review of Formation Damage Processes Encountered during Gas Hydrate Production. Geoenergy Sci. Eng. 2023, 228, 211958. [Google Scholar] [CrossRef]
- Chen, C.; Zhang, Y.; Li, X.; He, J.; Gao, F.; Chen, Z. Investigations into Methane Hydrate Formation, Accumulation, and Distribution in Sediments with Different Contents of Illite Clay. Appl. Energy 2024, 359, 122661. [Google Scholar] [CrossRef]
- Li, Y.; Han, S.; Zhang, B.; Tang, H.; Han, J.; Kang, H.; Zhao, Y.; Zhu, J. Nucleation and Dissociation of Carbon Dioxide Hydrate in the Inter- and Intra-Particle Pores of Dioctahedral Smectite: Mechanistic Insights from Molecular Dynamics Simulations. Appl. Clay Sci. 2022, 216, 106344. [Google Scholar] [CrossRef]
- Jang, J.; Cao, S.C.; Stern, L.A.; Jung, J.; Waite, W.F. Impact of Pore Fluid Chemistry on Fine-Grained Sediment Fabric and Compressibility. J. Geophys. Res. Solid Earth 2018, 123, 5495–5514. [Google Scholar] [CrossRef]
- Agi, A.; Junin, R.; Jaafar, M.Z.; Majid, Z.A.; Amin, N.A.S.; Sidek, M.A.; Yakasai, F.; Zaini, M.A.A.; Faizal, A.N.M.; Gbadamosi, A.; et al. Dynamic Stabilization of Formation Fines to Enhance Oil Recovery of a Medium Permeability Sandstone Core at Reservoir Conditions. J. Mol. Liq. 2023, 371, 121107. [Google Scholar] [CrossRef]
- Moghadasi, R.; Rostami, A.; Hemmati-Sarapardeh, A.; Motie, M. Application of Nanosilica for Inhibition of Fines Migration during Low Salinity Water Injection: Experimental Study, Mechanistic Understanding, and Model Development. Fuel 2019, 242, 846–862. [Google Scholar] [CrossRef]
- Kozhevnikov, E.; Turbakov, M.; Riabokon, E.; Gladkikh, E.; Guzev, M.; Panteleeva, A.; Ivanov, Z. Rock Permeability Evolution during Cyclic Loading and Colloid Migration after Saturation and Drying. Adv. Geo-Energy Res. 2024, 11, 208–219. [Google Scholar] [CrossRef]
- Bedrikovetsky, P.; Vaz, A.; Machado, F.; Zeinijahromi, A.; Borazjani, S. Well Productivity Decline Due to Fines Migration and Production: (Analytical Model for the Regime of Strained Particles Accumulation). In Proceedings of the SPE European Formation Damage Conference, Noordwijk, The Netherlands, 7–10 June 2011; p. SPE-144208-MS. [Google Scholar]
- Rengifo Barbosa, F.; Miri, R.; Salimi, M.; Nouri, A. Thermal Effects on Fines Migration: Insights from Sand Pack Experiments. Energies 2025, 18, 3471. [Google Scholar] [CrossRef]
- Han, G.; Kwon, T. Effect of Seepage Velocity on Pore Clogging Growth Behavior and Its Effect on Permeability Reduction During Fines Migration in Porous Media. Water Resour. Res. 2023, 59, e2022WR033537. [Google Scholar] [CrossRef]
- Cao, S.C.; Jang, J.; Jung, J.; Waite, W.F.; Collett, T.S.; Kumar, P. 2D Micromodel Study of Clogging Behavior of Fine-Grained Particles Associated with Gas Hydrate Production in NGHP-02 Gas Hydrate Reservoir Sediments. Mar. Pet. Geol. 2019, 108, 714–730. [Google Scholar] [CrossRef]
- Wang, J.; Wang, G.; Luo, S.; Liang, Y.; Sun, Z.; Hu, S.; Yang, Y. The Influence of Low-Permeability Geological Inclusions on the Seepage Behavior of Ionic Rare Earth Leaching Mining: A Study Using Visual Microfluidic Technology. Miner. Eng. 2023, 204, 108440. [Google Scholar] [CrossRef]
- Pandya, V.B.; Bhuniya, S.; Khilar, K.C. Existence of a Critical Particle Concentration in Plugging of a Packed Bed. AIChE J. 1988, 44, 978–981. [Google Scholar] [CrossRef]
- Agbangla, G.C.; Climent, É.; Bacchin, P. Experimental Investigation of Pore Clogging by Microparticles: Evidence for a Critical Flux Density of Particle Yielding Arches and Deposits. Sep. Purif. Technol. 2012, 101, 42–48. [Google Scholar] [CrossRef]
- He, T.; Mao, H.; Zhang, C.; Gu, Y.; Yang, B. Experimental Study on the Migration and Clogging of Fine Particles in Coarse-Grained Soil with Seepage. KSCE J. Civ. Eng. 2024, 28, 596–608. [Google Scholar] [CrossRef]
- Elrahmani, A.; Al-Raoush, R.I.; Abugazia, H.; Seers, T. Pore-Scale Simulation of Fine Particles Migration in Porous Media Using Coupled CFD-DEM. Powder Technol. 2022, 398, 117130. [Google Scholar] [CrossRef]
- Dou, X.; Liu, Z.; Yang, D.; Zhao, Y.; Li, Y.; Gao, D.; Ning, F. 3D CFD-DEM Modeling of Sand Production and Reservoir Compaction in Gas Hydrate-Bearing Sediments with Gravel Packing Well Completion. Comput. Geotech. 2025, 177, 106870. [Google Scholar] [CrossRef]
- Li, Y.; He, C.; Wu, N.; Chen, Q.; Liu, C.; Sun, Z.; Jin, Y.; Meng, Q. Laboratory Study on Hydrate Production Using a Slow, Multistage Depressurization Strategy. Geofluids 2021, 2021, 1–13. [Google Scholar] [CrossRef]
- Wu, J.; Ning, F.; Trinh, T.T.; Kjelstrup, S.; Vlugt, T.J.H.; He, J.; Skallerud, B.H.; Zhang, Z. Mechanical Instability of Monocrystalline and Polycrystalline Methane Hydrates. Nat. Commun. 2015, 6, 8743. [Google Scholar] [CrossRef] [PubMed]
- Valdes, J.R.; Santamarina, J.C. Clogging: Bridge Formation and Vibration-Based Destabilization. Can. Geotech. J. 2008, 45, 177–184. [Google Scholar] [CrossRef]
- Rege, S.D.; Fogler, H.S. A Network Model for Deep Bed Filtration of Solid Particles and Emulsion Drops. AIChE J. 1988, 34, 1761–1772. [Google Scholar] [CrossRef]
- Sharma, M.M.; Yortsos, Y.C. Fines Migration in Porous Media. AIChE J. 1987, 33, 1654–1662. [Google Scholar] [CrossRef]
- Fan, L.T.; Nassar, R.; Hwang, S.H.; Chou, S.T. Analysis of Deep Bed Filtration Data: Modeling as a Birth-death Process. AIChE J. 1985, 31, 1781–1790. [Google Scholar] [CrossRef]
- Muecke, T.W. Formation Fines and Factors Controlling Their Movement in Porous Media. J. Pet. Technol. 1979, 31, 144–150. [Google Scholar] [CrossRef]
- Song, Y.; Zhang, D.; Ranjith, P.G.; Zhou, Z.; Wu, B.; Kong, L.; Chen, L.; Huang, J. A Comprehensive Study of Fines Migration in Internally Unstable Natural Gas Hydrate Reservoirs. Powder Technol. 2024, 433, 119193. [Google Scholar] [CrossRef]
- Natsui, S.; Ueda, S.; Nogami, H.; Kano, J.; Inoue, R.; Ariyama, T. Gas–Solid Flow Simulation of Fines Clogging a Packed Bed Using DEM–CFD. Chem. Eng. Sci. 2012, 71, 274–282. [Google Scholar] [CrossRef]
- Li, R.; Han, Z.; Zhang, L.; Zhou, J.; Wang, S.; Huang, F. Numerical Determination of Anisotropic Permeability for Unconsolidated Hydrate Reservoir: A DEM–CFD Coupling Method. J. Mar. Sci. Eng. 2024, 12, 1447. [Google Scholar] [CrossRef]
- Chen, H.; Liu, W.; Chen, Z.; Zheng, Z. A Numerical Study on the Sedimentation of Adhesive Particles in Viscous Fluids Using LBM-LES-DEM. Powder Technol. 2021, 391, 467–478. [Google Scholar] [CrossRef]
- Liu, Y.; Wang, L.; Hong, Y.; Yin, Z.-Y. Coupled Thermo-Hydro-Mechanical-Chemical Modeling of Fines Migration in Hydrate-Bearing Sediments with CFD-DEM. Can. Geotech. J. 2023, 60, 701–717. [Google Scholar] [CrossRef]
- Cao, S.C.; Yuan, Y.; Jung, J.; Du, H.; Lv, X.; Li, X. Effects of End-Member Sediments on CO2 Hydrate Formation: Implications for Geological Carbon Storage. Adv. Geo-Energy Res. 2024, 14, 224–237. [Google Scholar] [CrossRef]
- Zhu, H.P.; Zhou, Z.Y.; Yang, R.Y.; Yu, A.B. Discrete Particle Simulation of Particulate Systems: Theoretical Developments. Chem. Eng. Sci. 2007, 62, 3378–3396. [Google Scholar] [CrossRef]
- Uchida, S.; Klar, A.; Yamamoto, K. Sand Production Model in Gas Hydrate-Bearing Sediments. Int. J. Rock Mech. Min. Sci. 2016, 86, 303–316. [Google Scholar] [CrossRef]
- Lei, J.; Wang, Y.; Guo, W. Migration Characteristics and Geohazards Risk Analysis of Swelling Clay in Clayey Silt Hydrate Sediments. Gas Sci. Eng. 2024, 126, 205347. [Google Scholar] [CrossRef]
- McDonald, J.C.; Whitesides, G.M. Poly(Dimethylsiloxane) as a Material for Fabricating Microfluidic Devices. Acc. Chem. Res. 2002, 35, 491–499. [Google Scholar] [CrossRef]
- Santamarina, J.C.; Klein, K.A.; Wang, Y.H.; Prencke, E. Specific Surface: Determination and Relevance. Can. Geotech. J. 2002, 39, 233–241. [Google Scholar] [CrossRef]
- Tsuji, Y.; Kawaguchi, T.; Tanaka, T. Discrete Particle Simulation of Two-Dimensional Fluidized Bed. Powder Technol. 1993, 77, 79–87. [Google Scholar] [CrossRef]
- Guyer, J.E.; Wheeler, D.; Warren, J.A. FiPy: Partial Differential Equations with Python. Comput. Sci. Eng. 2009, 11, 6–15. [Google Scholar] [CrossRef]
- Liu, L.; Dai, S.; Ning, F.; Cai, J.; Liu, C.; Wu, N. Fractal Characteristics of Unsaturated Sands − Implications to Relative Permeability in Hydrate-Bearing Sediments. J. Nat. Gas Sci. Eng. 2019, 66, 11–17. [Google Scholar] [CrossRef]
- Li, Y.-L.; Ning, F.-L.; Xu, M.; Qi, M.-H.; Sun, J.-X.; Nouri, A.; Gao, D.-L.; Wu, N.-Y. Experimental Study on Solid Particle Migration and Production Behaviors during Marine Natural Gas Hydrate Dissociation by Depressurization. Pet. Sci. 2023, 20, 3610–3623. [Google Scholar] [CrossRef]
- Xu, B.H.; Yu, A.B. Numerical Simulation of the Gas-Solid Flow in a Fluidized Bed by Combining Discrete Particle Method with Computational Fluid Dynamics. Chem. Eng. Sci. 1997, 52, 2785–2809. [Google Scholar] [CrossRef]
- Ergun, S.; Orning, A.A. Fluid Flow through Randomly Packed Columns and Fluidized Beds. Ind. Eng. Chem. 1949, 41, 1179–1184. [Google Scholar] [CrossRef]
- Liu, C.; Chen, Q. Analytical and Experimental Technology for Marine Gas Hydrate. J. Mar. Sci. Eng. 2025, 13, 782. [Google Scholar] [CrossRef]
- Sun, J.; Ning, F.; Liu, T.; Liu, C.; Chen, Q.; Li, Y.; Cao, X.; Mao, P.; Zhang, L.; Jiang, G. Gas Production from a Silty Hydrate Reservoir in the South China Sea Using Hydraulic Fracturing: A Numerical Simulation. Energy Sci. Eng. 2019, 7, 1106–1122. [Google Scholar] [CrossRef]
- Xiao, B.; Cao, W.; Zhou, L. Mesoscopic Perspective into the High-Temperature Triaxial Dilation of Asphalt Mixtures via PFC–FLAC Coupled Simulation. Materials 2025, 18, 1722. [Google Scholar] [CrossRef]
- Zhang, X.-P.; Wu, S.; Wang, S. Partly Clumped-Particles for Elastic Mismatch of Minerals and Joint Planes for Schist: A Numerical Simulation of DanBa Quartz Mica Schist. Deep Resour. Eng. 2025, 2, 100166. [Google Scholar] [CrossRef]
- Shi, D.; Zheng, L.; Xue, J.; Sun, J. DEM Modeling of Particle Breakage in Silica Sands under One-Dimensional Compression. Acta Mech. Solida Sin. 2016, 29, 78–94. [Google Scholar] [CrossRef]
- Yamamoto, K.; Terao, Y.; Fujii, T.; Ikawa, T.; Seki, M.; Matsuzawa, M.; Kanno, T. Operational Overview of the First Offshore Production Test of Methane Hydrates in the Eastern Nankai Trough. In Proceedings of the Offshore Technology Conference, Houston, TX, USA, 5–8 May 2014; p. D031S034R004. [Google Scholar]
- Jung, J.; Santamarina, J.C.; Soga, K. Stress-strain Response of Hydrate-bearing Sands: Numerical Study Using Discrete Element Method Simulations. J. Geophys. Res. Solid Earth 2012, 117, 2011JB009040. [Google Scholar] [CrossRef]
- Jung, J.W.; Jang, J.; Santamarina, J.C.; Tsouris, C.; Phelps, T.J.; Rawn, C.J. Gas Production from Hydrate-Bearing Sediments: The Role of Fine Particles. Energy Fuels 2012, 26, 480–487. [Google Scholar] [CrossRef]
- Zhang, P.; Gao, W.; Ding, Y.; Liu, B. Mesoscale Numerical Investigation of Fines Detachment, Migration, and Erosion Mechanisms in Gas Hydrate Extraction. Acta Geotech. 2025, 20, 5469–5486. [Google Scholar] [CrossRef]
- Sun, J.; Li, Z.; Furtado, F.; Aryana, S.A. A Microfluidic Study of Transient FLow States in Permeable Media Using FLuorescent Particle Image Velocimetry. Capillarity 2021, 4, 76–86. [Google Scholar] [CrossRef]
Disclaimer/Publisher’s Note: The statements, opinions and data contained in all publications are solely those of the individual author(s) and contributor(s) and not of MDPI and/or the editor(s). MDPI and/or the editor(s) disclaim responsibility for any injury to people or property resulting from any ideas, methods, instructions or products referred to in the content. |
© 2025 by the authors. Licensee MDPI, Basel, Switzerland. This article is an open access article distributed under the terms and conditions of the Creative Commons Attribution (CC BY) license (https://creativecommons.org/licenses/by/4.0/).