Abstract
This study evaluates the thermodynamic performance of the following two CO2 liquefaction processes for onboard carbon capture and storage (OCCS) on a 174,000 m3 LNG carrier: the Linde–Hampson and vapor compression refrigeration cycles. The cycles were designed based on realistic vessel operating conditions and compared using the specific energy consumption (SEC) as the primary performance indicator, alongside the coefficient of performance (COP). To enable a fair comparison of the two distinct cycles, a complementary COP metric was validated for the open-loop Linde–Hampson cycle by establishing a system-level definition of heat removal. The validity of this metric was confirmed by demonstrating that its optimal point (maximum COP) aligns with that of the primary metric (minimum SEC), ensuring thermodynamic consistency. The analysis reveals that the vapor compression cycle demonstrates superior performance, achieving an 8.35% higher COP and an 11.45% lower SEC than the Linde–Hampson cycle. This work provides a consistent methodology for the comparative assessment of open- and closed-loop liquefaction systems.
1. Introduction
Global warming caused by climate change has become a critical issue, and international efforts to protect the environment have thus been strengthened [1]. The International Maritime Organization (IMO) adopted the revised IMO Greenhouse Gas (GHG) strategy at the 80th Marine Environment Protection Committee (MEPC) [2]. The revised strategy aims to reduce GHG emissions per ship by at least 40% by 2030 compared to 2008 levels, achieve a 70% reduction by 2040, and reach net-zero emissions by 2050 [3,4]. Furthermore, at the 83rd MEPC, amendments to the International Convention for the Prevention of Pollution from Ships (MARPOL) Annex VI were approved to establish the IMO net-zero framework, introducing a GHG fuel intensity (GFI) standard. New regulations regarding onboard carbon capture and storage (OCCS) systems were also included [5,6].
In response to these strengthened international regulations, the maritime industry is accelerating the transition to zero-carbon fuels, such as hydrogen (H2) and ammonia (NH3), which do not emit carbon dioxide (CO2) during combustion [7]. However, their immediate adoption is limited by their low technological maturity and safety concerns. Although liquefied natural gas (LNG) is not a zero-carbon fuel, it emits fewer nitrogen oxides (NOx) and CO2 emissions than conventional marine fuels [8]. Moreover, LNG offers advantages such as a high calorific value, a lower environmental risk, and a relatively low fuel cost. Therefore, LNG has been evaluated as a practical fuel that can be commercialized prior to the introduction of zero-carbon fuels [9,10].
The number of LNG-fueled ship orders has been steadily increasing. As of 2024, 169 vessels had been delivered and 264 additional orders placed, with LNG-fueled ships projected to account for 24% of the global merchant fleet by 2050 [11,12]. The application of LNG propulsion to large vessels began in 2012 and has expanded to carriers with capacities of 165,000–175,000 m3 [13].
Until the full-scale transition to zero-carbon fuels is achieved, the increasing number and size of LNG-fueled ships will inevitably result in higher CO2 emissions. To mitigate this, the adoption of OCCS systems has been proposed [14]. An OCCS system captures CO2 from exhaust gases during voyages, liquefies and stores it onboard, and subsequently transports it to port facilities for unloading. It is increasingly recognized as an effective solution to reduce carbon emissions and ensure compliance with the energy efficiency design index (EEDI) regulations [15]. OCCS technologies are generally classified into pre-combustion, post-combustion, and oxy-fuel combustion methods. Among these, the post-combustion approach is the most widely applied, due to its compatibility with existing ship engines and propulsion systems [16,17]. The captured CO2 is liquefied and stored onboard, as liquid storage provides a higher density and thus greater efficiency for long-distance transportation and unloading compared to compressed gas storage [18].
Several studies have examined the design and performance of onboard CO2 liquefaction systems, with particular emphasis on their energy efficiency, exergy efficiency, and economic feasibility. Chen and Morosuk [19] compared a three-stage vapor compression system and the precooled Linde–Hampson system for a large-scale land-based system for a 500 MW pulverized coal-fired power plant. Their work, simulated using ASPEN HYSYS V11, was focused on a large-scale land-based system for a 500 MW pulverized coal-fired power plant. The results of their simulation indicated that the vapor compression system using R-290 refrigerant at 15 bar provided superior energy efficiency and economic performance. Seo et al. [20] evaluated four CO2 liquefaction systems applicable to OCCS systems using the Figure of Merit (FOM) and Life Cycle Cost (LCC) and identified the three-stage vapor compression system with ammonia refrigerant at 15 bar as the most efficient system in terms of both the FOM and economic performance. Aliyon et al. [21] conducted a comparative analysis CO2 liquefaction systems: the Linde–Hampson, dual-pressure Linde–Hampson, vapor compression, and an integrated absorption refrigeration system. They determined that the vapor compression refrigeration system achieved the highest Coefficient of Performance (COP) and exergy efficiency, as well as the lowest LCC. An exergo-economic analysis was also conducted to evaluate potential performance improvements in the main components.
These studies have provided insights into the design and performance of various CO2 liquefaction systems, often identifying the vapor compression system as highly efficient. Building upon this work, the present study addresses two specific areas for further investigation. First, while prior research has focused on large-scale, land-based applications or general system comparison, this study provides a detailed application-specific analysis for an OCCS system on a 174,000 m3 LNG carrier, considering its specific onboard operation constraints. Second, while previous studies have calculated the COP for open-loop cycles, a methodological validation that reconciles COP with the primary liquefaction metric, Specific Energy Consumption (SEC), has not been a central focus. This research addresses that point by validating a consistent COP framework, ensuring a robust thermodynamic basis for comparing open- and closed-loop technologies.
The remainder of this paper is structured as follows. Section 2 outlines the materials and methods, including the design of the CO2 liquefaction system and presents the thermodynamics performance indicators and COP evaluation method for the Linde–Hampson refrigeration cycle. Section 3 presents and discusses the results of the comparative analysis of the two liquefaction systems. Finally, Section 4 summarizes the main conclusions.
2. Materials and Methods
2.1. Description of CO2 Liquefaction
This study provides a comparative analysis of two CO2 liquefaction systems for onboard applications: the open-loop Linde–Hampson cycle and the closed-loop vapor compression refrigeration cycle. In Linde–Hampson cycle, CO2 is liquefied through a series of compression, condensation, and expansion processes, using CO2 itself as the working fluid. It does not require an external refrigerant. The system configuration is illustrated in Figure 1, and its operational procedure is as follows:
- (1)
- Compression: The captured gas undergoes a three-stage low-pressure compression, followed by a two-stage high-pressure compression. After each stage, the gas is cooled in an intercooler. At the inlet of the first high-pressure compressor, the gas discharged from the aftercooler of the third low-pressure compressor is mixed with the separated CO2 vapor, which has been heated in the heat exchanger.
- (2)
- Condensation: The compressed CO2 becomes saturated in the aftercooler and is subsequently supercooled in the heat exchanger. During this process, heat is transferred from the compressed CO2 to the separated CO2 vapor.
- (3)
- Expansion: The high-pressure supercooled liquid expands through the Joule–Thomson valve, producing a low-temperature vapor–liquid mixture. In the downstream separator, CO2 is separated into gas and liquid phases. The separated CO2 vapor is recycled to the inlet of the first high-pressure compressor via the heat exchanger, while the liquified CO2 is transferred to the storage tank.

Figure 1.
Process flow diagram of the Linde–Hampson refrigeration cycle system.
The closed refrigeration system is based on a vapor compression refrigeration cycle, in which ammonia is used as the refrigerant [22,23]. This cycle consists of the following stages: compression, condensation, expansion, and evaporation. The system configuration is shown in Figure 2, and its operation can be described as follows:
- (1)
- Compression and condensation: The ammonia refrigerant undergoes three stages of compression, which raise its pressure and temperature. Each stage has its aftercooler that dissipates heat from the compressed gas. Then, after the third-stage compressor, the high-temperature and high-pressure refrigerant is condensed into a liquid state in a condenser.
- (2)
- Expansion: The high-pressure liquid refrigerant is expanded through a Joule–Thomson valve, resulting in a low-pressure mixture of liquid and vapor.
- (3)
- Evaporation: The low-temperature refrigerant absorbs heat from the captured CO2 stream through the heat exchanger. This heat input causes the refrigerant to evaporate, completing the cycle and preparing it for compression.

Figure 2.
Process flow diagram of the vapor compression refrigeration cycle system.
2.2. Basis of Design
To ensure the practical relevance of the comparative analysis, this study selects an OCCS system installed on a 174,000 m3 class LNG carrier, which currently represents the most widely ordered ship type [24,25]. The ship is equipped with two WinGD 5X72DF-C2.1 propulsion engines (Winterthur Gas & Diesel Ltd., Winterthur, Switzerland), with the engine load assumed to be 50% [26,27]. The exhaust gas mass flow rate was obtained from engine data provided by the WinGD GTD program. The mass flow rate of the captured CO2 was calculated based on the exhaust gas mass flow rate, the CO2 concentration in the exhaust gas, and the capture rate. The specifications are summarized in Table 1 [28,29,30].

Table 1.
Specifications of the vessel, exhaust gas, and captured gas.
Each system was modeled and simulated using Aspen HYSYS V14 (Aspen Technology, Inc., Bedford, MA, USA) with the Peng–Robinson equation of state. The key equipment assumptions and process boundary conditions, selected to reflect a realistic onboard environment, are summarized as follows [19,20,21,29,31]:
- Compressor adiabatic efficiency: 75% [20];
- Maximum compressor pressure ratio: 3 [20];
- Pressure drop across coolers and heat exchangers: 50 kPa [20,21];
- Minimum approach temperature in heat exchangers: 3 °C [21];
- Refrigerant side inlet and outlet pressures in the vapor compression refrigeration cycle heat exchanger: 101.3 kPa and 100 kPa, respectively (vacuum condition considered);
- Captured CO2 composition: 100% [19,21];
- Captured gas pressure and temperature: 150 kPa, 40 °C [19,21];
- Storage pressure and temperature: 1500 kPa, −27.71 °C [29];
- Sea water temperature: 30 °C [29].
2.3. Design of CO2 Liquefaction Systems
The simulation results of the two systems are summarized in Table 2 and Table 3. The corresponding stream numbers are indicated in Figure 1 and Figure 2.
Table 2.
Steady-state simulation result of the Linde–Hampson refrigeration system.
Table 3.
Steady-state simulation result of the vapor compression refrigeration system.
In the Linde–Hampson refrigeration cycle system, the captured CO2 gas is supplied at 150 kPa and 40 °C. After three stages of low-pressure compression, the gas reaches 1550 kPa and 116.3 °C, with intercooling to 35 °C after each stage. After two stages of high-pressure compression, the pressure and temperature rise to 9950 kPa and 128.7 °C, after which the gas is cooled to 35 °C to form a saturated liquid at 9900 kPa. It is then subcooled to 28.58 °C in the heat exchanger and expanded through the Joule–Thomson valve, yielding a vapor–liquid equilibrium state. The gas and liquid are separated in the separator. The separated gas exchanges heat with the compressed gas and is recycled to the high-pressure compressor inlet, while the liquid is stored in a saturated state at 1500 kPa and −27.71 °C.
For the vapor compression refrigeration cycle, the captured CO2 enters under the same inlet conditions. After undergoing three stages of compression, the pressure and temperature rise to 1650 kPa and 118.3 °C, with each stage followed by cooling to 35 °C. The compressed gas is subsequently subcooled in the heat exchanger and expanded through the valve, producing liquefied CO2 in a saturated state at 1500 kPa and −27.71 °C. The refrigerant loop in this system operates independently of the CO2 stream. Ammonia, serving as the refrigerant, is compressed in three stages, reaching 1400 kPa and 136.7 °C. At the downstream of the final compressor, the refrigerant is condensed in a cooler to form a high-pressure liquid at 1350 kPa and 35 °C. Expansion through the Joule–Thomson valve reduces its pressure to 101.3 kPa and temperature −33.26 °C, reaching a vapor–liquid equilibrium state. After exchanging heat with the captured CO2, the refrigerant returns to the cycle as a gaseous state at 100 kPa and 32 °C.
2.4. Thermodynamic Performance Indicators
We evaluated the two systems by using two performance indicators derived from the first law of thermodynamics: the COP and SEC.
2.4.1. Specific Energy Consumption (SEC)
For a liquefaction process, where the product is a liquefied mass of gas, the most direct and practical metric for energy efficiency is the SEC. It is the standard indicator for assessing liquefaction systems [22,32], as it clearly represents the energy cost required to produce a unit mass of the desired product. It is defined as
where is the total power consumption of all the compressors, and is the mass flow rate of the liquefied CO2.
2.4.2. Establishing a Common Thermodynamic Framework: The Coefficient of Performance (COP)
The COP is a key indicator of a refrigeration system’s efficiency, representing how effectively heat is removed relative to the energy input [19,21]. It is defined as the ratio of the heat removed () to the total energy supplied to the system (), as expressed in Equation (2):
While COP is clearly defined for the closed-loop vapor compression cycle, its application to the open-loop Linde–Hampson cycle is not straightforward. This difficulty arises because the system does not use a separate refrigerant with a distinct evaporator load that defines ; instead, the refrigeration effect is distributed throughout the process.
However, the primary goal of this study is to establish a consistent thermodynamic framework to compare the fundamentally different open-loop Linde–Hampson and closed-loop vapor compression cycles. While SEC is a product-based metric that quantifies the overall energy cost per unit of liquefied gas, COP functions as a mechanism-based metric. It compares the internal thermodynamic efficiencies of the thermodynamic process: the conversion of input work into a useful heat removal effect. By establishing a system-level definition of for the Linde–Hampson cycle that is conceptually analogous to the evaporator load in the vapor compression cycle, we can directly compare how efficiently each system’s machinery performs this core task. Therefore, developing and validating this metric is essential for a robust comparative analysis.
2.4.3. Defining and Validating a System-Level for the Linde–Hampson Cycle
To determine an appropriate definition of for the Linde–Hampson cycle, we considered three alternatives based on the heat removed by different system boundaries: (1) the aftercooler, (2) the heat exchanger, and (3) the overall system. Unlike conventional refrigeration systems with a single evaporator, the Linde–Hampson cycle achieves its cooling effect through a distributed process involving intercoolers, aftercoolers, and the Joule–Thomson expansion. Consequently, defining based on any single component would be inherently arbitrary and incomplete, as it would neglect the contributions of other stages and thus fail to capture the total thermodynamic effort. Therefore, defining as the total heat removed from the overall system provides the most physically consistent representation of the system’s total useful cooling effect.
The validity of this approach was subsequently confirmed by demonstrating its thermodynamic consistency with the primary performance metric, the SEC. The analysis in Section 3.1 shows that the pressure yielding the maximum COP under this definition is identical to the pressure yielding the minimum SEC. This correspondence validates our choice and confirms that defining based on the overall system is the most appropriate method for performance evaluation.
2.4.4. Complementary Insights from SEC and COP
The SEC and the system-level COP are complementary indicators that offer different perspectives on system performance. SEC is a product-based metric (), quantifying the overall cost per unit mass of liquefied CO2, thereby assessing the overall practical outcome. In contrast, COP is a mechanism-based metric (), which evaluates the intrinsic efficiency of the underlying thermodynamic machinery responsible for heat removal.
A fair comparison between two different architectures, such as an open-loop and a closed-loop system, necessitates making this distinction. The final product output measured by SEC is influenced by multiple factors, not just the cycle efficiency. Using both metrics allows for a more in-depth analysis: COP reveals the fundamental efficiency of the heat removal machinery itself, while SEC captures the all-encompassing result. This is crucial because it helps identify the true sources of performance advantages or disadvantages—whether they lie within the core thermodynamic cycle or elsewhere in the process design. Therefore, this approach enables a more robust and complete comparison than could be achieved with either metric in isolation.
3. Results and Discussion
3.1. Validation of the COP Evaluation Method for the Linde–Hampson Cycle
To apply the proposed COP evaluation method, the COP and SEC were evaluated across a Joule–Thomson inlet pressure range from 7950 kPa to 11,450 kPa in 100 kPa increments. Figure 3, Figure 4 and Figure 5 illustrate the COP values obtained from each definition of , alongside the corresponding SEC.
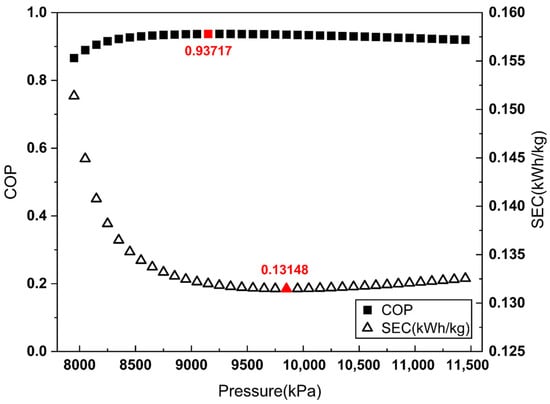
Figure 3.
COP and SEC vs. Joule–Thomson valve inlet pressure (aftercooler-based ).
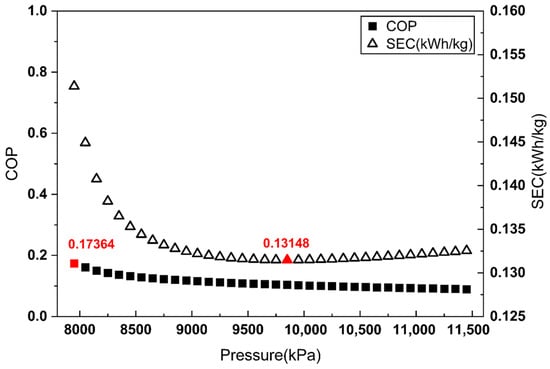
Figure 4.
COP and SEC vs. Joule–Thomson valve inlet pressure (heat exchanger-based ).
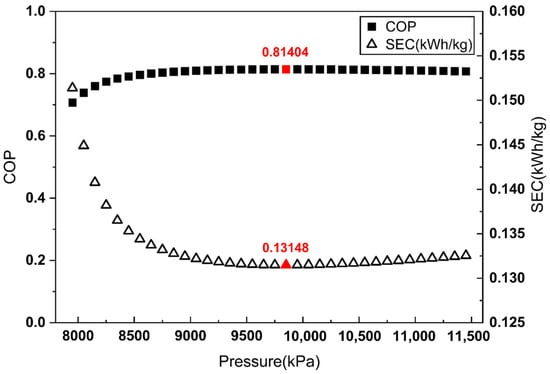
Figure 5.
COP and SEC vs. Joule–Thomson valve inlet pressure (overall system-based ).
As shown in Figure 3 and Figure 4, when is defined by the heat removed in the aftercooler or the heat exchanger, the pressure maximizing the COP does not match the pressure minimizing the SEC. By contrast, Figure 5 demonstrates that when is defined as the heat removed from the overall system, the COP maximum coincides with the SEC minimum.
These results indicate that defining as the total heat removal from the overall system is the most reasonable approach for COP evaluation in liquefaction systems without external refrigerants, such as the Linde–Hampson refrigeration cycle.
3.2. Comparison of the Two CO2 Liquefaction System Performance
In this section, the performance of the two CO2 liquefaction systems is presented and discussed in terms of the COP and SEC. To ensure a rational comparison, the optimal inlet pressure of the Joule–Thomson valve in the refrigerant cycle was also determined for the vapor compression system. The COP and SEC were evaluated over an inlet pressure range of 1350 kPa to 1800 kPa in 25 kPa increments. At pressures below 1350 kPa, the cooling capacity of the valve was insufficient to achieve complete liquefaction of the refrigerant. Consequently, the cooling effect of the CO2 side Joule–Thomson valve decreased, and the optimization range was set at 1350 kPa or higher. The optimal operating point of the vapor compression refrigeration cycle is presented in Figure 6.
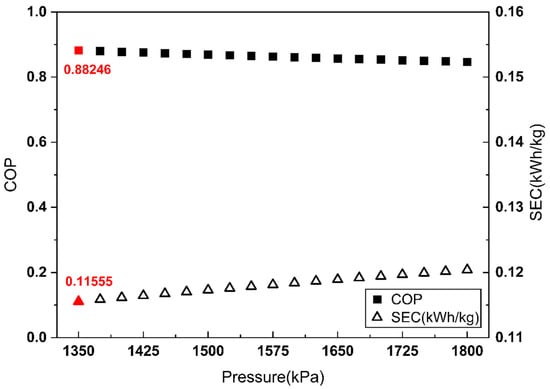
Figure 6.
COP and SEC vs. Joule–Thomson valve inlet pressure of the refrigerant side (vapor compression refrigeration cycle).
As shown in Figure 6, for the vapor compression cycle, the COP maximum and SEC minimum coincide at a refrigerant-side Joule–Thomson valve inlet pressure of 1350 kPa.
The Linde–Hampson and vapor compression refrigeration cycles required 3677 kW and 3232 kW of power, respectively, with their Joule–Thomson valve inlet pressures set to the optimal values (Figure 7 and Figure 8). The higher power demand of the Linde–Hampson system arises from the larger flow rates handled by the high-pressure compressors. With COP and SEC values of 0.814 and 0.131, respectively, for the Linde–Hampson cycle and 0.882 and 0.116, respectively, for the vapor compression cycle, the latter demonstrated superior efficiency, achieving an 8.35% higher COP and an 11.45% lower SEC under identical boundary conditions (Figure 9 and Table 4).
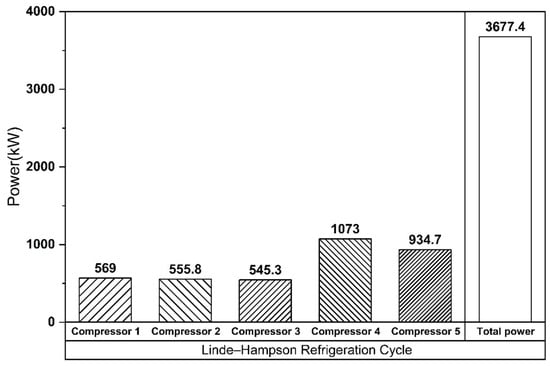
Figure 7.
Compressor energy consumption (Linde–Hampson refrigeration cycle).
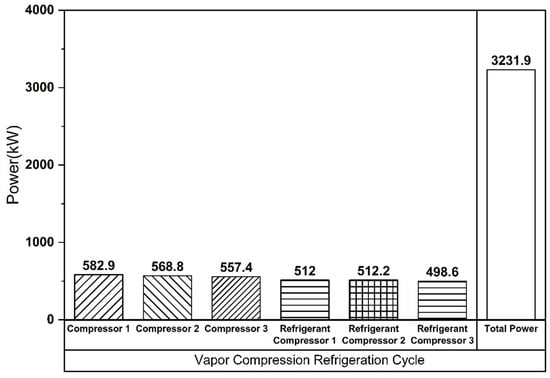
Figure 8.
Compressor energy consumption (vapor compression refrigeration cycle).
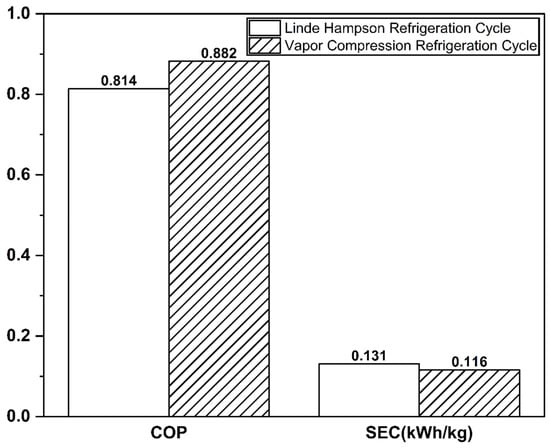
Figure 9.
COP and SEC comparison of the two CO2 liquefaction systems.
Table 4.
COP, SEC, and relative difference for the two different CO2 liquefaction systems.
4. Conclusions
This study investigated two CO2 liquefaction systems for OCCS in a 174,000 m3 LNG carrier: the Linde–Hampson and the vapor compression refrigeration cycle. Their performance was evaluated using the COP and SEC. Our comparative analysis demonstrated that the vapor compression cycle is the more energy-efficient option. Under optimized conditions, the vapor compression cycle achieved an 8.35% higher COP and an 11.34% lower SEC than the Linde–Hampson cycle.
A key contribution of this work is the methodological framework that reconciles the concepts of COP and SEC for comparing open- and closed-loop liquefaction systems. By defining heat removal () based on the overall system and demonstrating the optimal points for maximizing COP and minimizing SEC align, this study establishes a robust and consistent basis for performance analysis. This validated methodology not only underpins the findings of this specific OCCS comparison but also provides a reliable tool for future assessments of diverse refrigeration and liquefaction technologies. Future research will build upon this validated foundation, extending the analysis to exergy-based methods to further refine system for CO2 liquefaction systems.
Author Contributions
S.P.: Conceptualization, Methodology, Numerical simulation, Writing—Original Draft Preparation. S.J.: Conceptualization, Investigation. Y.C.: Methodology, Supervision. J.L.: Conceptualization, Supervision, Writing—Review and Editing. All authors have read and agreed to the published version of the manuscript.
Funding
This research was supported by the Korea Institute of Marine Science & Technology Promotion (KIMST), funded by the Ministry of Oceans and Fisheries, Korea (RS-2024-00410200).
Data Availability Statement
Data are contained within the article.
Conflicts of Interest
The authors declare that they have no known competing financial interests or personal relationships that could have appeared to influence the work reported in this paper. The funding source had no role in study design; in the collection, analysis, and interpretation of data; in the writing of the report; and in the decision to submit the article for publication.
Nomenclature
| Abbreviations | |
| COP | Coefficient of performance |
| CO2 | Carbon dioxide |
| EEDI | Energy efficiency design index |
| FOM | Figure of merit |
| GHG | Greenhouse gas |
| H2 | Hydrogen |
| IMO | International maritime organization |
| LCC | Life cycle cost |
| LNG | Liquefied natural gas |
| MARPOL | International convention for the prevention of pollution from ships |
| MEPC | Marine environment protection committee |
| NH3 | Ammonia |
| NOx | Nitrogen oxide |
| OCCS | Onboard carbon capture and storage |
| SEC | Specific energy consumption |
| Variables | |
| Enthalpy of the stream entering the considered equipment or system (kJ/kg) | |
| Enthalpy of the stream exiting the considered equipment or system (kJ/kg) | |
| Mass flow rate through the considered equipment or system (kg/s) | |
| Liquefied CO2 mass flow rate (kg/s) | |
| Mass flow rate of the refrigerant circulating through the heat exchanger (kg/s) | |
| Amount of heat removed from the system (kW) | |
| Total power consumption of the system (kW) | |
| Subscripts | |
| Inlet stream | |
| Linde–Hampson refrigeration cycle | |
| Outlet stream |
References
- Yi, C.J. A Study on Discussions on International Cooperation in response to Climate Change and Measures to Improve Domestic Legislation. Wonkwang Law Rev. 2024, 40, 101–120. [Google Scholar]
- Marine Environment Protection Committee (MEPC 80). Available online: https://www.imo.org/en/mediacentre/meetingsummaries/pages/mepc-80.aspx (accessed on 4 August 2025).
- Bilgili, L.; Ölçer, A.I. IMO 2023 strategy-Where are we and what’s next? Mar. Policy 2024, 160, 105953. [Google Scholar] [CrossRef]
- Jeong, S.; Kim, J.-S.; Kim, Y.-T. Optimization study of BOG re-liquefaction process for ammonia fueled ship. J. Adv. Mar. Eng. Technol. 2024, 48, 167–176. [Google Scholar] [CrossRef]
- IMO MEPC 83: GHG Requirements Approved, Taking Effect from 2028 [WWW Document] n.d. Available online: https://www.dnv.com/news/2025/imo-mepc-83-ghg-requirements-approved-taking-effect-from-2028/ (accessed on 2 September 2025).
- Xing, H.; Chang, S.; Ma, R.; Wang, K. EU MRV Data-Based Review of the Ship Energy Efficiency Framework. J. Mar. Sci. Eng. 2025, 13, 1437. [Google Scholar] [CrossRef]
- Al-Enazi, A.; Okonkwo, E.C.; Bicer, Y.; Al-Ansari, T. A review of cleaner alternative fuels for maritime transportation. Energy Rep. 2021, 7, 1962–1985. [Google Scholar] [CrossRef]
- Huy, N.Q.; Duong, P.A.; Nam, T.T.; Ha, T.T.T.; Ryu, B.R.; Kang, H. A novel proposal for a marine fuel cell system utilizes LNG as a sustainable and green fuel for the future of shipping. J. Adv. Mar. Eng. Technol. 2024, 48, 46–54. [Google Scholar] [CrossRef]
- Pavlenko, N.; Comer, B.; Zhou, Y.; Clark, N.; Rutherford, D. The Climate Implications of Using LNG as a Marine Fuel; International Council on Clean Transportation: Washington, DC, USA, 2020. [Google Scholar]
- Solakivi, T.; Paimander, A.; Ojala, L. Cost competitiveness of alternative maritime fuels in the new regulatory framework. Transp. Res. Part D Transp. Environ. 2022, 113, 103500. [Google Scholar] [CrossRef]
- DNV LNG Powers Unprecedented Year for Orders of Alternative-Fuelled Vessels. Available online: https://www.dnv.com/news/lng-powers-unprecedented-year-for-orders-of-alternative-fuelled-vesselss/?utm_source=chatgpt.com (accessed on 11 May 2025).
- Lloyd’s Register LNG’s Critical Role in Shipping’s Energy Transition. Available online: https://www.lr.org/en/knowledge/press-room/press-listing/press-release/2025/lngs-critical-role-in-shippings-energy-transition-revealed-in-lloyds-registers-latest-fuel-for-thought-report/?utm_source=chatgpt.com (accessed on 11 May 2025).
- KOGAS Global LNG Carrier Status. Available online: https://www.kogas.or.kr/site/eng/1060101020000 (accessed on 11 May 2025).
- Zanobetti, F.; Pio, G.; Bucelli, M.; Miani, L.; Jafarzadeh, S.; Cozzani, V. Onboard carbon capture and storage (OCCS) for fossil fuel-based shipping: A sustainability assessment. J. Clean. Prod. 2024, 470, 143343. [Google Scholar] [CrossRef]
- Lee, S.; Yoo, S.; Park, H.; Ahn, J.; Chang, D. Novel methodology for EEDI calculation considering onboard carbon capture and storage system. Int. J. Greenh. Gas Control 2021, 105, 103241. [Google Scholar] [CrossRef]
- Zhao, T.; Li, R.; Zhang, Z.; Song, C. Current status of onboard carbon capture and storage (OCCS) system: A survey of technical assessment. Carbon Capture Sci. Technol. 2025, 15, 100402. [Google Scholar] [CrossRef]
- Ansaloni, L.; Alcock, B.; Peters, T.A. Effects of CO2 on polymeric materials in the CO2 transport chain: A review. Int. J. Greenh. Gas Control 2020, 94, 102930. [Google Scholar] [CrossRef]
- Park, J.; Gbadago, D.Q.; Hwang, S. Efficient CO2 Dehydration and Liquefaction Processes for Onboard Carbon Capture Storage in Maritime Transport; Social Science Research Network (SSRN): Rochester, NY, USA, 2024. [Google Scholar] [CrossRef]
- Chen, F.; Morosuk, T. Exergetic and Economic Evaluation of CO2 Liquefaction Processes. Energies 2021, 14, 7174. [Google Scholar] [CrossRef]
- Seo, Y.; You, H.; Lee, S.; Huh, C.; Chang, D. Evaluation of CO2 liquefaction processes for ship-based carbon capture and storage (CCS) in terms of life cycle cost (LCC) considering availability. Int. J. Greenh. Gas Control 2015, 35, ISOPE-I-14-094. [Google Scholar] [CrossRef]
- Aliyon, K.; Mehrpooya, M.; Hajinezhad, A. Comparison of different CO2 liquefaction processes and exergoeconomic evaluation of integrated CO2 liquefaction and absorption refrigeration system. Energy Convers. Manag. 2020, 211, 112752. [Google Scholar] [CrossRef]
- Øi, L.E.; Eldrup, N.; Adhikari, U.; Bentsen, M.H.; Badalge, J.L.; Yang, S. Simulation and Cost Comparison of CO2 Liquefaction. Energy Procedia 2016, 86, 500–510. [Google Scholar] [CrossRef]
- Kim, J.-S.; Kim, D.-Y.; Kim, J.-S.; Kim, D.-Y. Thermodynamic and Economic Analysis of Cargo Boil-Off Gas Re-Liquefaction Systems for Ammonia-Fueled LCO2 Carriers. J. Mar. Sci. Eng. 2024, 12, 1642. [Google Scholar] [CrossRef]
- Firm Orderbook Anticipates 1000-Strong LNGC Fleet. Available online: https://www.rivieramm.com/news-content-hub/news-content-hub/firm-orderbook-anticipates-1000-strong-lngc-fleet-76930?utm_source=chatgpt.com (accessed on 11 May 2025).
- Twofold Increase in Lng Vessel Orders Playing out Against the Backdrop of Elevated Newbuilding Prices. Available online: https://www.offshore-energy.biz/twofold-increase-in-lng-vessel-orders-playing-out-against-the-backdrop-of-elevated-newbuilding-prices/?utm_source=chatgpt.com (accessed on 11 May 2025).
- Capital Maritime’s Approach to Decarbonisation: LNG Now and Ammonia Later. Available online: https://www.rivieramm.com/news-content-hub/news-content-hub/capital-maritimes-approach-to-decarbonisation-lng-now-and-ammonia-later-81705 (accessed on 11 May 2025).
- WinGD General Technical Data. Available online: https://wingd.com/products-solutions/engines/general-technical-data (accessed on 11 May 2025).
- Subramanian, N.; Madejski, P. Analysis of CO2 capture process from flue-gases in combined cycle gas turbine power plant using post-combustion capture technology. Energy 2023, 282, 128311. [Google Scholar] [CrossRef]
- Seo, Y.; Huh, C.; Lee, S.; Chang, D. Comparison of CO2 liquefaction pressures for ship-based carbon capture and storage (CCS) chain. Int. J. Greenh. Gas Control 2016, 52, 1–12. [Google Scholar] [CrossRef]
- Sanpasertparnich, T.; Idem, R.; Bolea, I.; deMontigny, D.; Tontiwachwuthikul, P. Integration of post-combustion capture and storage into a pulverized coal-fired power plant. Int. J. Greenh. Gas Control 2010, 4, 499–510. [Google Scholar] [CrossRef]
- Böttcher, N.; Taron, J.; Kolditz, O.; Liedl, R.; Park, C.-H. Comparison of Equations of State for Carbon Dioxide for Numerical Simulations; The International Association of Hydrological Sciences (IAHS): Wallingford, UK, 2011; p. 355. [Google Scholar]
- Lee, J.; Son, H.; Oh, J.; Yu, T.; Kim, H.; Lim, Y. Advanced process design of subcooling re-liquefaction system considering storage pressure for a liquefied CO2 carrier. Energy 2024, 293, 130556. [Google Scholar] [CrossRef]
Disclaimer/Publisher’s Note: The statements, opinions and data contained in all publications are solely those of the individual author(s) and contributor(s) and not of MDPI and/or the editor(s). MDPI and/or the editor(s) disclaim responsibility for any injury to people or property resulting from any ideas, methods, instructions or products referred to in the content. |
© 2025 by the authors. Licensee MDPI, Basel, Switzerland. This article is an open access article distributed under the terms and conditions of the Creative Commons Attribution (CC BY) license (https://creativecommons.org/licenses/by/4.0/).