Abstract
Cavitation is an undesirable phenomenon in the pumps. In this paper, unsteady cavitation flow in a low-specific-speed centrifugal pump with an inducer is investigated based on the full cavitation model and standard k-ε turbulence model using the commercial software PumpLinx. The numerical results of external performance curve and cavitation performance curve of design condition agree well with that of the experiment. The bubbles in the inducer mainly appear on the outer blade leading edge. The regions of larger vapor volume fraction in the inducer and impeller increase with the decreasing of NPSHa. The regions of larger vapor volume fraction in the inducer expand from the outer edge of the blade inlet to the hub on suction surface. Under very low NPSHa, the impeller may be filled with bubbles in the passage and the pump head drops drastically, and there exist distinct back flows near the suction surface of the blade and impeller outlet. Affected by pre-swirl of inducer outlet and the circle flow of impeller blade inlet, the amplitude of pressure fluctuation near the impeller inlet is obviously larger than that at the inlet in the inducer. The dominant frequency of pressure fluctuation for four monitoring points is shaft frequency. Compared with the non-cavitation flows, the maximum amplitudes of pressure pulsation increase for cavitating flow.
1. Introduction
Low-specific-speed centrifugal pumps are widely used in petrochemical, aerospace, and chemical industries to deliver low flow rate and high-head liquids, but there exist many problems to be solved, such as poor cavitation performance [1]. Cavitation is a process of vapor bubble formation in low-pressure flow regions and an undesirable phenomenon in pumps. Cavitation induces pressure fluctuation and uneven load distribution, thereby seriously reducing the efficiency of pumps and affecting their operational stability [2]. Therefore, pump cavitation, as a main cause of pump damage, should be avoided.
Many studies have been done to investigate the cavitation in pump by numerical simulation and experiment. Tan et al. [3] studied unsteady cavitation flow in a centrifugal pump operating under off-design conditions using the transport equation-based cavitation model coupled with the re-normalization group RNG k-ε turbulence model. Fu et al. [4] analyzed the flow characteristics in the impeller passage of a nuclear centrifugal pump model under steady and transient cavitation conditions based on the SST k-ω turbulence model and Zwart–Gerber–Belamri model for cavitation simulation. Xu et al. [5] analyzed the influence of blade surface roughness on the cavitation flow field and found that the volume fraction of bubbles in the impeller increases with the increase in wall roughness. Fu et al. [6] analyzed the flow instabilities and cavitation phenomenon in a centrifugal pump operating at low flow rates and found that the different flow rates correspond to different kinds of cavitation flow structures. Puplaa et al. [7] investigated the transient cavitating behavior and characterized the influence of low inlet pressure on the startup of the pump. Fecser et al. [8] measured the cavitation performance of the centrifugal pump and performed the simulation to present the occurring processes during cavitation. Bachert et al. [9] observed that the cavitation mainly occurs in the area of impeller inlet by high-speed camera and found that cavitation will cause severe erosion to the solid surface of centrifugal pump. Al-Obaidi A. R. [10] clarified that the level of cavitation within a centrifugal pump linked with the flow rate and rotational speed through the vibration technique. Lu et al. [11] investigated the pressure fluctuations in the different positions of pump under the unsteady cavitation conditions and indicated that the dominant frequencies of the pressure fluctuation at pump inlet and out are the shaft frequency and blade passing frequency, respectively.
An inducer placed upstream of the centrifugal impeller is an effective method to improve its cavitation resistance. Jiang et al. [12] used the RNG k-ε turbulence model and the Schnerr–Sauer cavitation model to simulate the cavitation performance of high-speed centrifugal pump and found that the variable pitch inducer can effectively improve the cavitation performance. Choi et al. [13] experimentally and numerically studied the cavitating flow in a turbopump inducer and analyzed the influence of the cavitation on the performance of the inducer. At the same time, the studies, by changing the geometric parameters of the inducer, have been carried out to analyze the influence on the cavitation in the centrifugal pump. Guo et al. [14] analyzed the influence of the inducer blade number on the anti-cavitation and external performance of centrifugal pump and found that a centrifugal pump with a 3-bladed inducer has a better performance. Kang et al. [15] investigated the number of blades on the performance and cavitation instabilities of a turbo pump inducer with an identical solidity based on numerical simulation and experiment. Campos-Amezcua et al. [16] investigated the influence of radial tip clearance on cavitation behavior based on the full cavitation model. Pace et al. [17] investigated the main effects of different inlet tip blade angle and outlet hub radius on hydraulic performance and flow instabilities of the pumps under non-cavitating and cavitating conditions and revealed that inducers with sharp corners at the leading-edge tips get slightly superior pumping performance.
Though many experimental and numerical studies have been conducted to understand and avoid the harmful effects of cavitation in the inducer or pump, there are few works on low-specific-speed centrifugal pump with an inducer. In this paper, unsteady cavitation flow in a low-specific-speed centrifugal pump with an inducer are investigated based on the full cavitation model and standard k-ε turbulence model using the commercial software PumpLinx. The external and cavitation characteristic experiments are carried out, applying a closed hydraulic test rig.
2. Geometric Model and Experimental System
2.1. Geometric Model and Mesh Generation
The design parameters of centrifugal pump are the flow rate Qd of 12 m3/h, head Hd of 35 m, and rotating speed nd of 2900 r/min. The specific speed is ns = 42.5. The flow parts of the pump shown in Figure 1 include inducer, impeller, and volute. The main geometrical parameters are as follows: the diameter at the inlet and discharge of impeller is 70 mm and 148 mm, the width of blade at the inlet and discharge of impeller is 4 mm and 10 mm, the installation angle at inlet and discharge of impeller is 19° and 33.5°, and the numbers of impeller and inducer blades are eight and two.
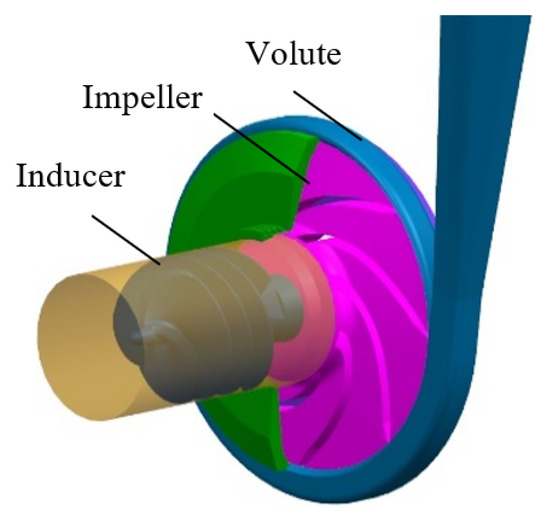
Figure 1.
Computational domain of the centrifugal pump.
The flow field in the centrifugal pump with an inducer was meshed by ANSYS. Structural grids are used for impellers and the unstructured grids with good adaptability are used for the domains with complex structures, such as inducer and volute shown in Figure 2. The mesh independence shown in Table 1 is carried out in steady flow calculations under non-cavitation conditions. Five groups of grids are established to verify the grid independence. According to the numerical results, the difference of head is small, and the head fluctuation is 0.08% when the total number of grids exceeds 3,275,154. Meanwhile, when the total number of grids exceeds 5,065,316, the efficiency fluctuation did not exceed 0.07%. Thus, in order to save computing resources and better capture the flow details of the centrifugal pump, therefore, the grid number of 5,065,316 is chosen for further computation. The minimum orthogonal quality of the mesh is 0.3, while the skewness of the mesh is around 0.35 ~ 0.75 and the minimum aspect ratio is 0.35.
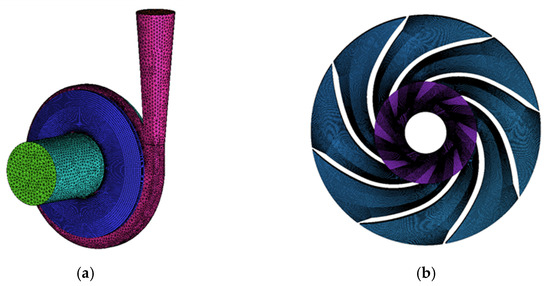
Figure 2.
The grid of computational domain for pump: (a) Whole computational domain; (b) Grid for impeller.

Table 1.
Geometrical parameters of the 10-stage model pump.
2.2. Numerical Simulation Method
The fluid flow in the pump is dominated by basic laws of mass, momentum, and energy conservation. In this paper, heat transfer in the pump is not considered, thus, its basic equations consist of continuity and momentum equations. Standard k-ε turbulence model was chosen for the numerical simulation in the pump.
The full cavitation model used in PumpLinx is based on two-phase flow theory, considering the compressibility of fluid and vapor’s vaporization and condensation processes in the meanwhile. It takes vapor and undissolved gas into account by introducing the conception of mixing density, thus, the prediction of cavitation is more reliable. For non-condensable gas, constant gas mass fraction is chosen to calculate the dynamic process of bubbles’ generation, flow, and dissolution. The expression for the mixture density is given as [18]:
where fv, fg, and fl are the component mass fractions of the vapor, gas, and liquid, ρv, ρg, and ρl are the component densities, and αv, αg, and αl are the component volume fractions.
The working fluid is water, and the temperature is 25 °C. The calculation of the mixture density is modified as:
where the source terms Re and Rc denote vapor generation and condensation rates.
The Navier–Stokes equation based on the Newtonian fluid was used in this simulation. The equation was formulated in the Cartesian coordinate system as:
where the subscript i, j indicates the coordinate direction, xi, xj are the coordinates in the i and j directions, t indicates the time, δij indicates the shear stress, µT indicates the turbulent viscosity, µm denotes vapor–liquid phase laminar viscosity.
The boundary conditions for non-cavitation and cavitation simulations are basically the same. The pressure is chosen as the inlet boundary condition for the suction pipe. For cavitation simulation, a series of different pressure have been step-by-step assigned at the inlet boundary. The volume flow rate is given as the boundary condition for the pump outlet. The surfaces of impeller and inducer are chosen as a rotating wall, while all the other walls are stationary. The methods of frozen rotor and transient rotor stator are applied to couple the rotation and station domains for steady and unsteady calculations. The time of each rotation for impeller is 0.02068 s. Three degrees is set as a time step, so it is 0.0001724 s. The results of steady simulation are employed as the initial solution for the unsteady simulation.
3. Experimental System
The experimental system of the pump shown in Figure 3 is a closed circulatory system. The experimental method is to use the vacuum pump to change vacuum degree above the liquid surface of cavitation tank that is to change the pressure of pump inlet. Thus, the cavitation tests of centrifugal pump are carried out. The experimental liquid flows out from cavitation tank, then across the brake valve, inlet pipe, test pump, outlet pipe, steady-flow tank, and measure part, another steady-flow tank, then returns to the cavitation tank at last. The flow is measured by the electromagnetic flowmeter LGD-DN80 with an accuracy of ±0.3%. The pressure sensor SCYG310 is installed at the inlet and outlet of the pump to obtain the pressure, and its uncertainty was ±0.25%, and the output electrical signal is processed by an AVANT-MI-7016 signal collector which was made by Econ Technologies.
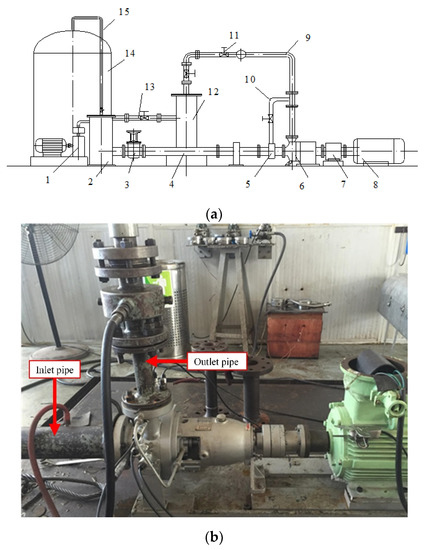
Figure 3.
Test-loop system: (a) Sketch map of the experimental system; (b) Test centrifugal pump. 1—vacuum pump; 2—air–water segregator; 3—brake valve; 4—inlet pipe; 5—jetting device; 6—test pump; 7—torque instrument; 8—motor; 9—outlet pipe; 10—feed-back pipe; 11—on–off valve; 12—steady-flow tank; 13—measure part; 14—cavitation tank; 15—exhaust pipe.
4. Results and Discussion
4.1. The Performance Curves of Centrifugal Pump
The available net positive suction head (NPSHa) is defined as Equation (9), where p and v are pressure and velocity of the pump inlet, and pv is the vapor pressure.
The performance obtained from the numerical simulation is shown in Figure 4 for the centrifugal pump with and without the inducer. Figure 4a shows the comparison of the external characteristic of the pumps under non-cavitation condition. The head and efficiency of the centrifugal pump decreases and increases with the increase of the flow rate, respectively. The head and efficiency of the centrifugal pump with an inducer are slightly higher than that without the inducer due to the energy provided by the axial inducer added at the impeller inlet. Figure 4b is cavitation performance curve at design flow rate (Qd). The anti-cavitation performance of centrifugal pump with an inducer is better than that without the inducer. Even if the inducer is present, when the NPSHa drops to 1.32 m marked b in Figure 4b, the head drops rapidly due to the cavitation development and deterioration.
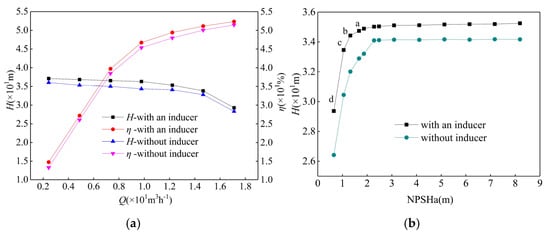
Figure 4.
Performance comparison of centrifugal pumps with an inducer and without inducer: (a) External performance curve; (b) Cavitation performance curve at Qd.
The performance curves of centrifugal pump with an inducer are shown in Figure 5, where Figure 5a is the external performance curve under non-cavitation condition and Figure 5b is cavitation performance curve at design condition (Qd). From Figure 5a, it can be seen that numerical results agree well with that of the experiment. The maximum error between the experimental and numerical head is 4.61%, and the maximum one for the efficiency is 3.88%. At design flow rate Qd, the experimental head is 34.75 m and the numerical head is 35.6 m. The experimental efficiency η is 45.73% and the numerical efficiency η is 49.41%.
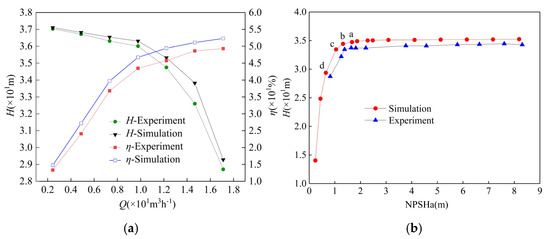
Figure 5.
Performance curves of centrifugal pump with an inducer: (a) External performance curve; (b) Cavitation performance curve at Qd.
From Figure 5b, it can be seen that cavitation performance curve (NPSHa-H) at design condition is obtained when inlet pressure changes a large range from non-cavitation to cavitation condition for the experiment and numerical simulation. From the numerical results, the head is almost same until the NPSHa drops to 1.32 m marked b in Figure 5b, where the head drops 3% and NPSHa is defined as required net positive suction head (NPSHr). When NPSHa is 1.67, 1.32, 1.05, and 0.65 m corresponding to a, b, c, and d, the numerical heads 33.73, 33.45, 32.2, and 28.73 m drop 2%, 3%, 6.4%, and 16.6%, respectively. From the experimental results, the NPSHr is 1.36 m when the head drops 3%. Additionally, it can be seen that the error between experimental and numerical result is in a reasonable range and numerical method is appropriate to cavitating flow in the researched pump.
4.2. The Development of Cavitation in Inducer and Impeller
The static pressure distributions in the inducer and impeller at design condition are shown in Figure 6 and Figure 7 when NPSHa is 1.67, 1.32, 1.05, and 0.65 m. From Figure 6, it can be seen that the pressure in the passage of inducer increases gradually from blade inlet to blade outlet and pressure decreases without blade clamping when the fluid is out of blade outlet. Therefore, the distance between blade outlet of inducer to blade inlet of impeller is important and should not be too long. The lower pressure region in the inducer is mainly near the outer edge of the blade inlet on suction surface. When NPSHa decreases from 1.67 to 0.65 m, the lower pressure regions expand from the outer edge to the hub. From Figure 7, it can be seen that the pressure in the impeller increases gradually along the radial direction. The lower pressure region in the impeller enlarges gradually from impeller inlet to passage with the decreasing of NPSHa. The lowest pressure in the impeller is also near the blade inlet on the suction surface.
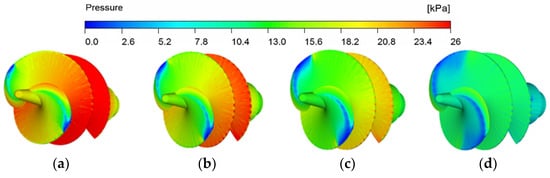
Figure 6.
Static pressure distributions in the inducer: (a) NPSHa = 1.67 m; (b) NPSHa = 1.32 m; (c) NPSHa = 1.05 m; (d) NPSHa = 0.65 m.
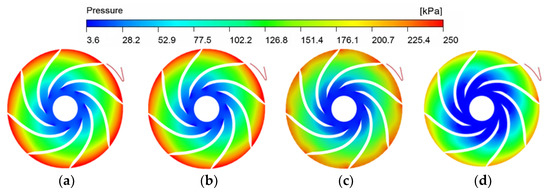
Figure 7.
Static pressure distributions on middle cross-section of the impeller of the pump with inducer: (a) NPSHa = 1.67 m; (b) NPSHa = 1.32 m; (c) NPSHa = 1.05 m; (d) NPSHa = 0.65 m.
The vapor volume fraction distributions in the inducer and impeller at design condition are shown in Figure 8 and Figure 9 when NPSHa is 1.67, 1.32, 1.05, and 0.65 m. From Figure 8, it can be seen that the bubbles in the inducer appear mainly in the lower pressure regions presented in Figure 8 when NPSHa is 1.67, 1.32, 1.05, and 0.65 m. These bubbles flowing along the spiral passage will tend to break for pressure increasing in the inducer. It is at the stage of cavitation incipience in the pump when NPSHa is 1.67 m, and the regions of larger vapor volume fraction in the inducer are relatively small. When NPSHa is 0.65 m, the vapor volume fraction in the inducer becomes larger, and the regions of larger vapor volume fraction expand from outer edge of blade inlet to hub on suction surface. Additionally, the larger vapor volume fraction appears near the trailing edge in the inducer. Those bubbles will flow into the impeller. From Figure 9, it can be seen that the vapor bubbles develop in the impeller with the decreasing of NPSHa. The bubbles first appear near inlet edge of blade on the suction surface when NPSHa is 1.67, 1.32, and 1.05 m. This will affect the fluid into the impeller passage and the pump head begins to drop. When NPSHa decreases to 0.65 m, the bubble regions become larger, and they occupy the space between blade to blade near blade inlets. This will lead to a sudden fall in pump head shown in Figure 5 and the pump may not work normally. If NPSHa (under d shown in Figure 5) continues to decrease, the impeller may be filled with bubbles in the passage and the pump head drops drastically.
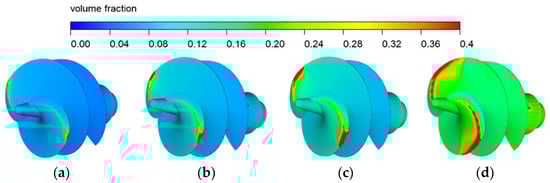
Figure 8.
The vapor volume fraction distributions in the inducer: (a) NPSHa = 1.67 m; (b) NPSHa = 1.32 m; (c) NPSHa = 1.05 m; (d) NPSHa = 0.65 m.
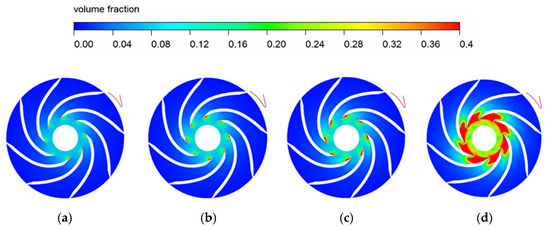
Figure 9.
The vapor volume fraction distributions on the middle cross-section of the impeller: (a) NPSHa = 1.67 m; (b) NPSHa = 1.32 m; (c) NPSHa = 1.05 m; (d) NPSHa = 0.65 m.
The relative velocity vectors in the impeller at design condition are shown in Figure 10 when NPSHa is 1.67, 1.32, 1.05, and 0.65 m. From Figure 10, it can be seen that the relative velocity vectors are disorganized in the impeller passage and at impeller outlet when NPSHa is 0.65 m. There is obvious backflow near the suction surface of the blade. At the impeller outlet, there appear secondary flows which are perpendicular to the direction of mainstream. This may be affected by the unsteady cavitation flow in the impeller for generation and breakup of the vapor bubbles. There is a slight difference for the flow in the impeller when NPSHa is 1.67, 1.32, and 1.05 m.
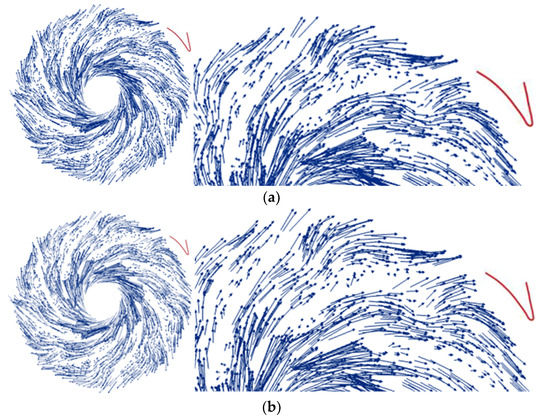
Figure 10.
Relative velocity vector diagrams in the impeller. (a) NPSHa = 1.67 m; (b) NPSHa = 1.32 m; (c) NPSHa = 1.05 m; (d) NPSHa = 0.65 m.
4.3. Pressure Pulsations in the Inducer
In order to analyze the influence of the pressure fluctuation resulting from cavitation on the inlet of the impeller, four monitoring points are set on the inducer wall to monitor the pressure fluctuation and marked as p1, p2, p3, and p4 in Figure 11, where p1 and p4 are corresponding to blade start position and inducer outlet position. For four monitoring points, the frequency properties of pressure fluctuation at design condition from non-cavitation to cavitation conditions are shown in Figure 12. From Figure 12, it can be seen that there is almost no change for monitoring p1. Although cavitation first occurs at the outer edge of blade inlet on suction surface, cavitation along with the rotation of the blades is to develop into the flow channel. Therefore, cavitation has little effect on pressure fluctuation of p1. For monitoring p2, p3, and p4, the maximum amplitude of pressure fluctuations appears when NPSHa = 1.05 m, and it is obviously larger at p4 than that at other points. The reason is that the fluid at p4 near impeller inlet is affected by pre-swirl of inducer outlet and the circle flow of impeller blade inlet. For four monitoring points, the amplitude of pressure fluctuation is very small when NPSHa = 0.65 m. This is because the cavitation is serious, which destroys the pressure field. The shaft frequency of the centrifugal pump is 48.33 Hz. The dominant frequency of the pressure pulsation at four monitoring points is almost near 48 Hz when the pump begins cavitation.
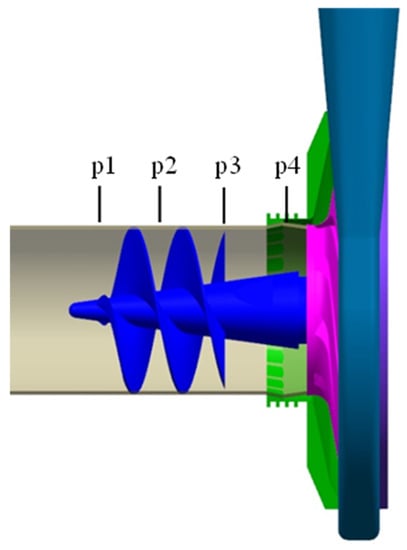
Figure 11.
Monitoring points on the inducer wall.
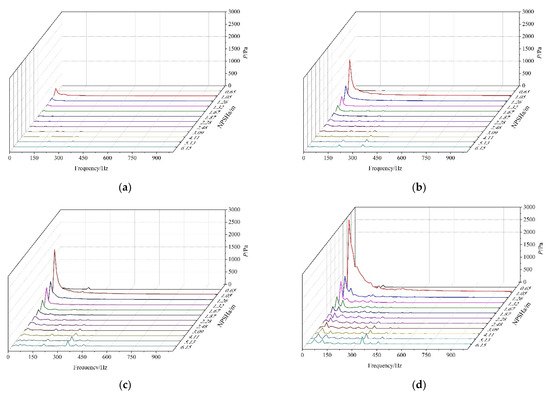
Figure 12.
Frequency properties of four monitoring points at different NPSHa: (a) p1; (b) p2; (c) p3; (d) p4.
5. Conclusions
Unsteady cavitation flow in a low-specific-speed centrifugal pump with an inducer is investigated based on the full cavitation model and standard k-ε turbulence model using the commercial software PumpLinx. Additionally, the experiment for external performance and cavitation performance are carried out on the pump with an inducer. The numerical results of external performance curve and cavitation performance curve of design condition agree well with that of the experiment. Compared with the pump without inducer, the anti-cavitation performance of centrifugal pump with an inducer is better. With the gradual decrease of the inlet pressure, the head of the centrifugal pump remains almost unchanged. While it is less than NPSHr, the head obviously drops due to the cavitation development and deterioration. The regions of larger vapor volume fraction in the inducer and impeller increase with the decreasing of NPSHa. The regions of larger vapor volume fraction in the inducer expand from the outer edge of blade inlet to the hub on suction surface. Under very low NPSHa, the impeller may be filled with bubbles in the passage and the pump head drops drastically, and there exist distinct back flows near the suction surface of the blade and impeller outlet. Affected by pre-swirl of inducer outlet and the circle flow of impeller blade inlet, the amplitude of pressure fluctuation near impeller inlet is obviously larger than that at the inlet in the inducer. The dominant frequency of pressure fluctuation for four monitoring points is shaft frequency.
Author Contributions
Methodology and validation, X.H. and B.C.; formal analysis, X.H. and B.C.; writing—review and editing, X.H. and Y.A. All authors have read and agreed to the published version of the manuscript.
Funding
This research was funded by the National Natural Science Foundation of China (Grant No. 52076197), Key Research and Development Program of Zhejiang Province (Grant No. 2022C01067), and Zhejiang Province Natural Science Foundation of China (Grant No. LZ20E060002).
Institutional Review Board Statement
Not applicable.
Informed Consent Statement
Not applicable.
Data Availability Statement
Not applicable.
Conflicts of Interest
The authors declare no conflict of interest.
Nomenclature
| fv | mass fractions of the vapor |
| fg | mass fractions of the gas |
| fl | mass fractions of the liquid |
| ρm | mixed density |
| ρv | densities of the vapor |
| ρg | densities of the gas |
| ρl | densities of the liquid |
| αv | volume fractions of the vapor |
| αg | volume fractions of the gas |
| αl | volume fractions of the liquid |
| Re | vapor generation rates |
| Rc | vapor condensation rates |
| δij | shear stress |
| µT | turbulent viscosity |
| µm | vapor–liquid phase laminar viscosity |
| NPSHr | required net positive suction head |
| pin | pressure of the pump inlet |
| pv | pressure of the vapor |
| v1 | velocity of the pump inlet |
References
- Zhou, J.; Xing, G.L.; Zhou, S.P. Effects of Different Turbulence Models on Simulation Accuracy of the Miniature Super-low Specific Speed Centrifugal Pump. Eng. Technol. 2018, 31, 792–797. [Google Scholar] [CrossRef] [Green Version]
- Cao, R.; Yuan, J.; Deng, F.; Wang, L. Numerical method to predict vibration characteristics induced by cavitation in centrifugal pumps. Meas. Sci. Technol. 2021, 32, 115109. [Google Scholar] [CrossRef]
- Lei, T.; Shan, Z.B.; Liang, C.S.; Chuan, W.Y.; Bin, W.B. Numerical simulation of unsteady cavitation flow in a centrifugal pump at off-design conditions. Proc. Inst. Mech. Eng. C—J. Mech. Eng. Sci. 2013, 228, 1994–2006. [Google Scholar] [CrossRef]
- Fu, Q.; Zhang, F.; Zhu, R.; He, B. A systematic investigation on flow characteristics of impeller passage in a nuclear centrifugal pump under cavitation state. Ann. Nucl. Energy 2016, 97, 190–197. [Google Scholar] [CrossRef]
- Xu, W.; He, X.; Hou, X.; Huang, Z.; Wang, W. Influence of wall roughness on cavitation performance of centrifugal pump. J. Braz. Soc. Mech. Sci. Eng. 2021, 43, 314. [Google Scholar] [CrossRef]
- Fu, Y.; Yuan, J.; Yuan, S.; Pace, G.; D’Agostino, L.; Huang, P.; Li, X. Numerical and Experimental Analysis of Flow Phenomena in a Centrifugal Pump Operating Under Low Flow Rates. J. Fluids Eng. 2014, 137, 205–207. [Google Scholar] [CrossRef]
- Puplaa, S.; Coutier-Delgosha, O.; Dazin, A.; Roussette, O.; Bois, G.; Caignaert, G. Experimental Study of a Cavitating Centrifugal Pump During Fast Startups. J. Fluids Eng. 2010, 132, 021301. [Google Scholar]
- Fecser, N.; Lakatos, I. Cavitation Measurement in a Centrifugal Pump. Acta Polytech. Hung. 2021, 18, 63–77. [Google Scholar] [CrossRef]
- Bachert, R.; Stoffel, B.; Dular, M. Unsteady Cavitation at the Tongue of the Volute of a Centrifugal Pump. J. Fluids Eng. 2010, 132, 061301. [Google Scholar] [CrossRef]
- Al-Obaidi, A.R. Investigation of effect of pump rotational speed on performance and detection of cavitation within a centrifugal pump using vibration analysis. Heliyon 2019, 5, e01910. [Google Scholar] [CrossRef] [PubMed] [Green Version]
- Lu, J.; Yuan, S.; Siva, P.; Yuan, J.; Ren, X.; Zhou, B. The characteristics investigation under the unsteady cavitation condition in a centrifugal pump. J. Mech. Sci. Technol. 2017, 31, 1213–1222. [Google Scholar] [CrossRef]
- Jiang, J.; Li, Y.-H.; Pei, C.-Y.; Li, L.-L.; Fu, Y.; Cheng, H.-G.; Sun, Q.-Q. Cavitation performance of high-speed centrifugal pump with annular jet and inducer at different temperatures and void fractions. J. Hydrodyn. 2019, 31, 93–101. [Google Scholar] [CrossRef]
- Choi, C.H.; Kim, J. Study on the Cavitating Flows in a Turbopump Inducer. J. Propuls. Power 2015, 31, 537–542. [Google Scholar] [CrossRef]
- Guo, X.M.; Zhu, Z.C.; Cui, B.L.; Shi, G. Effects of the number of inducer blades on the anti-cavitation characteristics and external performance of a centrifugal pump. J. Mech. Sci. Technol. 2016, 30, 3173–3181. [Google Scholar] [CrossRef]
- Kang, B.Y.; Kang, S.H. Effect of the number of blades on the performance and cavitation instabilities of a turbopump inducer with an identical solidity. J. Mech. Sci. Technol. 2015, 29, 5251–5256. [Google Scholar] [CrossRef]
- Campos-Amezcua, R.; Khelladi, S.; Mazur-Czerwiec, Z.; Bakir, F.; Campos-Amezcua, A.; Rey, R. Numerical and experimental study of cavitating flow through an axial inducer considering tip clearance. Proc. Inst. Mech. Eng. A—J. Power Energy 2013, 227, 446. [Google Scholar] [CrossRef]
- Pace, G.; Valentini, D.; Pasini, A.; Torre, L.; Fu, Y.; d’Agostino, L. Geometry Effects on Flow Instabilities of Different Three-Bladed Inducers. J. Fluids Eng. 2015, 137, 041304. [Google Scholar] [CrossRef]
- Chern, M.J.; Hsu, P.H.; Cheng, Y.J.; Tseng, P.Y.; Hu, C.M. Numerical Study on Cavitation Occurrence in Globe Valve. J. Energy Eng. 2013, 139, 25–34. [Google Scholar] [CrossRef]
Publisher’s Note: MDPI stays neutral with regard to jurisdictional claims in published maps and institutional affiliations. |
© 2022 by the authors. Licensee MDPI, Basel, Switzerland. This article is an open access article distributed under the terms and conditions of the Creative Commons Attribution (CC BY) license (https://creativecommons.org/licenses/by/4.0/).