Abstract
When longshore transport systems encounter tidal inlets, complex mechanisms are involved in bypassing sand to downdrift barriers. Here, this process is examined at Plum Island Sound and Essex Inlets, Massachusetts, USA. One major finding from this study is that sand is transferred along the coast—especially at tidal inlets—by parcels, in discrete steps, and over decadal-scale periods. The southerly orientation of the main-ebb channel at Plum Island Sound, coupled with the landward migration of bars from the ebb delta to the central portion of the downdrift Castle Neck barrier island, have formed a beach protuberance. During the constructional phase, sand is sequestered at the protuberance and the spit-end of the barrier becomes sediment starved, leading to shoreline retreat and a broadening of the spit platform at the mouth to Essex Bay (downdrift side of Castle Neck). Storm-induced sand transport from erosion of the spit and across the spit platform is washed into Essex Bay, filling channels and enlarging flood deltas. This study illustrates the pathways and processes of sand transfer along the shoreline of a barrier-island/tidal-inlet system and provides an important example of the processes that future hydrodynamic and sediment-transport modeling should strive to replicate.
1. Introduction
Much of the present research in the fields of coastal and shallow-marine geology is devoted to quantifying the effects of climate change and attendant impacts of warming temperatures, higher levels of CO2, sea-level rise (SLR), and greater storminess on coastal and nearshore systems and the human and ecological communities they support [1,2,3]. Nuisance flooding is a constant reminder of accelerating SLR [4], and recent global studies indicate that 230 million people are presently living 1 m below mean sea level (MSL) [5]; further, by 2150, 300 million people will experience yearly storm flooding (based on CoastalDEM [6]). Still, these effects are subordinate to the impact of major storms, such as those recently experienced at Grand Isle, Louisiana (USA), where one in four homes was destroyed by the Category 4 Hurricane Ida (29 August 2021) [6], or in the southern Philippines, where the Category 5 Typhoon Rai ravaged several islands, killing more than 400 people and impacting at least one million more [7,8]. Warmer atmosphere and ocean surface waters are leading to storms, which are more frequent and increasing in magnitude [9,10,11,12]. This is especially true along the East Coast of the United States (U.S.), where the occurrence of hurricanes tracking northward along the eastern seaboard is increasing [13,14,15], and their forward speed is slowing [16]. Slower and more intense storms generate larger waves that occur for longer periods of time and create storm surges that build to higher elevations. This is anticipated to result in increased rates of sand transport alongshore. Storms may also affect the volume of ebb-tidal deltas [17].
One of the less well-studied impacts of climate change and increased storminess is how increased longshore transport rates will impact shorelines. Although increased transport rates along continuous and mature shorelines may have more predictable outcomes, shorelines interrupted by tidal inlets may exhibit additional complexities. The delivery of larger volumes of sand to tidal inlets, coupled with the specific bypassing mechanisms and their corresponding timescales, remains a significant knowledge gap. The significance of storm-related sediment transport can be illustrated through observation of the Plum Island barrier island (northern Massachusetts, USA). Here, the long-term average southerly longshore transport rate is 55,000 m3 yr−1, but a single extratropical northeast storm event (nor’easter) with a 50-year recurrence interval can transport more than 130% of that sand volume (73,000 m3) [18].
The effects of sand transport on tidal-inlet dimensions were first quantitatively demonstrated by Jarrett [19] in a review of the well-known O’Brien Relationship [20,21] between inlet tidal prisms and cross-sectional areas. Plotting these parameters for 108 tidal inlets across the conterminous U.S., Jarrett [19] showed that the best relationship was achieved when inlets were grouped by location (East, Gulf, and West coast) and categorized as structured or unmodified. His plots demonstrated that, for a given tidal prism, jettied inlets along the low-wave-energy Gulf Coast (hence low sand delivery rates) exhibited larger inlet cross sections as compared with non-jettied inlets along the relatively high-energy West Coast (experiencing relatively rapid sand delivery).
Climate-driven increases in the rates of sand transport to tidal inlets will have several consequences:
- Disruption to navigation caused by channel shoaling, leading to more frequent artificial dredging;
- Increased rates of inlet migration at unstructured inlets, especially at smaller inlets;
- Changes to the rates and dynamics associated with natural inlet sediment bypassing;
- Greater movement of sand onto flood-tidal deltas (F-T-D) and into backbarrier bays and channels.
Advances in numerical modeling and field-data acquisition, coupled with greater spatial and temporal resolution of satellite and other aerial photographic platforms, are allowing us to better document past subannual to multidecadal coastal change and project future evolution. Moreover, these tools can be used to investigate the effects of increased rates of sand supply to inlets and associated configurational changes of adjacent ebb-tidal deltas, alterations of the backbarrier hypsometry, and ensuing changes to the inlet hydraulics. However, the output from these modeling efforts benefit from a detailed knowledge of the existing sand-transport pathways. In addition, although the basic patterns of sand dispersal at tidal inlets are well-documented [22,23,24,25,26,27,28] and mechanisms of inlet bypassing are well-defined [28,29,30,31], the sequential sequestration and connectivity of the pathways are less well understood [27].
This paper seeks to illustrate the complexity and progressive transfer of sand along a section of the Merrimack Embayment barrier coast in northern Massachusetts, USA. It includes two barrier islands, two tidal inlets, and a backbarrier bay and marsh system.
2. Data Base
Information for this study was compiled from published data, images from Google Earth and publicly available aerial and satellite imagery, shoreline-change data [32], LiDAR surveys AR surveys (USGS 2011, 2014, and NOAA 2016), published results from hydrodynamic modeling of this system [33], textural analysis of >300 sediment samples, and bedform-morphology data.
Volumes of sand bodies at the study area (e.g., Castle Neck spit and inner bay flood-tidal delta) were computed in ArcGIS using digital elevation models (DEMs) that were constructed from LiDAR data for years 2011, 2014, and 2016 (NOAA data viewer website; vertical accuracy = 5.2 cm). Contour lines were created using the DEMs and clipped to areas above −1 m to NAVD (NAVD approximately equal to mean sea level) in order to remove noise disturbance and NULL pixels from the volume calculations. Volumes were determined using the “Surface Volume” tool from the 3D Analyst Toolset in ArcGIS.
Changes in the morphological setting of Castle Neck between 2017 and 2019 have been mapped using the machine learning decision tree algorithm [34], available in the open software suite BEEODA [35]. The method was applied to an image composite obtained from two 4-band multispectral orthorectified scenes from PlanetScope [36], and the following spectral indexes: normalized difference vegetation index (NDVI) to highlight vegetation [37]; normalized difference water index (NDWIGreen/NIR) to highlight standing water bodies, especially in channels [38]; and optimized soil adjusted vegetation index (OSAVI) to highlight bare soil, including sand and mudflats proximal to channels [39]. Seven classes were identified: three stable classes (water, sand, and vegetation) and four “change classes”, which incorporate the conversion of water to sand, sand to water, vegetation to sand, and sand to vegetation. The accuracy assessment and area estimates were obtained following the approach of [40,41].
Sediment samples were collected throughout the study area manually in supratidal and intertidal regions (at spring low tide) and by Ponar Grab Sampler in subaqueous settings. A standard granulometric analysis of the sediment was performed using a mechanical sieving method (RO-TAP sieve shaker) with a mesh size ranging from φ = 0.0 to φ = 4.0. The samples were mostly very well-sorted and grain size trends were determined using the median grain size.
To simulate the evolution of storm surge, wave field, and sediment transport along the Merrimack embayment barrier and inlet shorelines, we used the Delft3D Modeling Suite. The modeling employed a coupled flow [42] and wave [43] hydrodynamics model, including multiclass sediment transport and morphology. The model grid varies in resolution from 40–120 m in the offshore, reducing to a resolution of 15–20 m in the vicinity of the barrier islands, tidal inlets, and within the backbarrier and is designed to allow for the nearshore transformation of storm surges and waves through the nearshore, inlet, and flood tidal delta. Grid bathymetry was created using recent LiDAR (2015) combined with bathymetric survey data from within Essex Bay (collected for the purpose in 2019) and offshore bathymetry extracted from the National Oceanographic Survey database (NOS, 2020). Boundary conditions are generated using water levels and significant wave height and period, and wind conditions extracted from models run as part of the North Atlantic Coast Comprehensive Study [44] at a save point close to the model boundary (save point 1986). A frequency distribution of maximum water-level conditions 20 km offshore of Plum Island (NACCS save point 6825) compiled from the full suite of storms run during the NACCS simulations (N = 1150) are used to select appropriate storms to represent a range of extreme events in the Merrimack Embayment. Surface waves and wave–current interaction effects are incorporated by coupling the hydrodynamic and wave model every hour. Hydrodynamic information then informs the multiclass sediment transport module, which includes cohesive mud and two classes of noncohesive sand with a median diameter of 150 and 300 microns.
3. Physical Setting
The Merrimack Embayment is a formerly glaciated terrain now fronted by a 34 km long, mixed-energy barrier-island system [45] (Figure 1a). The two largest and central barriers along this coast are Plum Island and Castle Neck. The former is bordered to the north by the Merrimack River Inlet, through which the Gulf of Maine receives the second-largest annual freshwater discharge. The two barriers are separated by Plum Island Sound (PIS) Inlet, and Castle Neck is bordered to the southeast by Essex River Inlet. The barriers and tidal inlets stabilized in their current positions at ca 3.6 ka in response to slowing SLR and pinning against bedrock outcrops and glacial drumlins [46,47]. Excepting the major estuary of the Merrimack River, the inlets of this region are associated with diminutive estuaries having small drainage basins [48].
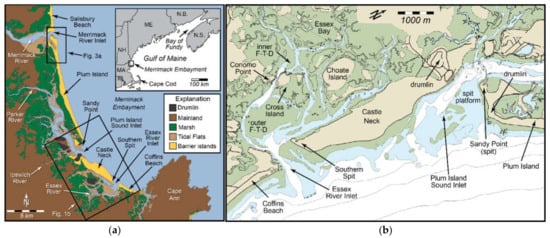
Figure 1.
Study site: (a) physical setting of the barrier-island systems of the Merrimack Embayment (northern Massachusetts), western Gulf of Maine. Modified from [46]; (b) NOAA coastal chart 13274 (2011) of southern Plum Island and Castle Neck and associated tidal inlets. Many of the islands within the marsh are composed of one or several amalgamated drumlins. Plum Island Sound (PIS) and Essex River Inlets are anchored by drumlins and bedrock outcrops. Essex Bay contains an inner and outer flood-tidal delta.
The backbarriers of Plum Island and Castle Neck are dominated by shallow lagoons floored by ubiquitous intertidal and subtidal sand bodies (Figure 1b). Mean depth along the thalweg gradually deepens from <2 m proximal to the upper estuary to >10 m at the PIS Inlet throat (Figure 1b). The backbarrier of Essex comprises approximately 24 km2 and is bounded by bedrock and glacial uplands. Generally, open-water areas (at high tide) increase substantively toward inlet entrances. This region experiences semi-diurnal tides with a mean range of 2.8 m, increasing to more than 3.7 m during perigean spring tidal conditions [49]. The backbarrier spring tidal prism of PIS Inlet and Essex Inlet is 32 × 106 m3 [50] and 30 × 106 m3 [51], respectively.
Hurricanes/tropical storms occur infrequently along this coast, and their wind and wave directions can be highly variable depending on the pathway of the storm. Wave climate in the Merrimack Embayment is dominated by extratropical nor’easters, which occur 15–20 times throughout the year [52] but mostly from late fall to early spring. Like tropical storms, they produce winds and waves from variable directions, but commonly wave energy is from the easterly quadrant. Wave data recorded in January 2011 at NDBC buoy 44098 located 50 km from the Merrimack River Inlet mouth illustrate this trend (Figure 2). During this period, the largest waves (3.5 to 4.8 m) coincided with the northeasterly quadrant wave direction [53]. Likewise, a second NDBC buoy (IOSN3), located 17 km northeast of the Merrimack River Inlet and which recorded wind velocity and direction during the same period, produced gradually increasing storm winds out of the northeast quadrant [53]. Typically, it is these northeast storms that control the dominant longshore transport system, and several lines of evidence indicate that, over longer time periods, it is from north to south:
- The Merrimack River Inlet ebb-tidal delta is oriented asymmetrically to the south, and contains ebb-oriented sandwave crests that gradually rotate to the southeast [54];
- Sediments within the Merrimack River Inlet ebb-tidal delta fine quickly to the north of the inlet and gradually to the south, indicating preferential southerly transport of coarser grains (Figure 3a) [55]. This trend continues to the south among beach and dune-toe sands, which fine consistently (except where influenced by tidal inlets) from northern Plum Island, across Castle Neck, and to Coffins Beach to the southeast (Figure 3b) [56];
- The 10 and 20 m depth contours offshore of the Merrimack barrier chain demonstrate seaward excursion from the Merrimack River Inlet to the Cape Ann peninsula due to decreasing grain size and preferential sand deposition (Figure 4a);
- Holocene sediments gradually thicken to the south, away from the mouth of the Merrimack River and toward Castle Neck, Coffins Beach, and Cape Ann (Figure 4b);
- Subsurface ground-penetrating radar data collected along Plum Island [46] and Castle Neck [57] indicate that both grew largely through southerly spit elongation.
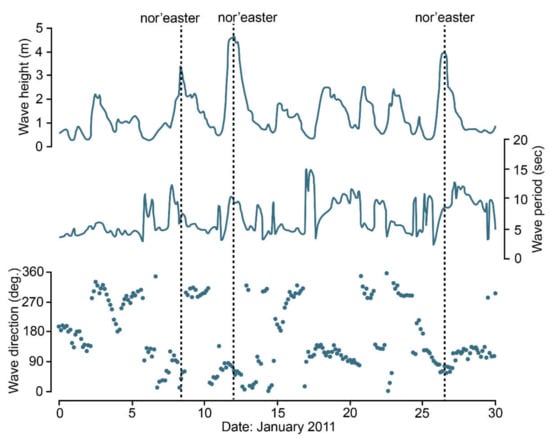
Figure 2.
Significant wave data collected at NDBC buoy 44098 located 50 km east of Merrimack River Inlet. Data from Li et al. [53]. Note the largest waves were recorded from the northeasterly quadrant.
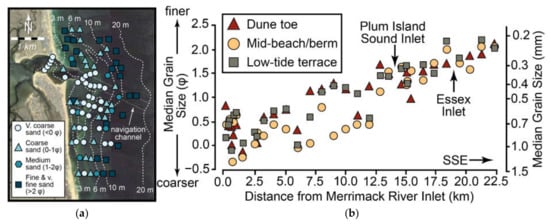
Figure 3.
Sedimentological evidence of dominant southerly longshore transport along the Merrimack Embayment. (a) Textural trends of bottom grab samples collected from the Merrimack River Inlet ebb-tidal delta. Data from [47]. Background Landsat image: 27 April 2016; (b) Fining trend of sediments sampled from the dune toe, berm, and low-tide terrace of beaches from northern Plum Island south across Castle Neck and Coffins Beach. Data from [56].
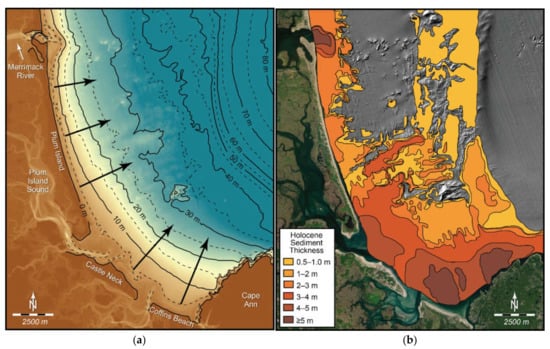
Figure 4.
Long-term southerly longshore transport of sediment evidenced by (a) seaward excursion of depth contours offshore of Plum Island and Castle Neck (see arrows), and (b) an isopach map showing that the Holocene sediment thickness increase from the mouth of the Merrimack (2–3 m) to >5 m adjacent to the Cape Ann promontory. Digital elevation model in (a) is from the NOAA National Centers for Environmental Information Continuously Updated Digital Elevation Model (CUDEM) (https://coast.noaa.gov/htdata/raster2/elevation/NCEI_ninth_Topobathy_2014_8483/; accessed 30 January 2022). Part (b) is based on seismic-reflection profiles, high-resolution bathymetric and sidescan-sonar backscatter intensity data, and analysis of [58,59]. Background hill-shaded bathymetric digital elevation model is from [58].
4. Inlet Sediment Bypassing and Sand Delivery to Castle Neck
As part of the southerly longshore transport system, sand reaching southern Plum Island eventually bypasses PIS Inlet and is transported to Castle Neck through a complex set of processes. We review here evidence for these transport patterns, based primarily on historical morphological changes gleaned from sequential vertical aerial photographs and digital elevation models (DEMs) constructed from 2011, 2014, and 2016 LIDAR surveys (USGS 2011, 2014, and NOAA 2016). Additionally, we rely on grain-size data from >300 beach and bottom grab samples collected from across Castle Neck and Essex Inlet during the 2019–2020 period (Figure 5). Resulting median grain sizes range from 3.15 to 0.77 φ (0.11–0.58 mm) and display a fining trend from the open coast into the backbarrier inner channels (Figure 5). This further supports our conclusion of a net southerly (and southeasterly along this section of the Embayment) longshore sediment transport trend.
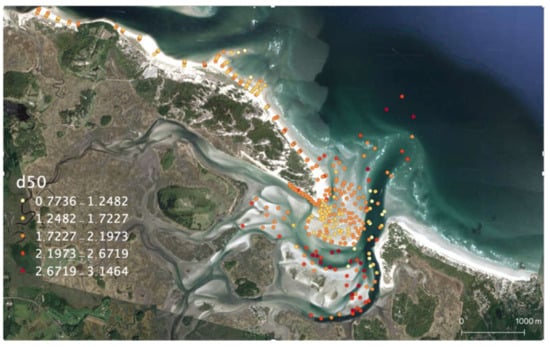
Figure 5.
Grain-size trends along Castle Neck and at Essex Inlet (grain size in phi). Note the general decrease in grain size (increasing phi value) toward the inlet and into Essex Bay.
For the sake of clarity, the major morphologic components of this system are shown in Figure 6, including an ephemeral sandy spit (Sandy Point) that expands and contracts at the southern end of Plum Island. This is bordered by a broad intertidal spit platform (0.5 to 2.0 m below MSL), which is covered by landward-oriented bedforms (sandwaves and megaripples). This expansive swash platform is dominated by shoaling and breaking waves and flood-tidal currents, which move sand into the main-ebb channel. Sandy Point and northern Crane Beach experience opposite and alternating patterns of accretion and erosion, coinciding with meanderings of the main-ebb channel of PIS Inlet. Historical imagery reveals that, as sand is transferred downdrift, sand bars migrate onshore along central Castle Neck and produce a prominent beach protuberance (Figure 6). Downdrift of here, progradation and retreat of the Southern Spit on eastern Castle Neck (see location, Figure 1) impacts sand delivery to Essex Inlet and wave energy inside Essex Bay.
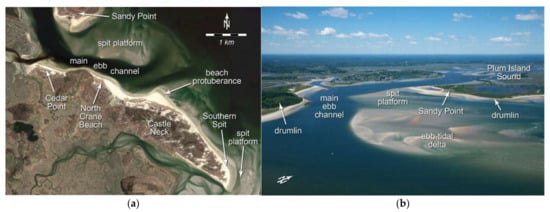
Figure 6.
Morphological components of the Plum Island Sound Inlet sand-bypassing system. (a) Landsat satellite image from 14 April 2017. (b) Oblique aerial photo looking west into Plum Island Sound Inlet.
4.1. Sand Source
The ultimate source of sand for the Plum Island and Castle Neck barriers was the onshore reworking of sediment from the lowstand Merrimack delta [60] during the late Holocene transgression [46,54]. During the later phase of the transgression, shoreface erosion likely moved additional sand onshore from other sand-rich, post-glacial deposits (braidplain delta; [59,61]). A secondary source, later becoming the primary source, was sand discharged from the Merrimack River and transported south along Plum Island by wave energy [46,54]. An assessment of the associated sand volume can be estimated from dredging records compiled for the river mouth during the 1969–2010 period [62]. More than 1.6 × 10⁶ m3 of sediment was removed from the channel during this time, which translates to an average annual rate of ~33,000 m3. The transfer of this sediment to the coast is aided by high-flow periods associated with spring freshets, which occur during early to mid-March when intense or prolonged rainfall, coupled with extensive snowmelt, move water across frozen grounds and directly into streams and rivers. During these infrequent events, river discharge can increase by an order of magnitude and currents in the lower river become unidirectional [63]. Climate change is projected to produce greater precipitation in the northeast [64], particularly during spring months [65], which will translate to increased river discharge and sediment delivery to the mouth of the Merrimack River Inlet.
4.2. Sand Compartments
The following sections describe the southerly movement of sand from Plum Island to Castle Neck and ultimately to Essex Bay in terms of morphologic components (Figure 6), general pathways and transport processes, and temporary sand-sequestration reservoirs. It is acknowledged that some sand moves independently of the parcels defined below, and the rates at which the transport processes occur are approximated because the impact of storm frequency and magnitude has not been quantified.
4.2.1. Sandy Point
Sand moving alongshore in the Plum Island littoral transport system can be delivered directly to Plum Island Sound Inlet via waves and flood-tidal currents. However, some of the sand also accumulates at the southern end of Plum Island, forming Sandy Point and its associated intertidal spit platform (Figure 6). This spit complex undergoes cycles of growth and decay occurring on the order of 15–20 years. The most recent cycle is evident from satellite imagery collected over a 16-year period between 2001 and 2008 (Figure 7). The spit complex extended 350 m across the spit platform from 2001 to 2008, and then retreated over the same distance during the following nine years. The length of the cycle is likely related to the frequency and magnitude of storms, which control not only the delivery of sand to southern Plum Island but also the potential erosion of the spit end itself.
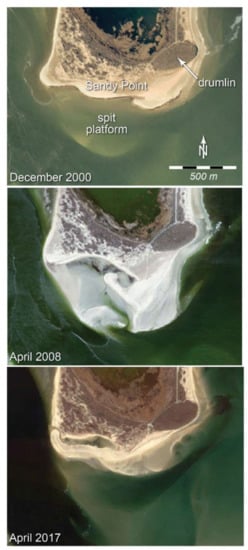
Figure 7.
Sequential aerial satellite imagery of the Sandy Point spit system at the southern end of Plum Island, depicting the cycle of growth and decay. Image sources: 2000: U.S. Geological Survey; 2008: Commonwealth of Massachusetts; 2017: Landsat.
4.2.2. Spit Platform and Main-Ebb Channel
Like Sandy Point, the spit platform on southern Plum Island (Figure 8) undergoes periods of expansion and contraction over similar decadal time scales. This too is related to the influx of sand from the littoral system and to cycles of southerly migration and ebb-delta breaching of the main-ebb channel. Southerly extension of the spit platform displaces the main-ebb channel of the PIS Inlet, extending this channel to the southeast, along the shoreface of Castle Neck. This in turn slows tidal exchange between PIS and the coastal ocean and decreases hydraulic connectivity. Eventually, tidal flow cuts a new, straighter, and more hydraulically efficient course through the ebb-tidal delta via a form of inlet-sediment bypassing known as “ebb-delta breaching” [30,31,66]. This process can be gradual or initiated during a major storm and has been described in detail for the Merrimack River Inlet by [48,67]. At PIS Inlet, a 1969 coastal chart and 2017 vertical aerial imagery show different stages of breaching through the ebb-tidal delta (Figure 8). Once the new, more northerly channel is established, the former southern channel is abandoned and the sand shoal that was once updrift of the main-ebb channel is now downdrift of the channel. Because this sand shoal is no longer being pushed offshore by ebb-tidal currents, wave-generated and flood-tidal currents transport the sand comprising shoal onshore in the form of landward migrating swash bars.
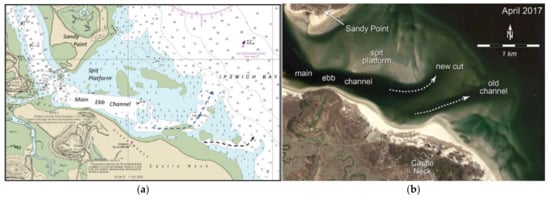
Figure 8.
Process of ebb-tidal delta breaching [30] for (a) 1969 and (b) 2017. The new channel cut provides a more direct route for tidal exchange and increases hydraulic connectivity between Plum Island Sound and the coastal ocean. The 1969 chart is NOAA Chart 13274. The 2017 imagery is from Landsat.
4.2.3. Beach Protuberance
Construction of the beach protuberance and overall morphology of Castle Neck is a product of repetitive attachment of swash bars to the beach occurring over a period of more than 15 years (Figure 9). During the initial accretionary phase, when the swash bars are located some distance offshore (400–500 m), shoaling and refraction of waves around the bars creates a sheltered area along the onshore beach. Reduction in the longshore transport rate in this low-energy zone causes sand deposition and beach progradation. Thus, the beach protuberance is a product of landward migrating swash bars and the “tombolo effect”, as described in [68]. At its maximum, the accretionary landform extended 1.0 km along the shore, 0.4 km offshore, and had a thickness of ~1.5 m, thus containing an estimated volume of ~300,000 m3. We consider this a minimum estimate because it does not account for additional nearby swash bars. It is noteworthy that this section of Castle Neck has exhibited significant erosional and accretionary periods (Figure 9).
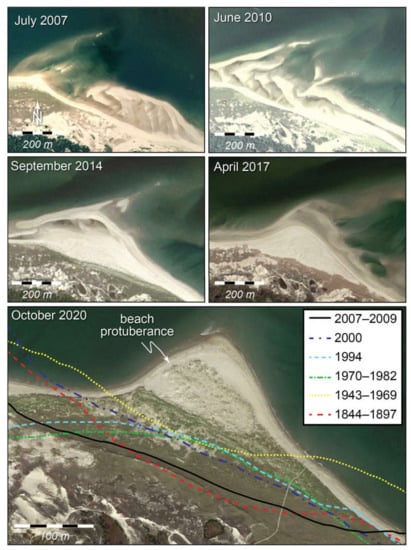
Figure 9.
Sequential photographs showing development of the beach protuberance. Changes in morphology of the form is a function of where the swash have migrated onshore and attached to the beach. Bottom panel shows long-term shoreline changes. Shoreline data are from [32]. The 2007 imagery is from the USDA Farm Service Agency, and the 2010, 2014, 2017, and 2020 imagery is from Landsat.
4.2.4. Southern Spit
As with Plum Island, spit accretion was an important process in forming the southeast end of Castle Neck [57]. However, due to its proximity to Essex Inlet, the Castle Neck spit is constantly subjected to strong tidal currents and wave focusing during storms. Both processes can cause rapid erosion and shoreline retreat. The stability of this landform is largely related to the volume of sediment moving south through the longshore transport system, which replenishes sand lost during storms and high wave-energy events.
Historical shoreline changes of the Castle Neck spit-end reveal a ~50–100-year period of apparent continued progradation (1844–1897 to 1943–1969), followed by more recent erosion and spit retreat since approximately 1969 (Figure 10a). We acknowledge that because of the limited historical coverage during this time shorter-term trends may exist. A more detailed account of the 2003–2020 period is provided in Figure 10b, which chronicles a dramatic loss of sand from the southeast end of the Castle Neck barrier. A 25-year record of shoreline changes along this beach indicates that the seaward side of the spit retreated 250 m from 1995 to 2020, and the southern end of spit shortened by ~600 m during the same period (Figure 10b). Erosion of the Southern Spit is intimately related to the growth and decay of the beach protuberance located updrift on Castle Neck: during its constructional phase, most of the sand bypassing PIS Inlet is sequestered on the enlarging beach protuberance, and much of this trapped sand is not released down shore until the bar-migration process ceases. Once the shoreline stabilizes, wave energy becomes focused on the protuberance, leading to erosion and transport of sand southward. This sequence is supported by historical shoreline-change trends, which demonstrate that the period of rapid beach protuberance growth coincided with a time of significant beach erosion downdrift (Figure 9 and Figure 10b).
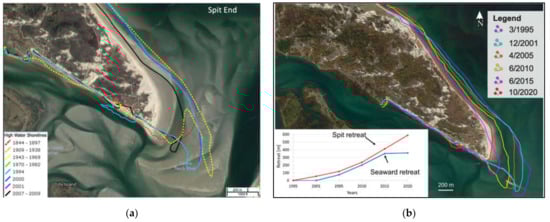
Figure 10.
Shoreline change along southeastern Castle Neck. (a) Long-term shoreline changes for the period 1844 to 2009; (b) recent shoreline changes between 2003 and 2019. Background imagery from Landsat, April 2017.
5. Essex Inlet and Bay Sedimentation Patterns
5.1. Essex Inlet
The sand eroded from Castle Neck’s Southern Spit enters Essex Inlet and Essex Bay, where it is redistributed by waves and tidal currents. The presence of scarps and a history of relative shoreline stability to modest erosion along the southern, backbarrier shoreline of Castle Neck (Figure 10b and Figure 11) indicate that little, if any, of the sand is transported to the backside of the spit. Furthermore, although sand is likely moved onshore and offshore in the main channel of Essex Inlet, little of this sand is deposited permanently on the ebb-tidal delta. There is no evidence that the ebb-tidal delta has expanded during recent time because it has reached an equilibrium size and volume as dictated by its tidal prism [51]. It is not possible to account for the final disposition of all the sand washed into Essex Bay, as it likely experiences widespread dispersal.
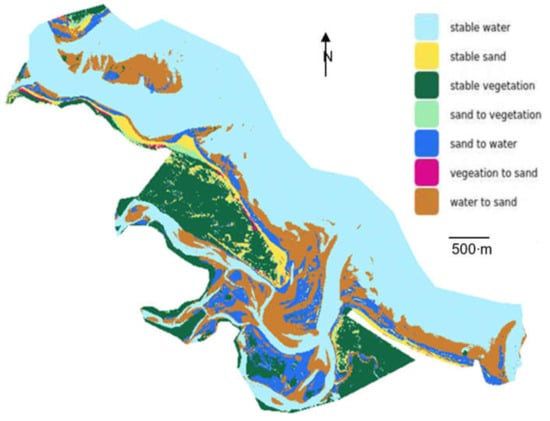
Figure 11.
Image analysis (classification’s overall accuracy of 97%) using high-resolution satellite photographs shows how depositional environments at the study area changed from 2017 to 2019 (imagery is from PlanetScope satellite.
Applying a Delft3D-SWAN framework to quantify hydrodynamic and sediment-transport processes at Essex Inlet, we determined that net sand movement is dominated by extratropical northeast storms. Model output from a moderate northeast storm (maximum winds ~20 m s−1) shows that a minimum of 6300 m3 of sand moves across the spit platform and landward through the inlet channel into Essex Bay, which translates to about 100,000 m3 yr−1 (based on an average of 18 storms per year [69] (Figure 12).
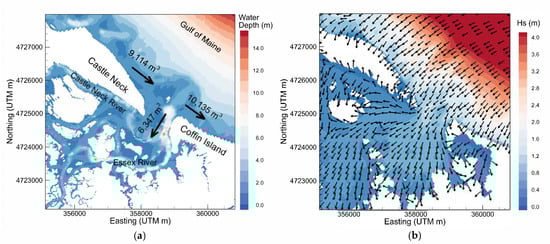
Figure 12.
Results of Delft3D and SWAN modeling of a moderate magnitude extratropical northeast storm showing (a) cumulative sand transport in the vicinity of Essex Inlet and (b) significant wave heights (color) and wave energy transport direction (vectors) during maximum storm conditions.
Digital elevation models constructed from LiDAR surveys conducted between 2011 and 2016 (USGS 2011, 2014, and NOAA 2016) reveal that the spit-end lost ~31% of its area and 178,000 m3 of its volume in this five-year timespan (Table 1). These data capture only the most recent period of spit retreat, which began in the mid-1990s (Figure 10a). Extrapolating the 2011–2016 loss rate to 1995, we determine that a volume of 237,000 m3 of sand was eroded from Southern Spit.

Table 1.
Area and volumes of Southern Spit (eastern end, Castle Neck), 2011–2016 (based on NOAA Digital Coast data viewer using USGS and USGS CoNED project imagery).
Image analysis of high-resolution aerial photographs was used to construct a depositional environment difference map of the study area for the period between 2017 and 2019. As shown in Figure 11, the intertidal environments, including the PIS and Essex Inlet spit platforms, have undergone widespread changes; most of these are related to intertidal shoals either becoming subtidal, or vice versa. In Essex Bay, expansion of the spit platform and F-T-D into western Essex Bay may be evidence of the ultimate depocenter of some of the eroded sand from the spit end. For example, during the 10-year period from 2008 to 2018, the channel running behind Castle Neck (~2–3 m deep) was largely filled with sand and shifted slightly northward, eroding the landward side of the barrier. This type of infilling, shoal formation, and shifting of channels emphasizes the dynamic nature of Essex Bay due to the influx of sand from the regional longshore-transport system.
5.2. Inner Essex Bay Flood-Tidal Delta
The outer and inner Essex Bay and Estuary system are separated by a narrow bedrock channel situated between Cross Island and Conomo Point (see Figure 1b), which reaches almost 12 m in depth. This constriction produces tidal currents in excess of 2 m s−1 during spring tides and any sand deposited in the channel during lower flow conditions is swept into the inner bay by flood-tidal currents. The flow expands immediately landward of Cross Island and sand moving through the channel is deposited in a large inner F-T-D (Figure 1b). During the period of spit retreat, when sand from the spit-end washed into Essex Bay, some of this sediment is likely to have been transported into the inner bay, enlarging the F-T-D (Figure 13; Table 2). This hypothesis is supported by the strength of storm-generated flood currents through the inner tidal channels [33]. Image analysis was used to compute areas and volumes of the F-T-D through time. This indicates that the delta gained approximately 185,000 m3 between 2010 and 2016 (Table 2). A comparison of the two images shows that, between 2007 and 2016, the F-T-D expanded by building northward and westward and creating more intertidal area (Figure 14). The fact that the F-T-D enlarged during the same period that the spit retreated—coupled with the results of hydrodynamic modeling showing that sand moves into the bay during storms—suggests that these trends are not coincidental. Furthermore, this indicates that sand in Essex Bay is highly mobile and can be transported far inland from its original source.
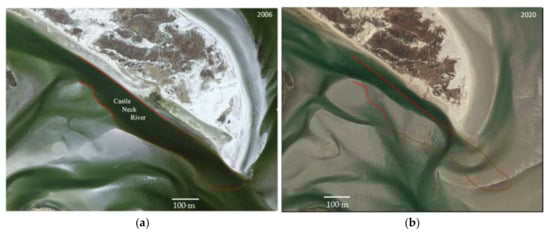
Figure 13.
Changing morphology of Castle Neck River (outlined in red) behind Southern Spit, illustrating sand infilling between (a) 2008 (MassGIS) and (b) 2019 (Landsat Copernicus).
Table 2.
Inner flood-tidal delta geometry (based on NOAA Digital Coast data viewer using USGS and USGS CoNED project imagery).
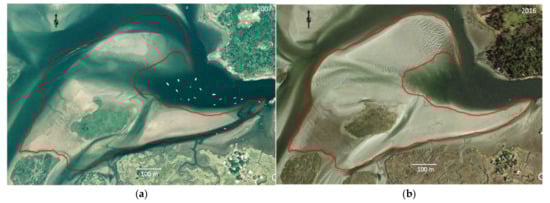
Figure 14.
Morphology of the inner flood-tidal delta (outlined in red) in (a) 2007 (U.S. Geological Survey) and (b) 2016 (Landsat Copernicus). During this interval, the delta volume increased by approximately 185,000 m3.
6. Discussion and Conclusions
This study uses a variety of datasets and analyses to demonstrate the pathways by which sand is transferred from the Merrimack River mouth southward, along Plum Island, across PIS Inlet, onshore and along Castle Neck, and into Essex Bay (Figure 15). The complexity of sand transfer along barrier-inlet chains has been shown elsewhere, including New Inlet (Chatham, MA, USA) [70], the Chincoteague–Assateague–Wallops island system (Virginia, USA) [71,72,73], Norderney Seegat in the East Frisian Islands (Germany) [25,74], Texel Inlet, along the Dutch Wadden Sea (The Netherlands) [26,28], and Caminada Pass, Louisiana (USA) [75]. A major finding from this recent study emphasizes that sand is transferred along the coast, and especially at tidal inlets, as parcels, in discrete steps, and that the transferal process occurs over decadal timescales. Furthermore, as Gaudiano and Kana [76] have illustrated for the South Carolina coast, the volume of sand moved, and time required for the process to be completed, scale with the size of the barrier–island-tidal–inlet complex, with larger systems requiring more time. Using their relationship between tidal prism and sand-volume bypassing capacity, the PIS Inlet system (with a tidal prism of 32 × 106 m3) is estimated to bypass sand shoals with volumes on the order of ~320,000 m3. This correlates well with the 300,000 m3 estimated amalgamated shoal volume forming the Castle Neck beach protuberance.
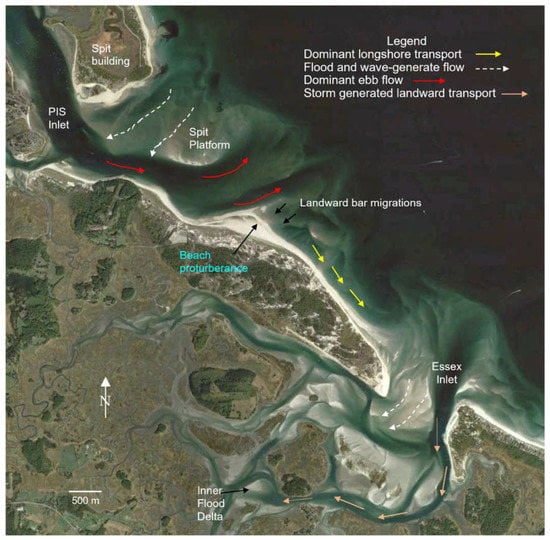
Figure 15.
Conceptual model of sand transport pathways at the study area. This conceptual diagram traces the pathway of sand transport from southern Plum Island to Essex Bay. A description of the mechanism and sand reservoirs is described in the paper.
Sand is sequestered in the Plum Island–Castle Neck system in various temporary reservoirs before continuing movement down shore. The first is the Sandy Point spit at the southern end of Plum Island, which, at its maximum extent (350 m long), is conservatively estimated to have contained 1.8 × 10⁵ m3 of sand. Though this pales in comparison with subaerial barrier spit ends at Assateague Island (Virginia, USA: 430 × 105 m3; [73]) or Bug Peninsula (Germany: 660 × 105 m3; [77]), Sandy Point is distinct in that it is largely a temporary depocenter. Unlike common examples of unimpeded, shore-parallel spit elongation, reorientation of the PIS Inlet channel severs much of Sandy Point from southern Plum Island. This cyclical process truncates the island proximal to the Sandy Point Drumlin, and limits growth of the spit. However, in concert with the southerly longshore transport system, it also serves to transfer sand to the second temporary depocenter: the intertidal to subtidal spit platform updrift of the main-ebb channel of PIS Inlet. Southerly and seaward progradation of this platform forces the main-ebb channel to a deflected position along Castle Neck [65]. A relatively large quantity of sand is released to the onshore beach once a new channel is established updrift of the old channel pathway. This can occur through relocation of the entire main-ebb channel or reorientation of only its seaward end [31]. The preferential attachment of swash bars along the downdrift inlet shoreline commonly forms a bulbous-shaped barrier shoreline [74], which tends to be magnified because of the tombolo effect [68]. Both these processes contribute to formation of beach protuberance at Castle Neck, which grows until onshore bar migrations terminate. This promontory, now a focal point for wave energy, erodes, allowing for transfer of sand to the downdrift Southern Spit. It is emphasized that sediment also moves alongshore through wave action independent of these larger processes and parcels; however, this volume is undetermined.
Although Southern Spit has experienced previous periods of growth, during the past 25 years the spit has been retreating and most of the sand comprising the spit-end, as well as sand moving south via the longshore transport system, has entered Essex Bay. This observation is supported by a sediment-transport modeling study [33] and observations of the stability in size of the ebb-tidal delta [51] and downdrift Coffin Beach shoreline [32]. We have been able to determine that some of the sand entering Essex Bay was deposited in the channel immediately behind the spit, whereas other sand was transported as far as 4.5 km into the estuary and deposited on an inner bay F-T-D (see location, Figure 1b). The exact location and volumes of sand that were deposited in Essex Bay are difficult to quantify because of the likelihood that much of the sand was dispersed in thin layers throughout the estuary; associated changes in channel depth or shoal elevation cannot be easily measured. It is reasonable that the rate of sand movement into the bay has been increasing as the spit end has been losing elevation and transforming into a subaqueous spit platform. Our modeling, like previous numerical modeling [33], has identified that most of the landward transport of sand at the inlet occurs across the spit platform and secondarily in the main inlet channel.
Finally, we note that this is largely a qualitative study that illustrates the pathways and processes of sand transfer along a barrier island-tidal inlet shoreline. However, this type of study provides an important example of what future numerical modeling should strive to replicate. Much emphasis in coastal studies today is based on the results of theoretical hydrodynamic and sediment transport modeling with passive attention given to testing these models’ ability to produce real coastal systems and their evolution. Additional integration of field data and observations with theoretical and reduced-complexity modeling approaches will be critical to improving predictive capabilities in a regime of accelerated coastal change.
Author Contributions
Conceptualization, D.M.F. and Z.J.H.; methodology, D.M.F., Z.J.H., A.S. and I.Y.G.; laboratory analysis, A.S.; data analysis and statistics, Z.J.H., M.M.S., A.S. and I.Y.G.; investigation and resources, D.M.F. and Z.J.H.; writing—original draft preparation, D.M.F.; writing—review and editing, C.J.H., Z.J.H., A.S., A.N. and I.Y.G.; visualization, D.M.F. and C.J.H.; funding acquisition and project administration, D.M.F. and Z.J.H. All authors have read and agreed to the published version of the manuscript.
Funding
This research was funded by: Massachusetts Executive Office of Energy and Environmental Affairs (award: RFP ENV 19 MVP 02), NSF EAR 1832177, NSF EAR 1800810 and NSF EAR 2022982.
Institutional Review Board Statement
Not applicable.
Informed Consent Statement
Not applicable.
Data Availability Statement
All supporting data for this study are reported in the manuscript.
Acknowledgments
The authors would like to thank Peter Phippen (Coastal Coordinator for Merrimack Valley Planning Commission and the MassBays Estuary Program) for his field and technical support and Brendhan Zubricki (Essex Town Administrator) for coordinating and communicating the results of the project to the Town of Essex and Massachusetts Coastal Zone Management. We would like to thank all the officials of the Town of Essex who aided us, including the Harbormaster, Dan Fialho and Shellfish Officers. Numerous undergraduate students at Boston University assisted in the collection and analysis of the grain-size data.
Conflicts of Interest
The authors declare no conflict of interest. The funders had no role in the design of the study; in the collection, analyses, or interpretation of data; in the writing of the manuscript, or in the decision to publish the results.
References
- FitzGerald, D.M.; Fenster, M.S.; Argow, B.A.; Buynevich, I.V. Coastal Impacts Due to Sea-Level Rise. Annu. Rev. Earth Planet. Sci. 2008, 36, 601–647. [Google Scholar] [CrossRef] [Green Version]
- Cazenave, A.; Le Cozannet, G. Sea level rise and its coastal impacts. Earth’s Futur. 2013, 2, 15–34. [Google Scholar] [CrossRef]
- Oppenheimer, M.; Glavovic, B.C.; Hinkel, J.; van de Wal, R.; Magnan, A.K.; Abd-Elgawad, A.; Cai, R.; Cifuentes-Jara, M.; Deconto, R.M.; Ghosh, T.; et al. Sea Level Rise and Implications for Low-Lying Islands, Coasts and Communities. In IPCC Special Report on the Ocean and Cryosphere in a Changing Climate; Pörtner, H.-O., Roberts, D.C., Masson-Delmotte, V., Zhai, P., Tignor, M., Poloczanska, E., Mintenbeck, K., Alegría, A., Nicolai, M., Okem, A., et al., Eds.; IPCC: Geneva, Switzerland, 2019. [Google Scholar]
- Jacobs, J.M.; Cattaneo, L.R.; Sweet, W.; Mansfield, T. Recent and Future Outlooks for Nuisance Flooding Impacts on Roadways on the U.S. East Coast. Transp. Res. Rec. J. Transp. Res. Board 2018, 2672, 1–10. [Google Scholar] [CrossRef]
- Roberts, F.A., III. After Hurricane Ida Destroyed 1 in 4 Grand Isle Buildings, Demolition is on ’Path to Recovery’ Times-Picayune. 2021. Available online: https://www.nola.com/news/environment/article_921438d2-52cc-11ec-9fa7-1ff714e37988.html (accessed on 1 February 2022).
- Mogul, R. Philippines’ Typhoon Rai Death Toll Rises Further as Areas Remain Cut Off from Help. CNN. 2021. Available online: https://www.cnn.com/2021/12/21/asia/typhoon-rai-philippines-deaths-intl-hnk/index.html (accessed on 1 February 2022).
- Kulp, S.A.; Strauss, B.H. New elevation data triple estimates of global vulnerability to sea-level rise and coastal flooding. Nat. Commun. 2019, 10, 4844. [Google Scholar] [CrossRef] [Green Version]
- Climate Central. Report: Flooded Future: Global Vulnerability to Sea Level Rise Worse than Previously Understood; Princeton, NJ, USA, 2019; pp. 1–10. Available online: https://www.climatecentral.org/news/report-flooded-future-global-vulnerability-to-sea-level-rise-worse-than-previously-understood (accessed on 1 February 2022).
- Kossin, J.P.; Knapp, K.R.; Olander, T.L.; Velden, C.S. Global increase in major tropical cyclone exceedance probability over the past four decades. Proc. Natl. Acad. Sci. USA 2020, 117, 11975–11980. [Google Scholar] [CrossRef]
- Villarini, G.; Vecchi, G. Projected Increases in North Atlantic Tropical Cyclone Intensity from CMIP5 Models. J. Clim. 2013, 26, 3231–3240. [Google Scholar] [CrossRef]
- Emanuel, K.A. Downscaling CMIP5 climate models shows increased tropical cyclone activity over the 21st century. Proc. Natl. Acad. Sci. USA 2013, 110, 12219–12224. [Google Scholar] [CrossRef] [Green Version]
- Knutson, T.R. Global projections of intense tropical cyclone activity for the late twenty-first century from dynamical downscaling of CMIP5/RCP4.5 scenarios. J. Clim. 2015, 28, 7203–7224. [Google Scholar] [CrossRef] [Green Version]
- Vecchi, G.A.; Knutson, T.R. On estimates of historical North Atlantic topical cyclone activity. J. Clim. 2008, 21, 3580–3600. [Google Scholar] [CrossRef]
- Bengtsson, L.; Hodges, K.I.; Roeckner, E. Storm Tracks and Climate Change. J. Clim. 2006, 19, 3518–3543. [Google Scholar] [CrossRef] [Green Version]
- Garner, A.J.; Mann, M.E.; Emanuel, K.A.; Kopp, R.E.; Lin, N.; Alley, R.B.; Horton, B.P.; DeConto, R.M.; Donnelly, J.P.; Pollard, D. Impact of climate change on New York City’s coastal flood hazard: Increasing flood heights from the preindustrial to 2300 CE. Proc. Natl. Acad. Sci. USA 2017, 114, 11861–11866. [Google Scholar] [CrossRef] [Green Version]
- Kossin, J.P. A global slowdown of tropical-cyclone translation speed. Nature 2018, 558, 104–107. [Google Scholar] [CrossRef]
- Miner, M.D.; Kulp, M.A.; Fitzgerald, D.M.; Georgiou, I.Y. Hurricane-associated ebb-tidal delta sediment dynamics. Geology 2009, 37, 851–854. [Google Scholar] [CrossRef]
- Woods Hole Group. Great marsh Resiliency Project Wave Analysis and Numerical Modeling; Woods Hole Group: Falmouth, UK, 2017; p. 43. [Google Scholar]
- Jarrett, J.T. Tidal Prism—Inlet Area Relationships. GITI Report No. 3; US Army Corps of Engineers, Waterways Experiment Station: Vicksburg, MS, USA, 1976; 54. [Google Scholar]
- O’Brien, M.P. Estuary Tidal Prisms Related to Entrance Areas. Civ. Eng. 1931, 1, 737–738. [Google Scholar]
- O’Brien, M.P. Equilibrium Flow Areas of Inlets on Sandy Coasts. J. Waterw. Harb. Div. Am. Soc. Civ. Eng. 1969, 95, 43–52. [Google Scholar] [CrossRef]
- Oertel, G.F. Sediment transport of estuary entrance shoals and the formation of swash platforms. J. Sediment. Res. 1972, 42, 858–863. [Google Scholar]
- Hine, A.C. Bedform distribution and migration patterns on tidal deltas in the Chatham Harbor Estuary, Cape Cod, Massachusetts; Cronin, L.E., Ed.; Academic Press: New York, NY, USA, 1975; Volume 2, pp. 235–252. [Google Scholar]
- FitzGerald, D.M.; Nummedal, D.; Kana, T.W. Sand circulation pattern of Price Inlet. In Proceedings of the 15th Conference on Coastal Engineering, Honolulu, HI, USA, 29 January 1976; pp. 1868–1880. [Google Scholar]
- Nummedal, D.; Penland, S. Sediment Dispersal in Norderneyer Seegat, West Germany. In Holocene Marine Sedimentation in the North Sea Basin; Blackwell Publishing Ltd.: Oxford, UK, 1981; Volume 5, pp. 187–210. [Google Scholar] [CrossRef]
- Sha, L. Sand transport patterns in the ebb-tidal delta off Texel Inlet, Wadden Sea, The Netherlands. Mar. Geol. 1989, 86, 137–154. [Google Scholar] [CrossRef]
- Ridderinkhof, W.; De Swart, H.E.; Van Der Vegt, M.; Hoekstra, P. Modeling the growth and migration of sandy shoals on ebb-tidal deltas. J. Geophys. Res. Earth Surf. 2016, 121, 1351–1372. [Google Scholar] [CrossRef] [Green Version]
- Elias, E.P.L.; van der Spek, A.J.F. Dynamic preservation of Texel Inlet, the Netherlands: Understanding the interaction of an ebb-tidal delta with its adjacent coast. Geol. En Mijnb. 2017, 96, 293–317. [Google Scholar] [CrossRef] [Green Version]
- Bruun, P.; Gerritsen, F. Natural By-Passing of Sand at Coastal Inlets. J. Waterw. Harb. Div. 1959, 85, 75–107. [Google Scholar] [CrossRef]
- FitzGerald, D.M. Sediment Bypassing at Mixed Energy Tidal Inlets. In Proceedings of the 18th International Conference on Coastal Engineering 1982, Boston, MA, USA, 29 January 1982; pp. 1094–1118. [Google Scholar]
- FitzGerald, D.M.; Kraus, N.C.; Hands, E.B. Natural Mechanisms of Sediment Bypassing at Tidal Inlets, ERDC/CHL-IV-A, U.S. Army Engineer Research and Development Center, Vicksburg, MS. 2001, p. 11. Available online: https://erdc-library.erdc.dren.mil/jspui/bitstream/11681/1934/1/CHETN-IV-30.pdf (accessed on 1 May 2022).
- Mass, G.I.S.; Massachusetts Coastal Zone Management. Mass Coastal Erosion Viewer. 2021. Available online: https://www.arcgis.com/apps/MapSeries/index.html?appid=80fc0c7ef5e443a8a5bc58096d2b3dc0 (accessed on 1 February 2022).
- Sakib, M.M.; Hughes, Z.; FitzGerald, D.M.; Georgiou, I.Y. Impact of Storm-induced Sediment Transport and Depositional Processes in Essex Tidal Inlet and Backbarrier Bay System. In Proceedings of the American Geophysical Union 2021 Fall Meeting, New Orleans, LA, USA, 15 December 2021. [Google Scholar]
- Loh, W.-Y. Classification and regression trees. Wiley Interdiscip. Rev. Data Min. Knowl. Discov. 2011, 1, 14–23. [Google Scholar] [CrossRef]
- BEEODA (Boston Education in Earth Observation Data Analysis), 2020. GitHub Repository. Available online: https://github.com/beeoda (accessed on 1 February 2022).
- Planet Labs PBC. Planet Application Program Interface: In Space for Life on Earth, San Francisco, CA. 2018. Available online: https://api.planet.com (accessed on 1 February 2022).
- Jensen, J.R. Normalized difference vegetation index. In Introductory Digital Image Processing; Prentice-Hall: Hoboken, NJ, USA, 1986; Volume 17, p. 379. [Google Scholar]
- McFeeters, S.K. The use of the Normalized Difference Water Index (NDWI) in the delineation of open water features. Int. J. Remote Sens. 1996, 17, 1425–1432. [Google Scholar] [CrossRef]
- Rondeaux, G.; Steven, M.; Baret, F. Optimization of soil-adjusted vegetation indices. Remote Sens. Environ. 1996, 55, 95–107. [Google Scholar] [CrossRef]
- Olofsson, P.; Foody, G.M.; Herold, M.; Stehman, S.V.; Woodcock, C.E.; Wulder, M.A. Good practices for estimating area and assessing accuracy of land change. Remote Sens. Environ. 2014, 148, 42–57. [Google Scholar] [CrossRef]
- Badjana, H.M.; Olofsson, P.; Woodcock, C.E.; Helmschrot, J.; Wala, K.; Akpagana, K. Mapping and estimating land change between 2001 and 2013 in aheterogeneous landscape in West Africa: Loss of forestlands and capacity building opportunities. Int. J. Appl. Earth Obs. Geoinf. 2017, 63, 15–23. [Google Scholar]
- Lesser, G.; Roelvink, J.; van Kester, J.; Stelling, G. Development and validation of a three-dimensional morphological model. Coast. Eng. 2004, 51, 883–915. [Google Scholar] [CrossRef]
- Booij, N.; Ris, R.C.; Holthuijsen, L.H. A third-generation wave model for coastal regions: 1. Model description and validation. J. Geophys. Res. Oceans 1999, 104, 7649–7666. [Google Scholar] [CrossRef] [Green Version]
- USACE. North Atlantic Coast Comprehensive Study: Resilient Adaptation to Increasing Risk. 2015. Available online: https://www.nad.usace.army.mil/Portals/40/docs/NACCS/NACCS_main_report.pdf (accessed on 31 January 2015).
- Hayes, M.O. Barrier island morphologys a functionof tidal and wave regime. In Barrier Islands from the Gulf of St. Lawrence to the Gulf of Mexico; Leatherman, S.P., Ed.; Academic Press: New York, NY, USA, 1979; pp. 1–28. [Google Scholar]
- Hein, C.J.; FitzGerald, D.M.; Carruthers, E.A.; Stone, B.D.; Gontz, A.M.; Barnhardt, W.A. Refining the model of bar-rier island formation along a paraglacial coast in the Gulf of Maine. Mar. Geol. 2012, 307–310, 40–57. [Google Scholar] [CrossRef]
- FitzGerald, D.M.; van Heteren, S. Classification of paraglacial barrier systems: Coastal New England, USA. Sedimentology 1999, 46, 1083–1108. [Google Scholar] [CrossRef]
- FitzGerald, D.M. Origin and stability if tidal inlets in Massachusetts. In Formation and Evolution of Multiple Tidal Inlet Systems; Aubrey, D.J., Giese, G.S., Eds.; AGU: Washington, DC, USA, 1993; pp. 1–61. [Google Scholar]
- NOAA. Tide Levels. 2021. Available online: https://tidesandcurrents.noaa.gov/waterlevels.html?id=8443970&units=metric&bdate=20171226&edate=20180104&timezone=GMT&datum=MLLW&interval=6&action= (accessed on 1 February 2022).
- Vallino, J.J.; Hopkinson, C.S., Jr. Estimation of dispersion and characteristic mixing times in Plum Island Sound estuary. Estuar. Coast. Shelf Sci. 1998, 46, 333–350. [Google Scholar] [CrossRef] [Green Version]
- Smith, J.B.; FitzGerald, D.M. Sediment transport patterns at the Essex River Inlet ebb tidal delta, Massachusetts, USA. J. Coast. Res. 1994, 10, 752–774. [Google Scholar]
- NOAA. Climate Normals for Boston Airport. 2013 normals.txt. Retrieved 2013-03-24. Available online: Ftp://ftp.ncdc.noaa.gov/pub/data/normals/1981-2010/products/station/USW00014739 (accessed on 1 February 2022).
- Li, H.; Brown, M.; Beck, T.; Frey, A.; Rosati, J.; Habel, M.; Winkelman, J.; O'Donnell, E.; Watts, I. Merrimack Estuary and Newburyport Harbor Sediment Management Studies; USACE Research and Development Center: Vicksburg, MS, USA, 2018; 129. [Google Scholar]
- FitzGerald, D.M.; Buynevich, I.; Davis, R.; Fenster, M. New England tidal inlets with special reference to riverine-associated inlet systems. Geomorphology 2002, 48, 179–208. [Google Scholar] [CrossRef]
- FitzGerald, D.M.; Rosen, P.S.; van Heteren, S. New England Barriers. In Geology of Holocene Barrier Island Systemsin; Davis, R.A., Ed.; Springer: Berlin, Germany, 1994; Chapter 8; pp. 305–394. [Google Scholar]
- Hein, C.J.; Fallon, A.R.; Rosen, P.; Hoagland, P.; Georgiou, I.Y.; Fitzgerald, D.M.; Morris, M.; Baker, S.; Marino, G.B.; Fitzsimons, G. Shoreline Dynamics Along a Developed River Mouth Barrier Island: Multi-Decadal Cycles of Erosion and Event-Driven Mitigation. Front. Earth Sci. 2019, 7, 103. [Google Scholar] [CrossRef]
- Dougherty, A.J. Deciphering the Origin and Evolution of a Paraglacial Barrier, Castle Neck, Massachusetts, Unpub. Master’s Thesis, Department of Earth Sciences, Boston University, Boston, MA, USA, 2002; p. 128. [Google Scholar]
- Barnhardt, W.A. (Ed.) Coastal Change along the Shore of Northeastern South Carolina—The South Carolina Coastal Erosion Study U.S. Geological Survey Circular 1339, 2009. p. 77. Available online: https://pubs.usgs.gov/circ/circ1339/ (accessed on 1 May 2022).
- Hein, C.J.; FitzGerald, D.M.; Barnhardt, W.A.; Stone, B.D. Onshore-offshore surficial geologic map of the Newburyport East and northern half of the Ipswich Quadrangles, Massachusetts, Massachusetts Geological Survey. In Geologic Map; GM 13-01, 3 sheets, ed.; Massachusetts Geological Survey: Amherst, MA, USA, 2013. [Google Scholar]
- Oldale, R.N.; Wommack, L.E.; Whitney, A.B. Evidence for a Postglacial Low Relative Sea-Level Stand in the Drowned Delta of the Merrimack River, Western Gulf of Maine. Quat. Res. 1983, 19, 325–336. [Google Scholar] [CrossRef]
- Hein, C.J.; FitzGerald, D.M.; Buynevich, I.V.; Van Heteren, S.; Kelley, J.T. Evolution of paraglacial coasts in response to changes in fluvial sediment supply. Geol. Soc. Lond. Spec. Publ. 2014, 388, 247–280. [Google Scholar] [CrossRef]
- WHG. Upper North Shore Dredge Purchase Feasibility Study Evaluating Alternatives to Support the Need for Dredging Services on the Upper North Shore of Massachusetts. Prepared for Merrimack Valley Planning Commission. 30 June 2019. Available online: https://www.townofnewbury.org/sites/g/files/vyhlif951/f/uploads/mvpc_north_shore_dredge_report_draft_7_8_2019.pdf (accessed on 1 May 2022).
- Fitzgerald, D.M.; Buynevich, I.V.; Fenster, M.S.; Kelley, J.T.; Belknap, D.F. Coarse-Grained Sediment Transport in Northern New England Estuaries: A Synthesis. In Coastal Systems and Continental Margins; Springer Science and Business Media LLC: Berlin, Germany, 2007; Volume 8, pp. 195–213. [Google Scholar]
- Trenberth, K.E. Changes in precipitation with climate change. Clim. Res. 2011, 47, 123–138. [Google Scholar] [CrossRef] [Green Version]
- Moore, M.V.; Pace, M.L.; Mather, J.R.; Murdoch, P.S.; Howarth, R.W.; Folt, C.L.; Chen, C.Y.; Hemond, H.F.; Flebbe, P.A.; Driscoll, C.T. Potential effects of climate change on freshwater ecosystems of the New England/Mid-Atlantic region. Hydrol. Processes 1997, 11, 925–947. [Google Scholar] [CrossRef]
- FitzGerald, D.M.; Hubbard, D.K.; Nummedal, D. Shoreline changes associated with tidal inlets along the South Carolina Coast. In Proceedings of the Coastal Zone’78, San Francisco, CA, USA, 14–16 March 1978; American Society of Civil Engineers: New York, NY, USA, 1978; pp. 1973–1994. [Google Scholar]
- Hein, C.J.; Fitzsimons, G.G.; Fitzgerald, D.M.; Fallon, A.R. Records of Migration and Ebb-Delta Breaching at Historic and Ancient Tidal Inlets along a River-Fed Paraglacial Barrier Island. J. Coast. Res. 2016, 75, 228–232. [Google Scholar] [CrossRef]
- FitzGerald, D.M. Shoreline erosional-depositional processes associated with tidal inlets. In Hydrodynamics and Sediment Dynamics of Tidal Inlets; Aubrey, D.G., Weishar, L., Eds.; Springer: New York, NY, USA, 1988; pp. 269–283. [Google Scholar]
- Fritzen, R.; Lang, V.; Gensini, V.A. Trends and variability of North American cool-season extratropical cyclones 1979–2019. Am. Meteorol. Soc. 2021, 60, 1319–1331. [Google Scholar] [CrossRef]
- FitzGerald, D.M.; Montello, T.M. Backbarrier and inlet sediment response to the breaching of Nauset Spit and formation of New Inlet, Cape Cod, MA. In Formation and Evolution of Multiple Tidal Inlet Systems; Aubrey, D.G., Giese, G.S., Eds.; AGI: Fresno, CA, USA, 1993; pp. 158–185. [Google Scholar]
- Finkelstein, K. Cape formation as a cause of erosion on adjacent shorelines. In Proceedings of the Coastal Zone ’83, San Diego, CA, USA, 14 June 1983; American Society of Civil Engineers: New York, NY, USA, 1983; pp. 620–640. [Google Scholar]
- Fenster, M.S.; Dolan, R.; Smith, J.J. Grain-size distributions and coastal morphodynamics along the southern Maryland and Virginia barrier islands. Sedimentology 2016, 63, 809–823. [Google Scholar] [CrossRef]
- Shawler, J.L.; Hein, C.J.; Obara, C.A.; Robbins, M.G.; Huot, S.; Fenster, M.S. The effect of coastal landform development on decadal-to millennial-scale longshore sediment fluxes: Evidence from the Holocene evolution of the central mid-Atlantic coast, USA. Quat. Sci. Rev. 2021, 267, 107096. [Google Scholar] [CrossRef]
- FitzGerald, D.M.; Penland, S.; Nummedal, D. Control of barrier island shape by inlet sediment bypassing: East Friesian Islands, West Germany. Mar. Geol. 1984, 60, 355–376. [Google Scholar] [CrossRef]
- Torres, J.; Kulp, M.; FitzGerald, D.M.; Georgiou, I.; Lepper, K. Geomorphic and temporal evolution of a Mississippi delta flanking barrier island: Grand Isle, LA. Mar. Geol. 2020, 430, 106341. [Google Scholar] [CrossRef]
- Gaudiano, D.J.; Kana, T.W. Shoal Bypassing in Mixed Energy Inlets: Geomorphic variable and empirical predictions for Nine South Carolina Inlets. J. Coast. Res. 2001, 17, 280–291. [Google Scholar]
- Naumann, M.; Lampe, R.; Hoffmann, G. Coastal evolution of a Holocene barrier spit (Bug peninsula/NW-Rügen) deduced from geological structure and relative sea-level. EG Quat. Sci. J. 2010, 58, 164–173. [Google Scholar] [CrossRef]
Publisher’s Note: MDPI stays neutral with regard to jurisdictional claims in published maps and institutional affiliations. |
© 2022 by the authors. Licensee MDPI, Basel, Switzerland. This article is an open access article distributed under the terms and conditions of the Creative Commons Attribution (CC BY) license (https://creativecommons.org/licenses/by/4.0/).