Abstract
Field-deployable sensors play an important role in precision agriculture and are used to enable key stakeholders (farmers, agronomists, policy makers, etc.) to make informed decisions about resource management and improve crop yields. Sensor developers must consider technological, economic, and human aspects jointly in order to design a successful sensor. The objective of this review is to describe some of the key strands of each aspect and highlight the need to develop a degree of understanding of all of these aspects in order to create technologies that will be easily and readily adopted. Rather than analyzing each area in depth, we limit our discussion to a few major aspects and try to indicate interdependency and showcase their impact on one another. We hope that this approach will instigate thoughts and ideas and stimulate the co-creation of fit-for-purpose sensors.
1. Field-Deployable Sensors in Precision Agriculture
The need for field-deployable devices in agriculture has been discussed in depth in many review and research articles specializing in a variety of relevant topics. Essentially, the significant pressure to produce more food than ever before, while using fewer resources and protecting the environment places significant pressure on many stakeholders. An important aspect of addressing this pressure is the development of technologies that enable gathering, processing and analysis of data to support management decisions resulting in improved resource use efficiency, productivity, quality, profitability, and sustainability of agricultural production or otherwise known as Precision Agriculture or smart farming. This is a complex problem and attracts various specialists. Figure 1 illustrates exponential growth of published papers using the ‘precision agriculture’ keyword obtained from Web of Science from 2012 onwards. Note that the search was performed on 21 August 2025 and thus does not include articles published later in 2025.
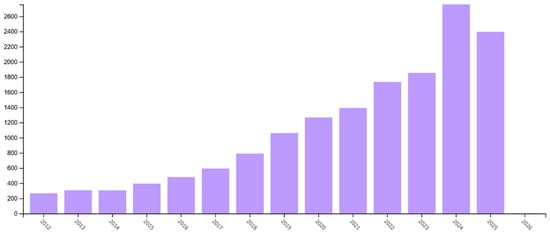
Figure 1.
Number of publications per year obtained by entering ‘precision agriculture’ into Web of Science.
Despite great advances, the adoption rate of smart farming technologies remains low and fragmented [1,2].
There are numerous challenges associated with the development and use of field-deployable sensors in agriculture. Before one can develop such technology, a basic understanding of these challenges related to application and use must be developed so that an appropriate design can be achieved. This can be counterintuitive, as scientists and engineers may initially focus on the sensor’s performance characteristics without considering the farmer’s point of view. We suggest that sensors will only be truly fit for purpose when they strike the right balance between these challenges and the unavoidable trade-offs involved. (e.g., concession in performance to improve usability).
2. Key Ideas on Identifying a Problem in Which Sensors Can Help
Agriculture is arguably the original interdisciplinary activity. From the very beginning, farmers had to understand their local environment to manage land, water, and other natural resources effectively to sustain crop production and animal husbandry. Through millennia of farming, a vast amount of knowledge, experience, practices, and habits have been formed. It would not be wrong to say that farming communities have learned to understand and develop a deep connection with their land. Introduction of new technologies into deeply rooted practices is generally disruptive, and farmers are not immune to resisting the disruption. It is therefore extremely important to understand both technological and socio-economic challenges in order to develop fit-for-purpose sensors.
To do so, we must first understand whose needs should be addressed: the farmer, the consumer, society, or the government. Although it seems reasonable that the needs of all would be aligned, this is not always the case as trade-offs occur.
Another key idea in the development of a practically useful sensor results from understanding how farming is practiced. There are wide variations in agricultural practice worldwide, owing to differences in environmental, economic, and cultural conditions (i.e., some soils are more fertile, or some crops are more popular), differences in training, and in the resources available to practitioners.
Understanding agricultural practice is essential for identifying opportunities for sensor design based on practical needs, and this requires clear communication pathways between sensor developers and farming practitioners.
Understanding the intended use of the sensor is critical. Farming decisions fall into one of two categories: diagnostic and management. In diagnostic decision-making, the aim is to link field outcomes (e.g., yield) with objective data to identify the conditions that produced them. A correct diagnosis allows the farmer to understand and predict the reasons for the low yield and to take steps, or manage, the field in an effort to mitigate present or future problems through some type of intervention (i.e., fertilization). Sensors can provide critical information to aid in diagnosis and management, or sometimes both.
Let us analyze here a simple example of measuring nitrogen (N) as one of the key plant macronutrients. For example, a sensor designed to detect plant-available nitrogen in soil can help the farmer to understand residual nitrogen supply and guide initial fertilizer applications, while measuring leaf nitrogen during the growing season is useful for detecting the crop’s ongoing nitrogen needs for timely supplemental N applications if required. From a technical perspective, these measurements require sensors utilizing different technologies and cannot be used interchangeably. While both sensors provide very valuable information, the farming community must understand whether effective management intervention requires both types of information (and thus both sensors), and/or whether the increase in yield warrants investment in one or both sensors.
Clearly, challenges are great and complex. It is important to develop a degree of understanding of the challenges directly facing each stakeholder and the necessary trade-offs that need to be made. For instance, a highly accurate and precise sensor may be unacceptable if its practical application requires a significant shift in daily routine operations or if its price point is too high, offsetting savings in money, time, and energy elsewhere. Therefore, technological and socio-economic considerations go hand-in-hand. We aim here to review and pay attention to both as much as possible. Our intention is not to provide a comprehensive review of all fields. Rather, we would like to accentuate the importance of considering both technology and socio-economic factors at the same time and initiate thoughts and ideas. In doing so, we acknowledge that certain details will be omitted and that some relevant contributions may not be cited.
3. Considerations in Designing Fit-for-Purpose Sensors
3.1. Technological Considerations
The scientific (mainly chemistry-related) literature is rich in research and review publications describing chemical sensors for parameters relevant to Precision Agriculture. In these publications, the focus is typically on the analysis of sensor types, advances, and advantages. Herein, we aim to broaden the focus and discuss the sensors from the perspective of the practical utility of sensors as relevant to end users (farming community, policy makers, etc.). Our analysis is limited to sensors for major macronutrients (nitrogen, phosphorus, and potassium, or NPK) and the ways their concentration is obtained and utilized by end users. Specifically, we select electrochemical and optical sensors that seem to make arguably the biggest impact in nutrient analysis [2,3,4,5] and discuss their utility in obtaining information relevant to the farming community. As different sub-classes of sensors may be used to obtain different types of information (e.g., plant-available nitrogen in soil vs. leaf nitrogen as per our example above), we discuss these technologies based on the approaches through which this information can be accessed. Namely, plant-available nutrients in soil can generally be accessed by their direct measurements, while nutrients present in the plant can be obtained by indirect measurement of a related parameter (e.g., chlorophyll) and understanding of its relationship to the desired plant nutrient (especially nitrogen) [6]. We believe that this approach will be useful, especially to non-technical practitioners and specialists in socio-economic fields, as it highlights practical challenges rather than challenges related to sensor development.
Direct measurements: In terms of their practical applications, electrochemical sensors (potentiometric, voltametric, conductometric, and impedance) are mostly used for direct measurement of plant nutrients (e.g., nitrate, sodium, pH, etc.) in soil and water. Their advantages include excellent response characteristics (accuracy, precision, response time, selectivity, etc.) [7,8], relatively simple circuitries that can easily be miniaturized, and low power requirements [9,10]. Potentiometric sensors or ion-selective electrodes (ISEs) emerge as the most promising ones [11,12].
Colorimetric sensors are a sub-class of optical sensors that utilize a change in colour, typically of a solution or a polymeric film as an indicator of concentration of relevant chemical species (e.g., potassium, ammonium, pH, etc.) [13,14,15]. Recent improvements in mobile phone processing and the availability of low-cost computing platforms such as the Raspberry Pi have facilitated the development of sensors incorporating simplified signal processing [13,15,16,17].
Electrochemical and colourimetric sensors are portable and can target the plant-available fraction of nutrients, but they require sample preparation and in-field calibration. These sensors measure ionic forms of nutrients such as nitrate (NO3−), ammonium (NH4+), potassium (K+), sodium (Na+), calcium (Ca2+), magnesium (Mg2+), hydrogen as pH, etc. Thus, some soil digestion is required to transfer nutrients into the liquid digestate to be available for measurement. Unfortunately, there is no single methodology for the extraction of nutrients; the approach depends on the purpose of the analysis. Review of challenges connected with selecting appropriate methodology for soil digestion is outside of the scope of this paper, and we refer interested readers to the herein listed, albeit limited number of publications on this topic [18,19,20,21,22]. Figure 2 illustrates key steps relevant to the direct determination of nutrients using electrochemical sensors.
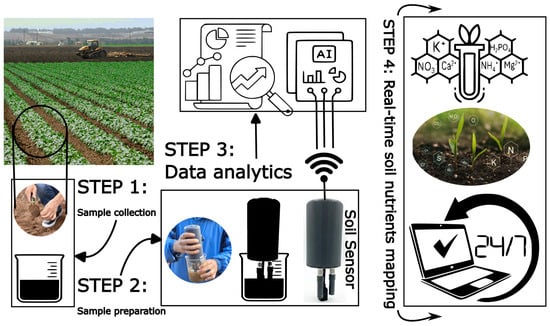
Figure 2.
Steps required for the direct determination of nutrients using electrochemical sensors. Ideally, all steps are performed in situ to reduce the time lag typically observed using classical laboratory-based instrumentation. The steps include soil collection on the required location, preparation of the sample for analysis (extraction and mobilization of nutrients into aqueous solution), analysis (e.g., by immersing calibrated sensors into the soil slurry), and data analytics (recent advantages in communication technologies allow instantaneous transfer of data, while modern AI-based technologies allow an element of data interpretation).
Utilization of diffusive gradients in thin films (DGT), diffusive equilibration in thin films (DET), and fibre microfluidics emerge as interesting approaches to sample nutrients directly in the porewater [23,24]. DGT and DET are, in essence, passive samplers that can be left in soil over a prolonged time period and require subsequent analysis. Guo et al. have integrated a fibre microfluidic sampler that wicked soil porewater and transported it over potentiometric sensors to monitor NH4+ over 4–6 days in real-time [23]. While this approach is interesting in the science/engineering aspect, in the context of real-life, in-field deployment, choosing the number of sensors and representative locations poses a significant challenge [25]. Furthermore, potential damage by animals and/or farming equipment, as well as the concomitant time and energy needed to remove and re-plant the sensors, questions their practical and financial feasibility.
To ensure reliability and consistency of measurements, sensors need to be calibrated, typically by an occasional exposure to a solution of known concentration. Research aiming to describe calibration-free sensors is very active and includes the utilization of microfluidics [26], advanced materials [27], and/or approaches such as using high cell symmetry [28], mass production of identical sensors [29], and a combination of readout principles (e.g., potentiometry and coulometry) [30], to name but a few. In his opinion piece, Bakker argues that “calibration-free sensors are clearly possible, but require a multipronged approach for maximizing robustness that includes the optimization of sensing materials and the use of the most adequate readout methodologies.” [31].
From the application perspective, electrochemical and colourimetric sensors offer portability and direct measurement of bioavailable nutrients (the fraction of the total amount of nutrients that is available to plants). However, the need for soil processing and calibration poses significant challenges for methodology development and engineering design solutions. Despite the simplicity and perceived low cost of the chemical sensor [14,32,33], it still requires significant hardware and power consumption. This increases the complexity of the operation, thus posing significant pressure on the price point of the technology. While the high point of entry seems to be the main barrier for adoption of technology in Precision Agriculture, the barriers are diverse and require different direct and indirect interventions to promote technology adoption [34].
Indirect measurements: Optical sensors based on infrared radiation (IR) offer an interesting approach in sensing relevant to Precision Agriculture. Absorption of IR by molecules offers rapid, non-destructive, chemical-free soil analysis and therefore provides an option to overcome issues of sample processing and calibration as described above. However, IR spectroscopy is susceptible to various interfering factors such as scattering, reflection, and interference, which manifest themselves as baseline, band distortion, and intensity changes in the measured IR spectra. Thus, application of IR technology requires spectral pre-processing and data modelling to translate the spectral signals into high-level chemical information [35,36]. Accurate prediction of soil nutrient levels depends on the accuracy of the developed models and the raw data, with a calibration coefficient () and the validation coefficient () generally around and/or above 0.7 [37].
Although traditional laboratory analysis is more accurate for individual nutrients, it cannot compensate for errors caused by non-representative sampling. In cases where representativeness is critical, optical spectrometry can outperform chemical analyses. For example, it allows assessment of the complete slurry in a storage tank, during tanker filling, or even at the point of field application. This has important implications for stakeholders: farmers benefit from more reliable nutrient estimates at the point of use, reducing the risk of over- or under-application; advisory services can provide recommendations based on real-time, representative data; and policymakers gain evidence that field-based monitoring can complement rather than replace laboratory testing in nutrient management schemes.
Hyperspectral imaging (HSI) is another interesting approach that utilizes the optical identity of molecules. It is a spectral sensing technique in which an object is photographed using several well-defined optical bands in a broad spectral range. It was originally implemented on satellite and airborne platforms for remote sensing applications. In the agricultural context, it found applications in the determination of total nitrogen content and available phosphorus using HSI-powered satellites [38,39], and spatial nutrient distribution using unmanned aerial vehicles (drones) [40]. Notably, satellite monitoring can be impacted by cloud cover. The high cost of HSI systems, ranging from $10,000 to $100,000 [4], limits their widespread application in identifying soil nutrients. Additionally, the large volumes of hyperspectral image data necessitate advanced mathematical or statistical algorithms for effective data analysis.
Deep learning architectures, such as convolutional neural networks (CNNs), autoencoders, deep belief networks, generative adversarial networks (GANs), and recurrent neural networks, are increasingly being used in hyperspectral imagery processing [41]. Key innovations focus on handling massive data volumes, improving efficiency with lightweight models, reducing noise, and developing robust spectral unmixing and target-detection methods. Very recently, Ghasemi et al. explored how artificial intelligence (AI) can transform spectroscopic imaging from raw data collection to real-time interpretation in orbit [42]. They demonstrated the efficacy of lightweight CNNs and 1D-CNN models (one-dimensional CNNs) for onboard processing, as these architectures require fewer computational resources, critical in satellite environments where energy and memory are severely limited. Relevantly, Bourriz et al. reviewed HSI and AI models for reliable large-scale crop mapping, contributing to sustainable agriculture and global food security [43].
Figure 3 illustrates approaches to using chemical-free soil analysis, for example, through utilizing spectral and hyperspectral imaging technologies in agriculture.
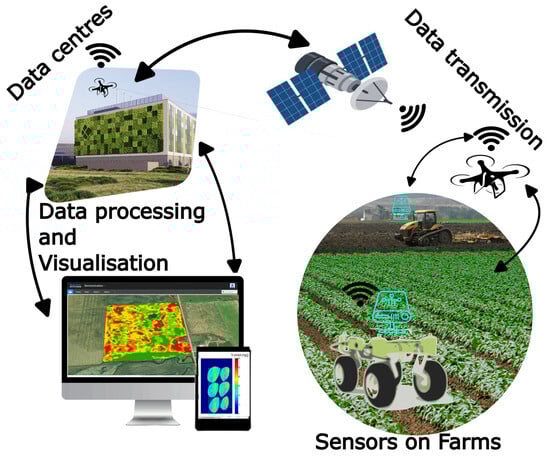
Figure 3.
Indirect measurement of nutrients using spectral and hyperspectral imaging technologies in combination with tractors, autonomous ground vehicles (UGV), drones, and satellites for Precision Agriculture.
Sensor data and farming practice: Analysis of sensor utility is incomplete without understanding the relationship between the information they provide vs. the information required to diagnose potential issues and manage required actions (e.g., field fertility and consequential application of fertilization).
For simplicity, let us focus here on sensors for direct measurement of the ionic (bioavailable) form of NPK. As plants uptake nitrogen in the form of nitrate and ammonium (NO3−, NH4+ respectively), phosphorus as dihydrogen phosphate and hydrogen phosphate (H2PO4−, HPO42− respectively), and potassium as K+, sensors would typically be designed to measure these species in mg (nutrient ion)/L (soil extract). However, in order for practitioners to effectively advise on fertilization, the most important indicator is the presence of the given nutrient in the field in kg/ha. Although a seemingly simple conversion, the practice and terminology can be ambiguous and result in a misunderstanding between technology developers and practitioners.
The practitioners are interested in ‘mineral nitrogen’, or the fraction of nitrogen present in NO3− and/or NH4+. These are expressed as NO3-N (nitrate–nitrogen) and NH4-N (ammonium–nitrogen), respectively. Sensor data (concentration of NO3− and/or NH4+), therefore, has to be converted into mineral nitrogen using ratios of molar masses of nitrogen to the ionic species. As an illustration, for NO3− this is . Hence, sensor-obtained concentration of NO3− has to be multiplied by 0.226 to obtain the value of NO3-N. A similar result can be obtained for NH4-N. Total mineral nitrogen is then obtained as the sum of NO3-N and NH4-N. Notably, the difference must be made between the ‘total mineral nitrogen’ and the ‘total nitrogen’. The latter represents the sum of all organic and inorganic (mineral) forms of nitrogen (N) and is not used for fertilizer recommendations.
Sensor-obtained concentration of bioavailable potassium (K+) has to be converted into ‘potash’, which is a term used to represent a group of minerals and chemicals that contain water-soluble potassium and, for consistency, is reported in terms of potassium oxide (K2O). Thus, the concentration of K+ has to be converted into K2O by multiplying it by the conversion factor of 1.205.
Finally, phosphorus is reported as phosphorus pentoxide (P2O5), which is often referred to as ‘phosphate’. Confusingly, the same term is also commonly used for the PO43− ion, which is a derivative of phosphoric acid H3PO4, even though the chemical nomenclature clearly distinguishes between phosphorus pentoxide (P2O5) and orthophosphate (PO43−). Thus, care must be taken in regular communication to achieve mutual understanding.
Conversion factors are calculated similarly as explained above and are collated in Table 1 below.

Table 1.
Conversion factors for the multiplication of the concentration of measured species to obtain the value of the nutrient’s mineral form [44].
Following the conversion of sensor data into mineral form of the nutrient in question, the conversion from the mass of the nutrient’s mineral form in the soil extract (mg/L) to its mass in dry soil (mg/kg) is an intermediary step to the conversion to mass per hectare (kg/ha).
The concentration of a nutrient’s mineral form in soil , is obtained using the following equation:
where stands for the concentration obtained in the extract, using a known volume of the extraction solution () and mass of dry soil (). The presence of the nutrient in the field is then calculated as:
where is soil bulk density, is the soil sampling depth, while and are conversion factors from mg to kg and from m2 to hectares, respectively.
Notably, soil bulk density varies between soil types. Namely, average soil bulk densities for well-structured high-organic loam soil are 900 kg/m3, silt loam 1100 kg/m3, medium- to fine-texture loam 1300 kg/m3, sand 1500 kg/m3, and compacted soil or clay subsoil 1300–1600 kg/m3 [45]. Real-life example calculations are provided in the Supplementary Information.
Moreover, while 0.15 m sampling depth is commonly used for assessment of soil fertility, different sampling depths are used in evaluating changes in no-till systems based on time in no-till or crop rotation [46]. For consistency and effective translation of data, it is crucial to understand laboratory service practices (e.g., used extraction solution) as well as the field’s properties (bulk density) and practices (sampling depth).
From this short analysis, it is clear that improving usability requires clarification of terminology as well as allowing stakeholders to decide the depth of information they want to see. In particular, some might only want the headline figure of available nutrients in kg/ha, while others may wish a degree of autonomy and input into calculations. In other words, co-creation is essential for the development of usable, fit-for-purpose technology.
3.2. Socio-Economic Considerations
Adoption of agricultural technology, including sensor-based systems and digital tools, is seen as crucial for improving productivity and sustainability. Despite this, uptake has been limited across many regions. Decisions about agri-tech adoption are influenced by a mix of economic, psychological, structural, and socio-cultural factors. These include the costs and benefits of investment, how practical and usable the tools are, the trust farmers place in them, and the wider policy and market setting [34,47].
Economic Drivers and Business Models: Economic factors shape adoption at multiple levels, from individual farms to wider policies and global markets. Cost and return on investment (ROI) are central to decisions about adopting new technologies. Most farms operate on tight margins, and investment in sensors may only be likely where there is a clear and reliable economic case [34]. At the farm level, decisions about whether to invest in sensors often depend on tight margins and the clarity of the economic case. Farmers are more likely to adopt technologies that show consistent profitability under real farm conditions, whereas high up-front costs, subscription fees, and uncertain returns act as barriers [48,49]. The economics of adoption are also influenced by farm advisors and agronomists. While advisory services can encourage uptake, they may also present conflicts of interest: namely, some agronomists recover income through the sale of fertilizers and other inputs, creating disincentives to recommend technologies that reduce input demand [50].
A survey of North American farmers revealed that 52% identified cost and 40% identified uncertain ROI as their main reasons for delaying the adoption of precision agricultural technologies, including sensors [51]. These concerns are often amplified on smaller farms that are not well placed to spread costs and may struggle to justify investments [49].
The structure of the business model for specific products is also important. Farmers are reluctant to commit to one-off purchases where benefits are uncertain. Leasing arrangements, service-based offers, and performance-linked contracts are considered more practical as they reduce financial risk [51]. Evidence shows that uptake is more likely where technologies demonstrate profitability under real farm conditions and are well aligned with existing systems and interoperable with current software [52].
An additional challenge concerns the clarity of what a sensor-based technology provides. Some farmers may experience uncertainty about whether they are purchasing a physical sensor, access to a data processing service, or a decision-support tool that effectively functions as a consultant. This lack of clarity may affect perceptions of cost, responsibility, and value, and can reduce willingness to adopt technologies whose benefits are packaged across hardware, data, and advisory functions. Recent analyses of agri-technology markets highlight that unclear value propositions weaken trust and slow uptake, particularly when subscription models or bundled services are involved [51].
Usability and Skill Requirements: The importance of usability and perceived usefulness in shaping technology uptake across sectors has been recognized for some time [53,54]. Farmers are unlikely to use tools that are difficult to install, integrate, or interpret. Complex interfaces or the need for specialist knowledge reduce appeal, especially for older farmers or those with limited digital literacy [49,55]. Hands-on training, demonstrations, and co-design with farmers may help address these challenges and increase adoption [56].
Trust, Cognitive, and Psychological Factors: Trust is central to whether farmers adopt new technologies. They want confidence that tools will perform reliably on their own farms [57]. Recent UK research shows that many farmers are willing to use sensors for data collection, but are less comfortable with software that makes management recommendations. This ‘algorithm aversion’ contrasts with agronomists, who are more open to algorithmic outputs, highlighting the role of professional background in shaping attitudes [52]. Advisory services, therefore, remain an important bridge in building long-term confidence in these tools.
Adoption also depends on the extent to which the new technology disrupts established practices. Many require farmers to change working routines, engage with new forms of data, or work with competing service providers [48,58]. Additionally, incompatibility between platforms can lock users into particular systems, while regulations and limited broadband access in rural areas present further constraints [59].
Socio-cultural attitudes add further complexity. Age, education, and farm size are all linked to willingness to adopt, with younger farmers and larger businesses generally more open to agri-tech innovation [34,49]. The impact that adoption has on one’s identity has also been shown to play a role; e.g., some may view reliance on sensors as undermining traditional expertise; for others, it signals professionalism and modernity [55].
Structural and Socio-economic Considerations: Farm structure is a major factor in adoption. Figure 4 summarizes the rate of adoption of smart technologies in different regions of the world.
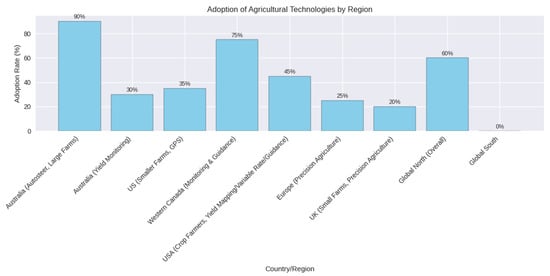
Figure 4.
Summary of the rate of adoption of smart technologies in different regions of the world.
In some districts in Australia, autosteer adoption has reached 90% among growers on larger farms, though adoption rates for yield monitoring are generally lower and more varied [48,60]. Smaller farms in the US and Europe often report GPS adoption rates below 40% [61]. Monitoring and guidance systems are utilized by over 75% of farmers in western Canada [62]. Agricultural technologies, particularly yield mapping, variable rate technologies, and guidance systems, showed a more than 40% adoption rate by 2016 by crop farmers in the USA [63], while the usage of technologies in European countries was recorded at 25%, including those technologies that fall under precision agriculture [59]. In the UK, where a large portion of farms are small and family-run, financial and knowledge barriers remain significant [49]. However, despite the potential benefits, the adoption of precision agriculture technologies in small farms remains limited [49]. Overall, adoption of farming technologies in the Global North has witnessed substantial growth [64], while the adoption rates remain undocumented in the Global South [65]. This lack of documentation is not indicative of low relevance but reflects persistent structural barriers, such as limited infrastructure, uneven digital access, and fragmented extension systems, that shape technology uptake in smallholder-dominated regions. These contextual differences are elaborated in Section 3.3.
3.3. Technological and Socio-Economic Challenges in Smallholder and Global South Contexts
Most studies of agri-tech adoption focus on large, commercial farms in the Global North. However, most of the world’s farmers are smallholders working in environments with very different social, economic, and technological conditions. The limited data available on technology adoption in the Global South is not due to a lack of interest or relevance, but rather to gaps in digital infrastructure, monitoring systems, and reporting capacity [66]. Understanding these differences is essential for designing sensors and digital tools that genuinely meet farmers’ needs.
Infrastructure constraints. Many smallholder regions struggle with unreliable electricity, unstable internet connectivity, and the high cost of data. These challenges make it difficult to run tools that depend on constant power or real-time data transfer. Evidence from across Sub-Saharan Africa shows that users face frequent outages and limited network coverage, which affects the performance of digital tools and IoT devices [67]. Although the spread of low-cost agricultural monitoring technologies represents important progress, these tools remain contingent on consistent power access and locally feasible maintenance arrangements [67]. Advanced sensors are technically promising, but when used in demanding field conditions, they often face durability and maintenance challenges [68].
Affordability and cost structures. For smallholders, affordability is shaped by unstable income, limited access to credit, and unpredictable market prices. Even when tools are relatively inexpensive, the ongoing costs, such as data fees, consumables, or subscription charges, can discourage adoption. Studies show that farmers’ investment decisions are strongly influenced by price volatility and financial uncertainty [69]. Technologies are more likely to be adopted when they are offered through shared-use models, cooperatives, or public–private extension programmes [70]. Research from South Africa shows that farmers adopt technologies when they clearly fit into existing production systems and when the costs are manageable [71]. New business models that emphasize partnerships, clarity of value, and frugal innovation are increasingly important for making agricultural technologies accessible in low-income settings [72].
Trust networks and extension systems. In smallholder contexts, adoption depends heavily on trusted intermediaries such as public extension officers, NGOs, cooperatives, and farmer field schools. These actors help explain how digital tools work, provide demonstrations, and build confidence among farmers. New research highlights that intermediaries play a critical role in helping farmers understand and absorb digital innovations [73]. Farmer field school models that promote hands-on, peer-to-peer learning have been shown to strengthen trust and improve adoption of climate-resilient practices [74]. When support is inconsistent or poorly coordinated, trust declines, and technologies are abandoned.
Digital literacy and usability. Digital literacy varies widely across low-income settings and is shaped by education, gender, age, and previous exposure to digital tools [66]. Many digital systems assume a level of familiarity with apps, dashboards, or cloud-based platforms that is not always present [75]. Studies show that if tools are difficult to use, require multiple calibration steps, or produce outputs that are hard to interpret, adoption is significantly reduced [66]. For this reason, usability must be a central design goal. Tools need clear interfaces, minimal steps, and support in local languages.
Risk perception and investment behaviour. Smallholders often operate with very limited financial buffers and face unpredictable climate and market conditions. As a result, they tend to avoid technologies that seem uncertain or difficult to reverse. Recent work shows that farmers’ perceptions of climate risk directly influence their willingness to invest in new tools or practices [76]. Broader work on innovation adoption highlights that uncertainty: technical, social, or economic: is one of the strongest barriers to trying unfamiliar technologies [77].
Implications for “low-cost” sensor design. In these settings, “low-cost” does not only refer to cheap hardware. A device may be inexpensive but still inaccessible if it requires strong connectivity, repeated calibration, or paid software. Research on frugal innovation stresses that technologies must be simple, robust, and adapted to local realities [78]. Human-centred design approaches further highlight the need for transparency, trust, and clarity in how tools function [79]. Low-cost sensors must therefore prioritize durability, easy maintenance, intuitive interpretation, and resilience to poor infrastructure.
3.4. Policy Considerations and Broader Structural Drivers
At the policy level, governments and international organizations play a central role in shaping incentives. Subsidies, tax relief, and grants can offset costs and accelerate uptake, particularly for smaller or family-run farms [80]. Policies aligned with environmental goals are especially important in the UK context, where agri-environmental schemes increasingly reward practices that lower fertilizer use and emissions. At the macroeconomic scale, fertilizer production provides an illustrative case. Ammonia synthesis alone accounts for around 2% of global final energy consumption and 1.3% of CO2 emissions [81]. Nutrient monitoring sensors can therefore deliver dual benefits by reducing farm costs and mitigating negative externalities, such as greenhouse gas emissions and nutrient losses to water [82]. These wider benefits often strengthen the policy rationale for adoption, even where the farm-level business case is marginal. However, not all stakeholders may see this as beneficial; as we mentioned before, agronomists sometimes advise without charge but recover costs through input sales, which may discourage them from recommending tools that reduce fertilizer use [50]. It is important to note that these policy levers are far less developed or differently structured in many regions of the Global South, where limited public extension capacity, shallow agricultural credit markets, and the predominance of donor-led programmes continue to shape the landscape of technology adoption. Together with the infrastructural and socio-economic constraints outlined in Section 3.3, these institutional differences contribute to the persistent disparities in adoption observed between the Global North and Global South.
The innovation process for sensors may also impact the likelihood of adoption. Farmer input at early stages and throughout is essential to promoting bottom-up, inclusive innovation. This inclusive approach can ensure sensors are designed around practical needs and local contexts, rather than imposed through top-down programmes [80].
Finally, the circular economy perspective adds another dimension. Sensors that improve nutrient-use efficiency and facilitate recycling can reduce dependence on synthetic fertilizers and close nutrient loops. Research shows that integrated nutrient recovery and recycling strategies offer significant potential for sustainable intensification but require monitoring tools that are reliable and scalable [83,84].
4. Conclusions
The research on the development and adoption of technologies in Precision Agriculture has undergone accelerated progress in recent years. Unfortunately, the rate of adoption is still very slow and fragmented. While research in sensor technologies has advanced rapidly, socio-economic understanding of adoption factors has also grown, yet sensor development research and socio-economic studies of adoption remain largely disconnected. This consequently results in technologies that are not fit-for-purpose. For example, they might have better performances than the previous generation of sensors, but they are still not accepted by the farming community because their deployment on the field requires changes to established workflows that farmers find impractical.
The socio-economic findings outlined above suggest that engineering priorities need to expand beyond accuracy and technical performance. End users are likely to value interpretability, transparency, and minimal disruption to existing routines over marginal gains in precision. As such, sensor development should actively incorporate:
- Interpretability: interfaces that make data provenance, uncertainty, and recommended actions clear and accountable.
- Workflow compatibility: systems that reduce rather than add steps, minimize calibration, and integrate cleanly with existing farm operations.
- Risk-aligned business models: leasing, pay-per-use, and service-based arrangements that lower financial uncertainty for farmers.
- Interoperability: open formats and compatibility with existing software platforms to avoid lock-in and reduce reliance on proprietary ecosystems.
Embedding these principles into engineering practice will support a shift toward co-designed, human-centred sensor development, where usability and trust are treated as core performance metrics rather than secondary considerations.
The challenges are even greater in the context of the Global South, where unreliable electricity, limited cellular coverage, and high data costs undermine the adoption of modern technologies, which often require continuous connectivity, cloud-based analytics, and frequent recharging. Moreover, technologies deemed “low cost” in the Global North may be inaccessible to the Global South due to infrastructure dependencies, software requirements, maintenance burdens, or pay-walled analytics. In fact, designing sensors for the Global South requires more than technical optimization. It demands an understanding of smallholders’ financial realities, levels of digital literacy, trust networks, risk attitudes, and everyday working conditions. Incorporating these socio-economic dimensions into engineering and design processes is essential for creating tools that work well in practice and support equitable, sustainable agricultural intensification.
Clearly, the development of fit-for-purpose sensors is challenging for both technological and socio-economic arenas. With this review, we are attempting to bridge the gap between these arenas and highlight some of the key challenges in each of them. For the benefit of non-technical readers, we aimed to describe some of the major challenges of sensor technologies and the applicability of such technologies. Moreover, we highlighted the potential for miscommunication and misunderstanding due to the ambiguous use of terms indicating nutrients and/or fertilizer form. For the benefit of sensor developers, we are highlighting factors that are influencing technology adoption, ranging from various business models to factors such as trust and usability, as well as policy considerations. We hope that this review will stimulate cross-arena communication and co-creation of sensors and ultimately result in the development of fit-for-purpose sensors.
Supplementary Materials
The following supporting information can be downloaded at: https://www.mdpi.com/article/10.3390/agriculture16010089/s1. References [85,86] are cited in the Supplementary Materials.
Author Contributions
Conceptualization, Writing—review and editing E.S., F.I., J.H.G., L.K., S.U. and A.R.; Writing—original draft preparation, E.S., J.H.G., L.K. and A.R.; Funding acquisition, A.R. All authors have read and agreed to the published version of the manuscript.
Funding
A.R. and J.H.G.’s contributions to this work were supported by the Innovate UK–funded project TRUST [grant number 10137684].
Institutional Review Board Statement
Not applicable.
Informed Consent Statement
Not applicable.
Data Availability Statement
No new data were created or analyzed in this study. Data sharing is not applicable to this article.
Conflicts of Interest
The authors declare no conflicts of interest.
References
- Ingram, J.; Maye, D.; Bailye, C.; Barnes, A.; Bear, C.; Bell, M.; Cutress, D.; Davies, L.; de Boon, A.; Dinnie, L.; et al. What Are the Priority Research Questions for Digital Agriculture? Land Use Policy 2022, 114, 105962. [Google Scholar] [CrossRef]
- Osrof, H.Y.; Tan, C.L.; Angappa, G.; Yeo, S.F.; Tan, K.H. Adoption of Smart Farming Technologies in Field Operations: A Systematic Review and Future Research Agenda. Technol. Soc. 2023, 75, 102400. [Google Scholar] [CrossRef]
- Adamchuk, V.I.; Hummel, J.W.; Morgan, M.T.; Upadhyaya, S.K. On-the-Go Soil Sensors for Precision Agriculture. Comput. Electron. Agric. 2004, 44, 71–91. [Google Scholar] [CrossRef]
- Pal, A.; Dubey, S.K.; Goel, S.; Kalita, P.K. Portable Sensors in Precision Agriculture: Assessing Advances and Challenges in Soil Nutrient Determination. TrAC Trends Anal. Chem. 2024, 180, 117981. [Google Scholar] [CrossRef]
- Zhang, N.; Wang, M.; Wang, N. Precision Agriculture—A Worldwide Overview. Comput. Electron. Agric. 2002, 36, 113–132. [Google Scholar] [CrossRef]
- Raun, W.R.; Johnson, G.V.; Sembiring, H.; Lukina, E.V.; LaRuffa, J.M.; Thomason, W.E.; Phillips, S.B.; Solie, J.B.; Stone, M.L.; Whitney, R.W. Indirect Measures of Plant Nutrients. Commun. Soil Sci. Plant Anal. 1998, 29, 1571–1581. [Google Scholar] [CrossRef]
- De Marco, R.; Clarke, G.; Pejcic, B. Ion-Selective Electrode Potentiometry in Environmental Analysis. Electroanalysis 2007, 19, 1987–2001. [Google Scholar] [CrossRef]
- Radu, A.; Radu, T.; Mcgraw, C.; Dillingham, P.; Anastasova-Ivanova, S.; Diamond, D. Ion Selective Electrodes in Environmental Analysis. J. Serbian Chem. Soc. 2013, 78, 1729–1761. [Google Scholar] [CrossRef]
- Bezuidenhout, P.; Smith, S.; Joubert, T.-H. A Low-Cost Inkjet-Printed Paper-Based Potentiostat. Appl. Sci. 2018, 8, 968. [Google Scholar] [CrossRef]
- Pruna, R.; Palacio, F.; Baraket, A.; Zine, N.; Streklas, A.; Bausells, J.; Errachid, A.; López, M. A Low-Cost and Miniaturized Potentiostat for Sensing of Biomolecular Species Such as TNF-α by Electrochemical Impedance Spectroscopy. Biosens. Bioelectron. 2018, 100, 533–540. [Google Scholar] [CrossRef]
- Shaw, R.; Williams, A.P.; Miller, A.; Jones, D.L. Assessing the Potential for Ion Selective Electrodes and Dual Wavelength UV Spectroscopy as a Rapid On-Farm Measurement of Soil Nitrate Concentration. Agriculture 2013, 3, 327–341. [Google Scholar] [CrossRef]
- Zhai, J.; Duan, S.; Luo, B.; Jin, X.; Dong, H.; Wang, X. Classification Techniques of Ion Selective Electrode Arrays in Agriculture: A Review. Anal. Methods 2024, 16, 8068–8079. [Google Scholar] [CrossRef] [PubMed]
- Mazur, F.; Han, Z.; Tjandra, A.D.; Chandrawati, R. Digitalization of Colorimetric Sensor Technologies for Food Safety. Adv. Mater. 2024, 36, 2404274. [Google Scholar] [CrossRef] [PubMed]
- De Paula Albuquerque, J.R.; Nascimento Makara, C.; Guimarães Ferreira, V.; Canniatti Brazaca, L.; Carrilho, E. Low-Cost Precision Agriculture for Sustainable Farming Using Paper-Based Analytical Devices. RSC Adv. 2024, 14, 23392–23403. [Google Scholar] [CrossRef] [PubMed]
- Villanueva, M.; Vega-Chacón, J.; Picasso, G. Design of a Portable RGB Colorimetric Detection Device Using Nano-Optodes and a Raspberry Pi Platform for the Reversible Quantification of Potassium in Peruvian Agricultural Soil Samples. Microchem. J. 2025, 215, 114205. [Google Scholar] [CrossRef]
- Alberti, G.; Zanoni, C.; Magnaghi, L.R.; Biesuz, R. Disposable and Low-Cost Colorimetric Sensors for Environmental Analysis. Int. J. Environ. Res. Public Health 2020, 17, 8331. [Google Scholar] [CrossRef]
- Luka, G.S.; Nowak, E.; Kawchuk, J.; Hoorfar, M.; Najjaran, H. Portable Device for the Detection of Colorimetric Assays. R. Soc. Open Sci. 2017, 4, 171025. [Google Scholar] [CrossRef]
- Dermawan, R.; Susila, A.D.; Purwono, P.; Nugroho, B.; Faried, M. Assessing Five Different Soil Nutrient Extraction Techniques on Cambisols for a Practical Evaluation of Potassium and Phosphorus Availability in Chili Cultivation. Soil Sci. Ann. 2024, 75, 1–6. [Google Scholar] [CrossRef]
- Zia, M.S.; Rahmatullah, M.S.; Ali, A. Potassium Release from Soil Clays by Diammonium Phosphate, Ammonium Bicarbonate and Ammonium Chloride. J. Agron. Crop Sci. 1998, 180, 33–37. [Google Scholar] [CrossRef]
- Zebec, V.; Rastija, D.; Lončarić, Z.; Bensa, A.; Popović, B.; Ivezić, V. Comparison of Chemical Extraction Methods for Determination of Soil Potassium in Different Soil Types. Eurasian Soil Sc. 2017, 50, 1420–1427. [Google Scholar] [CrossRef]
- Moreira, A.J.; Freschi, C.D.; Pereira, E.C.; Freschi, G.P.G. N-Compounds Speciation Analysis in Environmental Samples Using Ultrasound-Assisted Solid–Liquid Extraction and Non-Chromatographic Techniques. Env. Monit Assess 2021, 193, 297. [Google Scholar] [CrossRef] [PubMed]
- Pontes, F.V.M.; Carneiro, M.C.; Vaitsman, D.S.; Monteiro, M.I.C.; da Silva, L.I.D.; de Souza, E.d.M.F.; Neto, A.A. Fast and Simultaneous Ultrasound-Assisted Extraction of Exchangeable-NH4+, NO3− and NO2− Species from Soils Followed by Ion Chromatography Determination. Chem. Speciat. Bioavailab. 2012, 24, 227–233. [Google Scholar] [CrossRef]
- Guo, Y.; Saiz, E.; Radu, A.; Sonkusale, S.; Ullah, S. A New Fibre Microfluidic Soil Pore Water Sampling Device for NH4+-N Sensing Using Ion-Selective Electrode Sensors (ISEs). Farming Syst. 2025, 3, 100142. [Google Scholar] [CrossRef]
- Huang, J.; Franklin, H.; Teasdale, P.R.; Burford, M.A.; Kankanamge, N.R.; Bennett, W.W.; Welsh, D.T. Comparison of DET, DGT and Conventional Porewater Extractions for Determining Nutrient Profiles and Cycling in Stream Sediments. Environ. Sci. Process. Impacts 2019, 21, 2128–2140. [Google Scholar] [CrossRef] [PubMed]
- Shaw, R.; Lark, R.M.; Williams, A.P.; Chadwick, D.R.; Jones, D.L. Characterising the Within-Field Scale Spatial Variation of Nitrogen in a Grassland Soil to Inform the Efficient Design of in-Situ Nitrogen Sensor Networks for Precision Agriculture. Agric. Ecosyst. Environ. 2016, 230, 294–306. [Google Scholar] [CrossRef]
- Akyazi, T.; Basabe-Desmonts, L.; Benito-Lopez, F. Review on Microfluidic Paper-Based Analytical Devices towards Commercialisation. Anal. Chim. Acta 2018, 1001, 1–17. [Google Scholar] [CrossRef]
- Bobacka, J. Conducting Polymer-Based Solid-State Ion-Selective Electrodes. Electroanalysis 2006, 18, 7–18. [Google Scholar] [CrossRef]
- Hu, J.; Ho, K.T.; Zou, X.U.; Smyrl, W.H.; Stein, A.; Bühlmann, P. All-Solid-State Reference Electrodes Based on Colloid-Imprinted Mesoporous Carbon and Their Application in Disposable Paper-Based Potentiometric Sensing Devices. Anal. Chem. 2015, 87, 2981–2987. [Google Scholar] [CrossRef]
- Anastasova, S.; Radu, A.; Matzeu, G.; Zuliani, C.; Mattinen, U.; Bobacka, J.; Diamond, D. Disposable Solid-Contact Ion-Selective Electrodes for Environmental Monitoring of Lead with Ppb Limit-of-Detection. Electrochim. Acta 2012, 73, 93–97. [Google Scholar] [CrossRef]
- Grygolowicz-Pawlak, E.; Bakker, E. Thin Layer Coulometry with Ionophore Based Ion-Selective Membranes. Anal. Chem. 2010, 82, 4537–4542. [Google Scholar] [CrossRef]
- Bakker, E. Can Calibration-Free Sensors Be Realized? ACS Sens 2016, 1, 838–841. [Google Scholar] [CrossRef]
- Kareem, F.; Kurup, C.P.; Ahmed, M.U. Nanocellulose-Based Low-Cost Chemical Sensors for Healthcare Monitoring. 2024. Available online: https://books.rsc.org/books/edited-volume/2251/chapter-abstract/8217889/Nanocellulose-based-Low-cost-Chemical-Sensors-for?redirectedFrom=fulltext (accessed on 28 August 2025).
- Stefano, J.S.; Orzari, L.O.; Silva-Neto, H.A.; de Ataíde, V.N.; Mendes, L.F.; Coltro, W.K.T.; Longo Cesar Paixão, T.R.; Janegitz, B.C. Different Approaches for Fabrication of Low-Cost Electrochemical Sensors. Curr. Opin. Electrochem. 2022, 32, 100893. [Google Scholar] [CrossRef]
- Barnes, A.P.; Soto, I.; Eory, V.; Beck, B.; Balafoutis, A.; Sánchez, B.; Vangeyte, J.; Fountas, S.; van der Wal, T.; Gómez-Barbero, M. Exploring the Adoption of Precision Agricultural Technologies: A Cross Regional Study of EU Farmers. Land Use Policy 2019, 80, 163–174. [Google Scholar] [CrossRef]
- Mokari, A.; Guo, S.; Bocklitz, T. Exploring the Steps of Infrared (IR) Spectral Analysis: Pre-Processing, (Classical) Data Modelling, and Deep Learning. Molecules 2023, 28, 6886. [Google Scholar] [CrossRef]
- Mishra, P.; Passos, D.; Marini, F.; Xu, J.; Amigo, J.M.; Gowen, A.A.; Jansen, J.J.; Biancolillo, A.; Roger, J.M.; Rutledge, D.N.; et al. Deep Learning for Near-Infrared Spectral Data Modelling: Hypes and Benefits. TrAC Trends Anal. Chem. 2022, 157, 116804. [Google Scholar] [CrossRef]
- Zhou, P.; Zhang, Y.; Yang, W.; Li, M.; Liu, Z.; Liu, X. Development and Performance Test of an In-Situ Soil Total Nitrogen-Soil Moisture Detector Based on near-Infrared Spectroscopy. Comput. Electron. Agric. 2019, 160, 51–58. [Google Scholar] [CrossRef]
- Application of Hyperspectral Technology Combined with Genetic Algorithm to Optimize Convolution Long- and Short-Memory Hybrid Neural Network Model in Soil Moisture and Organic Matter. Available online: https://www.mdpi.com/2076-3417/12/20/10333 (accessed on 28 August 2025).
- Khan, M.J.; Khan, H.S.; Yousaf, A.; Khurshid, K.; Abbas, A. Modern Trends in Hyperspectral Image Analysis: A Review. IEEE Access 2018, 6, 14118–14129. [Google Scholar] [CrossRef]
- Predicting Spatial Variations in Soil Nutrients with Hyperspectral Remote Sensing at Regional Scale. Available online: https://www.mdpi.com/1424-8220/18/9/3086 (accessed on 28 August 2025).
- Ghamisi, P.; Yokoya, N.; Li, J.; Liao, W.; Liu, S.; Plaza, J.; Rasti, B.; Plaza, A. Advances in Hyperspectral Image and Signal Processing: A Comprehensive Overview of the State of the Art. IEEE Geosci. Remote Sens. Mag. 2017, 5, 37–78. [Google Scholar] [CrossRef]
- Ghasemi, N.; Justo, J.A.; Celesti, M.; Despoisse, L.; Nieke, J. Onboard Processing of Hyperspectral Imagery: Deep Learning Advancements, Methodologies, Challenges, and Emerging Trends. IEEE J. Sel. Top. Appl. Earth Obs. Remote Sens. 2025, 18, 4780–4790. [Google Scholar] [CrossRef]
- Bourriz, M.; Hajji, H.; Laamrani, A.; Elbouanani, N.; Abdelali, H.A.; Bourzeix, F.; El-Battay, A.; Amazirh, A.; Chehbouni, A. Integration of Hyperspectral Imaging and AI Techniques for Crop Type Mapping: Present Status, Trends, and Challenges. Remote Sens. 2025, 17, 1574. [Google Scholar] [CrossRef]
- Soil Health—Guide for Educators 2014. Available online: https://www.nrcs.usda.gov/conservation-basics/natural-resource-concerns/soil/soil-health/soil-health-educators-guide (accessed on 28 August 2025).
- Province of British Columbia. Understanding Different Soil Test Methods; 631.500-9; Province of British Columbia: Canada, British Columbia, 2010. Available online: https://www2.gov.bc.ca/gov/search?id=2E4C7D6BCAA4470AAAD2DCADF662E6A0&q=631.500-9&tab=3 (accessed on 29 August 2025).
- The Importance of Sampling Depth for Soil Health Assessment—Oklahoma State University. Available online: https://extension.okstate.edu/fact-sheets/the-importance-of-sampling-depth-for-soil-health-assessment.html (accessed on 29 August 2025).
- McFadden, J.; Casalini, F.; Griffin, T.; Anton, J. The Digitalisation of Agriculture: A Literature Review and Emerging Policy Issues; OECD Food, Agriculture and Fisheries Papers: Paris, France, 2022; Volume 176. [Google Scholar]
- Jochinke, D.C.; Noonon, B.J.; Wachsmann, N.G.; Norton, R.M. The Adoption of Precision Agriculture in an Australian Broadacre Cropping System—Challenges and Opportunities. Field Crops Res. 2007, 104, 68–76. [Google Scholar] [CrossRef]
- Pandeya, S.; Gyawali, B.R.; Upadhaya, S. Factors Influencing Precision Agriculture Technology Adoption Among Small-Scale Farmers in Kentucky and Their Implications for Policy and Practice. Agriculture 2025, 15, 177. [Google Scholar] [CrossRef]
- Rose, D.; Parker, C.; Fodey, J.; Park, C.; Sutherland, W.; Dicks, L. Involving Stakeholders in Agricultural Decision Support Systems: Improving User-Centered Design. Int. J. Agric. Manag. 2017, 6, 80. [Google Scholar]
- Agtech: Breaking down the Farmer Adoption Dilemma | McKinsey. Available online: https://www.mckinsey.com/industries/agriculture/our-insights/agtech-breaking-down-the-farmer-adoption-dilemma (accessed on 19 September 2025).
- Grant, J.H.; Scharpenberg, D.; Manning, L. Algorithm Aversion in Agricultural Decision-Making: Trust Dynamics, Barriers, and Fertiliser-Related Decision Support. Agric. Syst. 2026, 233, 104630. [Google Scholar] [CrossRef]
- Davis, F.D. Perceived Usefulness, Perceived Ease of Use, and User Acceptance of Information Technology. MIS Q. 1989, 13, 319. [Google Scholar] [CrossRef]
- Venkatesh, V.; Morris, M.G.; Davis, G.B.; Davis, F.D. User Acceptance of Information Technology: Toward a Unified View. MIS Q. 2003, 27, 425. [Google Scholar] [CrossRef]
- Ingram, J.; Maye, D. What Are the Implications of Digitalisation for Agricultural Knowledge? Front. Sustain. Food Syst. 2020, 4, 66. [Google Scholar] [CrossRef]
- McCaig, M.; Dara, R.; Rezania, D. Farmer-Centric Design Thinking Principles for Smart Farming Technologies. Internet Things 2023, 23, 100898. [Google Scholar] [CrossRef]
- Yeo, M.L.; Keske, C.M. From Profitability to Trust: Factors Shaping Digital Agriculture Adoption. Front. Sustain. Food Syst. 2024, 8, 1456991. [Google Scholar] [CrossRef]
- Aubert, B.A.; Schroeder, A.; Grimaudo, J. IT as Enabler of Sustainable Farming: An Empirical Analysis of Farmers’ Adoption Decision of Precision Agriculture Technology. Decis. Support Syst. 2012, 54, 510–520. [Google Scholar] [CrossRef]
- European Parliament; Directorate General for Parliamentary Research Services. Precision Agriculture and the Future of Farming in Europe: Scientific Foresight Study; Publications Office: Luxembourg, 2016. [Google Scholar]
- Grains Research and Development Corporation. Adoption of Precision Agriculture-Related Practices: Status, Opportunities and the Role of Farm Advisers; Grains Research and Development Corporation: Canberra, Australia, 2014. Available online: https://grdc.com.au/resources-and-publications/all-publications/publications/2014/12/adoption-of-precision-agriculture-related-practices (accessed on 19 September 2025).
- Paustian, M.; Theuvsen, L. Adoption of Precision Agriculture Technologies by German Crop Farmers. Precis. Agric 2017, 18, 701–716. [Google Scholar] [CrossRef]
- Steele, D. Analysis of Precision Agriculture Adoption & Barriers in Western Canada; Agriculture and Agri-Food Canada: Ottawa, ON, Canada, 2017. [Google Scholar]
- Hellerstein, D.; Vilorio, D. Agricultural Resources and Environmental Indicators, 2019; EIB-208; United States Department of Agriculture: Washington, DC, USA, 2019. [Google Scholar] [CrossRef]
- Agricultural Internet of Things and Decision Support for Precision Smart Farming; Elsevier: Amsterdam, The Netherlands, 2020; ISBN 978-0-12-818373-1.
- Tey, Y.S.; Brindal, M. A Meta-Analysis of Factors Driving the Adoption of Precision Agriculture. Precis. Agric 2022, 23, 353–372. [Google Scholar] [CrossRef]
- Manzoor, F.; Wei, L.; Siraj, M.; Lu, X.; Qiyang, G. Digital Agriculture Technology Adoption in Low and Middle-Income Countries—A Review of Contemporary Literature. Front. Sustain. Food Syst. 2025, 9, 1621851. [Google Scholar] [CrossRef]
- Cyril, A.O.; Ujah, C.O.; Ekwueme, B.N.; Asadu, C.O. Photovoltaic Mini-Grid Incorporation: The Panacea for Electricity Crisis in Sub-Saharan Africa. Unconv. Resour. 2024, 4, 100079. [Google Scholar] [CrossRef]
- Hassani, S.; Dackermann, U. A Systematic Review of Advanced Sensor Technologies for Non-Destructive Testing and Structural Health Monitoring. Sensors 2023, 23, 2204. [Google Scholar] [CrossRef]
- Fu, L.; Zhang, H. Analysis of Factors Influencing Small-Scale Agricultural Product Prices from the Perspective of the Online Public—A Case Study of China. Front. Sustain. Food Syst. 2024, 8, 1355853. [Google Scholar] [CrossRef]
- Gamage, A.; Gangahagedara, R.; Subasinghe, S.; Gamage, J.; Guruge, C.; Senaratne, S.; Randika, T.; Rathnayake, C.; Hameed, Z.; Madhujith, T.; et al. Advancing Sustainability: The Impact of Emerging Technologies in Agriculture. Curr. Plant Biol. 2024, 40, 100420. [Google Scholar] [CrossRef]
- Nxumalo, G.S.; Chauke, H. Challenges and Opportunities in Smallholder Agriculture Digitization in South Africa. Front. Sustain. Food Syst. 2025, 9, 1583224. [Google Scholar] [CrossRef]
- Cantele, S.; Moggi, S.; Campedelli, B. Spreading Sustainability Innovation through the Co-Evolution of Sustainable Business Models and Partnerships. Sustainability 2020, 12, 1190. [Google Scholar] [CrossRef]
- Kerstens, A.; Langley, D.J. An Innovation Intermediary’s Role in Enhancing Absorptive Capacity for Cross-Industry Digital Innovation: Introducing an Awareness Capability and New Intermediary Practices. J. Bus. Res. 2025, 196, 115426. [Google Scholar] [CrossRef]
- Osumba, J.J.L.; Recha, J.W.; Oroma, G.W. Transforming Agricultural Extension Service Delivery through Innovative Bottom–Up Climate-Resilient Agribusiness Farmer Field Schools. Sustainability 2021, 13, 3938. [Google Scholar] [CrossRef]
- Jung, J.; You, J.; Kim, D. Effective but Sustainable? A Case of a Digital Literacy Program for Older Adults. Educ. Inf. Technol. 2025, 30, 13309–13330. [Google Scholar] [CrossRef]
- Olugbenga, Y.E.; Bamire, A.S.; Kehinde, A.D.; Ojo, T.O.; Ogundeji, A.A. Impact of Perceptions of Climate Variability on Investment Decisions Pattern among Smallholder Rice Farmers in Nigeria. Environ. Sustain. Indic. 2025, 27, 100721. [Google Scholar] [CrossRef]
- Manning, L. Innovating in an Uncertain World: Understanding the Social, Technical and Systemic Barriers to Farmers Adopting New Technologies. Challenges 2024, 15, 32. [Google Scholar] [CrossRef]
- Zhang, X. Frugal Innovation and the Digital Divide: Developing an Extended Model of the Diffusion of Innovations. Int. J. Innov. Stud. 2018, 2, 53–64. [Google Scholar] [CrossRef]
- Ozmen Garibay, O.; Winslow, B.; Andolina, S.; Antona, M.; Bodenschatz, A.; Coursaris, C.; Falco, G.; Fiore, S.M.; Garibay, I.; Grieman, K.; et al. Six Human-Centered Artificial Intelligence Grand Challenges. Int. J. Hum.-Comput. Interact. 2023, 39, 391–437. [Google Scholar] [CrossRef]
- Manning, L.; Grant, J.H. Place-Based Impact: Accelerating Agri-Technology Adoption in an Evolving ‘Place’. Sustainability 2025, 17, 631376. [Google Scholar] [CrossRef]
- Daramola, D.A.; Hatzell, M.C. Energy Demand of Nitrogen and Phosphorus Based Fertilizers and Approaches to Circularity. ACS Energy Lett. 2023, 8, 1493–1501. [Google Scholar] [CrossRef]
- Sutton, M.A.; UNEP (Eds.) Our Nutrient World: The Challenge to Produce More Food and Energy with Less Pollution; Global Overview on Nutrient Management; Centre for Ecology & Hydrology: Edinburgh, UK, 2013; ISBN 978-1-906698-40-9. [Google Scholar]
- Miao, C.; Zeller, V. Nutrient Circularity from Waste to Fertilizer: A Perspective from LCA Studies. Sci. Total Environ. 2025, 965, 178623. [Google Scholar] [CrossRef]
- Luna Juncal, M.J.; Masino, P.; Bertone, E.; Stewart, R.A. Towards Nutrient Neutrality: A Review of Agricultural Runoff Mitigation Strategies and the Development of a Decision-Making Framework. Sci. Total Environ. 2023, 874, 162408. [Google Scholar] [CrossRef]
- Fertiliser Usage on Farm, England 2022/23—Statistics Notice. GOV.UK. Available online: https://www.gov.uk/government/statistics/fertiliser-usage-on-farm-england/fertiliser-usage-on-farm-england-202223-statistics-notice (accessed on 1 December 2025).
- Wang, L.; Fu, Q.; Zhu, R.; Liu, N.; Shi, H.; Liu, Z.; Li, Y.; Jiang, H. Research on High Precision Localization of Space Target with Multi-Sensor Association. Opt. Lasers Eng. 2025, 184, 108553. [Google Scholar] [CrossRef]
Disclaimer/Publisher’s Note: The statements, opinions and data contained in all publications are solely those of the individual author(s) and contributor(s) and not of MDPI and/or the editor(s). MDPI and/or the editor(s) disclaim responsibility for any injury to people or property resulting from any ideas, methods, instructions or products referred to in the content. |
© 2025 by the authors. Licensee MDPI, Basel, Switzerland. This article is an open access article distributed under the terms and conditions of the Creative Commons Attribution (CC BY) license.