Abstract
The Gravity Recovery and Climate Experiment (GRACE) tracks drought events by detecting changes in the global gravitational field and capturing abnormal information on the reserves of surface water, soil water, and groundwater, which makes it possible for a more comprehensive and unified global and regional monitoring of groundwater drought. This study adopted the gravity satellite GRACE data and combined it with the hydrological model dataset. Additionally, we assessed the temporal evolution and spatial pattern of groundwater drought in the Yangtze River Basin (YRB) and its sub-basins from 2003 to 2022, determined the change points of the hidden seasonal and trend components in groundwater drought, and identified the direct/indirect driving contributions of the main climatic and circulation factors to groundwater drought. The results show that (1) as a normalized index, the groundwater drought index (GDI) can reflect direct evidence of any surplus and deficit in groundwater availability. During the study period, the minimum value (−1.66) of the GDI occurred in July 2020 (severe drought). (2) The average value of GDI in the entire basin ranged from −1.66 (severe drought) to 0.52 (no drought). (3) The average Zs values (Mann–Kendall Z-statistic) of GDI were −0.23, −0.16, −0.43, and 0.14, respectively, and the proportions of areas with aggravated drought reached 65.21%, 61.05%, 89.70% and 43.67%, respectively. (4) Partial wavelet coherence analysis can simultaneously reveal the local correlations of time series at different time scales and frequencies. Based on partial wavelet analysis, precipitation was the best factor for explaining the dynamic changes in groundwater drought. (5) The North Pacific Index (NPI), the Pacific/North American Index (PNA), and the Sunspot Index (SSI) can serve as the main predictors that can effectively capture the drought changes in groundwater in the YRB. The GRACE satellite can provide a new tool for monitoring, tracking, and assessing groundwater drought situations, which is of great significance for guiding the development of the drought early warning system in the YRB and effectively preventing and responding to drought disasters.
1. Introduction
Drought is an extreme climate state with a wide range of influence, strong destructiveness, and long duration, which is easy to overlook due to its undetectable nature, causing serious harm to agricultural production activities and economic growth [1,2,3,4,5,6]. Generally speaking, drought is a phenomenon of water deficiency caused by abnormally low precipitation in an area over a period of time or under the climatic background of high temperature and little rainfall. Regional climate and underlying surface changes have accelerated, and the accelerated hydrological cycle has further altered the redistribution of water resources in the spatio-temporal pattern [7,8,9]. Meanwhile, the increasingly severe problems such as population growth, urban expansion, economic scale expansion, and greenhouse gas emissions indicate that the impact range of drought will further expand in the future [10,11]. The phenomenon where the groundwater level continuously drops is called groundwater drought [12,13,14]. Since the occurrence of groundwater drought is usually undetected, by the time it happens, it often has already caused greater damage. Groundwater drought, as a special type of hydrological drought, not only affects economic development but also brings surface subsidence and deterioration of groundwater quality, thereby affecting water supply and agricultural irrigation [15,16]. Since traditional groundwater drought monitoring is based on well observation data, this monitoring method is costly and has a small scope, and is greatly limited in large-scale studies [17]. With the continuous development and improvement of remote sensing for earth observation, remote sensing data have become important materials used for drought diagnosis [18,19]. Using satellite data for drought detection can effectively make up for the limitations of ground observation stations, and achieve continuous observation of drought and monitoring of the change process in time and space [20,21,22,23]. By using the drought index calculated from satellite remote sensing data, spatial detail information can be accurately obtained, thus taking the lead in drought monitoring at the regional scale [2,24,25].
Remote sensing technology can efficiently monitor soil moisture and vegetation status over a large area to achieve the best monitoring effect [26,27]. The terrestrial water storage based on the Gravity Recovery and Climate Experiment (GRACE) satellite is the vertically integrated aquifer water storage component [28]. The GRACE satellite, a collaboration between NASA and the German Aerospace Center, was capable of monitoring and providing global grid-by-grid monthly time-varying gravitational field variations [29,30,31]. By precisely measuring the changes in the Earth’s gravitational field, this satellite can reverse the changes in terrestrial water storage, thus providing a new means for the assessment of groundwater drought [18,32,33]. The GRACE satellite obtains the changes in the Earth’s mass, and such changes are caused by hydrological processes on the Earth’s surface and the temporal and spatial distribution of water volume changing within a short period of time [17,22,34]. Therefore, the gravitational field variations provided by GRACE data can invert the changes in large-scale terrestrial water storage, which has been verified by many scholars and widely applied [19,20]. Since 2002, by estimating terrestrial water reserves, GRACE/GRACE Follow-On (GRACE-FO) played a significant role in representing surface water and groundwater related to water redistribution in the Earth system [35,36,37]. GRACE-FO is the successor mission of the GRACE satellite, equipped with a laser ranging interferometer, which also consists of two identical satellites about 220 km apart and flying along the same orbit. However, GRACE-FO employs a more advanced optical system and has higher measurement accuracy. It is expected to increase the ranging accuracy between satellites by 20 times, thereby providing information on terrestrial water storage with higher inversion accuracy and higher spatiotemporal resolution [38,39,40].
Extreme drought events at the basin scale are more frequent worldwide. As the largest river in Asia, the Yangtze River is affected by the pattern of drought and flood changes combined with global climate change [6,41,42,43,44]. Droughts in the Yangtze River Basin (YRB) are characterized by multiple types with multiple transmission chains. These drought types show significant differences in temporal and spatial latitudes, and their transmission mechanisms at the pixel scale are extremely complex. Spatial compound droughts in large areas such as the YRB have exerted greater pressure on available water resources and have had chain effects from the mountainous areas upstream to the estuaries downstream [45,46,47,48]. Zhang et al. analyzed the recovery time and spatio-temporal characteristics of hydrological droughts in the YRB, and the results showed that 29 hydrological droughts occurred from 1979 to 2012 [49]. Huang et al. further explored the drought recovery patterns and the recovery models of different severity levels of drought (extreme, severe, moderate, and mild drought) within the YRB [50]. They found that different vegetation types have varying demands for drought recovery. For instance, forests need nearly normal precipitation to fully recover, while grasslands only require about 50% of the long-term average precipitation. Cao et al. evaluated the resilience of the agricultural ecosystem in the YRB during the drought in 2022, pointing out that the rice output decreased by approximately 30% and the agricultural economic loss was about 5 billion yuan [51]. Ma et al. calculated the terrestrial water storage anomalies in the YRB from 2003 to 2016, and combined with the water storage deficit index to identify the drought events characteristics [52]. It was found that a severe drought occurred from May 2006 to August 2007, and the severity of the drought was positively correlated with the topography.
To sum up, as an important pillar region of China’s economy, the YRB has complex and variable climatic conditions [53]. GRACE satellite data has an advantage in drought research in the YRB. Although previous studies have identified the change points in drought, there is still a lack of systematic investigation on the nonlinear driving mechanisms and nonlinear characteristics of these changes. Bayesian Estimator of Abrupt Seasonal and Trend Change (BEAST) can be used for change point detection, nonlinear trend analysis, decomposition, and segmentation of time series. Compared with standard change-point methods (e.g., Pettitt test), the main advantage of BEAST is that it can provide the probability distribution graph of sudden change points. Furthermore, although the influence of a single teleconnection factor has been studied in the YRB, there is insufficient investigation on the conjoint effects and nonlinear coupling relationships between multiple teleconnection factors.
2. Materials and Methodologies
2.1. Overview of the Research Area
The mainstream of the Yangtze River is approximately 6300 km, with an annual water resource of 995.9 billion cubic meters, accounting for about 36% of the total water volume in the country [53]. The annual average temperature in the YRB is higher in the east/south and lower in the west/north, with a multi-year mean temperature remaining at 12 °C. The basin is vast in area, complex in terrain, and dominated by a monsoon climate. Due to the combined effect of the distribution characteristics of temperature, rainfall, and evaporation, the YRB is highly prone to drought events. Extreme droughts attack the production and life of the basin and restrict its safe and healthy development. As shown in Figure 1, the YRB is divided into 9 secondary basin zones, namely the HanJiang Water System (HJWS), the Main Stream of the Yangtze Water System (MSWS), and the Tai Lake Water System (TLWS), Poyang Lake Water System (PLWS), Dongting Lake Water System (DLWS), Wujiang Water System (WJWS), Jialing Water System (JLWS), Minjiang Water System (MJWS), and Yalong Water System (YLWS).
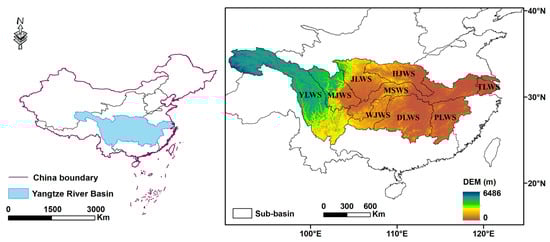
Figure 1.
The location and elevation distribution of the YRB.
2.2. Dataset
2.2.1. GRACE Satellite
The GRACE satellite was jointly produced by NASA and the German Space Agency, and was successfully launched in March 2002 [30,32]. After inversion, global time-varying gravitational field data can be obtained. The gravity satellite generates a set of data every 30 days, which is then processed by three official data centers, and the related results are released. The data products provided by different institutional centers have different applicable scopes. Currently, the latest product of the GRACE dataset is the RL06 mascon model, and the RL06 mascon model was adopted because the resolution of the data product can reach 0.25°. Mascon technology not only enhances resolution and reduces errors, but also better retains spatiotemporal information. The lunar gravity field model calculated from the GRACE satellite observation data has achieved quite high accuracy. The adoption of the GRACE earth gravity field model can eliminate the changes caused by crustal materials, atmosphere, ocean currents, and tides, and then be used to measure and estimate terrestrial hydrological signals, and obtain data on large-scale terrestrial water storage and its changes [36]. For missing data caused by the GRACE/GRACE-FO transition in 2017–2018, linear interpolation is applied to fill in the missing data.
2.2.2. GLDAS Land Surface Process Model
GLDAS is a high-resolution land simulation system that contains various land surface field information (precipitation, soil moisture, runoff, evapotranspiration, temperature, vegetation canopy water) existing in the form of grid data. GLDAS was jointly developed by multiple departments, aiming to generate the optimal field of land surface conditions and fluxes by ingesting satellite and ground observation data [35,54]. After obtaining the data from the GLDAS Noah model, the required variables were extracted from the original data using MATLAB R2022a programming, and the research area data were trimmed in batches from the global grid data using Python 3.11.
2.2.3. Atmospheric Circulation Factors
Atmospheric circulation patterns play a fundamental role in shaping global climate and large-scale weather phenomena, providing a macroscopic background for the activities of weather systems at different spatiotemporal scales [3,55]. Drought events are closely related to abnormal atmospheric circulation and the mechanism of sea surface temperature changes. Abnormally high-pressure systems and subsidence movements can cause continuous insufficient precipitation, thereby leading to drought [56]. In this paper, we have selected ten commonly used atmospheric circulation factors to explore their influence on the abnormal drought in the YRB.
2.2.4. Digital Elevation Model
The digital elevation model (DEM) can dynamically represent the three-dimensional spatial undulation pattern of the Earth’s surface [4,35]. In terms of the application value of DEM, topographic analysis based on DEM can divide the secondary sub-basin units of the basin, extract the complex basin water system structure, and provide an effective topographic constraint condition for hydrological runoff simulation and identification of the spatial distribution law of groundwater drought [57]. In this paper, the accuracy of the DEM data is as high as 30 m, which can conform to the users’ demand for high-precision data.
2.3. Methodology
2.3.1. Construction Principle of Groundwater Drought Index
Terrestrial water storage anomalies (TWSA) mainly include groundwater storage anomalies (GWSA), soil moisture anomalies (SMSA), surface water anomalies (SWA), canopy water storage anomalies (CWSA), and snow water equivalent anomalies (SWEA) [22,35,58]. Therefore, the GWSA can be calculated by the following formula:
In the formula, SMSA, SWA, CWSA, and SWEA are, respectively, represented by soil moisture, surface water, plant canopy water, and snow water equivalent provided by the GLDAS model.
In the formula, Ci represents the average value of GWSA for the i-th month, GSD represents the net deviation of groundwater storage after deducting the monthly average value, GDIi,j represents the groundwater drought index GDI for the i-th year and j-th month, GSDi,j represents the net deviation of groundwater storage in the i-th year and j-th month, and and respectively represent the average and standard deviation of the groundwater reserves change GWSA in the j-th month. The classification criteria for GDI are shown in Table 1.

Table 1.
Classification standards of GDI.
2.3.2. Bayesian Estimator of Abrupt Seasonal and Trend Change (BEAST)
The basic principle of the BEAST algorithm is based on the idea of Bayesian statistics. It establishes a probability model, infers parameters by using the Bayesian theorem, and obtains the posterior distribution of parameters through random sampling of the parameter space [59]. The core of BEAST lies in its flexibility and adaptability, which can run on various types of data and adaptively learn the model parameters of different components. Meanwhile, without the need for users to specify the number of trend or seasonal change points, the model performs automatic detection. Furthermore, Bayesian uncertainty estimation can provide confidence intervals of change points, quantitatively analyze uncertainties, and be applicable to the coexistence of trend and seasonal change points [60,61]. For the Bayesian framework parameters, the prior, sampling iteration, and burn-in period are set to Gaussian, 10,000 times, and 2000 times, respectively.
2.3.3. Gridded Mann–Kendall Trend Test Method (GMK)
As a non-parametric statistical method widely used in the trend detection of meteorological data, the Mann–Kendall test is applicable to numerous data sequences with non-normal distributions and outliers, and can analyze the long-term changing trends of meteorological variables such as precipitation, temperature, and wind speed. In this paper, the Gridded Mann–Kendall trend test (GMK) is selected, using pre-whitening to handle autocorrelation in time series. By comparing the size relationship of data points before and after in the time series, the statistic S is constructed for determining the direction of the trend [4,8,35]. At the spatial dimension level, GMK applies the trend test process to each pixel of the spatial grid data one by one to identify whether a single pixel has a significant upward/downward trend in the studied temporal dimension. We use the False Discovery Rate (FDR) correction method with a significance level set to α = 0.05. FDR correction controls for false positive rates while maintaining high statistical power, making it suitable for multiple testing problems in spatial grid data.
2.3.4. Wavelet Coherence Analysis
Wavelet coherence is a frequency-domain analysis technique that can determine the interrelationship of the periodic variation trends of two time series. By calculating the coherence between signals after wavelet transform, wavelet coherence can provide more information about the variability of data sequences in signal frequency and time, and has obvious advantages when analyzing non-stationary signals and multi-scale data [62,63]. This paper utilizes wavelet coherence to explain the roles of climatic factors on drought. The calculation of wavelet coherence mainly includes three basic steps: (1) perform a wavelet transform on the two analyzed time series; (2) calculate the wavelet coherence functions of the two signals and determine the wavelet coherence degree; (3) for the calculated wavelet coherence, conduct significance tests to determine the interrelationship between the two signals at different frequencies. The specific calculation formula is as follows:
In the formula, represents the coherence coefficient, which varies between 0 and 1, and represents the cross-wavelet transform between two series. The smoothing operator S is defined as:
In the formula, represents smoothing along the wavelet scale axis and smoothing along the time scale axis.
The two indicators, average wavelet coherence coefficient (AWC) and the percentage of area significant coherence (PASC), are introduced to evaluate the explanatory power of each influencing factor for the response variable at different spatiotemporal scales. Among them, AWC is obtained by performing a global average calculation of the wavelet coherence analysis results in the time–frequency domain, while PASC is determined by statistically analyzing the proportion of significant coherence regions with a confidence level exceeding 95% in the total analysis region. We adopt the Morlet wavelet as the mother wavelet, which is one of the most commonly used complex wavelets in time-frequency analysis, with good time–frequency localization characteristics. Additionally, we use a Monte Carlo simulation for significance testing by generating 1000 red noise replacement sequences and calculating the significance level of each time-frequency point. The significance level is set at a 95% confidence level. We considered the cone-of-influence and edge effects, and excluded the cone region in the result analysis to avoid spurious correlations caused by edge effects.
2.3.5. SHAP Driver Identification Method
The rapid development of machine learning techniques such as support vector machines and extreme gradient boosting has provided new perspectives and methods for the analysis of influencing factors in hydro-meteorology [64]. The Shapley Additive explanations (SHAP) model can quantify the contribution of features to the model output, which can not only measure the contribution of the driving factors, but also identify the influence direction and interaction effect of the driving factors [65,66]. Therefore, the combination of XGBoost and SHAP models can not only precisely quantify the complex impact of driving factors on the occurrence of drought, but also quantify the specific contributions of different driving factors to the development of drought, providing a new tool for the comprehensive regulation and management of water resources in drought scenarios. In the SHAP model, the dataset splitting ratio is 70% train/30% test. For temporal cross-validation, we use a 5-fold rolling window validation (R2 = 0.82, RMSE = 0.14, and MAE = 0.12). Furthermore, we train the model using 10 different random seeds, and the averaged Spearman correlation coefficient for calculating feature importance is 0.92, indicating good stability of SHAP ranking. Under different hyperparameter configurations, the first 5 important features remain consistent.
3. Results
3.1. Time Series Decomposition of Groundwater Drought Based on Bayesian Algorithm
During 2003–2022, the multi-year average GWSA calculated based on the difference between GRACE and GLDAS was 2.89 mm, and the maximum value of GWSA occurred in April 2011 (54.69 mm), while the minimum value occurred in July 2020 (−73.19 mm) (Figure 2). From the average Ci of GWSA in each month, it could be known that Ci had a seasonal variation pattern, and the Ci values of the peak (February) and the trough (July) were 24.34 mm and −34.85 mm, respectively. For the net deviation GSD of groundwater reserves, the times when the maximum and minimum values occurred were consistent with GWSA, which were April 2011 (52.87 mm) and July 2020 (−74.99 mm), respectively. After calculation, the minimum value of GDI was −1.66, and this extreme value occurred in July 2020.
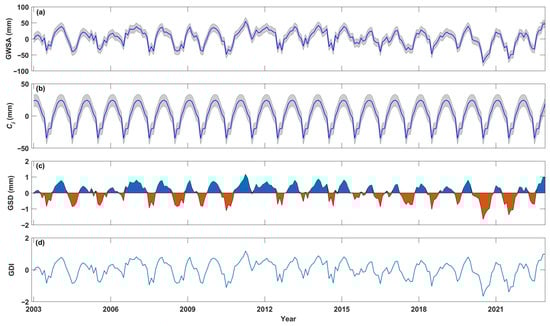
Figure 2.
The GDI calculation process during 2003–2022 in the YRB. (a–d) indicate GWSA calculation (unit: mm), monthly averages Ci (unit: mm), net deviation GSD (unit: mm), and final GDI computation (unit: dimensionless). Gray shadows denote uncertainties.
Figure 3 shows the trend and seasonal components, with turning points of groundwater drought from 2003 to 2022 identified by the BEAST algorithm. In the trend component and seasonal component, the probability of a sudden change at each moment was depicted, and the position with the highest probability of a sudden change was clearly marked. At the basin scale, one seasonal change point occurred in June 2022, with a 99.53% probability. The confidence interval was from April 2022 to July 2022, meaning there was a 95% probability that this change point would occur within this time period. The average GDI before the change point was 0.02, and the average GDI after the change point was 0.28, with a difference of 0.26 between the two. In addition, the trend-type change point occurred in February 2020 (with a 88.91% probability), and the confidence interval was from April 2019 to April 2020.
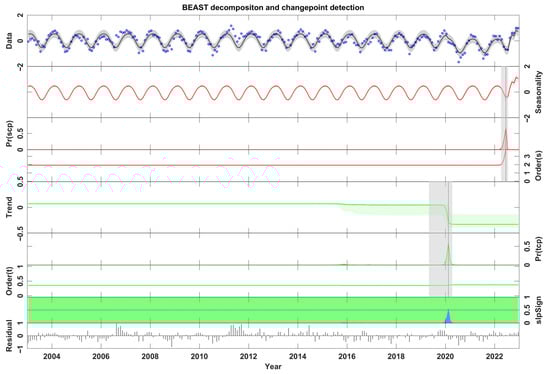
Figure 3.
Trend components, periodic components, residual terms, and change points of groundwater drought based on BEAST. Gray shadows denote uncertainties.
Similarly, at the scale of each sub-basin, GDI is decomposed into seasonal components and trend components (Figure 4). In YLWS, one seasonal change point occurred in June 2022 (with a 5.05% probability), and the confidence interval was from March 2022 to July 2022. The trend-type change point occurred in July 2011 (with a 99.36% probability), and there was a 95% chance that this change point occurred within the period from May 2011 to September 2011. In MJWS, seasonal and trend change points occurred in June 2022 and April 2011, with probabilities reaching 77.46% and 59.14%, respectively. In JLWS, both different types of change points occurred in 2006, and the confidence interval range of the seasonal change point was significantly larger than that of the trend change point. In particular, among these 10 regions, the change points of 8 regions all occurred after 2010. It could be seen that the complex meteorological and hydrological conditions after 2010 have presented nonlinear and non-consistent characteristics. In conclusion, the characteristics of groundwater drought changes and the locations where abrupt change points occurred were different.
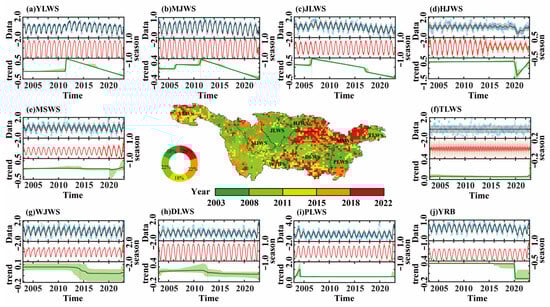
Figure 4.
Differential features of groundwater drought changes in various zones: (a) YLWS, (b) MJWS, (c) JLWS, (d) HJWS, (e) MSWS, (f) TLWS, (g) WJWS, (h) DLWS, (i) PLWS, and (j) YRB.
3.2. Spatial Distribution Characteristics of Groundwater Drought in Typical Years
Based on GDI, the most severe groundwater drought in the YRB occurred in 2022, when the GDI value was −0.54 (Figure 5). Figure 6 depicts the average distribution of GDI across the entire river basin and each sub-basin. At a monthly scale, the average GDI of the entire YRB from January to December ranged from −1.66 to 0.52. The groundwater drought was more serious from July to October, with the average GDI being −1.66, −1.30, −1.08, and −0.96, respectively. The percentages of arid areas were 94.02%, 73.81%, 79.44% and 77.15%, respectively. Specifically, from January to April, the overall drought situation in the entire river basin was not very obvious, with only a few areas experiencing mild drought. From May to July, the drought situation gradually worsened. From August to December, the average GDI of the entire river basin began to gradually rise. In December, the average GDI rose to 0.01. In each sub-basin, the minimum GDI values of HJWS, YLWS, JLWS, and MJWS all occurred in August, which were −2.03, −1.67, −2.26, and −2.19. The minimum GDI of MSWS and WJWS both occurred in July, being −1.89 and −2.11, respectively, while the minimum GDI of TLWS, DLWS, and PLWS occurred in June, May, and March, respectively, being −2.34, −1.23, and −1.29. At a seasonal scale, the average GDI in the entire YRB was the smallest in summer (−1.28). The percentage of arid areas in summer was 94.48%, while in winter it was only 13.38%. Among them, the proportion of the area in the entire basin that reached severe drought or worse in summer was 33.90%, while in winter it was only 0.15%. Except for the GDI minimum values of DLWS and PLWS, which occurred in spring, the GDI minimum values of the other seven sub-basins all occurred in summer.
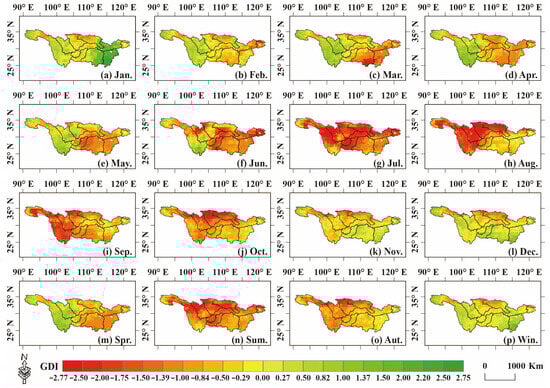
Figure 5.
Spatial patterns of groundwater drought for the year 2022, with red representing drought and green denoting no drought.
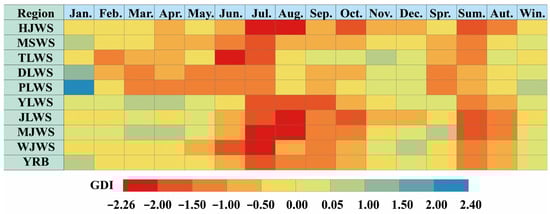
Figure 6.
Average values of GDI from 2003 to 2022 in various regions of the YRB.
3.3. Gridded Trend Characteristics Identification
Figure 7 shows the trend change characteristics of GDI in the YRB from 2003 to 2022. Figure 8 depicts the trend characteristics of GDI Zs values for the entire river basin and each sub-region. A Zs value greater than 0 indicates that the drought situation is gradually easing, while a value lower than 0 suggests that the drought situation is worsening. Based on the analysis at a monthly scale, the Zs of GDI calculated by the GMK method for the entire basin were −0.22, −0.28, 0.01, −0.31, −0.40, −0.38, −0.24, 0.01, 0.05, −0.28, −0.08, and −0.22, respectively. Data shows that the proportion of areas with a worsening drought trend ranges from 49.48% (September) to 73.11% (February). For the nine river basin divisions, spatially speaking, the average Zs values in the JLWS and MJWS regions from January to December were both less than 0, indicating that both regions showed a trend of aggravated drought throughout the year. From the seasonal scale analysis, the average Zs values of GDI in the entire basin were −0.23, −0.16, −0.43, and 0.14, respectively, and the area proportions with aggravated drought were 65.21%, 61.05%, 89.70% and 43.67%, respectively. Among them, the area percentages of groundwater drought in autumn showed a significant aggravation trend at the significance levels of 0.01 and 0.05 at 0.04% and 0.11%, respectively, while the area percentage of 89.55% showed no significant aggravation trend. In each sub-basin division, the quarterly groundwater drought trend characteristics also showed certain differences. The Zs values in the MSWS and TLWS regions were all negative in the four quarters, indicating that the drought in the two regions intensified throughout the year. The Zs values in the vast majority of areas within this basin were negative, indicating that the YRB experienced a trend of aggravated groundwater drought.
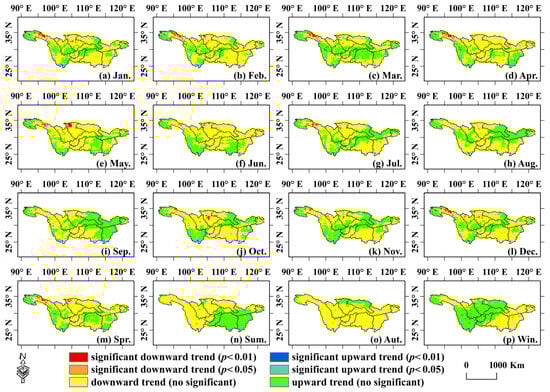
Figure 7.
Spatial trend characteristics of groundwater drought in the YRB.
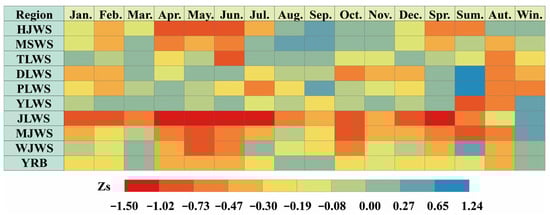
Figure 8.
Zs values of GDI from 2003 to 2022 in various regions of the YRB.
3.4. The Driving Force of Climate Factors on Groundwater Drought
We employed partial wavelet coherence quantitative analysis to investigate the independent effects of different climatic factors on groundwater drought in the YRB, in order to assess the correlation degree of two signals in a specific time–frequency region when other variables were excluded (Figure 9). There were five significant resonance periods between GDI and precipitation (PC), namely four negative correlations: the 6–10 month period from 2006 to 2008, the 12–20 month period from 2009 to 2011, the 8–12 month period from 2013 to 2014, the 12–18 month period from 2013 to 2015, and one positive correlation: the 6–8 month period from 2020 to 2021. There were two significant resonance periods with a positive correlation between GDI and soil temperature (ST), namely the 12–14 month period from 2004 to 2005 and the 20–24 month period from 2017 to 2018. There were four significant resonance periods between GDI and air humidity (AH), namely two positive correlations: the 6–8 month period from 2009 to 2010, the 14–18 month period from 2009 to 2010, and two negative correlations: the 6–8 month period from 2004 to 2005, and the 6–8 month cycle from 2021 to 2022. On a small scale (1–8 months), the PASC and AWC values between GDI and evapotranspiration (ET) were 4.85% and 0.92, respectively (Table 2). At medium (8–32 months) and large-scale (>32 months), the PASC values of GDI and ET reached 14.76% and 10.94%, respectively. For GDI and air temperature (AT), the PASC and AWC values at all scales were 2.88% and 0.90, respectively. Obviously, based on the size of the area percentage value (PASC value), where GDI has a significant correlation with PC, the relationship between groundwater drought in the YRB from 2003 to 2022 and PC is the most obvious; that is, the change in PC had the strongest dominant effect on drought.
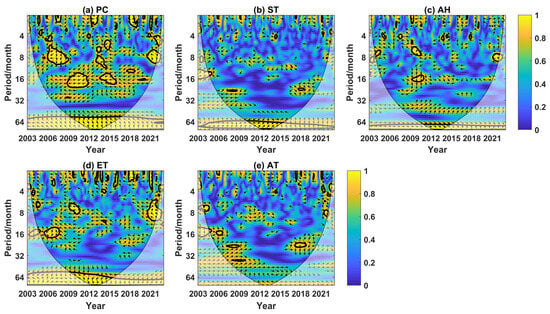
Figure 9.
The partial wavelet coherence of groundwater drought and climatic factors (a) PC, (b) ST, (c) AH, (d) ET, and (e) AT during 2003–2022 in the YRB. The arrows to the right/left, respectively, indicate a positive/negative correlation between groundwater drought and climate factors.
Table 2.
The PASC and AWC values between groundwater drought and climatic factors (PC, ST, AH, ET, and AT).
4. Discussion
4.1. The Impact of Major Circulation Factors on Groundwater Drought
Using SHAP analysis, we found that different atmospheric circulation factors contribute to the GDI in the YRB to different degrees. The absolute value of SHAP reflects the extent to which the input variable affects the target and can be used to rank the importance of influencing factors. The larger the absolute value, the greater the importance of the influencing factor to drought. Figure 10a shows the ranking of the importance of various atmospheric circulation factors. NPI has the greatest impact on GDI in the YRB, followed by PNA and SSI. The specific order and magnitude of importance are as follows: NPI (0.268), PNA (0.191), SSI (0.079), NAO (0.078), AMO (0.076), ENSO (0.073), AO (0.065), IPO (0.055), DMI (0.049), SOI (0.036) PDO (0.032), and ONI (0.016). Figure 10b shows the global impact graph of different atmospheric circulation factors on GDI. Positive values indicate that the input variables have a positive effect on GDI, and the groundwater drought situation is alleviated. Obviously, the atmospheric circulation factors that contribute the highest and lowest to the groundwater drought are NPI and ONI, respectively. Moreover, a high value of NPI (orange) corresponds to a negative SHAP value, while a low value of NPI (purple) corresponds to a positive SHAP value. That is, an increase in NPI is not conducive to the rise in GDI, indicating that its increase has an exacerbating effect on groundwater drought. Furthermore, as SSI, IPO, and DMI increase, the SHAP value rises from small to large, indicating that they promote the increase in GDI. This suggests that the increase in these three circulation factors helps alleviate groundwater drought. However, as PNA, AMO, ENSO, AO, SOI, and PDO increase, the SHAP values decrease from large to small, indicating that they have an inhibitory effect on the rise in GDI, suggesting that the increase in these circulation factors will have a worsening impact on drought. In conclusion, NPI can be regarded as one of the main predictors that effectively identify the variations in groundwater drought in the YRB, and it has a negative effect on GDI in the YRB, that is, it aggravates groundwater drought.
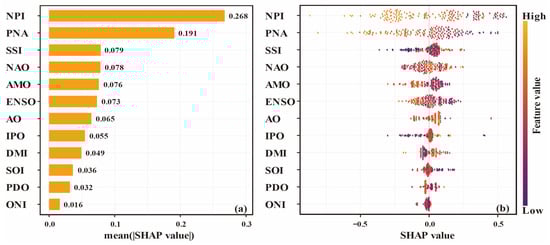
Figure 10.
(a) The priority ranking and (b) overall impacts of atmospheric circulation factors. Orange and red feature values denote high and low contribution levels, respectively.
There is an interactive influence among different atmospheric circulation factors, jointly affecting the GDI changes in the YRB (Figure 11). In this study, we focused on analyzing the interaction between the top three atmospheric circulation factors (NPI, PNA, SSI) that have the greatest impact on GDI and other factors, respectively. With the increase in NPI, the interaction between NPI and AMO shows a significant downward trend. When the NPI value is greater than 1015, the interaction values of SHAP between the two are mostly concentrated between −0.5 and −0.25. When the NPI value is less than 1015, the SHAP interaction values of the two are mainly positive and relatively dispersed. The SHAP interaction value between PNA and NPI is mainly negative. When the PNA value is greater than 0, the SHAP interaction value between the two is mainly negative (−0.5 < SHAP value < 0), and as the NPI value increases, the interaction value between the two becomes smaller. The SHAP interaction value between SSI and NAO is mainly positive. However, when the SSI value is greater than 25, the SHAP interaction value between the two is mainly positive.
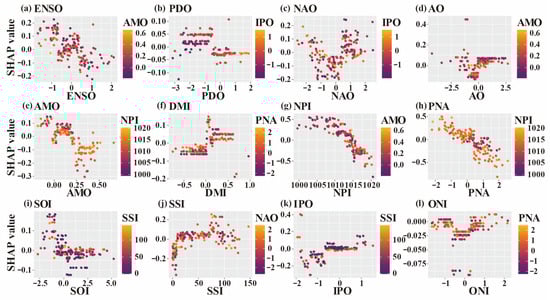
Figure 11.
Interaction of different atmospheric circulation factors: (a) ENSO, (b) PDO, (c) NAO, (d) AO, (e) AMO, (f) DMI, (g) NPI, (h) PNA, (i) SOI, (j) SSI, (k) IPO, and (l) ONI based on SHAP theory. Orange and red represent high and low dependency relationships, respectively.
4.2. Advantages and Limitations
As a powerful tool for time series decomposition, the BEAST algorithm provides a fast and universal way to decompose groundwater drought sequences and obtain their sudden changes, continuous trends, and periodic fluctuations [59,60]. Furthermore, based on BEAST, we obtained the probability and confidence interval of possible change points at any given time point, which indicates that the algorithm takes into account the error range of the model (Figure 3). The terrain in the YRB has a large drop, which increases the abnormal variation in the climate. Moreover, this climate feature, combined with the vertical zonal factors of the mountains, leads to the drought conditions in some areas being significantly affected by the topography and geomorphology. Therefore, the locations of drought abrupt change points and the probabilities of their occurrence vary in different zones (Figure 4). In the 2022 summer, the YRB experienced record-breaking extreme high-temperature weather, with temperatures far exceeding the average level of previous years and the duration significantly prolonged [67,68,69]. This had a severe impact on agriculture and the social economy in this region [70]. This phenomenon not only reflects the direct impact of global warming but also reveals the complexity of local climate change within the region. Especially in areas with a high degree of urbanization, the heat island effect further amplifies the high-temperature phenomenon, significantly enhancing the intensity of extreme high temperatures [71]. In addition to the anomalies of large-scale circulation systems, local circulation and thermal feedback have also played significant roles in extreme drought events in the YRB. Based on partial wavelet coherence, we identified that the drought variations are most closely related to PC (Figure 9).
Atmospheric circulation factors may affect the occurrence, development, and transmission process of groundwater drought by remote correlation. Therefore, introducing atmospheric circulation factors into drought prediction models can improve the prediction performance and the foresight period length of drought [35]. Most areas of the YRB are not only in the overlapping influence zone of the two subsystems of the East Asian monsoon (the East Asian tropical monsoon and the East Asian subtropical monsoon), but also jointly affected by the westerly circulation and the monsoon of the Qinghai-Xizang Plateau. Coupled with the sensitivity of the ecosystem and the high-intensity human activities, the drought disasters in the YRB have obvious regional and complex characteristics [38,45,50]. The changes in atmospheric circulation caused by the monsoon have a significant impact and are relatively sensitive to climate change. Based on the SHAP theory, we have identified three main predictors that effectively characterize the groundwater drought changes in the YRB from 2003 to 2022 as NPI, PNA, and SSI (Figure 10). As one of the signals of atmospheric circulation, the negative phase of NPI causes water vapor divergence through the mid-and low-latitude North Pacific anticyclone, while enhancing the Walker circulation and the abnormal meridional circulation circle, resulting in abnormal airflow subsidence movement in southern China [72]. PNA affects precipitation distribution by altering the pattern of atmospheric circulation and leads to increased anthropogenic greenhouse gas emissions and drought risk in modern times [73]. The activity cycle of SSI is approximately 11 years. Its periodic changes may affect the climate of the Earth system, and droughts are more likely to occur before and after the peak of sunspot activity [35]. Compared with traditional spherical harmonic coefficient solutions, the RL06 mascon model significantly reduces post-processing requirements and uncertainties by introducing prior constraints and geophysical information. RL06 mascon data has usually been corrected for stripe filtering and spherical harmonic truncation, and users do not need to perform Gaussian smoothing or stripe removal again, which is one of the advantages of the mascon model over spherical harmonics [74]. ENSO affects precipitation in the YRB by influencing the Western Pacific Subtropical High and East Asian Monsoon [75,76]. However, previous studies have focused on meteorological drought, while our research mainly focuses on groundwater drought. NPI, as an important mode of North Pacific sea surface temperature variability, regulates the depth of the East Asian trough by affecting the position and intensity of the Aleutian low-pressure system and the westerly jet stream. When NPI is in the negative phase, the North Pacific sea surface temperature is abnormally warm, the Aleutian low pressure weakens, causing the westerly jet stream to rise northward and the East Asian trough to weaken. This circulation configuration causes the position of the Western Pacific Subtropical High (WPSH) to be northwesterly and its intensity to increase. The abnormal westward extension and northward uplift of WPSH weaken the southwest airflow on its west side, which is not conducive to the transport of water vapor to the YRB. In the Summer 2022 drought event, agricultural production was significantly affected by the drought due to its high dependence on a stable water resources supply. Extreme weather conditions have led to a reduction of over 20 billion kilograms in food production, raising serious concerns about local and national food security. The combined impact of extremely high temperatures and water scarcity on crop yields further highlights the increasing vulnerability of agriculture to extreme events caused by climate change [77]. The critical period for rice growth is from July to August (tillering heading stage), during which water demand accounts for 40–50% of the entire growth period. The summer drought in 2022 coincides with the critical period of water demand for rice, leading to a decrease in tillering and yield. On August 25th, during the peak of drought, 66.32 million mu of farmland in the YRB was affected by drought, indicating a significant agricultural drought phenomenon that is bound to have an impact on grain production in 2022.
In this study, the inversion of groundwater reserves and the construction of the groundwater drought index were only conducted in the YRB region using GRACE satellite data. However, due to the data resolution of the GRACE satellite being only 0.25° × 0.25°, more detailed studies cannot be conducted within the YRB because of the low data resolution [42,50]. Furthermore, our verification of GDI based on GRACE and the development trend of drought is not sufficient. The measured data of surface monitoring wells can be combined to study the changes in groundwater reserves in a small range [30,36,41]. Subsequently, experiments on the effectiveness of monitoring drought events using GDI are needed to make the verification results more convincing [35]. This paper directly uses the Mascon product data to construct drought indicators. Subsequent research still needs to be based on different product data from GRACE and GRACE-FO. For example, multiple rounds of experiments and comparisons should be conducted using spherical harmonic coefficient products to analyze the differences in the monitoring results of drought coefficients constructed by different GRACE data products [12,34,38].
4.3. Future Prospects
In future research work, machine learning methods can be adopted for the downscaling study of GRACE data. As for tectonic factors, such as whether earthquakes will cause changes in groundwater reserves and drought, further research will be conducted next [78]. Meanwhile, due to the changes in climatic conditions in recent years and the intervention of human activities, there has been a certain degree of turning and recovery in groundwater reserves and drought. Therefore, the prediction of groundwater drought combining the random forest model and human activities in the future will also be one of the key points of the next research [20,21,40]. In addition, we can adopt hydrological models with higher spatial resolution, such as the 0.1° ERA5 model and surface gravity data, as well as data with higher temporal resolution, such as the 3 h hydrological model and surface gravity station data, to achieve complementary and coordinated multi-source data, in order to provide more comprehensive and accurate information support for groundwater drought monitoring and response [31,37].
5. Conclusions
This study revealed the spatio-temporal dynamic evolution characteristics of groundwater drought in the YRB and nine secondary sub-basins from 2003 to 2022, identified the locations of sudden change points, confidence intervals, and possible probabilities of groundwater drought, and clarified the independent/coupled driving effects of multiple climatic factors and circulation factors on groundwater drought. The results show the following:
- (1)
- The minimum value of GDI (−1.66) occurred in July 2020. At the basin scale, seasonal and trend change points occurred in June 2022 (with a probability of 99.53%, confidence interval from April 2022 to July 2022) and February 2020 (with a probability of 88.91%, confidence interval from April 2019 to April 2020), respectively.
- (2)
- During 2022, the average GDI value of the entire basin in each month ranged from −1.66 to 0.52. At a seasonal scale, the average GDI was the smallest in summer (−1.28) and the largest in winter (0.14).
- (3)
- Based on the GMK method, the proportion of areas with a worsening drought trend ranged from 49.48% (September) to 73.11% (February). The groundwater drought in both the JLWS and MJWS regions intensified from January to December.
- (4)
- Using the identified atmospheric circulation factors (NPI, PNA, SSI) as inputs to the drought warning system, that is, using large-scale, predictable climate signals to predict regional hydro-meteorological anomalies, can provide practical significance for drought management in this region.
Author Contributions
Conceptualization: W.L., Y.L. and S.H.; methodology: Z.L., Q.X. and N.L.; writing—original draft preparation: W.L., F.W. and R.M.; validation: J.G. and K.F.; software: R.L., H.L. and M.D.; funding acquisition: W.L., F.W. and Q.T. All authors have read and agreed to the published version of the manuscript.
Funding
This research was supported by Henan Provincial Youth Science Foundation (grant number 252300420828), National Natural Science Foundation of China (grant number 42401022), the State Key Laboratory of Spatial Datum Open Project (grant number SKLGIE2024-ZZ-8, SKLGIE2024-Z-4-1 and SKLGIE2023-ZZ-9), the Open Research Fund of Key Laboratory of River Basin Digital Twinning of Ministry of Water Resources (grant number Z0202042022), Key Research Projects of Higher Education Institutions in Henan Province (grant number 24A570005), Scientific and Technological Research Projects in Henan Province (grant number 242102321005), Key Research and Development Special Project of Henan Province (grant number 251111210700), Key Science Foundation Project of Henan Provincial Natural Science Foundation (grant number 252300421259), and Henan Province University Science and Technology Innovation Team Support Plan (grant number 26IRTSTHN022).
Data Availability Statement
Data can be requested from the corresponding author upon reasonable request.
Acknowledgments
Thanks for the help with language editing provided by Wenhan Yu.
Conflicts of Interest
The authors declare that the research was conducted in the absence of any commercial or financial relationships that could be construed as a potential conflict of interest. The authors declare that this study received funding from the National Natural Science Foundation of China (grant number 42401022). The funder was not involved in the study design, collection, analysis, interpretation of data, the writing of this article, or the decision to submit it for publication.
References
- Vicente–Serrano, S.; Beguería, S.; López–Moreno, J. A multiscalar drought index sensitive to global warming: The Standardized Precipitation Evapotranspiration Index. J. Clim. 2010, 23, 1696–1718. [Google Scholar] [CrossRef]
- van Hateren, T.; Chini, M.; Matgen, P.; Teuling, A. Ambiguous Agricultural Drought: Characterising Soil Moisture and Vegetation Droughts in Europe from Earth Observation. Remote Sens. 2021, 13, 1990. [Google Scholar] [CrossRef]
- Wang, H.; Cheng, S.; Huang, L.; Guo, W. Investigating the meteorological causes of hydrological drought through the integration of spatiotemporal cubes and interpretable machine learning: A case study of the Yangtze River Basin. J. Hydrol.-Reg. Stud. 2025, 62, 102796. [Google Scholar] [CrossRef]
- Wang, F.; Lai, H.; Li, Y.; Feng, K.; Zhang, Z.; Tian, Q.; Zhu, X.; Yang, H. Dynamic variation of meteorological drought and its relationships with agricultural drought across China. Agric. Water Manag. 2022, 261, 107301. [Google Scholar] [CrossRef]
- Putzenlechner, B.; Koal, P.; Kappas, M.; Löw, M.; Mundhenk, P.; Tischer, A.; Wernicke, J.; Koukal, T. Towards precision forestry: Drought response from remote sensing-based disturbance monitoring and fine-scale soil information in Central Europe. Sci. Total Environ. 2023, 880, 163114. [Google Scholar] [CrossRef]
- Yang, Y.; Feng, Y.; He, X.; Li, M. Spatial heterogeneity and environmental drivers of drought vulnerability in the Yangtze River Basin. Ecol. Indic. 2025, 179, 114246. [Google Scholar] [CrossRef]
- Lee, T.; Modarres, R.; Ouarda, T. Data-based analysis of bivariate copula tail dependence for drought duration and severity. Hydrol. Process. 2013, 27, 1454–1463. [Google Scholar] [CrossRef]
- Huang, S.; Chang, J.; Leng, G.; Huang, Q. Integrated index for drought assessment based on variable fuzzy set theory: A case study in the Yellow River basin, China. J. Hydrol. 2015, 527, 608–618. [Google Scholar] [CrossRef]
- Esfahanian, E.; Nejadhashemi, A.; Abouali, M.; Adhikari, U.; Zhang, Z.; Daneshvar, F.; Herman, M. Development and evaluation of a comprehensive drought index. J. Environ. Manag. 2016, 185, 31–43. [Google Scholar] [CrossRef]
- Yu, J.; Zou, L.; Xia, J.; Dou, M.; Liu, H.; Zuo, L. Future changes in hydrological drought across the Yangtze River Basin: Identification, spatial–temporal characteristics, and concurrent probability. J. Hydrol. 2023, 625, 130057. [Google Scholar] [CrossRef]
- Long, Y.; Huang, Y.; Ma, Q.; Yu, W.; Tan, C. Future drought patterns in Southwest China: A CMIP6-based analysis using multiple drought indices. J. Hydrol.-Reg. Stud. 2025, 61, 102702. [Google Scholar] [CrossRef]
- Han, Z.; Huang, S.; Huang, Q.; Bai, Q.; Leng, G.; Wang, H.; Zhao, J.; Wei, X.; Zheng, X. Effects of vegetation restoration on groundwater drought in the Loess Plateau, China. J. Hydrol. 2020, 591, 125566. [Google Scholar] [CrossRef]
- Kartal, V.; Katipoğlu, O.; Karakoyun, E.; Simsek, O.; Yavuz, V.; Ariman, S. Prediction of groundwater drought based on hydro-meteorological insights via machine learning approaches. Phys. Chem. Earth 2024, 136, 103757. [Google Scholar] [CrossRef]
- Haile, M.; Li, F.; Ai, Z.; Chen, G.; Leng, P. Spatiotemporal characteristics and driving factors of groundwater drought in Nile River Basin (NRB). Catena 2025, 257, 109194. [Google Scholar] [CrossRef]
- Bloomfield, J.; Marchant, B. Analysis of groundwater drought building on the standardized precipitation index approach. Hydrol. Earth Syst. Sci. 2013, 17, 4769–4787. [Google Scholar] [CrossRef]
- Aon, S.; Nandi, S.; Sen, S.; Biswas, S. GRACE based groundwater drought evaluation of Ganga Basin and analysis of drought propagation using wavelet based quantitative approach. Sci. Total Environ. 2024, 951, 175666. [Google Scholar] [CrossRef]
- Scanlon, B.; Longuevergne, L.; Long, D. Ground referencing GRACE satellite estimates of groundwater storage changes in the California Central Valley, USA. Water Resour. Res. 2012, 48, W04520. [Google Scholar] [CrossRef]
- Landerer, F.; Swenson, S. Accuracy of scaled GRACE terrestrial water storage estimates. Water Resour. Res. 2012, 48, W04531. [Google Scholar] [CrossRef]
- Long, D.; Shen, Y.; Sun, A.; Hong, Y.; Longuevergne, L.; Yang, Y.; Li, B.; Chen, L. Drought and flood monitoring for a large karst plateau in Southwest China using extended GRACE data. Remote Sens. Environ. 2014, 155, 145–160. [Google Scholar] [CrossRef]
- Feng, W.; Zhong, M.; Lemoine, J.; Biancale, R.; Hsu, H.; Xia, J. Evaluation of groundwater depletion in North China using the Gravity Recovery and Climate Experiment (GRACE) data and ground-based measurements. Water Resour. Res. 2013, 49, 2110–2118. [Google Scholar] [CrossRef]
- Cao, Y.; Nan, Z.; Cheng, G. GRACE gravity satellite observations of terrestrial water storage changes for drought characterization in the arid land of Northwestern China. Remote Sens. 2015, 7, 1021–1047. [Google Scholar] [CrossRef]
- Thomas, B.; Famiglietti, J.; Landerer, F.; Wiese, D.; Molotch, N.; Argus, D. GRACE Groundwater Drought Index: Evaluation of California Central Valley groundwater drought. Remote Sens. Environ. 2017, 198, 384–392. [Google Scholar] [CrossRef]
- Hosseini-Moghari, S.; Araghinejad, S.; Ebrahimi, K.; Tourian, M. Introducing modified total storage deficit index (MTSDI) for drought monitoring using GRACE observations. Ecol. Indic. 2019, 101, 465–475. [Google Scholar] [CrossRef]
- Wijesinghe, D.; Withanage, N.; Mishra, P.; Ranagalage, M.; Abdelrahman, K.; Fnais, M. An application of the remote sensing derived indices for drought monitoring in a dry zone district, in tropical island. Ecol. Indic. 2024, 167, 112681. [Google Scholar] [CrossRef]
- Yungstein, Y.; Fishman, N.; Lerner, G.; Mulero, G.; Michael, Y.; Yaakobi, A.; Obersteiner, S.; Rez, L.; Klein, T.; Helman, D. Early detection of drought-stressed stands in Mediterranean forests using remote sensing and machine learning classification models in a rainfall exclusion experiment. Agric. Forest Meteorol. 2025, 375, 110855. [Google Scholar] [CrossRef]
- Wu, Q.; Si, B.; He, H.; Wu, P. Determining regional-scale groundwater recharge with GRACE and GLDAS. Remote Sens. 2019, 11, 154. [Google Scholar] [CrossRef]
- Thomas, E.; Wilson, D.; Kathuni, S.; Libey, A.; Chintalapati, P.; Coyle, J. A contribution to drought resilience in East Africa through groundwater pump monitoring informed by in-situ instrumentation, remote sensing and ensemble machine learning. Sci. Total Environ. 2021, 780, 146486. [Google Scholar] [CrossRef]
- Xiang, L.; Wang, H.; Steffen, H.; Wu, P.; Jia, L.; Jiang, L.; Shen, Q. Groundwater storage changes in the Tibetan Plateau and adjacent areas revealed from GRACE satellite gravity data. Earth Planet. Sci. Lett. 2016, 449, 228–239. [Google Scholar] [CrossRef]
- Yang, P.; Chen, Y. An analysis of terrestrial water storage variations from GRACE and GLDAS: The Tianshan Mountains and its adjacent areas, central Asia. Quat. Int. 2015, 358, 106–112. [Google Scholar] [CrossRef]
- Abiy, A.; Melesse, A. Evaluation of watershed scale changes in groundwater and soil moisture storage with the application of GRACE satellite imagery data. Catena 2017, 153, 50–60. [Google Scholar] [CrossRef]
- Arciniega-Esparza, S.; Hernández-Espriú, J.; Salinas-Calleros, G.; Birkel, C.; Sanchez, R. Assessing hydrological drought propagation through assimilation of GRACE for groundwater storage anomalies modelling in northeastern Mexico. J. Hydrol. 2025, 661, 133826. [Google Scholar] [CrossRef]
- Schumacher, M.; Forootan, E.; van Dijk, A.; Schmied, H.; Crosbie, R.; Kusche, J.; Döll, P. Improving drought simulations within the Murray-Darling Basin by combined calibration/assimilation of GRACE data into the WaterGAP Global Hydrology Model. Remote Sens. Environ. 2018, 204, 212–228. [Google Scholar] [CrossRef]
- Ojha, C.; Werth, S.; Shirzaei, M. Recovery of aquifer-systems in Southwest US following 2012–2015 drought: Evidence from InSAR, GRACE and groundwater level data. J. Hydrol. 2020, 587, 124943. [Google Scholar] [CrossRef]
- Deng, S.; Liu, S.; Mo, X. Assessment and attribution of China’s droughts using an integrated drought index derived from GRACE and GRACE-FO data. J. Hydrol. 2021, 603, 127170. [Google Scholar] [CrossRef]
- Wang, F.; Wang, Z.; Yang, H.; Di, D.; Zhao, Y.; Liang, Q. Utilizing GRACE-based groundwater drought index for drought characterization and teleconnection factors analysis in the North China Plain. J. Hydrol. 2020, 585, 124849. [Google Scholar] [CrossRef]
- Zhou, Z.; Lu, B.; Jiang, Z.; Zhao, Y.; Yan, F.; Zhang, Y. Quantifying Water Storage Changes and Groundwater Drought in the Huaihe River Basin of China Based on GRACE Data. Sustainability 2024, 16, 8437. [Google Scholar] [CrossRef]
- Liu, Y.; Dai, C.; Jing, Y.; Ru, Q.; Yan, F.; Zhang, Y. GRACE/GRACE-FO Satellite Assessment of Sown Area Expansion Impacts on Groundwater Sustainability in Jilin Province. Sustainability 2025, 17, 7731. [Google Scholar] [CrossRef]
- Duan, A.; Zhong, Y.; Xu, G.; Yang, K.; Tian, B.; Wu, Y.; Bai, H.; Hu, E. Quantifying the 2022 extreme drought in the Yangtze River Basin using GRACE-FO. J. Hydrol. 2024, 630, 130680. [Google Scholar] [CrossRef]
- Blank, D.; Eicker, A.; Reager, J.; Güntner, A. Revisiting Sub-Surface Drought Cascades with Daily Satellite Observations of Soil Moisture and Terrestrial Water Storage. Water Resour. Res. 2025, 61, e2024WR039321. [Google Scholar] [CrossRef]
- Ji, R.; Wang, C.; Cui, A.; Wang, W.; Chen, N.; Chen, R.; Zhu, A. Separating climate and human induced terrestrial water storage anomalies with GRACE data and hydrological models. Int. J. Digit. Earth 2025, 18, 2557516. [Google Scholar] [CrossRef]
- Long, D.; Yang, Y.; Wada, Y.; Hong, Y.; Liang, W.; Chen, Y.; Yong, B.; Hou, A.; Wei, J.; Chen, L. Deriving scaling factors using a global hydrological model to restore GRACE total water storage changes for China’s Yangtze River Basin. Remote Sens. Environ. 2015, 168, 177–193. [Google Scholar] [CrossRef]
- Sun, Z.; Zhu, X.; Pan, Y.; Zhang, J.; Liu, X. Drought evaluation using the GRACE terrestrial water storage deficit over the Yangtze River Basin, China. Sci. Total Environ. 2018, 634, 727–738. [Google Scholar] [CrossRef] [PubMed]
- Zhang, D.; Zhang, Q.; Qiu, J.; Bai, P.; Liang, K.; Li, X. Intensification of hydrological drought due to human activity in the middle reaches of the Yangtze River, China. Sci. Total Environ. 2018, 637–638, 1432–1442. [Google Scholar] [CrossRef] [PubMed]
- Yang, P.; Zhang, S.; Xia, J.; Zhan, C.; Cai, W.; Wang, W.; Luo, X.; Chen, N.; Li, J. Analysis of drought and flood alternation and its driving factors in the Yangtze River Basin under climate change. Atmos. Res. 2022, 270, 106087. [Google Scholar] [CrossRef]
- Jia, N.; Cheng, J.; Li, Y.; Zheng, L.; Song, W.; Chen, R.; Zhu, A. China’s Yangtze River drought: A cascade of impacts from mountains to sea. Sci. China Earth Sci. 2025, 68, 957–962. [Google Scholar] [CrossRef]
- Lyu, Z.; Gao, H.; Gao, R.; Ding, T. Extreme characteristics and causes of the drought event in the whole Yangtze River Basin in the midsummer of 2022. Adv. Clim. Change Res. 2023, 14, 642–650. [Google Scholar] [CrossRef]
- Yang, L.; Wei, J. How Severe Was the 2022 Flash Drought in the Yangtze River Basin? Remote Sens. 2024, 16, 4122. [Google Scholar] [CrossRef]
- Zhang, Y.; Liu, X.; Wang, K.; Bai, P. Response of evapotranspiration to the 2022 unprecedented extreme drought in the Yangtze River Basin. Int. J. Climatol. 2024, 44, 2779–2791. [Google Scholar] [CrossRef]
- Zhang, D.; Zhang, Q.; Werner, A.; Liu, X. GRACE-Based Hydrological Drought Evaluation of the Yangtze River Basin, China. J. Hydrometeorol. 2016, 17, 811–828. [Google Scholar] [CrossRef]
- Huang, L.; Zhou, P.; Cheng, L.; Liu, Z. Dynamic drought recovery patterns over the Yangtze River Basin. Catena 2021, 201, 105194. [Google Scholar] [CrossRef]
- Cao, Y.; Zhang, Y.; Tian, J.; Li, X.; Tang, Z.; Yang, X.; Zhang, X.; Ma, N. Strong Agricultural Resilience to 2022 Southern China Drought. Earths Future 2024, 12, e2023EF004243. [Google Scholar] [CrossRef]
- Ma, W.; Zhou, H.; Dai, M.; Tang, L.; Xu, S.; Luo, Z. Characterizing the drought events in Yangtze River basin via the insight view of its sub-basins water storage variations. J. Hydrol. 2024, 633, 130995. [Google Scholar] [CrossRef]
- Li, Z.; Huang, S.; Zhou, S.; Leng, G.; Liu, D.; Huang, Q.; Wang, H.; Han, Z.; Liang, H. Clarifying the Propagation Dynamics from Meteorological to Hydrological Drought Induced by Climate Change and Direct Human Activities. J. Hydrometeorol. 2021, 22, 2359–2378. [Google Scholar] [CrossRef]
- Mo, X.; Wu, J.; Wang, Q.; Zhou, H. Variations in water storage in China over recent decades from GRACE observations and GLDAS. Nat. Hazards Earth Syst. Sci. 2016, 16, 469–482. [Google Scholar] [CrossRef]
- Gu, Z.; Gu, L.; Yin, J.; Fang, W.; Xiong, L.; Guo, J.; Zeng, Z.; Xia, J. Impact of atmospheric circulations on droughts and drought propagation over China. Sci. China Earth Sci. 2024, 67, 2633–2648. [Google Scholar] [CrossRef]
- Hu, Y.; Zhou, B.; Han, T.; Li, H.; Wang, H. In-phase variations of spring and summer droughts over northeast China and their relationship with the north atlantic oscillation. J. Clim. 2022, 35, 6923–6937. [Google Scholar] [CrossRef]
- Ahmad, M.H.; Abubakar, A.; Ishak, M.Y.; Danhassan, S.S.; Zhang, J.H.; Alatalo, J.M. Modeling the influence of daily temperature and precipitation extreme indices on vegetation dynamics in Katsina State using statistical downscaling model (SDM). Ecol. Indic. 2023, 155, 110979. [Google Scholar] [CrossRef]
- Feng, W.; Shum, C.K.; Zhong, M.; Pan, Y. Groundwater storage changes in China from satellite gravity: An overview. Remote Sens. 2018, 10, 674. [Google Scholar] [CrossRef]
- White, J.H.R.; Walsh, J.E.; Thoman, R.L., Jr. Using Bayesian statistics to detect trends in Alaskan precipitation. Int. J. Climatol. 2021, 41, 2045–2059. [Google Scholar] [CrossRef]
- Zhao, K.G.; Wulder, M.A.; Hu, T.X.; Bright, R.M.; Wu, Q.; Qin, H.; Li, Y.; Toman, E.M.; Mallick, B.; Zhang, X.; et al. Detecting change-point, trend, and seasonality in satellite time series data to track abrupt changes and nonlinear dynamics: A Bayesian ensemble algorithm. Remote Sens. Environ. 2019, 232, 111181. [Google Scholar] [CrossRef]
- Cai, Y.T.; Liu, S.T.; Lin, H. Monitoring the vegetation dynamics in the Dongting lake wetland from 2000 to 2019 using the BEAST algorithm based on dense Landsat time series. Appl. Sci. 2020, 10, 4209. [Google Scholar] [CrossRef]
- Hu, W.; Si, B. Technical Note: Multiple wavelet coherence for untangling scale-specific and localized multivariate relationships in geosciences. Hydrol. Earth Syst. Sci. 2017, 20, 3183–3191. [Google Scholar] [CrossRef]
- Ghaderpour, E.; Pagiatakis, S.D. LSWAVE: A MATLAB software for the least-squares wavelet and cross-wavelet analyses. GPS Solut. 2019, 23, 50. [Google Scholar] [CrossRef]
- Kalu, I.; Ndehedehe, C.; Okwuashi, O.; Eyoh, A.; Ferreira, V. An assimilated deep learning approach to identify the influence of global climate on hydrological fluxes. J. Hydrol. 2022, 614, 128498. [Google Scholar] [CrossRef]
- Lundberg, S.M.; Lee, S.I. A unified approach to interpreting model predictions. Adv. Neural Inf. Process. Syst. 2017, 30, 4768–4777. [Google Scholar]
- Pradhan, B.; Lee, S.; Dikshit, A.; Kim, H. Spatial flood susceptibility mapping using an explainable artificial intelligence (XAI) model. Geosci. Front. 2023, 14, 101625. [Google Scholar] [CrossRef]
- Ma, M.; Qu, Y.; Lyu, J.; Zhang, X.; Su, Z.; Gao, H.; Yang, X.; Chen, X.; Jiang, T.; Zhang, J.; et al. The 2022 extreme drought in the Yangtze River Basin: Characteristics, causes and response strategies. River 2022, 1, 162–171. [Google Scholar] [CrossRef]
- Yuan, X.; Wang, Y.; Zhou, S.; Li, H.; Li, C. Multiscale causes of the 2022 Yangtze mega-flash drought under climate change. Sci. China Earth Sci. 2024, 67, 2649–2660. [Google Scholar] [CrossRef]
- Yu, Y.; Deng, H.; Gao, S.; Wang, J. Drought Evolution in the Yangtze and Yellow River Basins and Its Dual Impact on Ecosystem Carbon Sequestration. Agriculture 2025, 15, 1552. [Google Scholar] [CrossRef]
- Jiang, J.; Liu, Y.; Mao, J.; Wu, G. Extreme heatwave over Eastern China in summer 2022: The role of three oceans and local soil moisture feedback. Environ. Res. Lett. 2023, 18, 044025. [Google Scholar] [CrossRef]
- Kabisch, N.; Remahne, F.; Ilsemann, C.; Fricke, L. The urban heat island under extreme heat conditions: A case study of Hannover, Germany. Sci. Rep. 2023, 13, 23017. [Google Scholar] [CrossRef]
- Qin, Y.; Zhang, Z.; Wang, G.; Ren, J.; Zhang, W. Spatiotemporal assessment and climate teleconnections of drought in Northeast China (2001–2023) using a machine-learning-based meteorological composite index. J. Hydrol.-Reg. Stud. 2025, 61, 102693. [Google Scholar] [CrossRef]
- Santos, C.; Santos, D.; Neto, R.; Oliveira, G.; Santos, C.; Silva, R. Analyzing the impact of ocean-atmosphere teleconnections on rainfall variability in the Brazilian Legal Amazon via the Rainfall Anomaly Index (RAI). Atmos. Res. 2024, 307, 107483. [Google Scholar] [CrossRef]
- Tangdamrongsub, N.; Hwang, C.; Borak, J.S.; Prabnakorn, S.; Han, J. Optimizing GRACE/GRACEFO data and a priori hydrological knowledge for improved global terrestial water storage component estimates. J. Hydrol. 2021, 598, 126463. [Google Scholar] [CrossRef]
- Huang, H.; Zhang, B.; Cui, Y.Q.; Ma, S.Q. Analysis on the Characteristics of Dry and Wet Periods in The Yangtze River Basin. Water 2020, 12, 2960. [Google Scholar] [CrossRef]
- Yin, H.; Fowler, H.J.; Blenkinsop, S.; Wu, Z.Y.; He, H.; Li, Y. ENSO and IOD contributions to seasonal meteorological droughts over the Yangtze River basin. Int. J. Climatol. 2023, 43, 8120–8136. [Google Scholar] [CrossRef]
- Huang, Z.Q.; Tan, X.Z.; Liu, B.J. Relative contributions of large-scale atmospheric circulation dynamics and anthropogenic warming to the unprecedented 2022 Yangtze River Basin heatwave. J. Geophys. Res.-Atmos. 2024, 129, e2023JD039330. [Google Scholar] [CrossRef]
- Han, S.; Sauber, J.; Broerse, T.; Pollitz, F.; Okal, E.; Jeon, T.; Seo, K.; Stanaway, R. GRACE and GRACE Follow-On Gravity Observations of Intermediate-Depth Earthquakes Contrasted with Those of Shallow Events. J. Geophys. Res.-Sol. Earth 2024, 129, e2023JB028362. [Google Scholar] [CrossRef]
Disclaimer/Publisher’s Note: The statements, opinions and data contained in all publications are solely those of the individual author(s) and contributor(s) and not of MDPI and/or the editor(s). MDPI and/or the editor(s) disclaim responsibility for any injury to people or property resulting from any ideas, methods, instructions or products referred to in the content. |
© 2025 by the authors. Licensee MDPI, Basel, Switzerland. This article is an open access article distributed under the terms and conditions of the Creative Commons Attribution (CC BY) license.