Abstract
A novel intelligent wet feed system was designed to accurately match the dynamic nutritional requirements of lactating sows. An experimental study was conducted to compare the performance of this novel feeding system with the traditional manual feeding method. Twenty-two first-parity sows selected through screening were randomly divided into intelligent feeding and manual feeding groups. Feed intake and backfat thickness changes during lactation were monitored, and the growth performance of 30 piglets was assessed. The effects of feeding methods on feed intake, backfat thickness, and piglet growth were evaluated. Results showed that the intelligent group increased the feed intake under high feeding conditions, with feed conversion efficiency improved by 21.8%. A backfat conservation effect was observed, with backfat loss reduced by 82.5% and the daily loss rate being only 16.6% of that in the manual group. Piglet growth performance was improved, with the peak growth rate increased by 14.2% and the growth inflection point brought forward by 10.6%, both reaching medium to large effect sizes. The results indicate that the intelligent wet feeding system improved feed conversion efficiency in sows under high feeding conditions, reduced backfat loss, and enhanced piglet growth rates. These findings provide references for the application of intelligent feeding technology and offer technical pathways for intelligent and efficient pig farming.
1. Introduction
Modern pig farming faces dual challenges of meeting growing demand for high-quality protein while achieving efficient resource utilization and environmental sustainability [1]. As the core component of the production chain, sows’ nutritional management quality during lactation directly determines the efficiency and profitability of the entire production system. Lactating sows need to produce large amounts of milk to meet the rapid growth demands of piglets, with nutritional requirements significantly increased compared to gestation and exhibiting highly dynamic characteristics [2]. Traditional fixed-schedule feeding management shows significant limitations in addressing these dynamic requirements [3]. Production practices indicate that sows under fixed feeding schedules often experience severe negative energy balance during peak lactation [4], leading to rapid backfat thickness decline and body condition deterioration, subsequently affecting reproductive performance and productive lifespan [5]. This imprecise nutritional management not only affects sows themselves but also directly impacts piglet growth and development through changes in milk quality and quantity [6].
In recent years, intelligent feeding systems based on Internet of Things (IoT), sensor technology, and artificial intelligence algorithms have provided new possibilities for solving this challenge [7,8]. Precision Livestock Farming (PLF) is becoming a key step in future livestock development, achieving precise perception of animal behavior, environment, and physiology through IoT and integrated digital technologies [9,10]. Comprehensive reviews have demonstrated that PLF technologies integrating sensors, computer vision, data analytics, and machine learning algorithms enable continuous real-time monitoring and early disease detection, fundamentally transforming livestock management from reactive to proactive decision-making [11,12]. Compared to traditional dry feed feeding, intelligent wet feed systems make feed more palatable and allow better control of nutrient delivery and intake through adjustable water-to-feed ratios [13]. Recent advances in precision feeding systems have demonstrated technical feasibility for monitoring and controlling feed and water intake in gestation units [14] and lactation units [15,16]. Aparicio-Arnay et al. [17] demonstrated that precision feeding using Electronic Sow Feeders (ESF) during lactation improved weaning weight (5.91 vs. 5.58 kg, p < 0.005) and reduced feed consumption per kg of weaned piglet by 22%. These performance advantages persisted through nursery and growing-finishing periods, providing strong evidence for the long-term benefits of precision feeding technology.
Precision feeding reduces nitrogen excretion primarily by matching protein supply to individual requirements, thereby avoiding excessive protein intake. When dietary protein exceeds the animal’s metabolic needs, the surplus nitrogen is excreted through urine and feces. Pomar et al. (2021)reported that precision feeding can reduce nitrogen excretion by 30% compared to group-phase feeding [18]. Yet how these benefits vary under different feeding intensities and environmental conditions requires further investigation [19]. Gaillard et al. (2020) noted that the goal of precision feeding is to develop diet systems capable of estimating and providing appropriate quantities and compositions adapted to each animal’s daily requirements at the correct time [20]. However, their approach did not fully account for individual variability and temporal dynamic changes. Pomar and Remus (2019) emphasized that traditional feeding strategies typically result in either insufficient nutrition supply and body reserve mobilization, or excessive nutrition supply and high nutrient excretion [21]. Precision feeding addresses this problem by matching nutrient supply to individual daily requirements through real-time monitoring and automated feed blending. This approach reduces protein and phosphorus intake by approximately 25% and decreases both nitrogen and phosphorus excretion by nearly 40%. The resulting cost savings (>8%) mainly come from reduced feed waste, lower labor costs through automation, and early disease detection that minimizes treatment expenses [21]. Despite these advances, most studies still lack comprehensive assessment of animal welfare, environmental impact, and economic benefits [19,22]. Gauthier et al. [23] also acknowledged that existing precision feeding research primarily focuses on endpoint production indicators. Several knowledge gaps remain: the physiological mechanisms linking precision feeding to improved performance, the temporal patterns of sow feeding behavior throughout lactation, how body condition changes over time, and whether these benefits are consistent across different management conditions.
Regarding statistical methodology, precision feeding studies typically employ repeated-measures designs to track individual animal responses over time. Repeated-measures ANOVA and linear mixed-effects models are appropriate analytical tools for such data, as they account for the non-independence of repeated observations on the same subjects [24]. These methods have been widely applied in animal nutrition research to evaluate dietary interventions while controlling for individual variation. Based on this background, this study used field experiments and statistical analysis to examine the optimization effects and mechanisms of intelligent wet feed systems compared to traditional manual dry feed feeding. The study employs linear mixed-effects models to analyze interaction and conditional effects of feed intake, repeated measures mixed-effects models to reveal temporal dynamic change patterns of backfat thickness, and logistic growth models to evaluate differences in piglet growth trajectories. Through multi-level data on sow feeding behavior, backfat thickness, and piglet growth performance, this study seeks to provide scientific evidence and technical support for precision nutrition management in modern pig farms.
2. Materials and Methods
This experiment was conducted from 15 August to 19 September 2024 at a commercial pig farm in Zhaoqing City, Guangdong Province, China. The ambient outdoor temperature during the experimental period ranged from 23.2 °C to 39.5 °C. Environmental conditions within the swine house were systematically monitored throughout the trial. The data recorded were as follows: the average indoor temperature was 26.0 °C (range: 21.8 °C to 29.5 °C); the average relative humidity was 73.46%; the mean NH3 concentration was 8.59 mg/m3 (range: 0.5 mg/m3 to 50 mg/m3); the average PM2.5 concentration was 17.85 μg/m3; and the average air velocity was 1.29 m/s (range: 0.54 m/s to 2.72 m/s). Two standardized pig houses with identical structures were selected for the trial. Each house contained 68 farrowing pens arranged in a 4 × 17 symmetrical layout design (Figure 1). The house dimensions were 31.28 m (length) × 14.76 m (width) × 2.6 m (height), with individual pen specifications of 2.38 m × 1.7 m. Each pen was equipped with one intelligent feeder, and two empty pens were reserved as backups. The experiment employed a randomized controlled trial design with two treatment groups: intelligent wet feed group and manual dry feed group. From an initial cohort of ninety healthy Landrace × Large White crossbred sows that met the preliminary criteria of similar body condition (backfat thickness 22 ± 5 mm) and farrowing time (interval ≤ 1 days), a final group of twenty-two first-parity sows was selected for the core experiment. The stringent selection ensured that all twenty-two sows had given birth to exactly 12 live piglets, with all 12 surviving throughout the trial period. Sows not meeting this strict litter size and survival criterion were excluded. All experimental sows followed unified feeding management standards to ensure consistency and comparability of experimental conditions. To verify the growth performance under different feeding systems, 30 healthy piglets (birth weight 1.2 ± 0.2 kg) were selected from the litters of the experimental sows. Specifically, one or two piglets of average birth weight were selected from each litter. These piglets were then randomly divided into two groups (15 per group), ensuring that littermates were evenly distributed across both the intelligent wet feed and manual dry feed groups. All piglets remained with their biological mothers in the original farrowing pens and were not mixed across litters. The formulation and nutritional composition of the experimental diet are detailed in Appendix A.
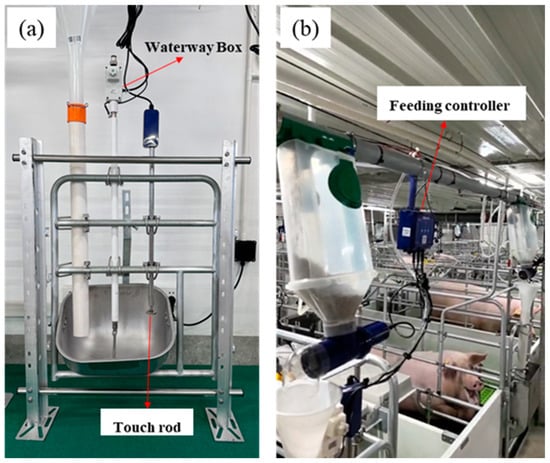
Figure 1.
Intelligent feeding device (a) structure diagram; (b) intelligent feeding equipment on site.
2.1. Experimental Design and Data Quality Control
This study selected 22 multiparous sows and randomly divided them into Manual and Smart groups with 11 sows each. The experimental period lasted 25 days. Data quality standards were established as follows: (1) coefficient of variation for repeated measurements at each detection site < 5%; (2) at least 4 valid measurement time points for each individual.
The experiment adopted standardized feeding management protocols simulating commercial pig farms, with three daily feedings scheduled at 07:00, 10:30, and 16:30. Experimental sows were transferred to the trial facility 2 days before expected farrowing for environmental adaptation. Feeding was suspended on farrowing day and resumed on the first day postpartum when data collection began. To prevent interference from wet feed spoilage on experimental results, designated personnel cleaned feed troughs and weighed remaining feed after each feeding session.
Intelligent Feeding Group: Each pen was equipped with one intelligent precision feeding device. (Custom-built prototype, South China Agricultural University, Guangzhou, China). The system automatically executed feeding programs based on preset dynamic feeding curves for lactating sows according to day of lactation, as shown in Figure 2. Considering the ad-verse effects of high summer temperatures on sow feeding behavior, a “40–30–40%” meal distribution ratio was adopted while maintaining constant daily feed allocation: breakfast (07:00) and dinner (16:30) each accounted for 40% of daily feed allocation, while lunch (10:30) accounted for 30%. When the feeding program was initiated, the device first dispensed 100 g of appetizing feed to encourage sow feeding behavior. When sows activated the trigger lever by rooting, the system activated wet feed mode, automatically dispensing 200 g of feed and 500 mL of clean water per trigger, with a water-to-feed ratio of 2.5:1. When the mixed feed in the trough reached the preset feed level probe height, the system automatically stopped dispensing to prevent feed waste. To ensure dispensing accuracy, calibration tests were conducted at the first and last pens of each row in the feed delivery pipeline before the experiment and were repeated weekly throughout the trial period. The linear relationship between screw conveyor quantitative rotation cycles and actual feed output was determined, controlling dispensing accuracy within an allowable error range of ±5%. To ensure accurate comparison between dry and wet feeding treatments, all feed intake measurements were corrected to a dry matter (DM) basis. Feed samples were collected weekly from both feeding groups and dried in a forced-air oven at 105 °C for 24 h until constant weight was achieved to determine DM content. The average DM content of dry feed was 88.3 ± 0.6%, while the mixed wet feed (at water-to-feed ratio of 2.5:1) had a DM content of 25.2 ± 0.4%. Daily feed intake was calculated as follows: DM intake (kg/d) = As-fed intake (kg/d) × DM percentage. All subsequent analyses of feed intake, feed conversion ratio, and feeding efficiency were based on DM intake to eliminate the confounding effect of moisture content differences between the two feeding methods.
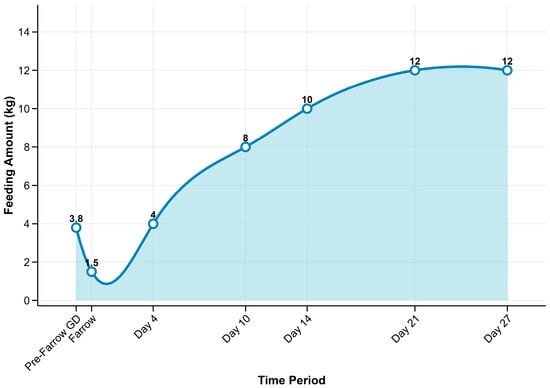
Figure 2.
Dynamic feeding curve.
Manual Feeding Group: Standard quantitative buckets were used for manual feeding. The same dynamic feeding curve was followed to deliver an equivalent dry matter allocation. Farm personnel strictly executed the feeding operations, maintaining feed in a dry condition. Remaining feed was processed following standardized procedures after each meal, with a weighing accuracy of ±1 g.
2.2. Data Collection and Measurement Procedures
Feed consumption was measured using a high-precision electronic scale (precision ± 1 g) at three daily meals (07:00, 10:30, 16:30). Feed intake was recorded for 30 min after each meal (Table 1).

Table 1.
Instruments and equipment used in this study.
2.2.1. Efficiency Index Definition and Calculation
(1) Feed Intake Response Coefficient: Quantifies the change in feed intake per unit increase in feed supply, estimated using a linear mixed-effect model [25].
The feed intake response coefficients for each group were calculated as follows:
where β1 represents the baseline response coefficient for the manual feeding group, and β3 represents the additional effect contributed by the smart feeding system.
Smart group: β1 + β3
Group difference: β3
(2) Feed Supply Percentile Selection Criteria: Based on sow lactation physiology, analyses were conducted at three key lactation stages: the 20th percentile (early lactation), 40th percentile (mid-lactation), and 75th percentile (peak lactation) [26].
(3) Basic calculation formulas:
Daily feed intake was calculated as the sum of three meal intakes, where represents the response coefficient.
2.2.2. Backfat Thickness Measurement and Performance Indicators
Backfat thickness was measured using a Muside Ultrasonic Veterinary Backfat Meter. Measurements were taken at points 3–4 cm from the dorsal midline at the last rib, three times every three days throughout the 26-day trial period, with three readings averaged per location.
Performance Indicator Calculations
2.2.3. Growth Performance Indicators
Thirty pigs were randomly selected as fixed measurement subjects. Weights were measured on days 2, 7, 14, and 21.
Growth performance calculations:
where
: average daily gain (g/day)
: weight on day 21 (g)
: initial weight (g)
: average litter weight (kg)
: total litter weight (kg)
: trial days
2.3. Statistical Analysis Methods
Statistical analyses were performed using R (version 4.5.0). Shapiro–Wilk test was employed to assess data normality, and Levene’s test was used to evaluate homogeneity of variance.
2.3.1. Feed Intake Mixed-Effect Model Analysis
A linear mixed-effect model was employed to analyze treatment effects and interaction effects [27]:
: daily feed intake for the jth observation in column i (g)
centralized feed supply amount (g)
: Processing group (Manual vs. Smart)
: Pen random effect
: Residual term
Main effects: (feed amount effect) and (treatment group effect).
Interaction effect: (group × feed amount interaction),which reflects how the relationship between feed supply and daily intake differs between treatment groups. Model fit evaluation:
where represents the marginal R2 (variance explained by fixed effects only), and represents the conditional R2 (variance explained by both fixed and random effects); both and were reported to evaluate model fit [28].
2.3.2. Statistical Analysis of Backfat Thickness
Analysis of covariance (ANCOVA) was performed using initial backfat thickness as a covariate to control for baseline differences:
is backfat loss, is treatment group effect, is covariate regression coefficient, is initial backfat thickness.
Distribution difference analysis employed χ2 tests and Fisher’s exact tests. Fisher’s exact test results were prioritized when expected frequencies were small [29,30].
2.3.3. Nonlinear Model Analysis of Piglet Growth
A mixed-effects logistic model was used to fit piglet growth curves:
where is body weight (kg) at t days of age, is asymptotic weight (kg) reflecting growth potential, is the growth inflection time (days) representing the age at which maximum growth rate occurs [31,32], and is the scale parameter.
3. Results
3.1. Descriptive Analysis of Feeding Behavior
Figure 3 showed the dynamic changes in feeding behavior between the two treatment groups during the 25-day trial period. Both groups reached peak feed intake during the mid-trial period (days 10–20), followed by a slight decline. The intelligent wet feed group exhibited a relatively stable feeding curve, while the manual dry feed group showed greater fluctuations in the later period.
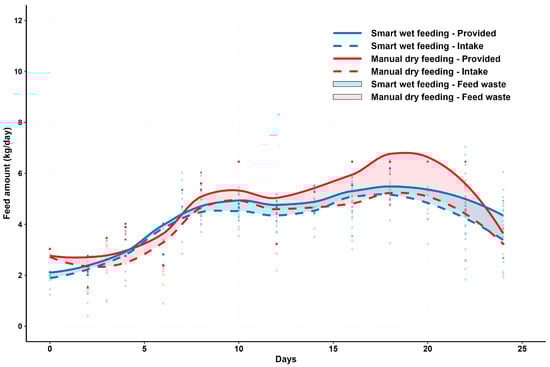
Figure 3.
Dynamic changes in feeding behavior during 25-day trial period.
Clear differences existed in the relationship between feed provision and feed intake between the two groups. The intelligent group showed closer alignment between feed provision and feed intake curves, indicating higher feed utilization efficiency. In contrast, the manual group demonstrated significantly higher feed provision than feed intake, suggesting considerable feed waste.
Figure 4 presents descriptive statistics for the main indicators of both treatment groups. The intelligent wet feed group had an average daily feed provision of 4085.2 ± 1461.6 g, slightly lower than the manual dry feed group (4509.7 ± 1774.2 g). For feed intake, the intelligent group achieved 3649.9 ± 1475.6 g/d, while the manual group reached 3833.1 ± 1519.2 g/d. In terms of feed efficiency, the intelligent wet feed group demonstrated higher efficiency (88.2% vs. 86.5%, p = 0.002) and significantly lower feed waste compared to the manual group (435.3 ± 611.7 g/d vs. 676.6 ± 838.6 g/d, p < 0.001).
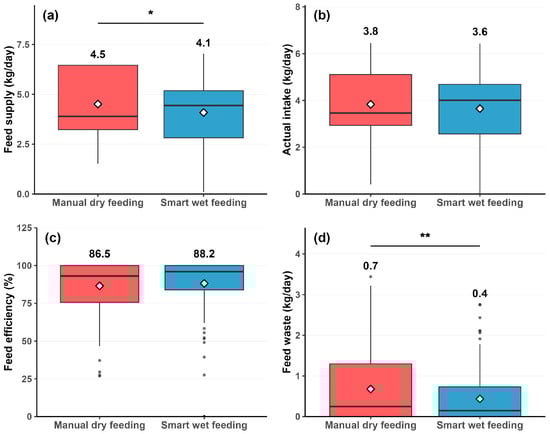
Figure 4.
Descriptive statistics of main feeding indicators by treatment group. (a) Daily feed supply; (b) Actual feed intake; (c) Feed efficiency; and (d) Feed waste.* indicates p < 0.05; ** indicates p < 0.01.
3.1.1. Feed Provision-Feed Intake Correlation Analysis
Scatter plot analysis revealed a strong linear relationship between feed provision and feed intake (overall r = 0.891, p < 0.001). Grouped analysis showed correlation coefficients of r = 0.882 for the Manual group and r = 0.913 for the Smart group, with both groups meeting linear assumption requirements. The test of slope homogeneity revealed a highly significant interaction effect between group and feed provision (χ2 = 11.295, p < 0.001), indicating significant differences in feed provision-intake response efficiency between the two groups (Figure 5).
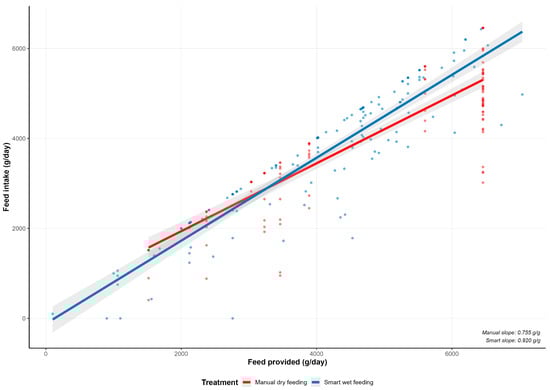
Figure 5.
Correlation analysis between feed provision and feed intake.
3.1.2. Mixed-Effects Model Analysis and Conditional Effects Analysis
Model comparison showed that the interaction model significantly outperformed the main effects model (ΔAIC = −9.29), with excellent model fit (marginal R2 = 0.803, conditional R2 = 0.810). Significant differences existed in feed provision-intake response coefficients between groups: Manual group 0.755 g/g, Smart group 0.920 g/g, with a difference of 0.165 g/g (95% CI: 0.069, 0.261). This indicated that the Smart system demonstrated 21.8% higher response efficiency, achieving significantly greater feed intake response under equivalent feed provision increases (Figure 6).
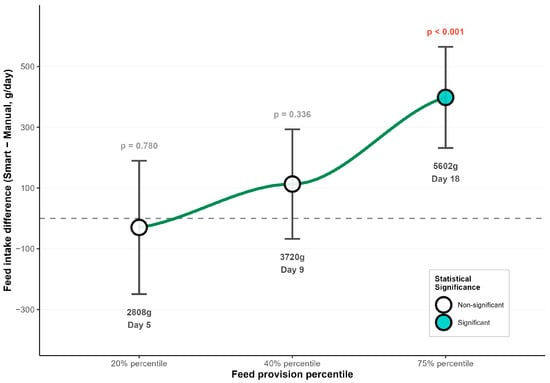
Figure 6.
Conditional effects of treatment on feed intake across feed provision levels.
Conditional effects analysis revealed significant differences in the advantages of intelligent wet feeding over manual dry feeding across different feed provision levels. The analysis was conducted based on three representative percentiles of feed provision, corresponding to different stages of lactation: 20th percentile (early lactation), 40th percentile (mid-lactation), and 75th percentile (peak lactation).
At lower feed provision levels, treatment differences were small and non-significant. For example, at the 20th percentile (3003 g/day), intelligent feeding resulted in a slight decrease in feed intake of −29.8 g/day (95% CI: −238.9 to +179.3). This difference was not statistically significant (p = 0.780), with a negligible effect size (Cohen’s d = 0.05). At the 40th percentile (3870 g/day), the Smart group showed slightly higher feed intake than the Manual group (+113.0 g/day, 95% CI: −62.6 to +288.6, p = 0.210, Cohen’s d = 0.17), but the difference remained non-significant. However, at the 75th percentile (5602 g/day, corresponding to peak lactation), intelligent wet feeding demonstrated significant advantages over manual dry feeding (+398.4 g/day, 95% CI: +182.6 to +614.2, p < 0.001, Cohen’s d = 0.61). This represents a moderate effect size, indicating that intelligent feeding enabled sows to achieve approximately 400 g/day additional feed intake during peak lactation.
The conditional effects pattern was consistent with feed provision-intake response efficiency analysis results, with intelligent feeding (0.920 g/g) showing superior response efficiency compared to manual feeding (0.755 g/g). Treatment effects gradually increased from low to high feed provision levels, indicating that the advantages of intelligent wet feeding became more pronounced as nutritional demands increased.
3.1.3. Individual Feeding Behavior Analysis
To address potential concerns regarding individual behavioral variation, we conducted a comprehensive individual-level analysis of feeding patterns across all sows within each treatment group (Figure 7). Individual-level analysis revealed consistent feeding patterns across all sows within each treatment group. The between-individual coefficient of variation was low and comparable between the Smart wet feeding group (CV = 5.1%) and the Manual dry feeding group (CV = 5.9%), indicating similar levels of individual variability. Outlier analysis using the 1.5 × IQR criterion identified no outliers in either group (0/11 in both Smart and Manual groups), confirming that the observed treatment effects were not driven by extreme individual values.
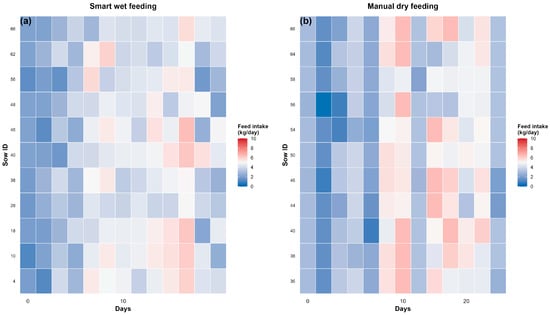
Figure 7.
Individual feeding trajectories of lactating sows.
The variance homogeneity test (F-test) showed no significant difference in individual variation between groups (F = 0.76, p = 0.676), indicating comparable within-group variability. Individual-level t-test comparing the mean intake of each sow between groups showed no significant difference (t = 0.71, df = 19.6, p = 0.487, Cohen’s d = 0.30), suggesting that the treatment effects observed in other parameters were not confounded by baseline differences in individual feeding capacity.
3.2. Backfat Thickness Change Analysis
Data quality testing showed that Levene’s test confirmed good homogeneity of variance between groups for all indicators (p > 0.05). Shapiro–Wilk tests revealed that some indicators deviated from normal distribution, but considering the sample size and robustness of t-tests, parametric testing methods were continued (Figure 8).
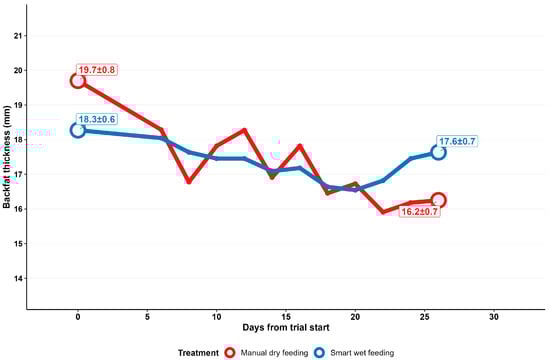
Figure 8.
Changes in backfat thickness during lactation period by treatment group.
The two groups of sows exhibited distinctly different backfat change patterns throughout lactation. The Manual group demonstrated typical lactation negative energy balance characteristics, with backfat thickness continuously declining from 19.7 ± 0.8 mm to 16.2 ± 0.7 mm, showing a clear linear decline trend. This sustained body condition loss reflected that traditional scheduled feeding strategies could not effectively match the dynamic nutritional requirements of sows during lactation, forcing sows to mobilize body reserves to maintain milk production, resulting in continuous body condition deterioration. In contrast, the Smart group maintained relatively stable backfat thickness, declining only slightly from 18.3 ± 0.6 mm to 17.6 ± 0.7 mm, demonstrating significant body condition maintenance effects. This stable backfat change pattern indicated that the intelligent wet feeding system could effectively alleviate negative energy balance during lactation through precise nutrient supply and dynamic adjustments, better maintaining sow body condition stability. No significant differences existed in initial backfat thickness between groups (p = 0.232), but final backfat thickness differences approached significance (p = 0.051). Notably, during mid to late lactation (days 15–25), differences between groups gradually enlarged, with the Smart group even showing slight body condition recovery trends while the Manual group continued declining.
Statistical analysis revealed highly significant differences in backfat loss between groups. Smart group total backfat loss was significantly lower than the Manual group (0.64 ± 1.43 mm vs. 3.64 ± 2.34 mm, t = 3.631, df = 20, p = 0.002, 95% CI: 1.28–4.72 mm). Effect size analysis indicated this was a very large effect (Cohen’s d = 1.548) with important biological significance. The intelligent feeding system relatively reduced backfat loss by 82.5%, and this significant body condition protection effect has important practical value for sow reproductive performance and subsequent production cycles (Figure 9).
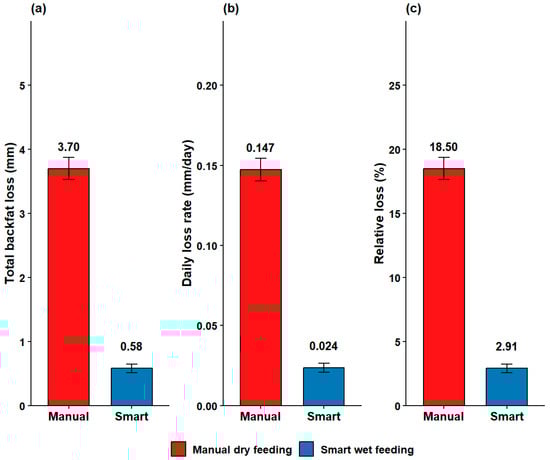
Figure 9.
Comparison of backfat loss indicators between manual dry feeding and smart wet feeding systems during lactation. (a) Total backfat loss; (b) Daily loss rate; (c) Relative loss percentage. Error bars represent standard error of the mean.
To comprehensively evaluate the impact of feeding systems, multiple dimensions of loss indicators were analyzed. Daily backfat loss rate analysis revealed that the Manual group had 0.145 mm/day while the Smart group had only 0.024 mm/day, with highly significant differences (t = 3.689, p = 0.002). The Smart group showed an 83.2% reduction in daily loss rate compared to the Manual group.
Relative loss analysis eliminated the influence of individual baseline differences. The Manual group lost 18.1% of initial backfat while the Smart group lost only 3.4%, with highly significant differences between groups (t = 3.967, p = 0.001, Cohen’s d = 1.692). The Smart group showed an 81.1% reduction in relative loss compared to the Manual group. All three-dimensional indicators demonstrated that the intelligent feeding system could significantly reduce sow backfat loss, confirming the beneficial effects of this system on sow body condition maintenance.
ANCOVA analysis further validated the robustness of results. After controlling for initial backfat thickness effects, treatment group effects remained highly significant (F = 17.351, df = 1.19, p < 0.001). The adjusted between-group difference was 2.46 mm (SE = 0.747, p = 0.004), confirming the independence of the intelligent feeding system’s backfat protection effects.
Backfat loss distribution analysis revealed significant differences between groups. Analysis by loss severity showed that in the Manual group, 4 sows (36.4%) had losses ≤ 2 mm, 3 sows (27.3%) had losses of 2–3 mm, and 4 sows (36.4%) had losses > 3 mm. In the Smart group, all 11 sows (100%) had losses ≤ 2 mm, with none showing losses > 2 mm. Fisher’s exact test demonstrated highly significant differences in loss distribution between groups (p = 0.002) (Figure 10).
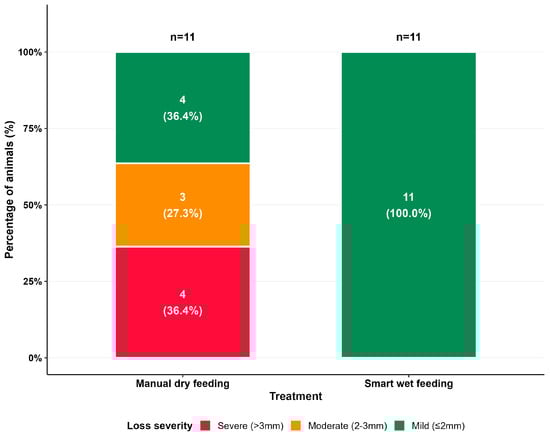
Figure 10.
Distribution of backfat loss severity in sows under different feeding systems during lactation. Loss categories: severe (>3 mm), moderate (2–3 mm), and mild (≤2 mm).
3.3. Piglet Growth Performance
Initial weight testing showed good baseline balance between groups (Smart group 1.80 ± 0.17 kg vs. Manual group 1.89 ± 0.18 kg, t = 1.539, df = 28, p = 0.135), ensuring the validity of subsequent comparisons. Both groups exhibited typical S-shaped growth curve characteristics. The Smart group demonstrated sustained weight advantages throughout the observation period, with advantages gradually expanding as age increased. During the initial trial phase (days 2–7), weights were comparable between groups. From day 11 onwards, Smart group advantages gradually emerged. By day 21, between-group differences reached maximum values. Instantaneous growth rate analysis revealed significant differences between groups. Based on the logistic model, the Smart group achieved peak growth rates of 0.276 ± 0.018 kg/day, significantly higher than the Manual group’s 0.242 ± 0.015 kg/day, representing a 14.2% improvement (t = 2.89, p = 0.008, Cohen’s d = 1.05). Importantly, the Smart group’s peak occurrence coincided with its inflection point (17.2 days of age), while the Manual group peak occurred at 19.2 days of age, indicating that the Smart group’s growth peak occurred approximately two days earlier.
The Smart group achieved an average 21-day weight of 7.06 ± 0.12 kg, significantly higher than the Manual group’s 6.67 ± 0.11 kg (t = 2.45, df = 28, p = 0.021), representing a 5.8% relative improvement with moderate effect size (Cohen’s d = 0.89). Weight development comparisons at various time points showed that Smart group advantages emerged from day 11, reached significance at day 17 (5.22 ± 0.13 kg vs. 4.69 ± 0.11 kg, p = 0.005), with differences further expanding by day 21 (Figure 11).
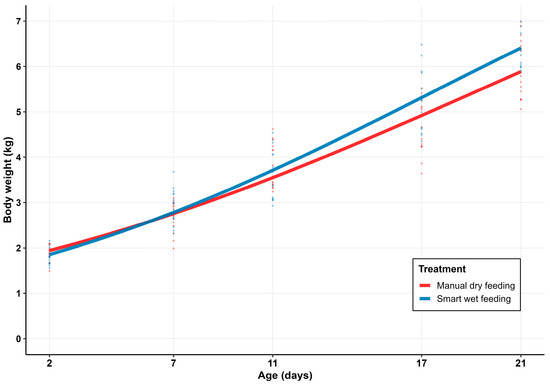
Figure 11.
Comparison of piglet growth curves between manual and smart feeding treatments.
Model parameter comparisons revealed fundamental differences in growth characteristics between groups. Asymptotic weight parameters indicated comparable growth potential between groups (Smart group 10.71 ± 0.48 kg vs. Manual group 10.90 ± 0.45 kg, p = 0.782). However, significant differences existed in growth inflection timing, with the Smart group showing significantly earlier inflection points (17.2 ± 1.1 days vs. 19.2 ± 1.2 days, p = 0.035), representing a 10.6% relative advancement, indicating that intelligent feeding significantly promoted earlier initiation of rapid growth phases.
Intrinsic growth rate parameter K value analysis showed numerically higher values for the Smart group (0.103 ± 0.009 vs. 0.089 ± 0.008 day−1, 16.1% relative increase), but differences did not reach statistical significance (p = 0.083), possibly related to sample size limitations. The Smart group demonstrated significantly superior data fitting characteristics. Coefficient of determination analysis showed the Smart group achieved R2 of 0.955 ± 0.008, significantly higher than the Manual group’s 0.893 ± 0.012 (p = 0.048), representing a 6.9% improvement. More importantly, root mean square error analysis showed the Smart group RMSE of 0.365 ± 0.022 kg was significantly lower than the Manual group’s 0.496 ± 0.028 kg (p < 0.001), representing a 26.2% relative reduction, indicating that Smart group growth trajectories exhibited stronger predictability and smaller inter-individual variation.
Comprehensive analysis indicated that the intelligent wet feeding system not only significantly improved piglet growth performance but also optimized growth rhythms, enabling piglets to enter rapid growth phases earlier and maintain more stable and efficient weight gain patterns during critical developmental stages (Table 2).
Table 2.
Comparison of piglet growth performance and logistic model parameters between feeding treatments. * p < 0.05.
4. Discussion
The intelligent wet feeding system improved feed conversion efficiency from 0.755 g/g to 0.920 g/g, showing considerable improvement compared to conventional dry feeding. This improvement is consistent with previous research on wet feeding systems in pig production [33] and is particularly relevant for modern high-yielding sows, which often face severe energy deficits. The intelligent wet feeding system delivers a highly palatable diet with precise and timely provision, which may optimize nutrient intake and utilization. Previous studies have reported that liquid feeding increases average daily gain and improves the digestibility of dry matter, gross energy, and crude protein compared to dry feeding. The physical properties of wet feed may enhance digestive enzyme activity and nutrient absorption, potentially contributing to the improved feed conversion efficiency. Additionally, sows in the Manual dry feeding group obtained water separately through nipple drinkers, whereas sows in the Smart wet feeding group received water integrated with feed. This difference in water delivery may have influenced feeding behavior and total fluid intake, which warrants consideration when interpreting the results.
The conditional effects analysis showed that at the 75th percentile feed supply level (5602 g/day), the Smart group consumed 398.4 g/day more than the Manual group. This difference is particularly important during peak lactation (15–18 days postpartum) when nutritional requirements are highest. These observed improvements represent the combined effects of both intelligent feeding control and wet feed properties, and the current experimental design cannot separate the relative contribution of each factor. The observed feed intake in both groups was relatively lower than values reported for multiparous sows, likely because primiparous sows were used in this study. With previous research showing that primiparous sows consumed only 4.5 kg/day compared to 7.2 kg/day in second-parity sows [34].
Several factors may contribute to the observed differences between groups. The intelligent system optimized nutrient delivery timing, which may enhance digestive rhythms and improve nutrient utilization [35]. The automated system also reduced feed waste and oxidative loss, preserving nutritional value [36]. Wet feeding improves palatability, reduces dust, and enhances chewing and saliva production, all of which may improve digestibility.
Individual-level analysis was conducted to examine whether treatment effects were confounded by individual behavioral variation. The between-individual coefficient of variation was low and comparable between the Smart wet feeding group (CV = 5.1%) and the Manual dry feeding group (CV = 5.9%). No outliers were identified in either group using the 1.5 × IQR criterion (0/11 in both groups). The F-test showed no significant difference in variance between groups (F = 0.76, p = 0.676). The individual-level t-test also showed no significant baseline differences in feeding capacity (t = 0.71, df = 19.6, p = 0.487, Cohen’s d = 0.30). These results indicate that individual behavioral differences did not confound the treatment effects.
Backfat loss during lactation indicates energy balance status and affects both current and future reproductive performance. Backfat loss in the Smart group was 0.64 ± 1.43 mm, significantly lower than the 3.64 ± 2.34 mm in the Manual group, representing an 82.5% reduction. This finding is consistent with previous research on the negative effects of excessive backfat loss on reproduction. Lactation weight loss affects weaning-to-service intervals, with best performance when weight loss is below 5% [37].
Excessive body reserve loss during lactation reduces reproductive efficiency. Schenkel et al. studied 1222 first-parity sows and found that sows with body weight loss > 10%, body protein loss > 10%, or body fat loss > 20% had significantly smaller litters in the second parity [37]. Sows maintaining backfat thickness ≥ 16 mm at weaning had significantly larger subsequent litters. The approximately 0.64 mm backfat loss in the Smart group falls within recommended ranges, suggesting potential benefits of the intelligent wet feeding approach. The improved backfat preservation in the Smart group is associated with precise and timely nutrient supply. Sows with backfat thickness < 17.00 mm before farrowing experience longer weaning-to-estrus intervals, lower milk production, and reduced piglet survival [38]. The intelligent system monitors and adjusts feeding in real-time, matching nutritional requirements across lactation stages and preventing metabolic problems from inadequate or excessive nutrient supply. All sows (100%) in the Smart group maintained backfat loss ≤ 2 mm, compared to 36.4% in the Manual group with loss > 3 mm. This indicates reduced variation and improved consistency. These improvements may result from combined effects of the intelligent feeding algorithm and the wet feed form. Future factorial studies are needed to separate these contributions.
A major limitation is that the intelligent wet feeding system differs from traditional manual feeding in two ways: feeding method (intelligent vs. manual) and feed form (wet vs. dry). This design cannot determine whether improvements in feed intake (398.4 g/day) and feed conversion efficiency (21.8%) are primarily due to the intelligent feeding algorithm, or wet feed properties, or their interaction.
Factorial experiments comparing intelligent wet feeding, manual wet feeding, intelligent dry feeding, and manual dry feeding are needed to separate these effects.
Other limitations include the short observation period (25–26 days), which did not allow assessment of long-term effects on subsequent reproductive cycles, and the small sample size (11 sows per group), which may affect precision of parameter estimates. Application of these results to different climates, genetic lines, and management systems requires validation. The mixed-effects model controlled for pen clustering effects (ICC = 0.033), and Bonferroni correction ensured statistical rigor. Future studies should use advanced analytical approaches, including Bayesian methods or machine learning algorithms, to capture nonlinear relationships and interaction effects. To evaluate the independent effects of intelligent feeding technology, future research should use a 2 × 2 factorial design (feeding method × feed form). Comparing intelligent wet feeding with manual wet feeding would isolate the contribution of the intelligent algorithm. Comparing intelligent dry feeding with intelligent wet feeding would quantify the independent effect of feed form. Such experiments would clarify mechanisms behind the observed improvements.
Future research should focus on (1) large-scale, multi-site trials to evaluate applicability under different production conditions; (2) extended observation periods covering entire reproductive cycles; (3) machine learning and advanced sensors for real-time prediction of individual nutrient requirements; (4) economic feasibility and return on investment; and (5) environmental sustainability, particularly reduced nutrient excretion and waste management [39]. These directions will advance precision livestock farming and contribute to more sustainable pig production systems.
5. Conclusions
This study compared an intelligent wet feeding system with traditional manual dry feeding in lactating primiparous sows.
Sows in the Smart wet feeding group showed higher feed conversion efficiency, with marginal conversion efficiency of 0.920 g/g compared to 0.755 g/g in the Manual dry feeding group. Conditional effects analysis showed that at high feed supply levels, an additional 398.4 g/day feed intake was observed during peak lactation, precisely matching the dynamic nutritional requirements of sows.
The Smart group showed backfat loss of 0.64 ± 1.43 mm, compared with 3.64 ± 2.34 mm in the Manual group. All sows in the Smart group maintained losses ≤ 2 mm, suggesting improved energy balance status and consistency.
Piglet 21-day weights were 5.8% higher in the Smart group, and the asymptotic weight and growth magnitude were also higher. These differences may reflect improved maternal nutritional status, though other factors cannot be excluded.
These results suggest that the intelligent wet feeding system is associated with improved lactating sow performance and early piglet growth. However, because the system combines intelligent feeding control with wet feed delivery, the current study cannot determine the relative contribution of each factor. Additionally, the small sample size (n = 11 per group) and short observation period (25–26 days) limit the generalizability of these findings. Future research using factorial designs and larger sample sizes is needed to separate these effects and validate the applicability of this technology under diverse production conditions.
Author Contributions
Q.D.: writing—original draft, writing—review and editing, conceptualization, methodology, investigation, data curation, software, formal analysis, validation, resources. Z.Z.: writing—review and editing, supervision, conceptualization, resources, funding acquisition. G.C.: investigation, data curation, software, formal analysis, resources, conceptualization, funding acquisition. E.L.: data curation, investigation, methodology, software. J.X.: data curation, investigation, methodology, software. W.L.: data curation, resources, investigation, review. Z.M.: investigation, data curation, formal analysis, resources. All authors have read and agreed to the published version of the manuscript.
Funding
This research was funded by the Special Fund for the Rural Revitalization Strategy of Guangdong (2025TS-3), Guangdong Modern Agricultural Industry Technology System Innovation Team Building Project (2024CXTD02), Key Laboratory of Modern Agricultural Intelligent Equipment in South China, Ministry of Agriculture and Rural Affairs, China (HNZJ202209), Guangzhou Key Research and Development Project (2023B03J1363), Guangzhou Basic and Applied Research Project (2023A04J0752), Shanwei Science and Technology Plan Project (2023A009), Ministry of Education Humanities and Social Sciences Research Project (24YJA760032), Guangdong Education and Research Project (2024GXJK374), Independent Research Project of Maoming Laboratory (2021ZZ003, 2021TDQD002), and Fundamental Research Funds for the State Key Laboratory of the Swine and Poultry Breeding Industry (ZQQZ-25, 2023QZ-NK16).
Data Availability Statement
The data that support the findings of this study are available from the corresponding author, upon reasonable request and with the permission of the collaborating commercial pig farm. The data are not publicly available due to restrictions imposed by the commercial cooperation agreement and privacy concerns regarding the operation of the commercial farm.
Acknowledgments
We acknowledge Guangzhou Jiaen Technology Co., Ltd. for the materials and facilities.
Conflicts of Interest
The authors declare no conflicts of interest.
Appendix A
Table A1.
Nutrient composition of the S516 lactating sow premix.
Table A1.
Nutrient composition of the S516 lactating sow premix.
| Nutrient | Unit | Content/Guaranteed Value |
|---|---|---|
| Vitamins | ||
| Vitamin A | IU | 80,000–140,000 |
| Vitamin D3 | IU | 25,000–70,000 |
| Vitamin E | IU | 900–2400 |
| Vitamin K3 | mg | ≥40 |
| Vitamin B2 | mg | ≥160 |
| Vitamin B6 | mg | ≥95 |
| Niacinamide | mg | ≥740 |
| Calcium Pantothenate | mg | ≥400 |
| Folic Acid | mg | ≥100 |
| Biotin | mg | ≥14 |
| Choline Chloride | g | ≥12 |
| Minerals | ||
| Copper (Cu) | g | 0.1–0.5 |
| Iron (Fe) | g | 1–6 |
| Zinc (Zn | g | 0.8–2 |
| Manganese (Mn) | g | 0.4–1.2 |
| Iodine (I) | mg | 10–50 |
| Selenium (Se) | mg | 2–10 |
| Calcium (Ca) | % | 9–16 |
| Phosphorus (P) | % | 1.5–4 |
| Amino Acids | ||
| Lysine | % | ≥2.5 |
References
- Sossidou, E.N.; Banias, G.F.; Batsioula, M.; Termatzidou, S.-A.; Simitzis, P.; Patsios, S.I.; Broom, D.M. Modern Pig Production: Aspects of Animal Welfare, Sustainability and Circular Bioeconomy. Sustainability 2025, 17, 5184. [Google Scholar] [CrossRef]
- Tokach, M.D.; Menegat, M.B.; Gourley, K.M.; Goodband, R.D. Review: Nutrient Requirements of the Modern High-Producing Lactating Sow, with an Emphasis on Amino Acid Requirements. Animal 2019, 13, 2967–2977. [Google Scholar] [CrossRef] [PubMed]
- Gauthier, R.; Largouet, C.; Bussieres, D.; Martineau, J.-P.; Dourmad, J.-Y. Precision Feeding of Lactating Sows: Implementation and Evaluation of a Decision Support System in Farm Conditions. J. Anim. Sci. 2022, 100, skac222. [Google Scholar] [CrossRef]
- Kim, J.S.; Yang, X.; Baidoo, S.K. Relationship between Body Weight of Primiparous Sows during Late Gestation and Subsequent Reproductive Efficiency over Six Parities. Asian-Australas. J. Anim. Sci. 2016, 29, 768–774. [Google Scholar] [CrossRef]
- Thongkhuy, S.; Chuaychu, S.H.B.; Burarnrak, P.; Ruangjoy, P.; Juthamanee, P.; Nuntapaitoon, M.; Tummaruk, P. Effect of Backfat Thickness during Late Gestation on Farrowing Duration, Piglet Birth Weight, Colostrum Yield, Milk Yield and Reproductive Performance of Sows. Livest. Sci. 2020, 234, 103983. [Google Scholar] [CrossRef]
- Rooney, H.B.; O’driscoll, K.; O’doherty, J.; Lawlor, P.G. Effect of Increasing Dietary Energy Density during Late Gestation and Lactation on Sow Performance, Piglet Vitality, and Lifetime Growth of Offspring. J. Anim. Sci. 2020, 98, skz379. [Google Scholar] [CrossRef] [PubMed]
- Qazi, S.; Khawaja, B.A.; Farooq, Q.U. IoT-Equipped and AI-Enabled next Generation Smart Agriculture: A Critical Review, Current Challenges and Future Trends. IEEE Access 2022, 10, 21219–21235. [Google Scholar] [CrossRef]
- Tedeschi, L.O.; Greenwood, P.L.; Halachmi, I. Advancements in Sensor Technology and Decision Support Intelligent Tools to Assist Smart Livestock Farming. J. Anim. Sci. 2021, 99, skab038. [Google Scholar] [CrossRef]
- Michie, C.; Andonovic, I.; Davison, C.; Hamilton, A.; Tachtatzis, C.; Jonsson, N.; Duthie, C.-A.; Bowen, J.; Gilroy, M. The Internet of Things Enhancing Animal Welfare and Farm Operational Efficiency. J. Dairy Res. 2020, 87, 20–27. [Google Scholar] [CrossRef]
- Marić, K.; Gvozdanović, K.; Djurkin Kušec, I.; Kušec, G.; Margeta, V. Smart Pig Farms: Integration and Application of Digital Technologies in Pig Production. Agriculture 2025, 15, 937. [Google Scholar] [CrossRef]
- Kleen, J.L.; Guatteo, R. Precision Livestock Farming: What Does It Contain and What Are the Perspectives? Animals 2023, 13, 779. [Google Scholar] [CrossRef]
- Jiang, B.; Tang, W.; Cui, L.; Deng, X. Precision Livestock Farming Research: A Global Scientometric Review. Animals 2023, 13, 2096. [Google Scholar] [CrossRef] [PubMed]
- Kim, J.; Hosseindoust, A.; Hyup, L.S.; Han, C.Y.; Suk, N.H.; Jo, C.B. Effect of Dry, Wet and Liquid Feeding on the Performance, Digestibility and Carcass Characteristics of Growing Pigs. Ann. Anim. Resour. Sci. 2015, 26, 101–109. [Google Scholar] [CrossRef]
- Xia, J.; Xu, J.; Zeng, Z.; Lv, E.; Wang, F.; He, X.; Li, Z. Development of a Precision Feeding System with Hierarchical Control for Gestation Units Using Stalls. Appl. Sci. 2023, 13, 12031. [Google Scholar] [CrossRef]
- He, X.; Zeng, Z.; Liu, Y.; Lyu, E.; Xia, J.; Wang, F.; Luo, Y. An Internet of Things-Based Cluster System for Monitoring Lactating Sows’ Feed and Water Intake. Agriculture 2024, 14, 848. [Google Scholar] [CrossRef]
- Chen, C.; Liu, X.; Liu, C.; Pan, Q. Development of the Precision Feeding System for Sows via a Rule-Based Expert System. Int. J. Agric. Biol. Eng. 2023, 16, 187–198. [Google Scholar] [CrossRef]
- Aparicio-Arnay, M.; Yeste-Vizcaíno, N.; Soria, N.; Cambra, J.; Isabel, B.; Piñeiro, C.; Gonzalez-Bulnes, A. Precision Feeding in Lactating Sows Improves Growth Performance and Carcass Quality of Their Progeny. Agriculture 2025, 15, 887. [Google Scholar] [CrossRef]
- Pomar, C.; Andretta, I.; Remus, A. Feeding Strategies to Reduce Nutrient Losses and Improve the Sustainability of Growing Pigs. Front. Vet. Sci. 2021, 8, 742220. [Google Scholar] [CrossRef]
- Andretta, I.; Hickmann, F.M.W.; Remus, A.; Franceschi, C.H.; Mariani, A.B.; Orso, C.; Kipper, M.; Letourneau-Montminy, M.-P.; Pomar, C. Environmental Impacts of Pig and Poultry Production: Insights from a Systematic Review. Front. Vet. Sci. 2021, 8, 750733. [Google Scholar] [CrossRef] [PubMed]
- Gaillard, C.; Quiniou, N.; Gauthier, R.; Cloutier, L.; Dourmad, J.-Y. Evaluation of a Decision Support System for Precision Feeding of Gestating Sows. J. Anim. Sci. 2020, 98, skaa255. [Google Scholar] [CrossRef]
- Pomar, C.; Remus, A. Precision Pig Feeding: A Breakthrough toward Sustainability. Anim. Front. 2019, 9, 52–59. [Google Scholar] [CrossRef]
- Dambaulova, G.K.; Madin, V.A.; Utebayeva, Z.A.; Baimyrzaeva, M.K.; Shora, L.Z. Benefits of Automated Pig Feeding System: A Simplified Cost–Benefit Analysis in the Context of Kazakhstan. Vet. World 2023, 16, 2205–2209. [Google Scholar] [CrossRef]
- Gauthier, R.; Largouet, C.; Gaillard, C.; Cloutier, L.; Guay, F.; Dourmad, J.-Y. Dynamic Modeling of Nutrient Use and Individual Requirements of Lactating Sows. J. Anim. Sci. 2019, 97, 2822–2836. [Google Scholar] [CrossRef]
- Lee, U.; Garcia, T.P.; Carroll, R.J.; Gilbreath, K.R.; Wu, G. Analysis of Repeated Measures Data in Nutrition Research. Front. Biosci. 2019, 24, 1377–1389. [Google Scholar] [CrossRef]
- Sánchez, J.P.; Ragab, M.; Quintanilla, R.; Rothschild, M.F.; Piles, M. Genetic Parameters and Expected Responses to Selection for Components of Feed Efficiency in a Duroc Pig Line. Genet. Sel. Evol. GSE 2017, 49, 86. [Google Scholar] [CrossRef]
- Noblet, J.; Etienne, M. Estimation of Sow Milk Nutrient Output. J. Anim. Sci. 1989, 67, 3352–3359. [Google Scholar] [CrossRef]
- Wang, Z.; Goonewardene, L.A. The Use of MIXED Models in the Analysis of Animal Experiments with Repeated Measures Data. Can. J. Anim. Sci. 2004, 84, 1–11. [Google Scholar] [CrossRef]
- Nakagawa, S.; Schielzeth, H. A General and Simple Method for Obtaining R2 from Generalized Linear Mixed-Effects Models. Methods Ecol. Evol. 2013, 4, 133–142. [Google Scholar] [CrossRef]
- van Breukelen, G.J.P. ANCOVA Versus CHANGE From Baseline in Nonrandomized Studies: The Difference. Multivar. Behav. Res. 2013, 48, 895–922. [Google Scholar] [CrossRef] [PubMed]
- Twisk, J.; Proper, K. Evaluation of the Results of a Randomized Controlled Trial: How to Define Changes between Baseline and Follow-Up. J. Clin. Epidemiol. 2004, 57, 223–228. [Google Scholar] [CrossRef]
- Strathe, A.B.; Danfaer, A.; Sorensen, H.; Kebreab, E. A Multilevel Nonlinear Mixed-Effects Approach to Model Growth in Pigs. J. Anim. Sci. 2010, 88, 638–649. [Google Scholar] [CrossRef]
- Luo, J.; Lei, H.; Shen, L.; Yang, R.; Pu, Q.; Zhu, K.; Li, M.; Tang, G.; Li, X.; Zhang, S.; et al. Estimation of Growth Curves and Suitable Slaughter Weight of the Liangshan Pig. Asian-Australas. J. Anim. Sci. 2015, 28, 1252–1258. [Google Scholar] [CrossRef]
- Peng, J.J.; Somes, S.A.; Rozeboom, D.W. Effect of System of Feeding and Watering on Performance of Lactating Sows. J. Anim. Sci. 2007, 85, 853–860. [Google Scholar] [CrossRef]
- Ampode, K.M.B.; Mun, H.-S.; Lagua, E.B.; Chem, V.; Park, H.-R.; Kim, Y.-H.; Sharifuzzaman, M.; Hasan, M.K.; Yang, C.-J. Hourly Feeding Regime of Modern Genetics Lactating Sows: Enhancing Productive Performance, Welfare, and Piglet Growth in Smart Farm-Based Systems. Agriculture 2024, 14, 740. [Google Scholar] [CrossRef]
- Cullen, J.T.; Lawlor, P.G.; Cormican, P.; Gardiner, G.E. Microbial Quality of Liquid Feed for Pigs and Its Impact on the Porcine Gut Microbiome. Animals 2021, 11, 2983. [Google Scholar] [CrossRef]
- Valros, A.; Rundgren, M.; Spinka, M.; Saloniemi, H.; Rydhmer, L.; Hultén, F.; Uvnäs-Moberg, K.; Tománek, M.; Krejcí, P.; Algers, B. Metabolic State of the Sow, Nursing Behaviour and Milk Production. Livest. Prod. Sci. 2003, 79, 155–167. [Google Scholar] [CrossRef]
- Schenkel, A.C.; Bernardi, M.L.; Bortolozzo, F.P.; Wentz, I. Body Reserve Mobilization during Lactation in First Parity Sows and Its Effect on Second Litter Size. Livest. Sci. 2010, 132, 165–172. [Google Scholar] [CrossRef]
- Mun, H.-S.; Ampode, K.M.B.; Lagua, E.B.; Chem, V.; Park, H.-R.; Kim, Y.-H.; Sharifuzzaman, M.; Hasan, M.K.; Yang, C.-J. Backfat Thickness at Pre-Farrowing: Indicators of Sow Reproductive Performance, Milk Yield, and Piglet Birth Weight in Smart Farm-Based Systems. Agriculture 2024, 14, 24. [Google Scholar] [CrossRef]
- Andretta, I.; Pomar, C.; Rivest, J.; Pomar, J.; Radunz, J. Precision Feeding Can Significantly Reduce Lysine Intake and Nitrogen Excretion without Compromising the Performance of Growing Pigs. Animal 2016, 10, 1137–1147. [Google Scholar] [CrossRef]
Disclaimer/Publisher’s Note: The statements, opinions and data contained in all publications are solely those of the individual author(s) and contributor(s) and not of MDPI and/or the editor(s). MDPI and/or the editor(s) disclaim responsibility for any injury to people or property resulting from any ideas, methods, instructions or products referred to in the content. |
© 2025 by the authors. Licensee MDPI, Basel, Switzerland. This article is an open access article distributed under the terms and conditions of the Creative Commons Attribution (CC BY) license.