Article

Glyphosate Biodegradation by Airborne Plant Growth-Promoting Bacteria: Influence on Soil Microbiome Dynamics

by
Beatriz Genoveva Guardado-Fierros
1,†,
Miguel Angel Lorenzo-Santiago
1,†,
Thiago Gumiere
2,*,
Lydia Aid
2,
Jacobo Rodriguez-Campos
3,* and
Silvia Maribel Contreras-Ramos
1,*
1
Unidad de Tecnología Ambiental, Centro de Investigación y Asistencia en Tecnología y Diseño del Estado de Jalisco A.C. (CIATEJ), Normalistas No. 800, Colinas de la Normal, Guadalajara 44270, JA, Mexico
2
Department of Soil and Agricultural Engineering, Laval University, Quebec City, QC G1V 0A6, Canada
3
Unidad de Servicios Analíticos y Metrológicos, Centro de Investigación y Asistencia en Tecnología y Diseño del Estado de Jalisco A.C. (CIATEJ), Guadalajara 44270, JA, Mexico
*
Authors to whom correspondence should be addressed.
These authors contributed equally to this work.
Agriculture 2025, 15(4), 362; https://doi.org/10.3390/agriculture15040362
Submission received: 28 November 2024 / Revised: 30 January 2025 / Accepted: 4 February 2025 / Published: 8 February 2025

Abstract

:
Due to its persistence, glyphosate contamination in soil poses environmental and health risks. Plant growth-promoting bacteria (PGPB) offer a potential solution for mitigating glyphosate pollution. This study assessed the glyphosate degradation capacity of three airborne PGPB isolates (Exiguobacterium indicum AS03, Kocuria sediminis AS04, and Rhodococcus rhodochrous AS33) individually and in a consortium (CS) compared to natural attenuation in microcosms as the control (CTL), where soil autochthonous microorganisms (MS) were present. AS03 exhibited the highest glyphosate degradation (86.3%), followed by AS04 and AS33 at 14 days (61.6% and 64.7%). The consortium accelerated glyphosate removal, reaching 99.7%, while the control treatment removal was 94% at 60 days. Aminomethylphosphonic acid (AMPA) is the main metabolite in glyphosate degradation, and it had a maximum peak in concentration at 28 days in the CS + MS (1072 mg kg−1) and CTL (990 mg kg−1) treatments. Subsequently, a decrease in AMPA concentration was observed at 60 days up to 349 mg kg−1 and 390 mg kg−1, respectively. These results suggested that soil autochthonous microorganisms and their interactions with a consortium have similar biotransformation of glyphosate, but the AMPA conversion to other intermedium metabolites through degradation was slow. A minimum AMPA concentration of 15–45 mg kg−1 over time was detected with the consortium. The microbiome analysis revealed shifts in microbial composition, with an increase in glyphosate-degrading genera like Psychrobacter and Lyzobacter. These changes enhance soil resilience and fertility, demonstrating the potential of airborne PGPB for bioremediation and environmental sustainability.

1. Introduction

According to the FAO and UNEP (2021), most pollutants reaching the soil originate from human activities, including industrial processes, mining, inadequate waste management, unsustainable agricultural practices such as utilizing contaminated fertilizers and pesticides with metals such as cadmium or the use of copper as a fungicide, and chemical spills (oil, chemicals, and radionuclides such as cesium-137 (137 Cs) [1]. There has been a global increase of 34% in the use of pesticides from 2000 to 2016, with regional spikes of up to 104% in South America, contributing significantly to soil and aquifer contamination, thus posing severe health risks [2,3]. The transference of different contaminants into the terrestrial food web from the soil to plants (pastures and crops), which are ingested by wildlife, livestock, and humans, or from the soil to invertebrates, which can be ingested by birds and poultry and finally transferred to humans, is a latent risk and has a direct impact on health quality and soil biodiversity [1,4].
Glyphosate, one of the most widely applied herbicides globally for over 150 crops, exemplifies this issue. The annual global usage is estimated at 600–750 thousand tons, with an expected increase of 740–920 thousand tons by 2025 [5,6].
The Americas have been the largest users of pesticides in the last decade among all regions, ahead of Asia, Europe, Africa, and Oceania, where pesticide use in agriculture increased by 10% in 2022. Other regions, such as Europe, have decreased pesticide use in agriculture (−7 percent) due to the stringent European Common Agricultural Policy [7].
The widespread use and hazardous nature of glyphosate, linked to severe health and environmental impacts such as reproductive toxicity, DNA damage, and diseases such as Parkinson’s and Alzheimer’s, underscore the urgent need for effective remediation strategies [5,6]. The FAO has recommended that governments foster agroecological alternatives and implement technological tools to mitigate the adverse effects of hazardous pesticides, such as scaling up nature-based and environmentally sound sustainable management and remediation technologies [1,7]. These technological approaches include bioremediation technologies that use microbial processes to degrade environmental contaminants, such as bioaugmentation (addition of microorganisms with the capacity to degrade the contaminants) and biostimulation (addition of organic matter or nutrients) [8,9].
Plant growth-promoting bacteria (PGPB) have proven to be highly efficient in increasing plant growth [10,11], as well as in the phytoremediation of soils with hydrocarbons [12] or degradation of pesticides (such as endosulfan) [13,14]. However, there are few reports on the ability of PGPB bacteria to degrade or remove glyphosate [14,15,16,17]. Glyphosate degradation in soil is primarily driven by microbial processes, with specific enzymes (glyphosate oxidoreductase, glycine oxidase, glyphosate C–P lyase, and glyphosate N-acetyltransferase) breaking down glyphosate into metabolites like aminomethylphosphonic acid (AMPA), glycine, sarcosine, and glyoxylate [18,19].
A relationship has been reported between phosphorus solubilization (produced by PGPB) and glyphosate degradation [17]. PGPB glyphosate degraders have been isolated from soil, plant rhizospheres, or water [15,16,20,21], but there are no reports of PGPB from airborne or bioaerosols degrading glyphosate. However, some airborne bacteria have been identified with PGPB traits and reported to degrade contaminant capacities [22,23].
Bioaerosols are airborne particles with sizes from 0.001 to 100 μm, with bacteria and fungi typically ranging from 0.25 μm to 60 μm in aerodynamic diameter. Airborne particles can be composed of water droplets, dust particulate matter (PM), or individual organisms like fungi, viruses, and bacteria, as well as some biologically active components (mycotoxin, endotoxin) and mold, pollen from plants, and fragments of living/dead microorganisms, plants, and animals added to the particulate material [24]. Microbiota present in bioaerosols are exposed to different extreme environmental conditions (relative humidity, dryness, UV radiation, light intensity, oxidant radicals, and atmospheric contaminants (heavy metals, pesticides, polyaromatic compounds), among others) [24,25]. All these conditions could induce an extreme selection of microorganisms present in bioaerosols.
These PGPB can simultaneously support plant development while breaking down toxic compounds in the soil, thus offering a dual benefit to the environment and the soil [15,23]. PGPB isolation from bioaerosols could offer a new source of microorganisms adapted to several extreme environmental conditions and tolerant to different contaminants. Extreme environmental conditions, such as desiccation, strongly influence the selection and effectiveness of microorganisms present in bioaerosols. Bacteria possessing adaptive mechanisms, such as biofilm formation, spore production, or the ability to resist desiccation, are more likely to survive in these adverse environments. Additionally, interactions between bacterial species can influence their survival capacity, as some may protect others [26].
They could be used as tools to remediate contaminated soil simultaneously, improve plant growth, and improve fertility in the soil. So, could airborne bacteria with PBPB traits also offer glyphosate degradation capacity? Can PGPB-inoculated soil positively or negatively influence the soil microbiome? This study explored the glyphosate degradation capacity in the soil of three airborne PGPB and their capacity to degrade glyphosate individually and in a consortium compared to natural attenuation. The first report shows the glyphosate degradation capacity from airborne PGPB and how they could influence soil microbial dynamics.

2. Materials and Methods

2.1. Sampling Site and Soil Characteristics

To obtain glyphosate-free soil to establish the experiment, we sought a site with a warranty of no pesticide applications that would interfere with the analysis. So, the sampling site chosen is in Zapotlanejo, Jalisco, Mexico (20°38′49.02″ N and 103°2′55.35″ W), where organic agriculture is practiced. Its average altitude is 1546 m above sea level (ASL). It is characterized by a sub-humid temperate climate with a mean annual temperature of 19.9 °C, while its maximum and minimum averages ranged between 31.5 °C and 7.9 °C, respectively. The average annual rainfall was 920 mm. The soil was classified as Vertisol, mainly cultivated with organic cucumber (Cucumis sativus) and vegetable crops for over ten years without pesticide or herbicide addition (http://www.inegi.gob.mx, accessed on 21 September 2024).
The soil was characterized by texture [27] (USDA modified soil texture triangle), water holding capacity (WHC), pH in water [28], organic C content [29], total N [30], total phosphorous, and heavy metals [31,32] (Table 1). Thirty samples were collected by removing the top 0–20 cm layer of soil. The soil was pooled, taken to the laboratory, and separated using a 3 mm sieve. Three soil samples were obtained from >10 kg of soil.

2.2. PGPB Strains

Strains were isolated from air samples of 100 L collected from the metropolitan area of Guadalajara, Mexico, at the “San Juan de Dios” site (20°40′31″ N; 103°20′24″ W). This area is highly populated. San Juan de Dios is in the downtown area of Guadalajara and hosts one of the busiest markets in the city. Sampling was conducted using an air sampler gun (Millipore® M air T, Bedford, MA, USA) in triplicate, and the samples were directly spread on Luria–Bertani agar (LB, for bacteria) plates. The most representative and abundant morphotype strains (55) were isolated with several passes in new LB plates. When a pure culture was obtained, isolated strains were inoculated in triplicate on agar medium plates containing 40, 60, and 100 mg L−1 commercial glyphosate FAENA® at 36.3% glyphosate (Zapopan, JA, Mexico) as the sole carbon source [33], incubated at 30 ± 2 °C for 48 h. Their growth was observed, and those with similar growth compared to the same strain growing in TSA medium without glyphosate were selected. The traits considered by selecting strains growing in glyphosate were maintaining pigmentation, growth biomass area, and morphology at the same time of growth (see Supplementary Figure S1).
Airborne isolated strains were characterized by promoting plant growth and evaluating the phosphorous and potassium solubilization and ammonium, siderophores, and Indole-3-acetic acid (IAA) auxin production (Table 2) according to methods previously reported by [22,34,35,36,37]. They were identified by biotyping through matrix-assisted laser desorption/ionization coupled to time-of-flight mass spectrometry (MALDI-TOF-MS) using a MICROFLEX LT mass spectrometer (Bruker Daltonics, Bremen, Germany). Also, molecular identification was performed using 16S and a FastDNA Spin Kit (MP Biomedicals, Solon, OH, USA) for DNA extraction. DNA concentration was assessed using UV-VIS spectrophotometry (NanoDrop-2000, Thermo Scientific, Waltham, MA, USA) and stored at −20 °C until use. Sequencing was conducted at Sanger PSOMAGEN Inc. (Rockville, MD, USA) using primers 27F and 1492R for amplified sequencing [22]. Sequences were manually checked and trimmed using Sequencher 5.4.6 (Gene Codes Corporation). The final sequences were compared against NCBI 16S (BLAST) and deposited in the GenBank database (http://www.ncbi.nlm.nih.gov/BLAST, accessed on 21 September 2024). Strains Exiguobacterium indicum AS03, Kocuria sediminis AS04, and Rhodococcus rhodochrous AS33 have the following GenBank NCBI accession numbers: OP934047, OP934048, and OP934053, respectively.

2.3. Airborne PGPB Cultivation

The three strains selected, Exiguobacterium indicum AS03, Kocuria sediminis AS04, and Rhodococcus rhodochrous AS33, were cultivated in trypticase soy broth (TSB) (peptone of casein, 15 g; peptone of soya bean and NaCl, 5 g per L), adjusted to 0.1 optical density (OD600) and incubated to 30 ± 2 °C overnight, and the culture set-up was 1 × 10⁷ CFU mL−1.

2.4. Experimental Set-Up

Sub-samples of 20 g of dry soil were added to 125 mL flasks, and six treatments were applied according to Table 3. The soil was sterilized three times at 121 °C for 15 min, with intervals of 24 h [38], or not according to required treatments (Table 3). A sterile test was performed on sterile soil by dilution in a saline solution at 0.85% NaCl, and 1 mL was inoculated using standard agar methods and potato dextrose agar. No growth was detected after 48 h and 5 days, respectively.
The treatments were added with commercial glyphosate (FAENA) at 36.3% glyphosate in 2000 mg kg−1 soil. One milliliter of each strain (Exiguobacterium indicum AS03, Kocuria sediminis AS04, or Rhodococcus rhodochrous AS33) was added separately and in consortium (0.33:0.33:0.33 v/v each strain) to each flask. Soil was adjusted to 40% water holding capacity (WHC) with sterile distilled water. The flasks were placed in 940 mL glass jars containing a vessel with 10 mL sterile distilled water to avoid desiccation and a vessel with 20 mL of 1 M NaOH to trap carbon dioxide (CO2) and avoid microbial inhibition. The jars were sealed and incubated at 25 ± 2 °C for 60 days (Supplemental Materials Figure S2). A control treatment (CTL) was established where the soil was not sterilized, and it was not inoculated. Three treatments were inoculated with individual strains of Exiguobacterium indicum As03 (AS03), Kocuria sediminis As04 (AS04), and Rhodococcus rhodochrous As33 (AS33), with sterilized soil. Another treatment was inoculated with three strains as a consortium in sterile soil (CS) and non-sterile soil (CS + MS). In the later treatment, the consortium and autochthonous microorganism interactions were evaluated (Table 3). All treatments were established with four replicates (n = 4).
Additionally, 20 jars without soil but containing a vessel with 10 mL of distilled water and one with 20 mL of 1 M NaOH were sealed and served as controls to account for the CO2 trapped in the atmosphere. After 0, 7, 14, 28, 42, and 60 days, four jars were randomly selected from each treatment for glyphosate and AMPA extraction. At 0, 42, and 60 days, a 2 g sample was removed under sterile conditions for DNA extraction for metagenomic and functional analysis. When the flasks were opened, the vessel containing 1 M NaOH was removed. All the remaining jars were opened weekly under a microbiological hood, aerated for 5 min to avoid anaerobic conditions, resealed, and further incubated.

2.5. DNA Extraction and Metagenomic Analysis

According to the manufacturer’s instructions, total DNA was extracted from 0.5 g of soil using the FastDNATM SPIN Kit for Soil (MP Biomedicals, Solon, OH, USA). The concentration of the extracted DNA was determined using a NanoDrop 2000 spectrophotometer (Thermo Fisher Scientific, Waltham, MA, USA) at 260 nm, and the integrity was verified by agarose gel electrophoresis.

2.6. Library Preparation and Sequencing

Bacterial and archaeal communities were targeted for sequencing by amplifying the 16S rRNA gene using primers 27F-1492R and the library kit 16S Barcoding Kit following the protocol provided by Oxford Nanopore Technologies. All PCR reactions were prepared by mixing 10 ng of input DNA with LongAmp Hot Start Taq 2X Master Mix (New England Biolabs, M0533S, Ipswich, MA, USA) and the respective primers in thin-walled PCR tubes. The reactions were then subjected to the following PCR conditions: initial denaturation at 95 °C for 1 min, followed by 25 cycles of denaturation at 95 °C for 20 s, annealing at 55 °C for 30 s, extension at 65 °C for 2 min, and a final extension at 65 °C for 5 min. After amplification, PCR products were purified using Agencourt AMPure XP beads (Coulter, A63881, Brea, CA, USA) and quantified using a Qubit fluorometer. Briefly, barcoded libraries were pooled in a ratio ensuring equal representation of each sample and were prepared for loading into the MinION sequencer. After priming with the Flow Cell Priming Kit, the prepared library mix was loaded onto an R9.4.1 flow cell (EXP-FLP002). Sequencing was performed on the Oxford Nanopore MinION device, with the runtime typically set to 8 h to maximize the data yield.

2.7. Bioinformatics with Spaghetti Pipeline

The raw data (.fast5) were processed through the first module of the “Spaghetti” pipeline [39], specifically designed to analyze 16S rRNA gene sequences obtained by Nanopore sequencing. This module leverages several bioinformatics tools to ensure comprehensive and accurate analysis, from sequence processing to taxonomic classification. Initially, sequencing adapters were removed using Porechop [40], which facilitates cleaning raw reads by eliminating unwanted sequencing artifacts. Subsequently, the sequences were filtered using NanoFilt [41] to select reads within a specified size range, optimizing data quality and relevance for microbial community analysis.
Quality assessments were performed using NanoStat version 2.8.0 [41] to ensure the integrity of the data, a tool that provides detailed statistics on the quality of sequencing data. This step is crucial for confirming that the filtered reads meet the quality thresholds required for accurate analysis. The pipeline then employs yacrd [42] and minimap2 [43] to detect and remove chimeric sequences, respectively. Chimeras that can skew microbial diversity assessments were identified and excluded to maintain the accuracy of the analysis. The high-quality, non-chimeric reads were then mapped against SILVA database version 138 [44], a comprehensive microbial database that enables precise taxonomic identification of the reads.
The mapping process is enhanced by minimap2 and optimized for efficient memory usage and accuracy, ensuring that only relevant alignments are retained. This mapping is followed by a crucial filtering step that refines the dataset further, retaining only the highest-quality alignments for each sequence read using a custom filtering script [45]. Following the filtering and taxonomic identification, an approximately maximum-likelihood phylogenetic tree was computed using FastTree version 2.1.0 [46], efficiently generating large-scale phylogenetic trees.
The final output from this bioinformatics analysis includes detailed taxonomic tables and operational taxonomic unit (OTU)-like tables, which are crucial for a comprehensive microbial community analysis. Based on robust genomic data, these outputs lay the groundwork for in-depth investigations of microbial diversity, community structure, and ecological functions.

2.8. Glyphosate and AMPA Extraction

Glyphosate and AMPA were extracted from soil following the method described by De Geronimo et al. [47], with some modifications. In a 50 mL falcon tube, 5 g of dry soil was deposited with 15 mL of sodium tetraborate, and the mixture was agitated for 30 min at 250 rpm. The mixture was then centrifuged at 4500 rpm for 10 min. The supernatants were recovered, and 2 mL was passed through an OASIS HLB cartridge 3cc (WAT094226, Milford, MA, USA) (previously conditioned with 1 mL H2O pH 9- and 1 mL methanol pH 9). Then, 2 mL of the solution was recovered in a 15 mL falcon tube, and 80 µL of EDTA (0.1 M pH 9) and 400 µL of FMOC-Cl (1 mg mL−1) were added to carry out the derivatization and vortexed for 1 min. The derivatization reaction was performed for one hour at room temperature. Subsequently, 5 mL of dichloromethane was added to the mixture to remove excess FMOC-Cl, and the mixture was agitated for 1 min. The mixture was centrifuged for 10 min to separate the phases (organic and aqueous) and to recover the aqueous phase. This phase was filtered through a 0.22 µm membrane and deposited in a plastic vial for injection into the UPLC-MS/MS.

2.9. Glyphosate and AMPA Quantification by UPLC-MS/MS

The UPLC system was coupled to a model XEVO TQs Micro-Waters (Milford, MA, USA) mass spectrometer to identify derivatized analytes. Compound separation was carried out on an Acquity UPLC Class I system with a Waters binary pumping system (Milford, MA, USA) and a BEH C18 column (50 mm × 2.1 mm) packed with a 1.7 µm Waters particle size. The column temperature was maintained at 50 °C. The binary phase system was methanol (100% pure) as mobile phase A and 5 mM ammonium acetate as mobile phase B, with a flow rate of 0.4 mL min−1. The elution gradient was as follows: 90% B, as an initial condition, 5% B at 4.5 min, 5% B at 5.5 min, and 90% B by 6.0 min. The conditions for the mass spectrometer were set as follows: the source operated in positive mode at a temperature of 150 °C, the capillary voltage of 2.5 kV, and the temperature and desolvation gas at 450 °C and 900 L h−1, respectively. The ESI source was operated in positive polarity, and data acquisition was performed in the MRM mode. The data acquisition and processing software used were MassLynx V4.1 and targetLynx XS V4.1.
Quantifying the derivatized compounds was performed using calibration curves obtained by adding the compounds to the soil matrix at 10.0, 50, 100, 250, and 500 µg/L concentrations. Linear regression equations were used to calculate the concentration of each compound. The curves showed a coefficient of determination (R2) of 0.999.

2.10. Statistical and Biostatistical Analysis

Glyphosate and AMPA data were analyzed by normality test and after ANOVA Tukey test (p < 0.05) to find significant differences between strain or consortium treatments compared to the control (CTL) treatment, using XLSTAT software. A graphical abstract was also created using Biorender software (www.biorender.com).
Bacterial community diversity and abundance analyses were performed using the phyloseq [48], vegan [49], and microeco [50] packages in R (version 4.1.0). The graphical visualizations were predominantly created with the microeco package, along with ggplot2 [51], circlize [52], and gridExtra [53]. A transformation based on a reference to the literature was applied to equalize sampling depth for sequence count normalization. Specifically, a transformation function was developed to adjust relative abundance with a specific cutoff value of 10,000 reads per sample.
Beta diversity analysis used the cal_betadiv function in the microeco package with the weighted UniFrac metric. Non-metric Multidimensional Scaling (NMDS) was conducted to visualize temporal variations in the bacterial community among treatments at T0, T28, and T60. Differences between groups were assessed using PERMANOVA (permutational multivariate analysis of variance) through the adonis2 function.

2.11. Network Analysis

Ecological network analysis was conducted using the SpiecEasi version 1.1.12 [54] and igraph version 2.2.4 [55] packages in R. Networks were calculated with the SparCC (sparse correlations for compositional data) method, and network modularity was assessed. Network plots were performed with Gephi software version 0.10.1. [56], and parameters were calculated with the igraph package, which included the following:
  • Vertex (nodes): represent OTUs (operational taxonomic units) in the network.
  • Edge (edges): represent correlations between OTUs, indicating potential interactions or associations.
  • Average Degree: The average number of edges (connections) per vertex (OTU). This metric indicates the network’s general connectivity.
  • Average Path Length: the average shortest path between all pairs of vertices in the network, reflecting how closely connected the network is.
  • Network Diameter: the longest shortest path, representing the maximum distance between two vertices.
  • Clustering Coefficient: A measure of the degree to which vertices in the network tend to cluster together. It reflects the presence of tightly knit groups within the network.
  • Density: the ratio of the number of edges present to the number of possible edges in the network, indicating how densely the network is connected.
  • Heterogeneity: It is the variability in vertex connectivity. A higher heterogeneity suggests a more varied distribution of connections among the vertices.
  • Centralization: The extent to which the network is organized around central nodes, with a higher centralization indicating a more star-like structure.
  • Modularity: The degree to which the network is divided into modules or subcommunities. High modularity suggests a structure with distinct clusters of highly interconnected nodes.

2.12. Redundancy Analysis (RDA)

RDA analyses helped identify key environmental drivers of microbial community shifts with the relationship between soil physicochemical parameters and microbial composition, particularly in response to glyphosate degradation, while the Mantel test assessed the statistical significance of these associations. To ensure that the data were prepared correctly for multivariate statistical analysis, a series of preprocessing steps were applied using the “caret” package in R:
  • Variance filtering: the “zv” (zero variance) and “nzv” (near-zero variance) methods were used to remove variables with little or no variation, ensuring that only informative variables were retained.
  • Normalization and transformation: the Yeo–Johnson transformation was applied to stabilize variance and approximate normality.
  • Handling missing data: missing values were removed using “na.omit” to ensure that only complete cases were analyzed.
Redundancy analysis (RDA) assessed the relationships between environmental variables and microbial communities. The Mantel test assessed the correlation between environmental variables and microbial community composition. The test was performed using Bray–Curtis dissimilarity and Pearson correlation.

3. Results

3.1. Glyphosate Degradation

The AS03 strain (Exiguobacterium indicum) showed significantly more significant degradation of glyphosate (86.3%) than AS04 (Kocuria sediminis) and AS33 (Rhodococcus rhodochrous) strains at 14 days of the experiment, with 61.6% and 64.7%, respectively. No significant differences were observed in the control (CTL) treatment. At the end (60 days), three strains showed degradation like that of the control (94.3%) (Figure 1A). Biodegradation was observed with bioaugmentation using the three strains evaluated in the presence of AMPA in all the treatments (Figure 1B). Bioaugmentation treatments with the three strains had AMPA concentrations ranging from 24 to 49 mg kg−1 after 7 days and until 60 days, without significant differences between the three strains. However, the control treatment resulted in the accumulation of AMPA after seven days, with the highest concentration at 28 days (990 mg kg−1). It decreased to 397 mg kg−1 after 60 days (Figure 1B). These results suggest that glyphosate biotransformation occurred due to the presence at the time and possibly AMPA following the biodegradation pathway. In the control treatments, this biotransformation was slower than in the bioaugmentation treatment.
When the consortium (CS) was applied, an acceleration of glyphosate removal was observed at seven days, decreasing to 153 mg kg−1 of glyphosate concentration compared to the control (CTL), which decreased to 240 mg kg−1. However, at 42 days, CTL was like CS (Figure 1C). Thus, the CS had 99.7% glyphosate removal, while the control had 94% and 89.5% CS + MS at 60 days. AMPA concentration for seven days had a maximum peak at 28 days in the CS + MS (1072 mg kg−1) and CTL (990 mg kg−1) treatments.
Subsequently, a decrease in AMPA concentration was observed at 60 days up to 349 mg kg−1 and 390 mg kg−1, respectively. These results suggested that autochthonous microorganism soils and their interactions with the consortium have similar biotransformation of glyphosate, but the AMPA conversion to other intermedium metabolites through degradation was slow. While in the consortium (CS) treatment, the glyphosate degradation was faster than CS + MS and CTL due to AMPA accumulation not being detected, with a minimum AMPA concentration of 15–45 mg kg−1 over time (Figure 1D). This result suggested that the consortium was able to continue the biodegradation.

3.2. Microbial Composition and Structure

3.2.1. Clusters and Temporal Dynamics in Phylogenetic Composition

Figure 2 illustrates the relative abundance of the microbial communities, revealing two distinct cluster groups. Consortium treatments (CS and CS + MS) differed from the control (CTL) and isolate treatments (AS03, AS04, and AS33) at both the phylum (Figure 2A) and genus (Figure 2B) levels. Proteobacteria and Firmicutes dominated all samples but exhibited significant treatment variations. Notably, the CS consortium displayed a higher relative abundance of these phyla than the AS isolates and CTL.
The phylogenetic composition displayed a dynamic response to the presence of glyphosate over time. In the initial samples (T0), the genus Bacillus was predominant, decreased by T42, and then increased again by T60. The genera Planococcus and Kocuria also showed temporal fluctuations, with Planococcus being the most abundant at T0 and T40 and Kocuria at T60, shedding light on the microbial mechanisms underlying glyphosate biodegradation.
Figure 2B (lower plot) indicates that Bacillus was dominant in CTL treatments and isolates, whereas its abundance was significantly reduced in consortium treatments (CS and CS + MS). In addition, AS03 treatment increased the genus Planococcus and resulted in a notable reduction in Truepera. Conversely, treatments involving individual isolates and the unsterilized control showed a more diverse microbial community than the distinct profile of the consortium treatments, which showed significant increases in Psichrobacter and Lyzobacter. This behavior suggests that interactions among multiple isolates and the native soil microbiota foster a conducive environment for microorganisms that effectively degrade glyphosate.

3.2.2. Temporal Dynamics and Responses of Microbial Communities to Glyphosate Treatments

These data highlight the dynamic nature of microbial community structures under glyphosate exposure and suggest variability in microbial responses to different treatment conditions. Figure 3 illustrates the relative abundance of the five most abundant genera across each treatment over three time points: T0, T42, and T60. Bacillus was the most prevalent genus throughout all treatments, maintaining a consistent presence at all sampling times. Notably, in the CS + MS treatment, there was a significant shift in the abundance of Bacillus at T42, followed by a return to the initial levels by T60, suggesting a transient response to treatment interventions.
Other genera, such as Psychrobacter and Truepera, showed varied abundances across treatments and time points, indicating differential responses to glyphosate treatment. For example, the Planococcus genus in the AS03 treatment increased significantly at T42, whereas Psychrobacter in the CTL treatment decreased markedly between T42 and T60.

3.2.3. Shifts in Soil Bacterial Structure

Non-metric Multidimensional Scaling (NMDS) was performed using the weighted UniFrac distance to visualize the dynamics of the soil bacterial community under various glyphosate treatments at three time points: T0 (initial), T42 (intermediate), and T60 (final). The NMDS plots, illustrated in Figure 4, reveal substantial variations in bacterial community structures over time and in response to different treatments. PERMANOVA analyses revealed that the interaction between treatment and time accounted for 18.475% of the variance in microbial community composition (Pr(>F) = 0.0044). The analysis further revealed that time alone explained 5.89% of the variance in the microbial community structure (Pr(>F) = 0.047), emphasizing the significant impact of temporal dynamics on microbial distributions.
Significant microbial shifts were identified through PERMANOVA analysis, which considered a sequential contrast for individual interaction effects. Notably, at T60, substantial changes were observed in the AS04 treatment with a p-value of 0.0255 and in the control treatment with a p-value of 0.0447, indicating significant microbial community alterations by the experiment’s end. Additionally, the AS33 treatment at T60 showed distinct microbial changes, with a statistically significant Pr(>F) of 0.0486, highlighting the unique influence of this treatment on microbial dynamics (Supplementary Figure S3).

3.2.4. Network Configuration and Interaction Dynamics

Network analysis assessed the soil bacterial communities’ structural complexity and interaction dynamics subjected to various microbial treatments. Figure 5A illustrates the network graphs corresponding to the bacterial isolates (AS03, AS04, AS33), a control group (CTL), and microbial consortia (CS, CS + MS).
In these graphical representations, nodes represent bacterial genera color-coded according to their modularity class, with edges depicting significant interactions. Detailed network metrics are presented in Figure 5B, including the number of nodes (total genera), number of edges (interactions), and positive and negative connections.
The control group (CTL) presented a network with 525 edges, a P/N ratio of 6.19, and a modularity of 0.309, encompassing eight modular classes. This profile suggests a less dense network with predominantly positive interactions and a structure composed of several microbial groups interacting within and between groups. The average number of interactions per node was eight, indicating lower connectivity than treatments involving microbial consortia.
The AS03 treatment exhibited 595 interactions with a P/N ratio of 3.31, reflecting a cohesive community with predominantly positive interactions. However, AS04 and AS33, as well as the bacterial isolates, showed a substantial increase in interactions. AS04 stands out with 1555 interactions, approximately three times those observed in AS03, demonstrating a highly interconnected and complex interaction pattern among its constituents, with an average of 23.923 connections per node. AS33 displayed nearly double the interactions of AS03, totaling 1003, with a balanced interaction dynamic (P/N ratio of 1.60), suggesting an equilibrium between positive and negative connections.
Among the consortium treatments, CS + MS was the most noteworthy. It exhibited 4359 interactions, with a nearly balanced split between positive (2312) and negative (2047) interactions. This balance suggests high activity and dynamics within this system, with network complexity indicating a robust community that is potentially more adaptable to environmental variations and capable of maintaining ecological functionalities under stress conditions. At the same time, network structure in CS treatment was the second-best treatment, where a larger abundance of groups in the community (nodes) was observed with 2746 interactions, with a nearly balanced split between positive (1533) and negative (1213) interactions (P/N ratio of 1.26). It suggested higher relationships were structured with consortium presence compared to CS + MS, where node polarization was also observed.

3.2.5. Analysis of Predicted Functionality of Profile Gene

The differential expression of the glpT, phnJ, and phnI genes related to P metabolism was observed. The AS33 treatment showed a higher relative abundance of phnJ and phnI genes (≤5%) than other treatments, indicating high activity in P cycle metabolism genes. Although AS03, CS, and CS + MS exhibited lower expression levels, their performances were not significantly different from the control, indicating that they might still be effective in degrading glyphosate, like the control (Figure 6).
High relative abundance was observed in the prediction genes of the carbon cycle in all treatments, with higher abundance in AS03, AS33, CS, and CS + MS. High acsA gene expression was detected in AS03 and CTL treatments, while gltA genes were more abundant (>15%) in AS03, CS, AS33, and CS + MS than in AS04 and CTL treatments.
Furthermore, the expression patterns of the phlD gene involved in the production of the antimicrobial agent 2-4-DAPG or DAPG (2,4-Diacetylphloroglucinol), as biocontrol had high expression in AS33 (Rhodococcus rhodochrous). In contrast, a lower expression was detected in the CS treatment.

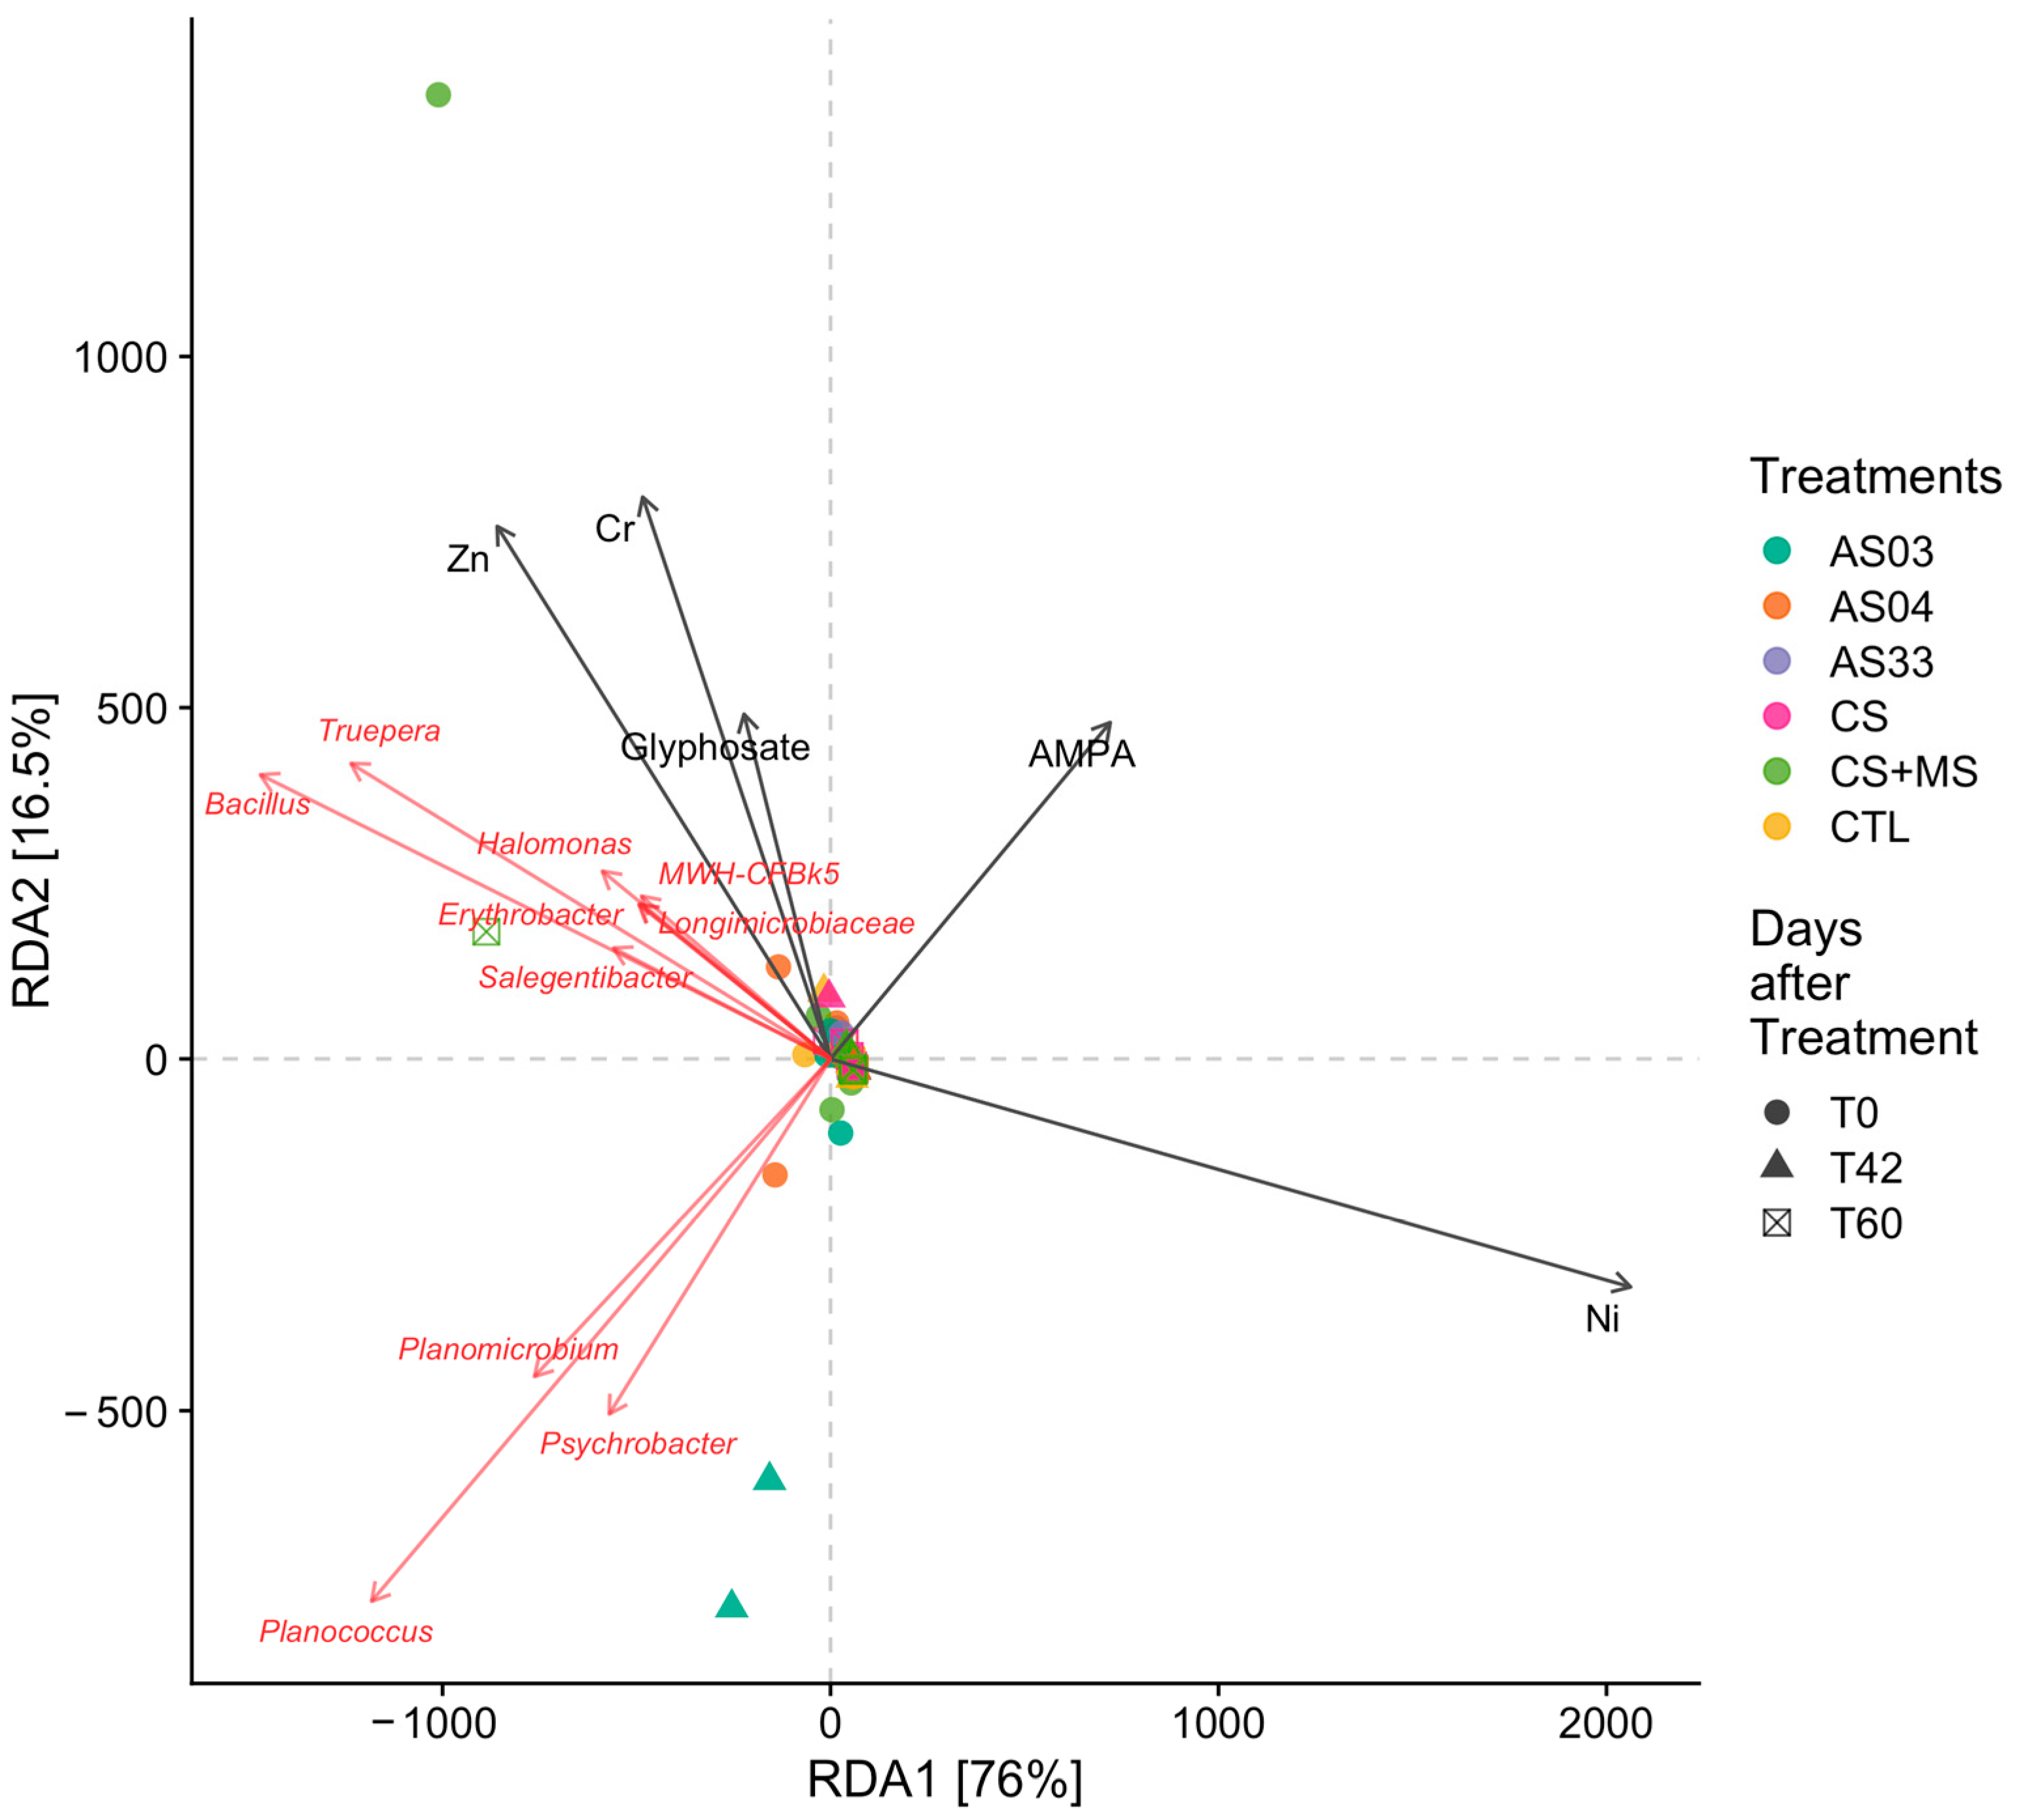
3.2.6. Correlation Between Environmental Variables and Soil Community

The partial Mantel test yielded a correlation coefficient of 0.0656 with a p-value of 0.025, indicating a weak positive correlation between glyphosate levels and community dissimilarity statistically significant at the 0.05 level (Table 4). A correlation coefficient of 0.1044 was observed with a p-value of 0.005, suggesting a weak positive correlation between AMPA concentrations and community dissimilarity, significant at the 0.01 level. These variables (Cr, Zn, Ni, and total phosphorous (Total_P) content) exhibited negative correlation coefficients (−0.0132, −0.0391, −0.0303, and −0.0653, respectively) with high p-values (0.625 to 0.964), indicating no significant correlation with community dissimilarity.
Genera such as Bacillus, Erythrobacter, Salegentibacter, and Trupera correlated positively with high glyphosate content in CS + MS at 60 days (T60) and high content in AMPA, while Psychrobacter, Planococcus, and Planomicrobium Planococcus genera correlated significantly in the AS03 treatment at T42, where glyphosate and AMPA concentrations were low (Figure 7). This suggested that these genera had high abundance and positively correlated with glyphosate and AMPA degradation.

4. Discussion

4.1. Overview of Glyphosate Degradation

Our findings elucidate the dynamic capabilities of airborne PGPB to degrade glyphosate, which has significant implications for environmental remediation. Glyphosate biodegradation is not merely a biochemical process but a crucial intervention for mitigating the environmental impacts of its extensive use. Glyphosate-degrading bacteria have evolved metabolic pathways to utilize glyphosate as a carbon, nitrogen, and phosphorus source, thereby preventing excessive environmental accumulation [57,58,59]. The biodegradation of glyphosate by different bacterial strains highlighted the significant role of microbial communities in glyphosate removal from the environment.
The AS03 strain (Exiguobacterium indicum) exhibited the highest glyphosate degradation rate at 86.3% compared to the AS04 (Kocuria sediminis) and AS33 (Rhodococcus rhodochrous) strains at 14 days. Exiguobacterium indicum can degrade glyphosate [60,61]. Rhodococcus rhodochrous is also associated with glyphosate degradation [62]. Studies have isolated R. soli G41 as being capable of degrading glyphosate efficiently under optimal conditions [62]. These data highlight the potential of Rhodococcus species in bioremediation efforts in glyphosate-contaminated environments. Three airborne strains demonstrated 94% glyphosate degradation at the end of the experiment, like other bacteria reported such as Flavobacterium, Burkholderia, Alcaligenes, and Pseudomonas [59]. Another consortium of bacteria demonstrated 97% glyphosate degradation in water–sediment systems after 36 h when a consortium is added, such as Azospirillum, Cloacibacterium, and Ochrobactrum [14].
There is no direct evidence linking the genus Kocuria with glyphosate degradation; however, studies have shown its involvement in the degradation of organic compounds and pollutants. Here, we observed that Kocuria sediminis actively degrades glyphosate, adding to the diverse metabolic capabilities attributed to Kocuria species, which has not been reported before in airborne bacteria. These species have been described as having diverse metabolic capabilities, including the degradation of various pollutants such as methyl tert-butyl ether and diesel oil [63,64]. Furthermore, K. marina has been associated with heavy metal bioremediation [65], and K. palustris, a marine microorganism, has been linked to the degradation of plastics [66].
Microbial degradation is a significant pathway for glyphosate breakdown, leading to the formation of metabolites such as glycine, AMPA, sarcosine, and glyoxylate [59,67]. Glyphosate and its degradation product AMPA are commonly found in soil, surface water, groundwater, and precipitation because of their widespread use in agriculture [68]. Aminomethylphosphonic acid (AMPA) in all treatments indicated that glyphosate biotransformation was facilitated by the microbial activity of the evaluated strains [68]. The bioaugmentation treatments with the three strains led to lower AMPA concentrations over time than the control treatment, which showed an accumulation of AMPA. These results suggested a slower biotransformation process without bioaugmentation by native microorganisms from the control soil [18,69]. It is known that glyphosate is rapidly mineralized in soils. Still, reports have indicated that half-life times for glyphosate and AMPA are from <24 h to 280 days, or 10–98 days, depending on soil sorption properties [70].
It has been observed that a consortium including the three strains resulted in accelerated glyphosate removal compared to the control treatment, with the consortium achieving 99.7% glyphosate removal by 60 days [71]. Our findings also confirm that using a microbial consortium can significantly enhance the rate of glyphosate degradation in the initial stages, as evidenced by the consortium treatment, which showed a faster decrease in glyphosate concentration than the control. Combining multiple microbial strains could be a more practical approach in bioremediation strategies, potentially offering a robust solution for tackling the widespread contamination of glyphosate.

4.2. Soil Microbial Composition and Structure Response to PGPB Isolates on Glyphosate-Contaminated Soil

Introducing bacterial isolates with new metabolic capabilities into the soil environment can significantly affect the soil bacterial community, especially after glyphosate application. Our results showed that the response of the microbial community to glyphosate exposure was markedly dynamic, illustrating significant shifts in microbial composition. The distinct segregation of microbial community structures between consortium and control/isolated treatments at the phylum and genus levels underscores the influence of treatment strategies on microbial dynamics.
The consortium treatments exhibited a higher relative abundance of Proteobacteria and Firmicutes, suggesting their crucial role in enhancing glyphosate biodegradation of glyphosate [72]. The alterations observed in the microbial community composition in the consortium treatments following glyphosate exposure suggest that bioaugmentation can enhance the functional capacity of soil microbiota to degrade glyphosate effectively. Specifically, the increase in genera such as Psychrobacter and Lyzobacter, known for their association with xenobiotic degradation, suggests the potential for improved biodegradation capabilities [73]. The decrease in Psychrobacter in the control treatment compared to its increase in the bioaugmented treatments implies that introducing specific bacterial strains may catalyze biodegradation by providing additional metabolic pathways or facilitating synergistic interactions between native and introduced bacterial populations.
Elarabi et al. [74] showed that microbial strains (Bacillus aryabhattai) significantly enhance pollutant degradation rates, highlighting the importance of tailored microbial solutions based on site-specific conditions and contaminant profiles for optimizing bioremediation efforts. The variability in bacterial composition and the observed enhancement of glyphosate degradation in bioaugmented treatments underscore the potential of microbial consortia as a robust bioremediation strategy. These findings emphasize the importance of considering the response of microbial communities to bioaugmentation strategies when developing effective bioremediation approaches.

4.3. Temporal Dynamics of the Main Soil Bacterial Genera After Glyphosate Application

The data in Figure 3 reveal significant fluctuations in microbial populations under glyphosate treatments, with Bacillus initially dominating and declining in treatments involving microbial consortia. This pattern indicates a dynamic microbial community adaptation to glyphosate exposure, as documented by Battaglin et al. [68]. Bacillus genera have been reported to be in high abundance as glyphosate degraders [75]. The shifts in genera, such as Planococcus and Kocuria, underscore the complex and intricate responses of microbial communities to glyphosate, suggesting potential adaptations to the challenged environment [68]. Bioremediation strategies employing bacteria such as Bacillus subtilis have proven effective in remediating glyphosate-contaminated soils [76]. Furthermore, the innovative biotechnological applications of Bacillus cereus for polyphosphate production through glyphosate biodegradation offer promising sustainable remediation strategies [76].
As microbial communities adapt to glyphosate exposure, their diversity increases, particularly in treatments such as AS04. This growing diversity fosters complex interactions among microbial taxa that facilitate continued glyphosate degradation, illustrating new microbial niches’ dynamic adaptation and formation [68]. These observations are essential for understanding the ecological impacts of glyphosate and developing effective management strategies for glyphosate-treated soils. The adaptability of microbial communities highlights the importance of considering temporal changes and microbial interactions when developing bioremediation strategies. These insights are crucial for predicting and managing the environmental impacts of agrochemicals and positioning bioremediation as a viable approach for maintaining soil health and sustainability [68].

4.4. Impact of Bacterial Isolates and Consortia on Network Complexity

The observed enhancement in network complexity and interconnectivity among the bacterial isolates AS04 and AS33 and the microbial consortia CS + MS might indicate potential changes in the soil microbial dynamics. These observations are consistent with findings from previous studies that documented the influence of soil properties and management practices on microbial networks [77,78,79]. These studies suggest that complex microbial networks can contribute to soil functionality and resilience, which may help stabilize microbial communities under various environmental conditions [80]. Similarly, Kavya et al. [81] explored the impact of microbial consortia on soil physicochemical properties and nutrient status, indicating their potential benefits to soil health. Additionally, Moliterni et al. [82] demonstrated the potential of microbial consortia to degrade environmental contaminants, thereby suggesting their role in environmental resilience.
These results support the potential role of microbial isolates and consortia in influencing soil microbial interactions and enhancing soil health and functionality. The balanced proportion of positive and negative interactions observed in the CS + MS treatment suggests that this dynamic may be crucial for maintaining soil health and nutrient cycling, particularly under stressful conditions [83,84]. However, further studies are required to determine the mechanisms underlying these effects and their practical implications.

4.5. Positive and Negative Interactions: Ecological Implications

The variation in the positive-to-negative interaction ratios (P/N ratios) observed across different treatments may reflect adaptive strategies within microbial communities, as Zhou et al. [85] suggested. A high P/N ratio, noted in the CTL group, indicates a tendency towards mutualistic or cooperative interactions, which might contribute to community stability. Such interactions are associated with enhanced resilience and overall functionality, as observed in diverse microbial networks [79,86].
Conversely, a more balanced P/N ratio in treatments such as AS33 and CS + MS suggests that a microbial community is equipped to handle various environmental conditions, potentially due to a mix of cooperative and competitive interactions. This balance is crucial for enhancing adaptability and ecological resilience [87,88], supporting nutrient cycling, and maintaining soil health under changing conditions [89,90].
The application of network analysis in microbial ecology has been instrumental in elucidating complex interactions within soil microbial communities and their adaptability to environmental changes [91,92]. By understanding these interactions, researchers can gain valuable insights into the dynamics that influence microbial community stability and functionality under various environmental stresses [93,94]. While the direct link between interaction types and specific ecological outcomes requires further exploration, the existing literature underscores the importance of diverse interaction types in enhancing community resilience and functionality. Future research should focus on the specific impacts of interaction patterns on microbial community stability and adaptability under environmental stress, which is crucial for advancing our understanding of soil microbial ecology and ecosystem sustainability.

4.6. Network Modularity and Environmental Resilience

The role of network modularity in microbial communities significantly influences the resilience of soil ecosystems, particularly under stress from contaminants such as glyphosate. Research has shown that while highly modular networks protect specific functions within microbial communities, they can constrain the overall adaptability of the system to rapid environmental changes [95,96]. In contrast, networks with reduced modularity, such as those observed in the CS + MS treatment, indicate a more integrated and dynamic microbial community that can quickly mobilize metabolic functions to respond to environmental stresses, enhancing resilience and stability [97,98]. However, it was notable that the network structure in the CS treatment had more groups, suggesting higher relationships between them.
The notion that less-modular networks enhance environmental resilience aligns with observations from various ecological studies. These studies suggest that such networks are better at effectively integrating new metabolic capabilities and adapting existing capabilities to degrade contaminants, including glyphosate. The CS + MS consortium network, characterized by a significant decrease in modularity, suggests a highly interlinked community where microbial interactions are extensive, facilitating rapid degradation of glyphosate and possibly other organic pollutants [79,99]. This enhanced microbial activity accelerates contaminant breakdown and improves nutrient cycling and soil structure, which is crucial for long-term soil health.
Although less modular networks offer adaptability, more modular networks have been shown to confer specific functional advantages under stable conditions. They can maintain critical ecological functions by isolating and protecting them from environmental perturbations [100]. However, in the context of rapid environmental changes or contaminant exposure, such as glyphosate, these networks may be less effective in adapting to new challenges, potentially leading to slower contaminant degradation rates and decreased overall ecosystem functionality.
Understanding dynamic interactions within microbial networks is crucial for developing effective bioremediation strategies. Networks that rapidly adapt and reorganize in response to glyphosate exposure are likely more effective in bioremediation. Integrating microbial consortia with diverse metabolic capabilities may enhance the resilience and efficiency of these networks, leading to better soil health and productivity [79,101].

4.7. Predicted Functionality of Profile Gene

The differential expression of the glpT gene observed in our study has significant implications for managing organophosphorus pesticides, such as glyphosate. In the CTL (control) treatment, elevated glpT expression suggests a robust biodegradative capacity that highlights microbial efficiency in pesticide breakdown. However, the AS33 treatment had a higher relative abundance of phnJ and phnI genes than other treatments. These genes have been reported to have an increased differential expression in alphaproteobacterial C–P bond lyases [102] and glyphosate degradation experiments in bioaugmented bacterial communities [70]. High abundances of phnJ and phnI are involved in organic-P mineralization and increase with glyphosate in soil [103].
Regarding carbon cycling, consistently high acsA gene expression in AS03 and CTL treatments suggests enhanced carbon assimilation capabilities, essential for maintaining soil health and supporting plant growth. Carbon is a pivotal element of soil fertility, and its effective cycling is crucial for agricultural productivity [104]. The observed reduction in acsA expression in AS04 might lead to impaired carbon cycling, which could adversely affect soil structure and the ability of the soil to support plant life [105].
Furthermore, the expression patterns of the phlD gene, which produces the antimicrobial agent 2-4-DAPG or DAPG (2,4-Diacetylphloroglucinol), highlight its role in biocontrol and enhancing soil health. High phlD expression in AS33 (Rhodococcus rhodochrous) suggests its potential for increased suppression of soil pathogens, thereby promoting plant health and ecological balance—benefits that align with previous studies on the biocontrol efficacy of 2-4-DAPG [106,107]. In contrast, lower expression in the CS treatment might diminish these beneficial effects, posing challenges to effective soil health management strategies.
The observed variability in phnJ and phnI, acsA, and phlD gene expressions among treatments illustrates their differing impacts on nutrient cycling and glyphosate biodegradation efficiency. This variation indicates complex interactions within microbial communities and their response to treatments. These interactions can significantly influence agricultural sustainability and the resilience of soil systems [108,109]. The distinct capabilities of treatments like AS03, with its strong carbon cycling, and AS33, with potent biocontrol activities, underscore the importance of selecting specific microbial consortia tailored to meet specific agricultural goals and soil health needs. By integrating these insights, we can better understand how to harness potential microbial gene expression to optimize agricultural practices, ensuring sustainability and enhancing the health and resilience of soil ecosystems.

5. Conclusions

This study confirmed the efficacy of plant growth-promoting bacterial (PGPB) isolates and their consortium in bioremediating glyphosate-contaminated soils, highlighting the isolates Exiguobacterium indicum (AS03), Kocuria sediminis (AS04), and Rhodococcus rhodochrous (AS33). The results demonstrated that while all isolates facilitated significant glyphosate degradation, AS03 was notably the most effective, achieving a higher reduction in glyphosate levels than its counterparts.
Applying PGPB led to significant alterations in the soil microbial composition, which were distinctly influenced by each treatment. The consortium, particularly in its early application, accelerated glyphosate removal, but sustained efficacy across time was most pronounced with AS03 treatment. These shifts in microbial dynamics indicate the potential of airborne PGPB for contaminant degradation and their role in enhancing soil microbial diversity, which can improve soil health and resilience. Key observations include the following:
Microbial Community Dynamics: The introduction of PGPB significantly altered the soil microbial structure, remarkably increasing the abundance of Proteobacteria and Firmicutes, essential for glyphosate biodegradation. These changes enhance the functional capacity of soil microbiota, potentially leading to sustained soil health and fertility.
Bioaugmentation Efficacy: Although the consortium of PGPB strains showed a rapid initial decrease in glyphosate levels, Exiguobacterium indicum AS03 maintained superior degradation efficiency over time. These results highlight the effectiveness of specific strains over the consortia for long-term bioremediation.
Ecological Impacts: Significant shifts in microbial community composition and structure in response to glyphosate exposure and PGPB treatment illustrate the adaptability of the soil microbiomes. These shifts indicate soil resilience and are crucial for developing effective bioremediation strategies that support agricultural sustainability and environmental health.
This study emphasizes the critical role of microbial bioremediation in managing pesticide pollution. It offers insights into microbial mechanisms that could be harnessed to enhance soil resilience and health, contributing to more sustainable agricultural practices. Further research is needed to fully understand these bacteria’s molecular interactions and long-term effects in diverse environmental settings. Additionally, assessing such bioremediation strategies’ economic viability and scalability is crucial for their practical application in agriculture and contaminated land management. Additionally, bioaerosols could be a new source of microorganisms adapted to several extreme environmental conditions and tolerant to different contaminants with the duality of PGPB. Using airborne PGPB to bioremediate soil is a new highlight that contributes to substantial technologies.

Supplementary Materials

The following supporting information can be downloaded at https://www.mdpi.com/article/10.3390/agriculture15040362/s1, Figure S1. (a) TSA cultures of airborne isolated strains; (b) agar medium containing 100 mg L−1 of glyphosate as sole carbon source. Figure S2. Microcosm experiment shows all treatments and indicates the incubation conditions and sample time for analysis. Figure S3. NMDS plots of soil bacterial composition based on the weighted UNIFRAC metric. Shapes represent time points (T0, T42, and T60), and colors denote treatments (AS03, AS04, AS33, CS, CS + MS, and control [CTL]). NMDS stress = 0.14.

Author Contributions

Methodology, formal analysis, and investigation, M.A.L.-S. and B.G.G.-F.; data curation, T.G. and L.A.; T.G. performed the bioinformatics and statistical analyses. All authors discussed the results and contributed to the final manuscript. Funding acquisition and project administration, S.M.C.-R.; conceptualization, methodology, and writing—review and editing, S.M.C.-R., J.R.-C. and T.G. All authors have read and agreed to the published version of the manuscript.

Funding

This manuscript received financial support from “Consejo Estatal de Ciencia, Tecnología e Innovación de Jalisco, México”, with the clave number 9824-2022, and the Natural Sciences and Engineering Research Council of Canada (NSERC) through project RGPIN-04289-2022.

Data Availability Statement

The datasets of the OTU-like table, chemistry, and physics analyses for this study are shown in the following link: https://figshare.com/s/3bfd11ab37da367ffaa2. Accessed on 1 October 2024.

Acknowledgments

The authors acknowledge Consejo National de Humanidades Ciencia y Tecnología (CONAHCYT) for the fellowships granted to Guardado-Fierros B.G. (563011) and Lorenzo-Santiago M.A. (658080), who participated in this work.

Conflicts of Interest

The authors declare no conflicts of interest. The funders had no role in the design of this study; in the collection, analyses, or interpretation of data; in the writing of the manuscript; or in the decision to publish the results.

References

  1. FAO; UNEP. Global Assessment of Soil Pollution–Summary for Policy Makers; FAO and UNEP: Rome, Italy, 2021. [Google Scholar]
  2. FAO. Pesticides Use and Trade, 1990–2021; FAO: Rome, Italy, 2023. [Google Scholar]
  3. FAOSTAT Statistical Database Food and Agriculture Organization of the United Nations. Available online: https://www.fao.org/faostat/en/ (accessed on 25 September 2024).
  4. Beaumelle, L.; Thouvenot, L.; Hines, J.; Jochum, M.; Eisenhauer, N.; Phillips, H.R.P. Soil Fauna Diversity and Chemical Stressors: A Review of Knowledge Gaps and Roadmap for Future Research. Ecography 2021, 44, 845–859. [Google Scholar] [CrossRef]
  5. Meftaul, I.M.; Venkateswarlu, K.; Annamalai, P.; Parven, A.; Megharaj, M. Glyphosate Use in Urban Landscape Soils: Fate, Distribution, and Potential Human and Environmental Health Risks. J. Environ. Manag. 2021, 292, 112786. [Google Scholar] [CrossRef]
  6. Domínguez, A.; Brown, G.G.; Sautter, K.D.; Ribas de Oliveira, C.M.; de Vasconcelos, E.C.; Niva, C.C.; Bartz, M.L.C.; Bedano, J.C. Toxicity of AMPA to the Earthworm Eisenia Andrei Bouché, 1972 in Tropical Artificial Soil. Sci. Rep. 2016, 6, 19731. [Google Scholar] [CrossRef] [PubMed]
  7. FAO. Pesticides Use and Trade, 1990–2022; FAO: Rome, Italy, 2024. [Google Scholar] [CrossRef]
  8. Raimondo, E.E.; Saez, J.M.; Aparicio, J.D.; Fuentes, M.S.; Benimeli, C.S. Coupling of Bioaugmentation and Biostimulation to Improve Lindane Removal from Different Soil Types. Chemosphere 2020, 238, 124512. [Google Scholar] [CrossRef]
  9. Panwar, R.; Mathur, J. Remediation of Polycyclic Aromatic Hydrocarbon-Contaminated Soils Using Microbes and Nanoparticles: A Review. Pedosphere 2023, 33, 93–104. [Google Scholar] [CrossRef]
  10. Rodríguez-Vázquez, R.; Mesa-Marín, J. Plant Responses to Plant Growth Promoting Bacteria: Insights from Proteomics. J. Plant Physiol. 2023, 287, 154031. [Google Scholar] [CrossRef]
  11. Guardado-Fierros, B.G.; Tuesta-Popolizio, D.A.; Lorenzo-Santiago, M.A.; Rubio-Cortés, R.; Camacho-Ruíz, R.M.; Castañeda-Nava, J.J.; Gutiérrez-Mora, A.; Contreras-Ramos, S.M. PGPB Consortium Formulation to Increase Fermentable Sugar in Agave Tequilana Weber Var. Blue: A Study in the Field. Plants 2024, 13, 1371. [Google Scholar] [CrossRef]
  12. Martínez-Rabelo, F.; Gómez-Guzmán, L.A.; García-Segura, D.R.; Villegas-García, E.; Rodriguez-Campos, J.; Velázquez-Fernández, J.B.; Hernández-Castellanos, B.; Barois, I.; Contreras-Ramos, S.M. Hydrocarbon Bioremediation in a Pilot-Scale: A Combination of Bioaugmentation, Phytoremediation, and Vermiremediation. Environ. Technol. Innov. 2023, 31, 103210. [Google Scholar] [CrossRef]
  13. Rani, R.; Kumar, V.; Gupta, P.; Chandra, A. Potential Use of Solanum Lycopersicum and Plant Growth Promoting Rhizobacterial (PGPR) Strains for the Phytoremediation of Endosulfan Stressed Soil. Chemosphere 2021, 279, 130589. [Google Scholar] [CrossRef] [PubMed]
  14. Zhang, W.; Chen, W.J.; Chen, S.F.; Liu, M.; Ghorab, M.A.; Mishra, S.; Bhatt, P.; Chen, S. Complete Biodegradation of Glyphosate with Microbial Consortium YS622: Structural Analysis, Biochemical Pathways, and Environmental Bioremediation. J. Environ. Chem. Eng. 2024, 12, 114344. [Google Scholar] [CrossRef]
  15. Ezaka, E.; Akintokun, A.K.; Akintokun, P.O.; Taiwo, L.B.; Uthman, A.C.O.; Oyedele, O.A.; Aluko, O.I. Glyphosate Degradation by Two Plant Growth Promoting Bacteria (PGPB) Isolated from Rhizosphere of Maize. Microbiol. Res. J. Int. 2018, 26, 1–11. [Google Scholar] [CrossRef]
  16. Masotti, F.; Garavaglia, B.S.; Gottig, N.; Ottado, J. Bioremediation of the Herbicide Glyphosate in Polluted Soils by Plant-Associated Microbes. Curr. Opin. Microbiol. 2023, 73, 102290. [Google Scholar] [CrossRef] [PubMed]
  17. Villegas, L.B.; Martínez, M.A.; Rodríguez, A.; Amoroso, M.J. Microbial Consortia, a Viable Alternative for Cleanup of Contaminated Soils. In Bioremediation in Latin America; Springer International Publishing: Cham, Switzerland, 2014; pp. 135–148. [Google Scholar]
  18. Singh, S.; Kumar, V.; Gill, J.P.K.; Datta, S.; Singh, S.; Dhaka, V.; Kapoor, D.; Wani, A.B.; Dhanjal, D.S.; Kumar, M.; et al. Herbicide Glyphosate: Toxicity and Microbial Degradation. Int. J. Environ. Res. Public Health 2020, 17, 7519. [Google Scholar] [CrossRef] [PubMed]
  19. Zhang, W.; Chen, W.J.; Chen, S.F.; Lei, Q.; Li, J.; Bhatt, P.; Mishra, S.; Chen, S. Cellular Response and Molecular Mechanism of Glyphosate Degradation by Chryseobacterium sp. Y16C. J. Agric. Food Chem. 2023, 71, 6650–6661. [Google Scholar] [CrossRef]
  20. Sanmartin Negrete, P.; Ghilardi, C.; Rodriguez Pineda, L.; Perez, E.; Herrera, M.L.; Borroni, V. Biosurfactant Production by Rhodococcus ALDO1 Isolated from Olive Mill Wastes. Biocatal. Agric. Biotechnol. 2024, 57, 103106. [Google Scholar] [CrossRef]
  21. Mohy-Ud-Din, W.; Akhtar, M.J.; Bashir, S.; Asghar, H.N.; Nawaz, M.F.; Chen, F. Isolation of Glyphosate-Resistant Bacterial Strains to Improve the Growth of Maize and Degrade Glyphosate under Axenic Condition. Agriculture 2023, 13, 886. [Google Scholar] [CrossRef]
  22. Guardado-Fierros, B.G.; Tuesta-Popolizio, D.A.; Lorenzo-Santiago, M.A.; Rodriguez-Campos, J.; Contreras-Ramos, S.M. Comparative Study between Salkowski Reagent and Chromatographic Method for Auxins Quantification from Bacterial Production. Front. Plant Sci. 2024, 15, 1378079. [Google Scholar] [CrossRef] [PubMed]
  23. Chandrasekaran, M.; Paramasivan, M. Plant Growth-Promoting Bacterial (PGPB) Mediated Degradation of Hazardous Pesticides: A Review. Int. Biodeterior. Biodegrad. 2024, 190, 105769. [Google Scholar] [CrossRef]
  24. Sajjad, B.; Hussain, S.; Rasool, K.; Hassan, M.; Almomani, F. Comprehensive Insights into Advances in Ambient Bioaerosols Sampling, Analysis and Factors Influencing Bioaerosols Composition. Environ. Pollut. 2023, 336, 122473. [Google Scholar] [CrossRef]
  25. Jahne, M.A.; Rogers, S.W.; Holsen, T.M.; Grimberg, S.J.; Ramler, I.P.; Kim, S. Bioaerosol Deposition to Food Crops near Manure Application: Quantitative Microbial Risk Assessment. J. Environ. Qual. 2016, 45, 666–674. [Google Scholar] [CrossRef] [PubMed]
  26. Ronan, E.; Yeung, C.W.; Hausner, M.; Wolfaardt, G.M. Interspecies Interaction Extends Bacterial Survival at Solid–Air Interfaces. Biofouling 2013, 29, 1087–1096. [Google Scholar] [CrossRef] [PubMed]
  27. Gee, G.W.; Bauder, J.W. Particle Size Analysis. In Methods of Soil Analysis. Vol. I Physical and Mineralogical Methods; Klute, A., Ed.; American Society of Agronomy: Madison, WI, USA, 1986; Volume I, pp. 383–411. [Google Scholar]
  28. Thomas, G.W. Soil PH and Soil Acidity. In Methods of Soil Analysis, Part. 3: Chemical Methods; Wiley: Hoboken, NJ, USA, 2018; pp. 475–490. [Google Scholar] [CrossRef]
  29. Amato, M. Determination of Carbon 12C and 14C in Plant and Soil. Soil Biol. Biochem. 1983, 15, 611–612. [Google Scholar] [CrossRef]
  30. Bremner, J.M.; Maktar, H.P.S. Nitrogen Total. In Methods of Soil Analysis: Chemical Methods Part 3. Soil Science Society of America Inc; Sparks, D.L., Ed.; American Society of Agronomy: Madison, WI, USA, 1996; p. 1085. [Google Scholar]
  31. NOM-021-SEMARNAT-2000; Que Establece las Especificaciones de Fertilidad, Salinidad y Clasificación de Suelos. Estudios, Muestreo y Análisis. Norma Oficial Mexicana: Naulcalpan, México, 2002. Available online: https://platiica.economia.gob.mx/normalizacion/nom-021-semarnat-2000/ (accessed on 25 September 2024).
  32. Sparks, D.L. Methods of Soil Analysis. Part 3. Chemical Methods; Soil Science Society of America Book Series; CRC Press: Boca Raton, FL, USA, 1996; Volume 3, p. 1264. [Google Scholar]
  33. Hazaimeh, M.; Kanaan, B.M.; AlFaleh, F.A.; Elhaig, M.M.; Khamaiseh, E.I.; Zia, Q.; Alaidarous, M.; Seth, C.S.; Alsowayeh, N.; Ahmad, F. Biodegradation of Petroleum Hydrocarbons Using a Novel Bacterial Strain Isolated from Hydrocarbons Contaminated Soil of Saudi Arabia. Biocatal. Agric. Biotechnol. 2024, 57, 103074. [Google Scholar] [CrossRef]
  34. Goswami, D.; Dhandhukia, P.; Patel, P.; Thakker, J.N. Screening of PGPR from Saline Desert of Kutch: Growth Promotion in Arachis Hypogea by Bacillus licheniformis A2. Microbiol. Res. 2014, 169, 66–75. [Google Scholar] [CrossRef] [PubMed]
  35. APHA/AWWA/WEF. Standard Methods for the Examination of Water and Wastewater; Standard Methods; APHA/AWWA/WEF: Washington, DC, USA, 2012; 541p, ISBN 9780875532356. Available online: https://www.standardmethods.org/doi/book/10.2105/SMWW.2882 (accessed on 21 September 2024).
  36. Rajawat, M.V.S.; Singh, S.; Tyagi, S.P.; Saxena, A.K. A Modified Plate Assay for Rapid Screening of Potassium-Solubilizing Bacteria. Pedosphere 2016, 26, 768–773. [Google Scholar] [CrossRef]
  37. Alexander, D.B.; Zuberer, D.A. Use of Chrome Azurol S Reagents to Evaluate Siderophore Production by Rhizosphere Bacteria. Biol. Fertil. Soils 1991, 12, 39–45. [Google Scholar] [CrossRef]
  38. Afanador-Barajas, L.N.; Navarro-Noya, Y.E.; Luna-Guido, M.L.; Dendooven, L. Impact of a Bacterial Consortium on the Soil Bacterial Community Structure and Maize (Zea mays L.) Cultivation. Sci. Rep. 2021, 11, 13092. [Google Scholar] [CrossRef]
  39. Latorre-Pérez, A.; Gimeno-Valero, H.; Tanner, K.; Pascual, J.; Vilanova, C.; Porcar, M. A Round Trip to the Desert: In Situ Nanopore Sequencing Informs Targeted Bioprospecting. Front. Microbiol. 2021, 12, 768240. [Google Scholar] [CrossRef] [PubMed]
  40. Wick, R.R.; Judd, L.M.; Gorrie, C.L.; Holt, K.E. Completing Bacterial Genome Assemblies with Multiplex MinION Sequencing. Microb. Genom. 2017, 3, e000132. [Google Scholar] [CrossRef] [PubMed]
  41. De Coster, W.; D’Hert, S.; Schultz, D.T.; Cruts, M.; Van Broeckhoven, C. NanoPack: Visualizing and Processing Long-Read Sequencing Data. Bioinformatics 2018, 34, 2666–2669. [Google Scholar] [CrossRef]
  42. Marijon, P.; Chikhi, R.; Varré, J.S. Yacrd and Fpa: Upstream Tools for Long-Read Genome Assembly. Bioinformatics 2020, 36, 3894–3896. [Google Scholar] [CrossRef] [PubMed]
  43. Li, H. Minimap2: Pairwise Alignment for Nucleotide Sequences. Bioinformatics 2018, 34, 3094–3100. [Google Scholar] [CrossRef]
  44. Yilmaz, P.; Parfrey, L.W.; Yarza, P.; Gerken, J.; Pruesse, E.; Quast, C.; Schweer, T.; Peplies, J.; Ludwig, W.; Glöckner, F.O. The SILVA and “All-Species Living Tree Project (LTP)” Taxonomic Frameworks. Nucleic Acids Res. 2014, 42, D643–D648. [Google Scholar] [CrossRef] [PubMed]
  45. Gamaarachchi, H.; Parameswaran, S.; Smith, M.A. Featherweight Long Read Alignment Using Partitioned Reference Indexes. Sci. Rep. 2019, 9, 4318. [Google Scholar] [CrossRef]
  46. Price, M.N.; Dehal, P.S.; Arkin, A.P. FastTree 2–Approximately Maximum-Likelihood Trees for Large Alignments. PLoS ONE 2010, 5, e9490. [Google Scholar] [CrossRef] [PubMed]
  47. De Gerónimo, E.; Aparicio, V.C.; Costa, J.L. Glyphosate Sorption to Soils of Argentina. Estimation of Affinity Coefficient by Pedotransfer Function. Geoderma 2018, 322, 140–148. [Google Scholar] [CrossRef]
  48. Callahan, B.J.; Sankaran, K.; Fukuyama, J.A.; McMurdie, P.J.; Holmes, S.P. Bioconductor Workflow for Microbiome Data Analysis: From Raw Reads to Community Analyses. F1000Research 2016, 5, 1492. [Google Scholar] [CrossRef]
  49. Oksanen, J.; Simpson, G.; Blanchet, F.; Kindt, R.; Legendre, P.; Minchin, P.; O’Hara, R.; Solymos, P.; Stevens, M.; Szoecs, E.; et al. Vegan: Community Ecology Package. 2022. Available online: https://cran.r-project.org/package=vegan (accessed on 21 September 2024).
  50. Liu, C.; Cui, Y.; Li, X.; Yao, M. Microeco: An R Package for Data Mining in Microbial Community Ecology. FEMS Microbiol. Ecol. 2021, 97, 255. [Google Scholar] [CrossRef] [PubMed]
  51. Wickham, H. ggplot2; Springer: Cham, Switzerland, 2016. [Google Scholar] [CrossRef]
  52. Gu, Z.; Gu, L.; Eils, R.; Schlesner, M.; Brors, B. Circlize Implements and Enhances Circular Visualization in R. Bioinformatics 2014, 30, 2811–2812. [Google Scholar] [CrossRef]
  53. Auguie, B. GridExtra: Miscellaneous Functions for “Grid” Graphics 2017. Available online: https://cran.r-project.org/web/packages/gridExtra/gridExtra.pdf (accessed on 22 September 2024).
  54. Liang, W.; Wu, Y.; Ma, X. Robust Sparse Precision Matrix Estimation for High-Dimensional Compositional Data. Stat. Probab. Lett. 2022, 184, 109379. [Google Scholar] [CrossRef]
  55. Csárdi, G.; Nepusz, T.; Traag, V.; Horvát, S.; Zanini, F.; Noom, D.; Müller, K. Igraph: Network Analysis and Visualization in R. 2024. Available online: https://igraph.org/r/pdf/latest/igraph.pdf (accessed on 28 October 2024).
  56. Bastian, M.; Heymann, S.; Jacomy, M. Gephi: An Open Source Software for Exploring and Manipulating Networks. Proc. Int. AAAI Conf. Web Soc. Media 2009, 3, 361–362. [Google Scholar] [CrossRef]
  57. Manogaran, M.; Ahmad, S.A.; Yasid, N.A.; Yakasai, H.M.; Shukor, M.Y. Characterisation of the Simultaneous Molybdenum Reduction and Glyphosate Degradation by Burkholderia Vietnamiensis AQ5-12 and Burkholderia Sp. AQ5-13. 3 Biotech 2018, 8, 1–8. [Google Scholar] [CrossRef]
  58. Massot, F.; Gkorezis, P.; Van Hamme, J.; Marino, D.; Trifunovic, B.S.; Vukovic, G.; d’Haen, J.; Pintelon, I.; Giulietti, A.M.; Merini, L.; et al. Isolation, Biochemical and Genomic Characterization of Glyphosate Tolerant Bacteria to Perform Microbe-Assisted Phytoremediation. Front. Microbiol. 2021, 11, 598507. [Google Scholar] [CrossRef]
  59. Chen, Y.; Chen, W.J.; Huang, Y.; Li, J.; Zhong, J.; Zhang, W.; Zou, Y.; Mishra, S.; Bhatt, P.; Chen, S. Insights into the Microbial Degradation and Resistance Mechanisms of Glyphosate. Environ. Res. 2022, 215, 114153. [Google Scholar] [CrossRef] [PubMed]
  60. Yadav, A.N.; Sachan, S.G.; Verma, P.; Kaushik, R.; Saxena, A.K. Cold Active Hydrolytic Enzymes Production by Psychrotrophic Bacilli Isolated from Three Sub-Glacial Lakes of NW Indian Himalayas. J. Basic Microbiol. 2016, 56, 294–307. [Google Scholar] [CrossRef]
  61. Singh, V.K.; Mishra, A.; Jha, B. 3-Benzyl-Hexahydro-Pyrrolo[1,2-a]Pyrazine-1,4-Dione Extracted from Exiguobacterium Indicum Showed Anti-Biofilm Activity against Pseudomonas Aeruginosa by Attenuating Quorum Sensing. Front. Microbiol. 2019, 10, 435900. [Google Scholar] [CrossRef] [PubMed]
  62. Nguyen, N.T.; Vo, V.T.; Nguyen, T.H.P.; Kiefer, R. Isolation and Optimization of a Glyphosate-Degrading Rhodococcus Soli G41 for Bioremediation. Arch. Microbiol. 2022, 204, 252. [Google Scholar] [CrossRef] [PubMed]
  63. Khalifa, A.Y.Z. Degradation of Diesel-Oil by a Newly Isolated Kocuria sediminis DDK6. Afr. J. Microbiol. Res. 2017, 11, 400–407. [Google Scholar] [CrossRef]
  64. Lalević, B.T.; Jović, J.B.; Raičević, V.B.; Kljujev, I.S.; Kiković, D.D.; Hamidović, S.R. Biodegradation of Methyl-Tert-Butyl Ether by Kocuria sp. Hem. Ind. 2012, 66, 717–722. [Google Scholar] [CrossRef]
  65. Castro, D.B.A.; Pereira, L.B.; e Silva, M.V.M.; da Silva, B.P.; Palermo, B.R.Z.; Carlos, C.; Belgini, D.R.B.; Limache, E.E.G.; Lacerda, G.V.J.; Nery, M.B.P.; et al. High-Quality Draft Genome Sequence of Kocuria marina SO9-6, an Actinobacterium Isolated from a Copper Mine. Genom. Data 2015, 5, 34–35. [Google Scholar] [CrossRef] [PubMed]
  66. Harshvardhan, K.; Jha, B. Biodegradation of Low-Density Polyethylene by Marine Bacteria from Pelagic Waters, Arabian Sea, India. Mar. Pollut. Bull. 2013, 77, 100–106. [Google Scholar] [CrossRef] [PubMed]
  67. Feng, D.; Soric, A.; Boutin, O. Treatment Technologies and Degradation Pathways of Glyphosate: A Critical Review. Sci. Total Environ. 2020, 742, 140559. [Google Scholar] [CrossRef] [PubMed]
  68. Battaglin, W.A.; Meyer, M.T.; Kuivila, K.M.; Dietze, J.E. Glyphosate and Its Degradation Product AMPA Occur Frequently and Widely in U.S. Soils, Surface Water, Groundwater, and Precipitation. JAWRA J. Am. Water Resour. Assoc. 2014, 50, 275–290. [Google Scholar] [CrossRef]
  69. Aslam, S.; Arslan, M.; Nowak, K.M. Microbial Activity, Community Composition and Degraders in the Glyphosate-Spiked Soil Are Driven by Glycine Formation. Sci. Total Environ. 2024, 907, 168206. [Google Scholar] [CrossRef]
  70. Wilms, W.; Parus, A.; Homa, J.; Batycka, M.; Niemczak, M.; Woźniak-Karczewska, M.; Trzebny, A.; Zembrzuska; Dabert, M.; Táncsics, A.; et al. Glyphosate versus Glyphosate Based Ionic Liquids: Effect of Cation on Glyphosate Biodegradation, SoxA and PhnJ Genes Abundance and Microbial Populations Changes during Soil Bioaugmentation. Chemosphere 2023, 316, 137717. [Google Scholar] [CrossRef] [PubMed]
  71. Pérez, G.L.; Torremorell, A.; Mugni, H.; Rodríguez, P.; Solange Vera, M.; Do Nascimento, M.; Allende, L.; Bustingorry, J.; Escaray, R.; Ferraro, M.; et al. Effects of the herbicide Roundup on freshwater microbial communities: A mesocosm study. Ecol. Appl. 2007, 17, 2310–2322. [Google Scholar] [CrossRef]
  72. Guo, B.; Guo, Y.; Hong, H.; Jin, L.; Zhang, L.; Chang, R.Z.; Lu, W.; Lin, M.; Qiu, L.J. Co-Expression of G2-EPSPS and Glyphosate Acetyltransferase GAT Genes Conferring High Tolerance to Glyphosate in Soybean. Front. Plant Sci. 2015, 6, 138289. [Google Scholar] [CrossRef]
  73. Castrejón-Godínez, M.L.; Tovar-Sánchez, E.; Valencia-Cuevas, L.; Rosas-Ramírez, M.E.; Rodríguez, A.; Mussali-Galante, P. Glyphosate Pollution Treatment and Microbial Degradation Alternatives, a Review. Microorganisms 2021, 9, 2322. [Google Scholar] [CrossRef]
  74. Elarabi, N.I.; Abdelhadi, A.A.; Ahmed, R.H.; Saleh, I.; Arif, I.A.; Osman, G.; Ahmed, D.S. Bacillus Aryabhattai FACU: A Promising Bacterial Strain Capable of Manipulate the Glyphosate Herbicide Residues. Saudi J. Biol. Sci. 2020, 27, 2207–2214. [Google Scholar] [CrossRef] [PubMed]
  75. Langarica-Fuentes, A.; Straub, D.; Wimmer, B.; Thompson, K.; Nahnsen, S.; Huhn, C.; Kleindienst, S. Subtle Microbial Community Changes despite Rapid Glyphosate Degradation in Microcosms with Four German Agricultural Soils. Appl. Soil Ecol. 2024, 198, 105381. [Google Scholar] [CrossRef]
  76. Kanissery, R.; Gairhe, B.; Kadyampakeni, D.; Batuman, O.; Alferez, F. Glyphosate: Its Environmental Persistence and Impact on Crop Health and Nutrition. Plants 2019, 8, 499. [Google Scholar] [CrossRef] [PubMed]
  77. Liu, S.; Khan, M.H.; Yuan, Z.; Hussain, S.; Cao, H.; Liu, Y. Response of Soil Microbiome Structure and Its Network Profiles to Four Soil Amendments in Monocropping Strawberry Greenhouse. PLoS ONE 2021, 16, e0245180. [Google Scholar] [CrossRef] [PubMed]
  78. de Vries, F.T.; Griffiths, R.I.; Bailey, M.; Craig, H.; Girlanda, M.; Gweon, H.S.; Hallin, S.; Kaisermann, A.; Keith, A.M.; Kretzschmar, M.; et al. Soil Bacterial Networks Are Less Stable under Drought than Fungal Networks. Nat. Commun. 2018, 9, 3033. [Google Scholar] [CrossRef] [PubMed]
  79. Qi, G.; Ma, G.; Chen, S.; Lin, C.; Zhao, X. Microbial Network and Soil Properties Are Changed in Bacterial Wilt-Susceptible Soil. Appl. Environ. Microbiol. 2019, 85, 00162-19. [Google Scholar] [CrossRef] [PubMed]
  80. Wagg, C.; Dudenhöffer, J.H.; Widmer, F.; van der Heijden, M.G.A. Linking Diversity, Synchrony and Stability in Soil Microbial Communities. Funct. Ecol. 2018, 32, 1280–1292. [Google Scholar] [CrossRef]
  81. Kavya, Y.; Trimurtulu, N.; Gopal, A.V.; Vani, P.M.; Prasad, N.V.V.S.D. Effect of Inoculation of Microbial Consortia on Soil Physicochemical and Nutrient Status. Curr. J. Appl. Sci. Technol. 2020, 39, 1–8. [Google Scholar] [CrossRef]
  82. Moliterni, E.; Jiménez-Tusset, R.G.; Villar Rayo, M.; Rodriguez, L.; Fernández, F.J.; Villaseñor, J. Kinetics of Biodegradation of Diesel Fuel by Enriched Microbial Consortia from Polluted Soils. Int. J. Environ. Sci. Technol. 2012, 9, 749–758. [Google Scholar] [CrossRef]
  83. Corstanje, R.; Deeks, L.R.; Whitmore, A.P.; Gregory, A.S.; Ritz, K. Probing the Basis of Soil Resilience. Soil Use Manag. 2015, 31, 72–81. [Google Scholar] [CrossRef]
  84. Bardgett, R.D.; Caruso, T. Soil Microbial Community Responses to Climate Extremes: Resistance, Resilience and Transitions to Alternative States. Philos. Trans. R. Soc. B 2020, 375, 20190112. [Google Scholar] [CrossRef] [PubMed]
  85. Zhou, J.; Deng, Y.; Luo, F.; He, Z.; Tu, Q.; Zhi, X. Functional Molecular Ecological Networks. mBio 2010, 1, 169–179. [Google Scholar] [CrossRef] [PubMed]
  86. Haney, R.; Senseman, S.; Hons, F.; Zuberer, D. Effect of Glyphosate on Soil Microbial Activity and Biomass on JSTOR. Available online: https://www.jstor.org/stable/4046161 (accessed on 15 May 2024).
  87. Das, S.; Kim, G.W.; Hwang, H.Y.; Verma, P.P.; Kim, P.J. Cropping with Slag to Address Soil, Environment, and Food Security. Front. Microbiol. 2019, 10, 440580. [Google Scholar] [CrossRef]
  88. Siles, J.A.; García-Sánchez, M.; Gómez-Brandón, M. Studying Microbial Communities through Co-Occurrence Network Analyses during Processes of Waste Treatment and in Organically Amended Soils: A Review. Microorganisms 2021, 9, 1165. [Google Scholar] [CrossRef] [PubMed]
  89. Ohtonen, R.; Fritze, H.; Pennanen, T.; Jumpponen, A.; Trappe, J. Ecosystem Properties and Microbial Community Changes in Primary Succession on a Glacier Forefront. Oecologia 1999, 119, 239–246. [Google Scholar] [CrossRef]
  90. Zhao, M.; Wang, M.; Zhao, Y.; Hu, N.; Qin, L.; Ren, Z.; Wang, G.; Jiang, M. Soil Microbial Abundance Was More Affected by Soil Depth than the Altitude in Peatlands. Front. Microbiol. 2022, 13, 1068540. [Google Scholar] [CrossRef]
  91. Tan, L.; Gu, S.; Li, S.; Ren, Z.; Deng, Y.; Liu, Z.; Gong, Z.; Xiao, W.; Hu, Q. Responses of Microbial Communities and Interaction Networks to Different Management Practices in Tea Plantation Soils. Sustainability 2019, 11, 4428. [Google Scholar] [CrossRef]
  92. Wang, Y.; Ma, L.; Liu, Z.; Chen, J.; Song, H.; Wang, J.; Cui, H.; Yang, Z.; Xiao, S.; Liu, K.; et al. Microbial Interactions Play an Important Role in Regulating the Effects of Plant Species on Soil Bacterial Diversity. Front. Microbiol. 2022, 13, 984200. [Google Scholar] [CrossRef] [PubMed]
  93. You, Y.; Wang, J.; Huang, X.; Tang, Z.; Liu, S.; Sun, O.J. Relating Microbial Community Structure to Functioning in Forest Soil Organic Carbon Transformation and Turnover. Ecol. Evol. 2014, 4, 633–647. [Google Scholar] [CrossRef] [PubMed]
  94. Ma, L.; Huang, W.; Guo, C.; Wang, R.; Xiao, C. Soil Microbial Properties and Plant Growth Responses to Carbon and Water Addition in a Temperate Steppe: The Importance of Nutrient Availability. PLoS ONE 2012, 7, e35165. [Google Scholar] [CrossRef] [PubMed]
  95. Song, H.S.; Renslow, R.S.; Fredrickson, J.K.; Lindemann, S.R. Integrating Ecological and Engineering Concepts of Resilience in Microbial Communities. Front. Microbiol. 2015, 6, 164175. [Google Scholar] [CrossRef]
  96. Zhong, W.; Gu, T.; Wang, W.; Zhang, B.; Lin, X.; Huang, Q.; Shen, W. The Effects of Mineral Fertilizer and Organic Manure on Soil Microbial Community and Diversity. Plant Soil 2010, 326, 511–522. [Google Scholar] [CrossRef]
  97. Agyekum, D.V.A.; Kobayashi, T.; Dastogeer, K.M.G.; Yasuda, M.; Sarkodee-Addo, E.; Ratu, S.T.N.; Xu, Q.; Miki, T.; Matsuura, E.; Okazaki, S. Diversity and Function of Soybean Rhizosphere Microbiome under Nature Farming. Front. Microbiol. 2023, 14, 1130969. [Google Scholar] [CrossRef] [PubMed]
  98. Ziesack, M.; Gibson, T.; Oliver, J.K.W.; Shumaker, A.M.; Hsu, B.B.; Riglar, D.T.; Giessen, T.W.; DiBenedetto, N.V.; Bry, L.; Way, J.C.; et al. Engineered Interspecies Amino Acid Cross-Feeding Increases Population Evenness in a Synthetic Bacterial Consortium. mSystems 2019, 4, e00352-19. [Google Scholar] [CrossRef] [PubMed]
  99. Bai, R.; Wang, J.T.; Deng, Y.; He, J.Z.; Feng, K.; Zhang, L.M. Microbial Community and Functional Structure Significantly Varied among Distinct Types of Paddy Soils but Responded Differently along Gradients of Soil Depth Layers. Front. Microbiol. 2017, 8, 260931. [Google Scholar] [CrossRef] [PubMed]
  100. Zhu, R.; Liu, J.; Wang, J.; Han, W.; Shen, Z.; Muraina, T.O.; Chen, J.; Sun, D. Comparison of Soil Microbial Community between Reseeding Grassland and Natural Grassland in Songnen Meadow. Sci. Rep. 2020, 10, 16884. [Google Scholar] [CrossRef]
  101. Cuartero, J.; Özbolat, O.; Sánchez-Navarro, V.; Weiss, J.; Zornoza, R.; Pascual, J.A.; Vivo, J.M.; Ros, M. Long-Term Compost Amendment Changes Interactions and Specialization in the Soil Bacterial Community, Increasing the Presence of Beneficial N-Cycling Genes in the Soil. Agronomy 2022, 12, 316. [Google Scholar] [CrossRef]
  102. Kulikova, N.A.; Zhelezova, A.D.; Filippova, O.I.; Plyushchenko, I.V.; Rodin, I.A. The Degradation of Glyphosate and Its Effect on the Microbial Community of Agro-Sod–Podzolic Soil under Short-Term Model Experiment Conditions. Mosc. Univ. Soil Sci. Bull. 2020, 75, 138–145. [Google Scholar] [CrossRef]
  103. Liao, X.; Zhao, J.; Yi, Q.; Li, J.; Li, Z.; Wu, S.; Zhang, W.; Wang, K. Metagenomic Insights into the Effects of Organic and Inorganic Agricultural Managements on Soil Phosphorus Cycling. Agric. Ecosyst. Environ. 2023, 343, 108281. [Google Scholar] [CrossRef]
  104. Ferdush, J.; Paul, V. A Review on the Possible Factors Influencing Soil Inorganic Carbon under Elevated CO2. Catena 2021, 204, 105434. [Google Scholar] [CrossRef]
  105. Zhang, B.; Gao, R.; Dong, X. The Seasonal Impact of Thinning Intensities on Soil Carbon Cycling in the Lesser Xing’an Range, Northeast China. Forests 2024, 15, 449. [Google Scholar] [CrossRef]
  106. Johnson, E.T.; Bowman, M.J.; Gomes, R.P.; Carneiro, L.C.; Dunlap, C.A. Identification of 2,4-Diacetylphloroglucinol Production in the Genus Chromobacterium. Sci. Rep. 2023, 13, 14292. [Google Scholar] [CrossRef] [PubMed]
  107. Castro Tapia, M.P.; Madariaga Burrows, R.P.; Ruiz Sepúlveda, B.; Vargas Concha, M.; Vera Palma, C.; Moya-Elizondo, E.A. Antagonistic Activity of Chilean Strains of Pseudomonas Protegens Against Fungi Causing Crown and Root Rot of Wheat (Triticum aestivum L.). Front. Plant Sci. 2020, 11, 540430. [Google Scholar] [CrossRef]
  108. Devi, U.A.; Srinivas, T.; Parvathi, D.; Venkateshwarlu, M.; Ugandhar, T. The Impact of Innovative Research Methods for Enhancing Agricultural Plants for Sustainable Development in The Future. Int. Res. J. Adv. Eng. Manag. (IRJAEM) 2024, 2, 65–73. [Google Scholar] [CrossRef]
  109. Aguilar-Paredes, A.; Valdés, G.; Araneda, N.; Valdebenito, E.; Hansen, F.; Nuti, M. Microbial Community in the Composting Process and Its Positive Impact on the Soil Biota in Sustainable Agriculture. Agronomy 2023, 13, 542. [Google Scholar] [CrossRef]
Figure 1. The dynamic between glyphosate and AMPA concentration in soil for 60 days. (A,B) show control (CTL), AS03 (E. indicum), AS04 (K. sediminis), and AS33 (R. rhodochrous). (C,D) show CTL, compared with CS (a consortium of AS03, AS04, and AS33) and CS + MS (consortium plus soil microorganisms). Different lowercase letters each time indicate significant differences for the Tukey test (p < 0.05) and n = 4.
Agriculture 15 00362 g001
Figure 2. Relative abundance (%) of soil bacterial community at different taxonomic levels and conditions. (A) shows the relative abundance at the phylum level in response to treatments, including sterilized soil inoculated with isolates (AS03, AS04, AS33), sterilized soil inoculated with a microbial consortium (CS), sterilized soil inoculated with a consortium and native microbiota (CS + MS), and the control (CTL). (B) presents the relative abundance at the genus level under the same treatments as in (A). (C) illustrates the relative abundance at the genus level across three time points: T0 (before glyphosate application), T42 (42 days after application), and T60 (60 days after application). Hierarchical clustering dendrograms are included in each figure to demonstrate the similarities in community composition among treatments (A,B) or time points (C).
Agriculture 15 00362 g002
Figure 3. Temporal variation in the relative abundance of soil bacterial communities at the genus level across different treatments. The charts display data from bacterial isolates (AS03, AS04, AS33), microbial consortia (CS, CS + MS), and a control treatment (CTL). Each color represents a specific bacterial genus, as indicated in the legend on the right of each graph. The time scale (T0, T42, T60) denotes days after glyphosate application.
Agriculture 15 00362 g003
Figure 4. NMDS plots in a “facet grid” format depict the dynamics of soil bacterial composition at three time points: T0, T42, and T60. These plots assess the impact of treatments AS03, AS04, AS33, CS, CS + MS, and control (CTL), highlighting variations in microbial composition over time and across treatments, analyzed using the weighted UNIFRAC metric. Stress NMDS = 0.14.
Agriculture 15 00362 g004
Figure 5. Network analysis of soil bacterial communities for different microbial treatments across time points (T0, T42, and T60 days after glyphosate application). (A) displays network graphs for bacterial isolates (AS03, AS04, AS33), a control group (CTL), and microbial consortia (CS, CS + MS). Nodes represent bacterial genera, color-coded by modularity class, with edges indicating significant co-occurrence or co-exclusion interactions. (B) details network metrics: number of nodes (total genera), number of edges (interactions), positive and negative connections, positive/negative (P/N) ratio (balance of interactions), average degree (average connections per node), network diameter (most significant distance between nodes), modularity (network division into modules), and average path length (average number of steps along the shortest paths for all possible pairs of nodes). These metrics reveal the structural complexity and interaction dynamics within each treatment.
Agriculture 15 00362 g005
Figure 6. Heatmap of relative abundance (%) of predicted functional genes across different treatments. Each row represents a gene grouped by its involvement in key biogeochemical cycles or ecological processes: “aroA” (EPSP synthase) and “glpT” (glycerol-3-phosphate transporter) for the phosphorus cycle; “nifH” (nitrogenase), “nosZ” (nitrous oxide reductase), and “nirK” (nitrite reductase) for the nitrogen cycle; “mdh” (malate dehydrogenase) and “gltA” (citrate synthase) for the carbon cycle. Genes involved in disease control, such as “phlD” (phytoalexin synthase) and “chiA” (chitinase), and others involved in biodegradation, such as “mpd.1” and “mpd.2” (methyl parathion hydrolase), are also included. Rows are organized by their corresponding cycle or process. Color intensity reflects the relative abundance of predicted genes, ranging from low (blue) to high (red). Columns represent treatments (AS03, AS04, AS33, CS, CS + MS, and CTL). Statistical differences between treatments are indicated by letters (a, b, ab) next to specific genes, calculated using ANOVA (p < 0.05). Asterisks (*) next to cycle names denote genes with significant differences.
Agriculture 15 00362 g006
Figure 7. Redundancy analysis (RDA) was performed to show the relationships between environmental variables, glyphosate and AMPA concentration, and microbial communities. It shows treatments noted by color and time after glyphosate application in circles, triangles, or squares.
Agriculture 15 00362 g007
Table 1. Soil characterization.
ParameterSoil a
Total Phosphorous (TP) (mg kg−1)1253.3 ± 35.9
Total Nitrogen (TN) (mg kg−1)2443.4 ± 148.0
Total Organic Carbon (TOC) (%)7.8 ± 0.1
MO %13.5 ± 0.2
pH7.4 ± 0.03
Available Phosphorous (AP) (mg kg−1)828.0 ± 84.8
CE mS cm−119.2 ± 4.4
NH4+ (mg kg−1)20.8 ± 1.4
NO2 (mg kg−1)0.5 ± 0.03
NO3 (mg kg−1)48.3 ± 1.9
Inorganic Nitrogen (mg kg−1)69.6 ± 1.0
Sand (%)27.7 ± 1.2
Silt (%)28.7 ± 3.1
Clay (%)43.6 ± 4.0
TextureClay
Cd (mg kg−1)<0.25 ± 0.0
Cr (mg kg−1)11.4 ± 0.1
Zn (mg kg−1)43.9 ± 1.1
Hg (mg kg−1)<0.1 ± 0.0
Ni (mg kg−1)4.1 ± 0.1
Pb (mg kg−1)5.7 ± 3.3
a Average of three compound samples.
Table 2. Tolerance to growth in glyphosate as a carbon source and PGPB traits from three strains were evaluated.
Code StrainBacteria
Identification *
Glyphosate Concentration **PGPB Traits
4060100Phosphorous Solubilization aAmmonium Production bPotassium
Solubilization c
Siderophores dIAA Auxin e
WithWithout
Tryptophane
−−−−−−−−−−−−−−−−−−mg L−1−−−−−−−−−−−−−−−−−−−−−−−−−−−−−S.I **−−−−−−−−−−−−−−mg L−1−−−−
As03Exiguobacterium indicum (1.75)••••••15.1 ± 1.02 a28.8 ± 9.1 a0 c0.5 ± 0.2 bc0.08 ± 0.01 b0.008 ±0.002 a
As04Kocuria
sediminis (1.8)
••••••13 ± 1.22 ab23.06 ± 0.15 ab8.4 ± 0.20 a0.63 ± 0.15 ab0.41 ± 0.30 b0.02 ± 0.003 a
As33Rhodococcus
rhodochrous (2.17)
••••••10.2 ± 2.1 ab31.1 ± 2.65 a6.6 ± 0.3 ab0.86 ± 0.3 ab86.61 ± 8.09 a0.002 ± 0.001 a
* By 16S and MALDI TOF (score) at genera level; •• means high growth. Different lowercase letters are statistically significant between rows. a [34]; b [35]; c [36]; d [37]; e Indole-3-acetic acid (IAA) by LC-MS/MS according to [22]. ** S.I. solubilization index = halo diameter/colony diameter.
Table 3. Code treatment, soil condition, inoculation, and treatment description.
Code for
Treatments
Soil ConditionInoculationTreatment Description (Responsible)
CTLNot sterilizedNoneControl soil
(autochthonous microorganisms)
AS03SterilizedExiguobacterium indicum As03As03 strain (Exiguobacterium indicum)
AS04SterilizedKocuria sediminis As04As04 strain (Kocuria sediminis)
AS33SterilizedRhodococcus rhodochrous As33As33 strain (Rhodococcus rhodochrous)
CSSterilizedConsortium As03-AS04-AS33 strainsConsortium
(As03-AS04-AS33 strains)
CS + MSNot sterilizedConsortium As03-AS04-AS33 strainsConsortium plus soil microorganisms
(consortium As03-AS04-AS33 + autochthonous microorganisms)
Table 4. The partial Mantel test assessed the Pearson correlation between environmental variables and community dissimilarity (considering p-value < 0.05).
VariablesPearson’s Correlation Coefficientp-ValueSignificance
Glyphosate0.065633040.025*
AMPA 0.104415770.005*
Cr −0.013193770.625
Zn −0.039104450.845
Ni −0.030348510.789
Total_P −0.065256340.964
* Means significance difference to p-value < 0.05.
Disclaimer/Publisher’s Note: The statements, opinions and data contained in all publications are solely those of the individual author(s) and contributor(s) and not of MDPI and/or the editor(s). MDPI and/or the editor(s) disclaim responsibility for any injury to people or property resulting from any ideas, methods, instructions or products referred to in the content.

