Article

Portable Machine with Embedded System for Applying Granulated Fertilizers at Variable Rate

by
Igor Rodrigues Quintão
,
Domingos Sárvio Magalhães Valente
,
André Luiz de Freitas Coelho
*,
Daniel Marçal de Queiroz
,
Marconi Ribeiro Furtado Junior
,
Flora Maria de Melo Villar
and
Pedro Henrique de Moura Rodrigues
Department of Agricultural Engineering, Federal University of Viçosa, Viçosa 36570-900, MG, Brazil
*
Author to whom correspondence should be addressed.
Agriculture 2025, 15(4), 361; https://doi.org/10.3390/agriculture15040361
Submission received: 11 December 2024 / Revised: 24 January 2025 / Accepted: 4 February 2025 / Published: 8 February 2025
(This article belongs to the Special Issue Research Advances in Perception for Agricultural Robots)

Abstract

:
Coffee production in mountainous regions faces significant challenges to mechanization, particularly in management and fertilization. Fertilizer application remains largely manual, reducing accuracy and failing to meet the demands of variable-rate application (VRA). This study developed a portable VRA fertilizer applicator with an embedded electronic control system. The innovation lies in its electrically driven metering mechanism integrated with an electronic control unit (ECU), enabling site-specific fertilization based on prescription maps or predefined rates while recording application coordinates. The mechanism was tested under laboratory and field conditions, evaluating its performance across four fertilizer types, varying inclination angles, and rotational speeds. Results showed a coefficient variation of 0.41% for doses above 24 g, demonstrating high consistency irrespective of fertilizer type or terrain slope. Field tests using potassium chloride (KCl) prescriptions (55, 123, and 185 g/plant; 220, 492, and 740 kg/ha) revealed minimal deviations, with the largest at 22.72 g and the smallest at 0.384 g. These findings demonstrate the applicator’s precision and efficiency, addressing the challenges of mountainous terrains. This system provides technological advancement for sustainable coffee production, enhancing resource optimization and supporting precision agriculture in challenging environments.

1. Introduction

Mountain regions play a vital role in global coffee production, accounting for approximately 80% of total coffee output worldwide [1]. However, the challenging topography of these areas, characterized by steep slopes, limits the adoption of mechanized operations, making agricultural practices heavily reliant on manual labor [2,3,4]. This dependency is particularly evident in critical activities such as harvesting and nutritional management, where inefficiencies can directly impact coffee quality, yield, and profitability.
Nutritional management is a cornerstone of coffee cultivation, influencing crop productivity and ensuring economic and environmental sustainability [5]. Precision agriculture offers innovative tools to enhance decision-making in plant nutrition, such as variable-rate application (VRA) of fertilizers [6]. This technique enables site-specific management, ensuring that each segment of the field receives the precise amount of fertilizer required to achieve optimal yield and quality, while considering soil nutrient availability [7]. However, the implementation of precision agriculture in mountainous regions faces significant technological challenges, particularly due to the lack of machinery adapted for these terrains.
Developing portable machinery specifically designed for mountainous regions is essential to overcome these physical constraints and provide scalable, affordable solutions for smallholder farmers. Portability ensures adaptability to the unique conditions of steep terrains, facilitates precision agriculture practices, and promotes advanced agricultural techniques in areas traditionally reliant on manual operations.
Fertilizer applicators are typically classified based on their metering mechanisms, which include screw conveyors and centrifugal disc spreaders. While centrifugal disc spreaders are widely used in flat, expansive fields due to their high distribution capacity [8], adjustment to the effective swath spacing or rotation speed of the disc is needed to improve application accuracy [9]. Their complexity and reliance on precise swath adjustments make them unsuitable for variable-rate applications in mountainous terrains. In contrast, screw conveyors offer a more controlled and consistent distribution of granular fertilizers, achieving coefficient of variation (CV) values below 10%. This mechanism has been the subject of scientific studies aimed at the evaluation, improvement, and development of new models [10,11,12,13,14]. Despite these advancements, existing systems are rarely designed for site-specific management fertilizer applications in mountain agriculture.
A fixed-amount and variable-rate fertilizer applicator with a centrifugal disc was designed by [10] and their results for CV values were both less than 13%. Reference [9] evaluates the uniformity of fertilizer application for different granular applicators and uses a CV of 20% as an acceptable level of uniformity. Reference [15] obtained results for a CV of 10.36% for their mechanism. The mechanism screw conveyor generally has low dispersion; [13] obtained a CV of less than 10%. Reference [11] proposed a new mechanism, helical cylindrical-conical screw, which proved to be efficient with respect to flow rate, with a coefficient of variation ranging from 3.1% to 5.8% for various treatments. However, these studies were not designed for site-specific fertilizer application in coffee plantations (crop perennial) located in mountainous terrain.
Granular fertilizers present inherent variability in physical properties, including material density, particle size, and moisture content, particularly in hygroscopic types [16]. These variations can significantly affect the uniformity of fertilizer distribution, increasing the likelihood of application errors [9]. Therefore, addressing these challenges while enabling precise fertilizer application in complex terrains remains a need.
Given the limitations of current machinery and the growing demand for precision solutions in mountain agriculture, this study hypothesizes that integrating an electronic dosage system with a Global Navigation Satellite System (GNSS) embedded in portable machine and soil fertility-based application maps can enable efficient and accurate fertilizer application. This approach aims to optimize resource utilization and promote application based on site-specific fertility level information and anticipated crop needs in mountainous regions. The objective of this study was to develop a portable machine equipped with an electric fertilizer metering mechanism capable of variable-rate application for perennial crops in mountainous regions. This innovative system represents technological advancement, bridging critical gaps in knowledge and equipment availability for precision agriculture in challenging terrains.

2. Materials and Methods

The study was conducted at the Agricultural Mechanization Laboratory (LMA) of the Agricultural Engineering Department (DEA) of the Federal University of Viçosa (UFV). The field tests were carried out at the Colibri Jatobá farm, a specialty coffee producer located in the municipality of Paula Cândido, Minas Gerais, Brazil. The tests were carried out in an area of 2.57 ha, with mountainous relief, clayey soil, with coffee in production of the Catuaí Vermelho type and density of 4000 plants per ha.
The present study was conducted following a process organized by the following steps: (i) design and development of an electric fertilizer metering mechanism with the capacity to apply at variable rates, accompanied by its Electronic Control Unit (ECU); (ii) conduction of tests to evaluate the performance of this mechanism under conditions of variation in rotation speed, inclinations and types of fertilizers; and (iii) execution of a field test to evaluate the effectiveness of the electric metering mechanism in the variable-rate application of fertilizers.

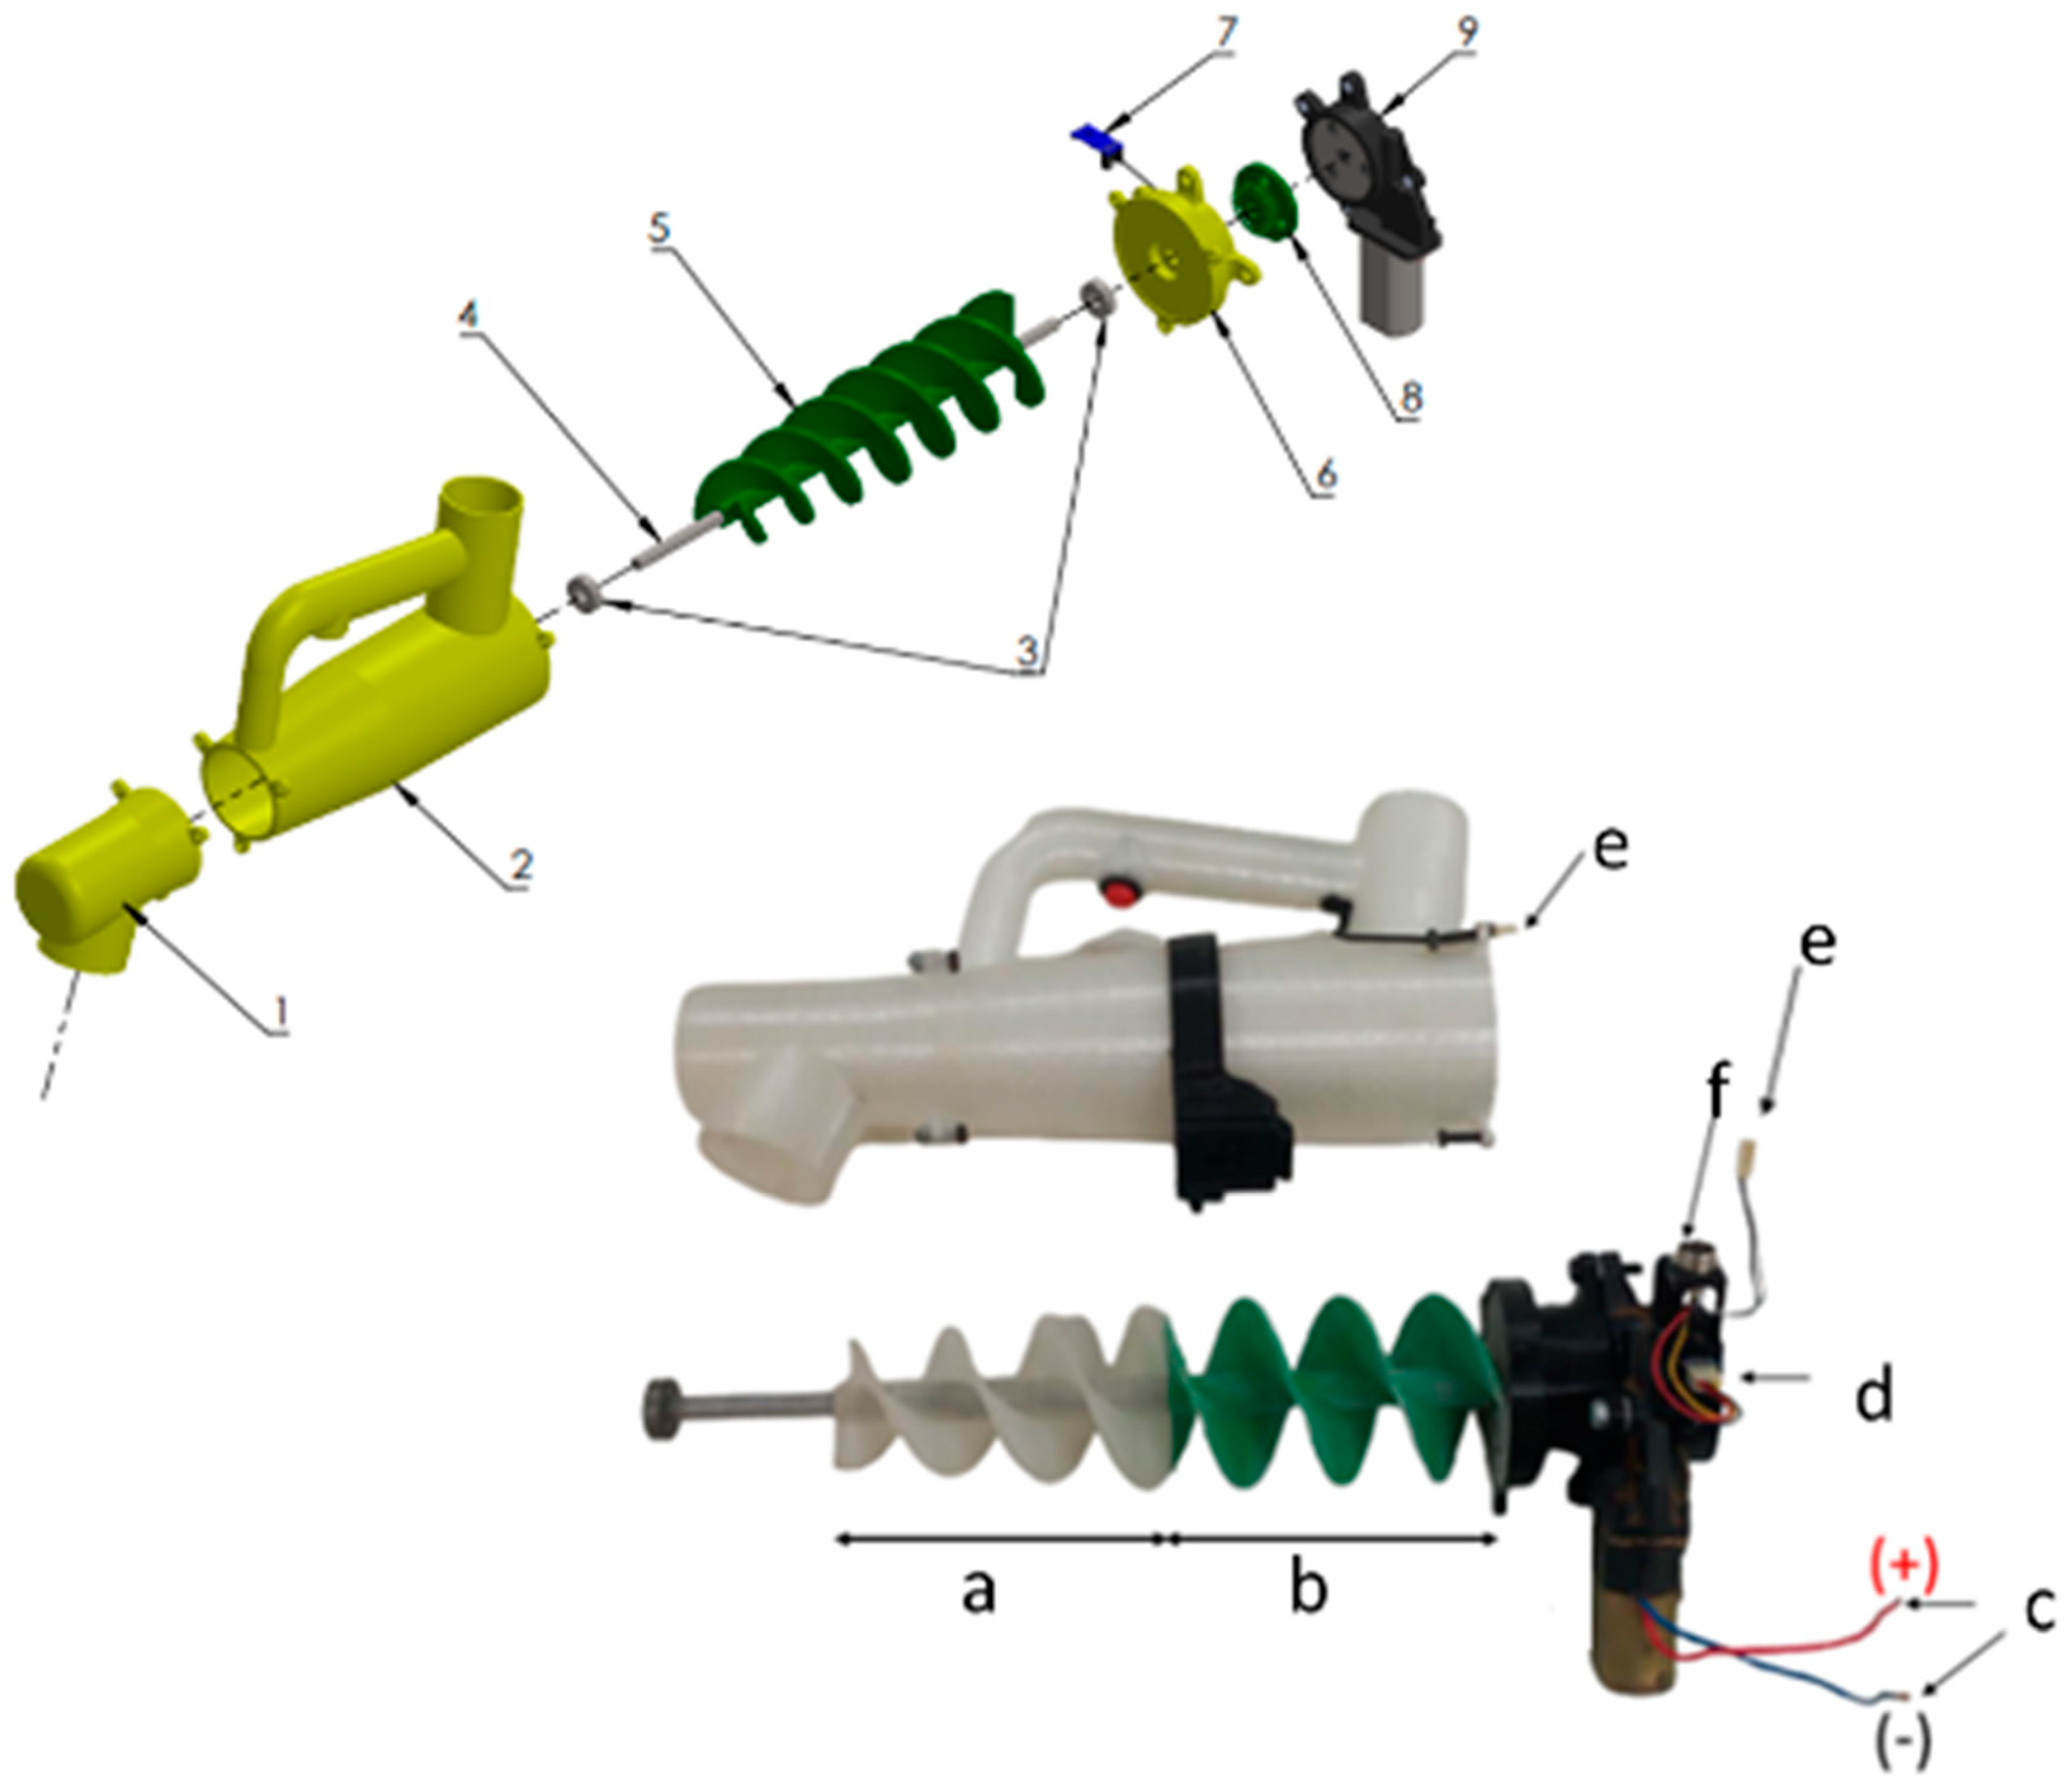
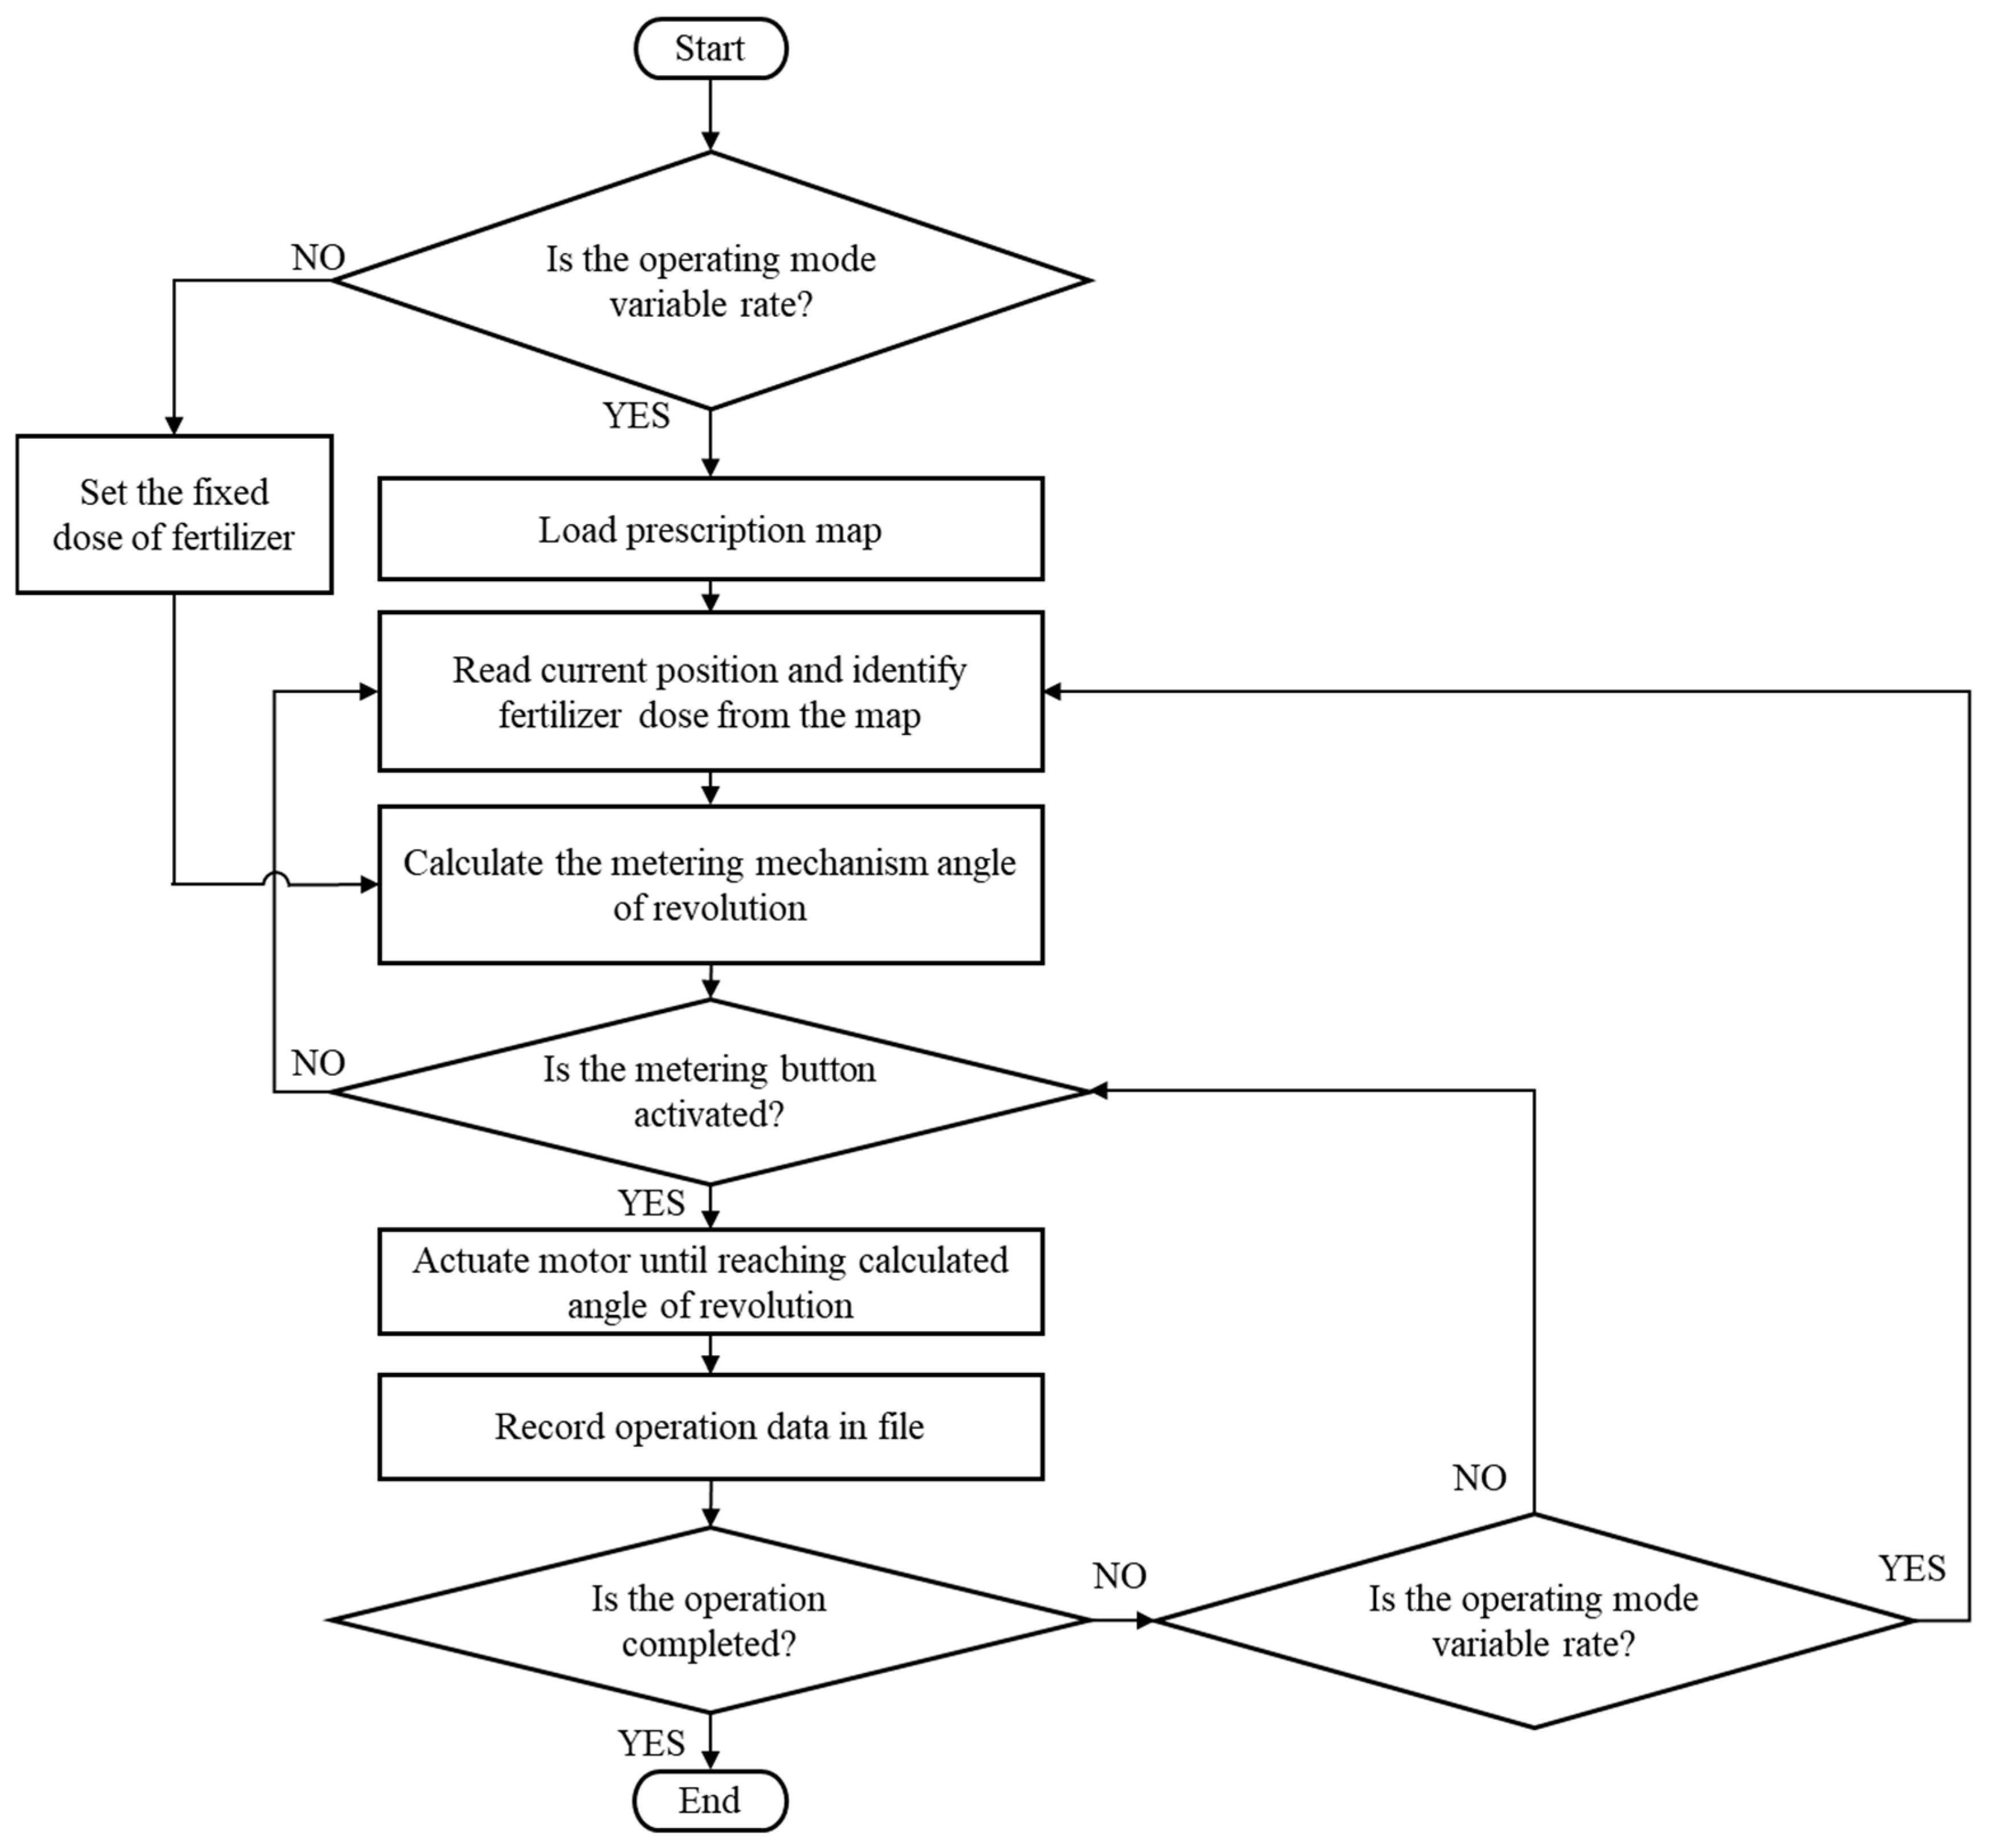
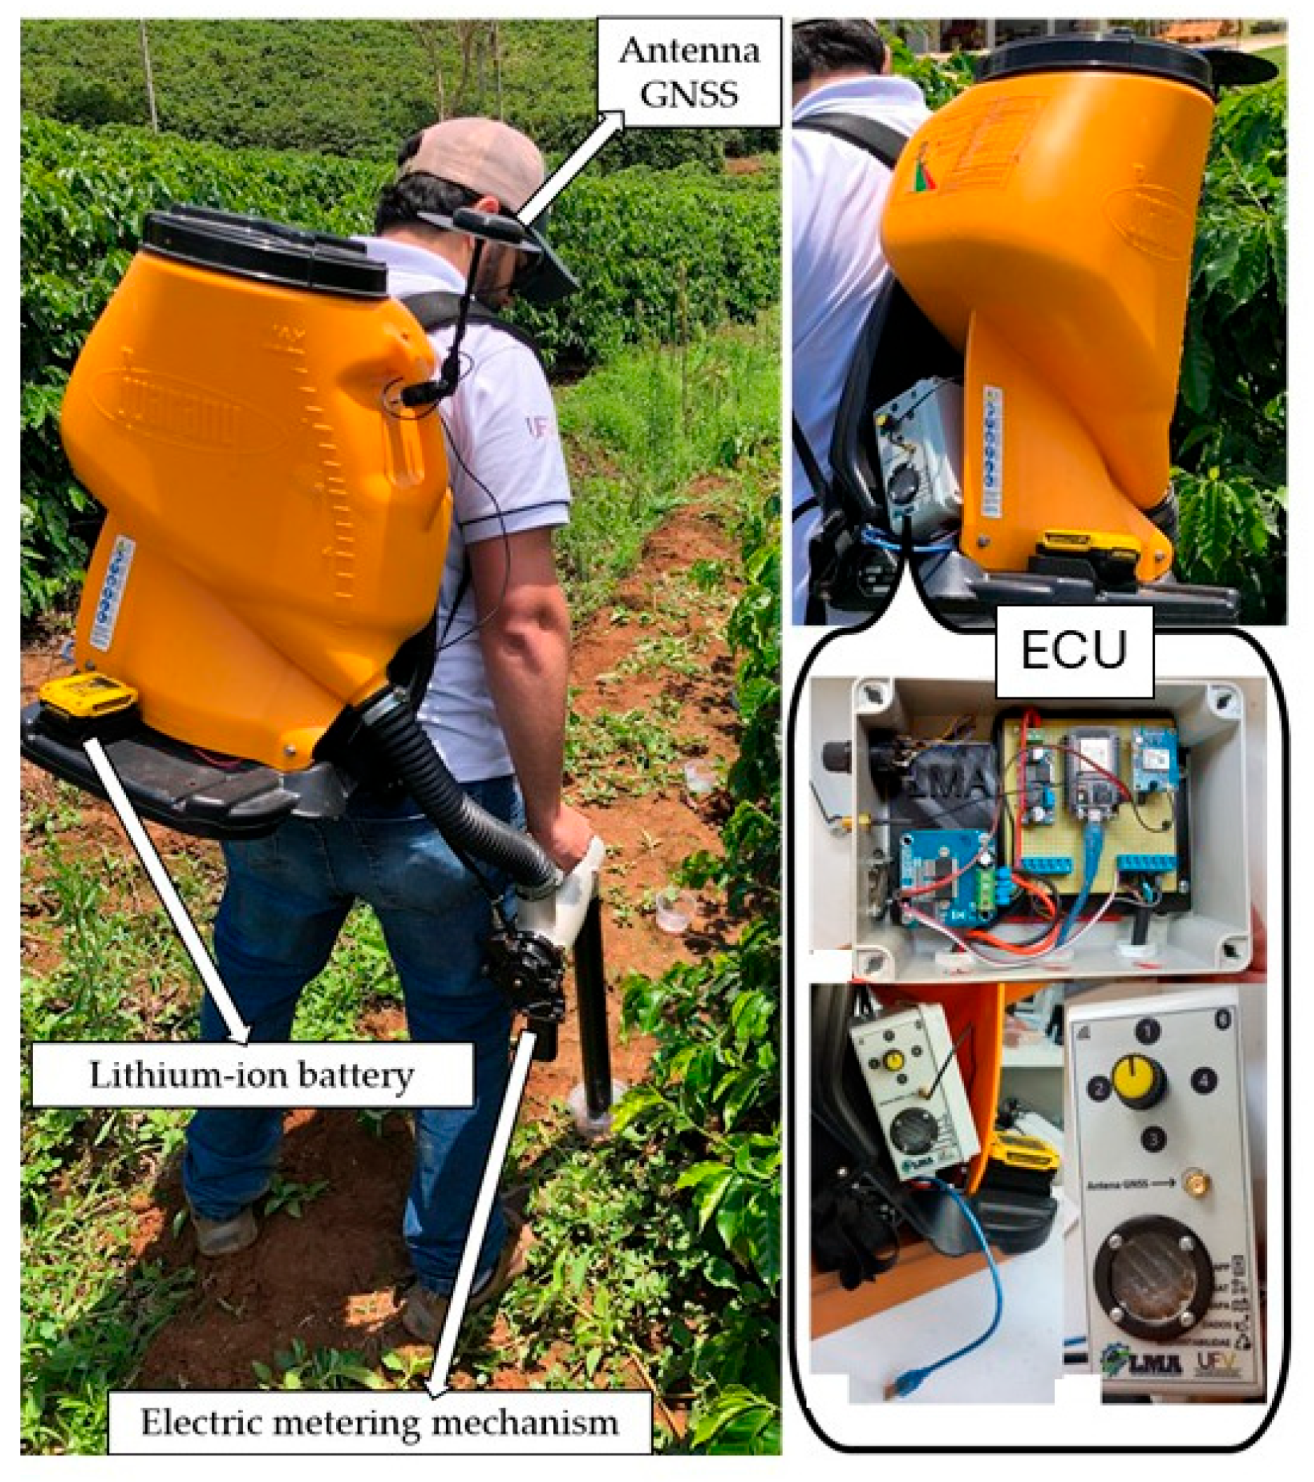
2.1. Development of the Metering Mechanism and Its Electronic Control Unit

The metering mechanism was developed in two steps: (i) design and build the electric cylindrical-conical screw metering mechanism (Figure 1) and (ii) develop the electronic circuit and computer program of the ECU. The cylindrical–conical screw geometry was defined based on reference [11]. The ECU was responsible for interpreting the variable-rate application map, receiving the signals from the sensors, processing them, and issuing commands to control the electric motor that actuates the metering mechanism.
A 12 V direct current electric motor was used to actuate the metering mechanism. An encoder, composed of a perforated disc and an optical sensor, was used to monitor the variation in the angle of revolution of the metering mechanism. The perforated disc had 20 hollow spaces (holes), with an angular resolution of 9°. Each pulse of electrical signal sent by the encoder represented the output of the optical encoder from a filled space to an empty space and vice versa (change of logic state).
The ECU consisted of an embedded system composed of a single-board hardware component developed for this specific function and a software component (flowchart in Figure 2), responsible for controlling the operation of the electric metering mechanism. The hardware component was developed based on the ESP32 board (Espressif Systems; Singapore), a u-blox NEO 6M (GNSS) receiver module (u-blox AG, Thalwi, Switzerland), an H-bridge BTS 7960 module (Infineon Technologies AG, München, Germany) for driving the electric motor, a voltage regulator module and a selector switch. The system was powered by a 12 V quick-fit lithium-ion battery.
The ECU was equipped with a USB connection that allows the download of files containing the information recorded during operation, as well as the upload of updated versions and/or algorithm tests. In addition to this direct communication interface, the ECU has a remote connection via Bluetooth, offering an alternative for remote interaction. Additionally, the ECU has a command interface through a mobile application developed for the Android operating system, expanding the system’s control and monitoring options. To feed the metering mechanism and allocate the ECU, a chassis and a reservoir of a commercial portable machine were used, resulting in a portable machine for variable-rate application of solid fertilizers (Figure 3).

2.2. Laboratory Tests
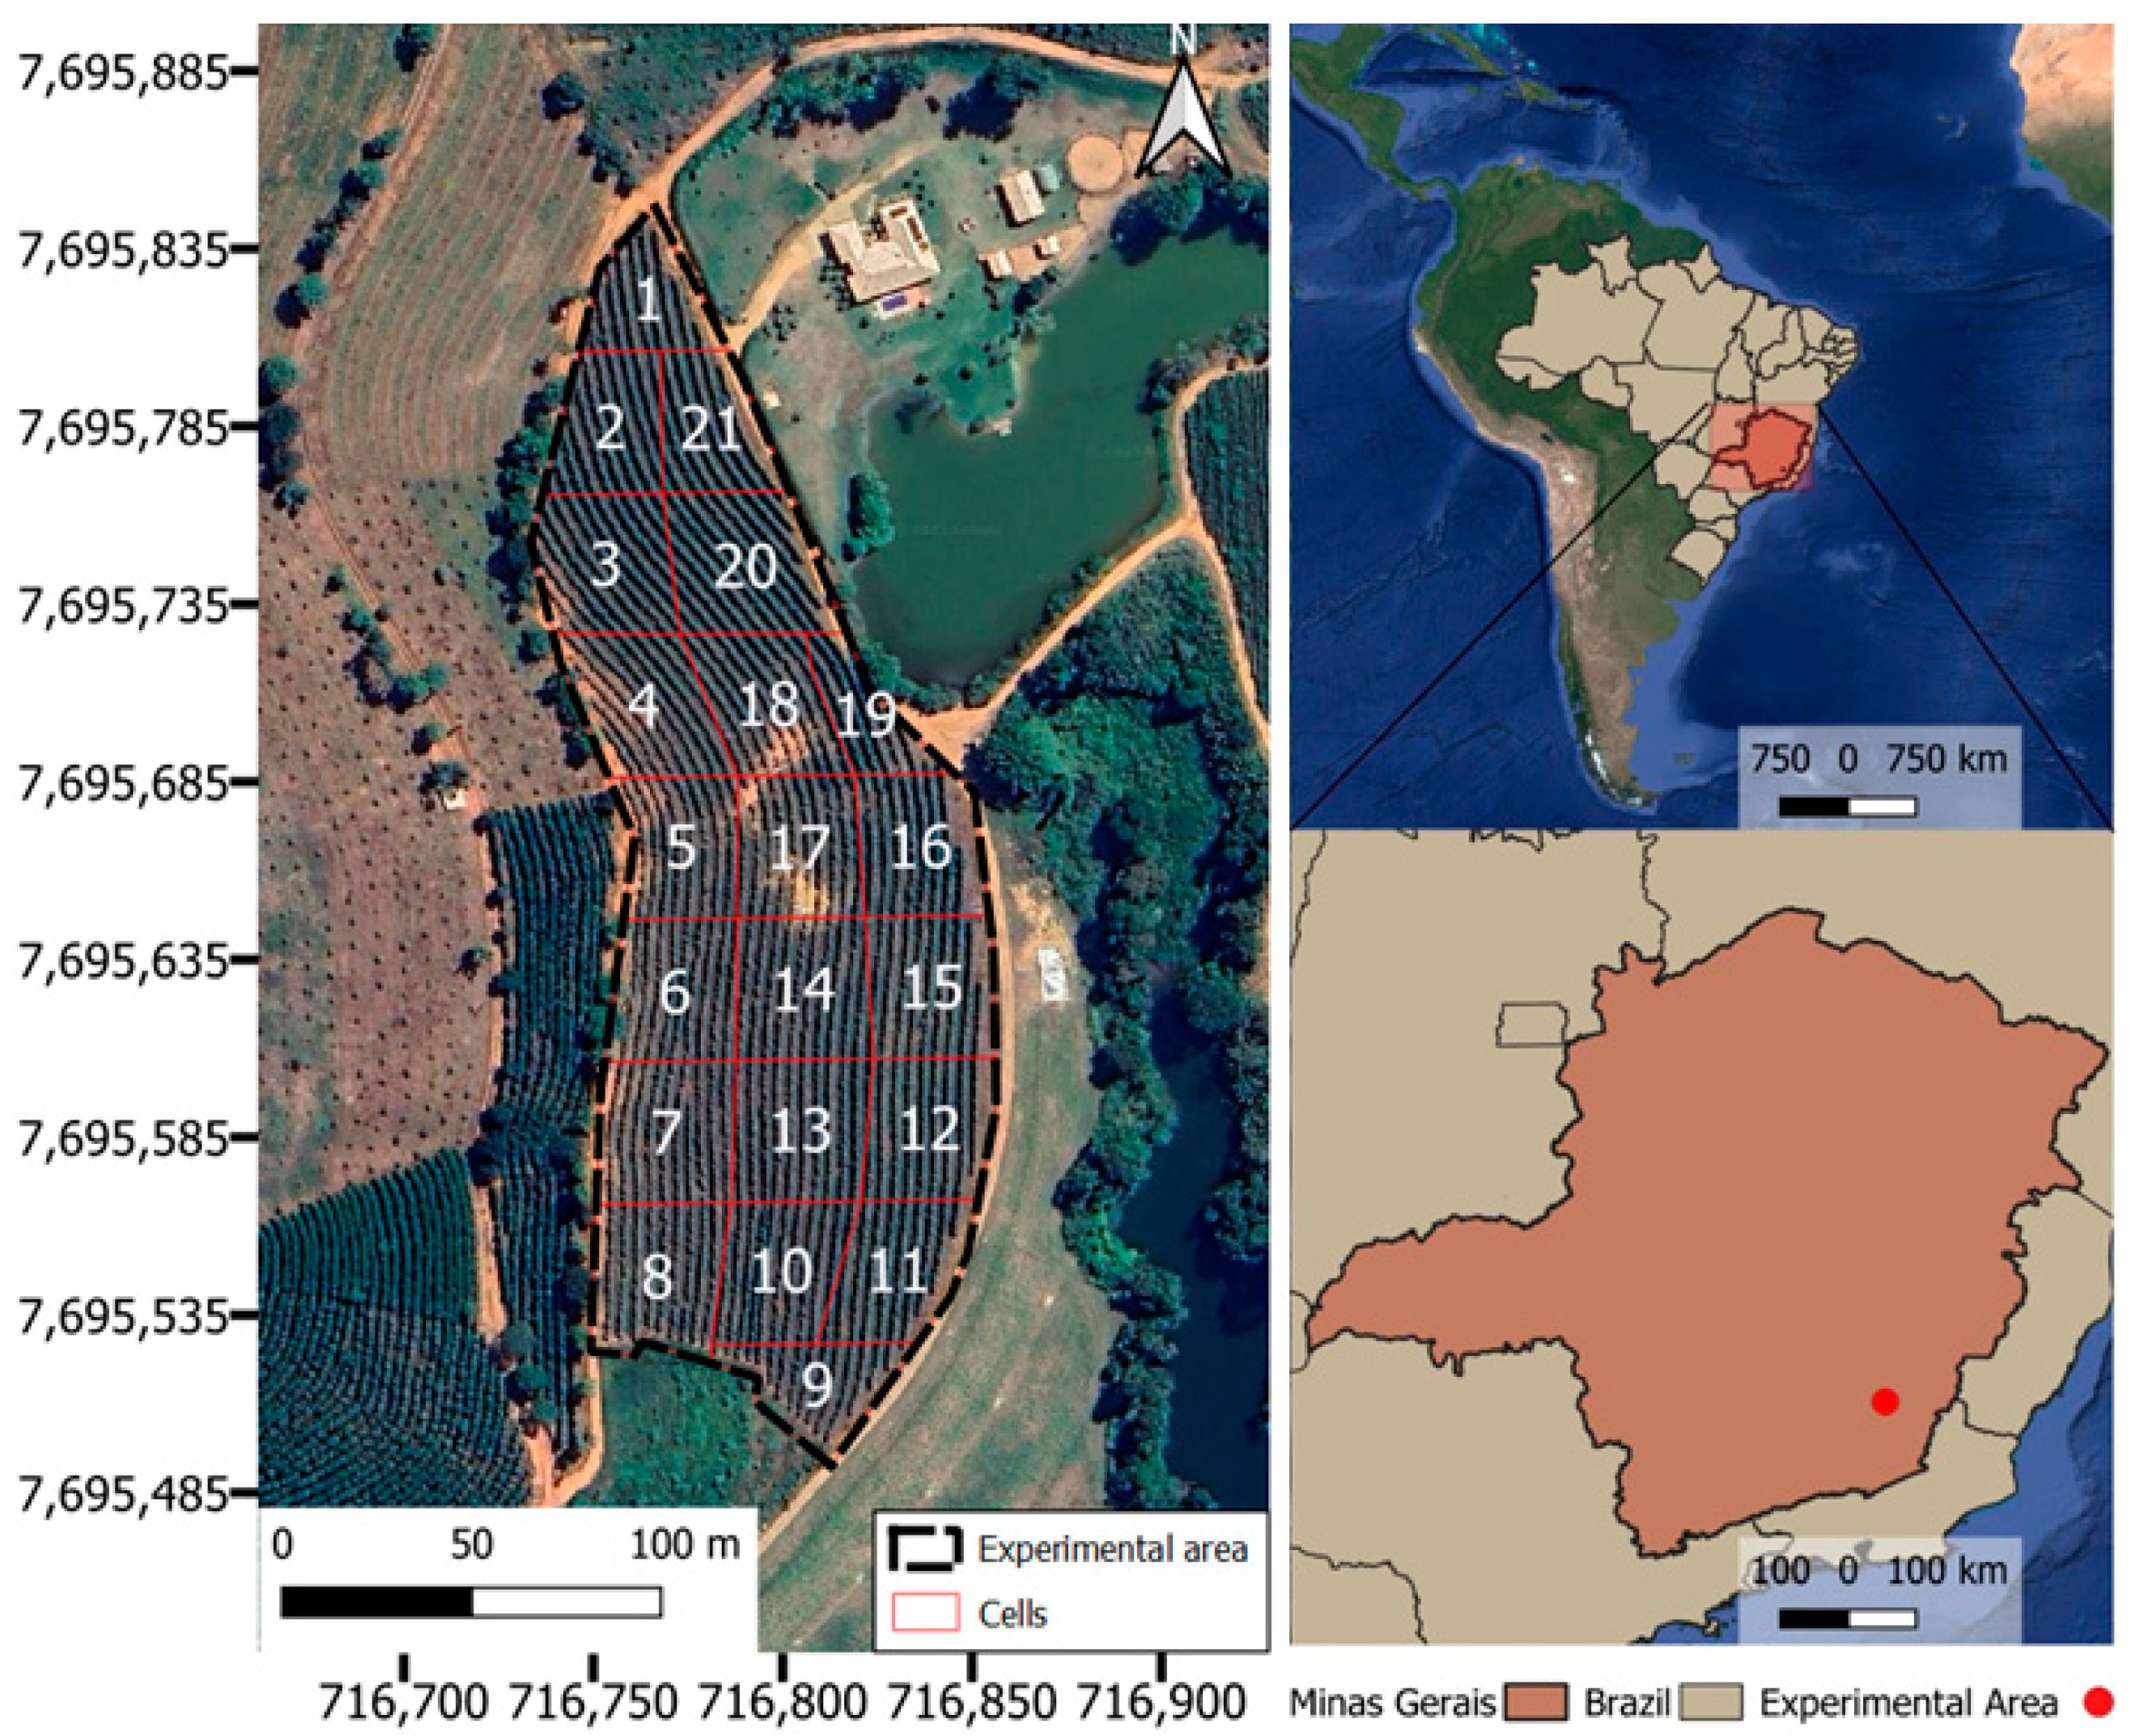
In the laboratory, with the metering mechanism in a static position, fertilizer application tests were carried out by varying the angle of revolution of the screw conveyor, the inclination of the metering mechanism, and the type of fertilizer. The angles of revolution tested were 45°, 90°, 180°, 360°, 540°, 720°, 900°, and 1080°, obtained from changes in the ECU software. To vary the inclination of the metering mechanism, it was fixed on a support structure with the possibility of adjusting the longitudinal and lateral angles. Seven positions were tested: one horizontal position; three longitudinal positions (−15°, 15°, and 30°), relative to the horizontal plane; and three lateral positions (15°, 30°, and 45°), relative to the vertical plane. The inclination angle of the metering mechanism was determined using a magnetic inclinometer. The laboratory tests were conducted between 10 August and 20 September 2022.
Among the three longitudinal positions, those in which the metering mechanism is naturally tilted forward were considered as inclinations (F) 15° and (F) 30° because they are favorable to the natural fall of the fertilizer. Conversely, the longitudinal inclination in which the metering mechanism is inclined backward was considered as (B) −15°, an unfavorable condition for the natural fall of the fertilizer. For the three lateral positions, (L) 15°, (L) 30°, and (L) 45° were considered.
The mineral fertilizers used were: single superphosphate (SS); NPK composition (04-14-08); potassium chloride (KCl); and urea. The physical characteristics of these inputs were determined immediately before the laboratory tests. For this characterization, the specific mass was determined with three replicates, using a volumetric cylinder to obtain the volume and precision scales to obtain the mass. Water content in the fertilizers was determined using homogeneous samples of each type of fertilizer, with three replicates. The samples were dried in an oven at a controlled temperature of 105 °C for 24 h [16]. The particle size of the fertilizers was determined according to the guidelines established by [17]. Additionally, the angle of repose of the fertilizers was evaluated to understand their natural flow characteristics.
The actuation of the trigger of the metering mechanism, responsible for initiating the application of the fertilizer, was repeated ten times for each combination of angle of revolution, inclination, and type of fertilizer, totaling 2240 application trials. In order to standardize the data collected on the same basis, regardless of the angle of revolution, the mass rate of fertilizer was calculated according to Equation (1).
T ˙ = m θ ,
where T ˙ is the mass rate of fertilizer, g degrees−1; m is mass of fertilizer, g; and θ is the angle of revolution, degrees.

2.3. Field Tests

The portable machine with the electric metering mechanism and the ECU was tested in a coffee plot in production with the cultivar of the Catuaí Vermelho variety. To evaluate the variable-rate application system of the machine, the experimental area was subdivided into 21 cells (Figure 4). In each of these cells, composite soil samples were collected, on 25 October 2022, consisting of 4 to 6 single samples from the 0–20 cm depth profile. The chemical and physical attributes of the soil samples were analyzed and determined. Based on the results of the soil analysis and the expected yield of 60 bags/ha (3600 kg/ha), the quantity of fertilizer needed for each type of fertilizer used was calculated following the guidelines of [18]. From these data, fertilizer application prescription maps were prepared for each cell of the coffee plantation field, characterized as mountain coffee in production.
The fertilizer application prescription map was prepared in Geographic Information System (GIS) software QGIS version 3.28 [19], with the doses of each cell defined in the attribute table. For the ECU to be able to recognize a map, the file in shapefile format (.shp) needed to be converted into text file format (.txt) with coordinates in UTM and datum in WGS84 (World Geodetic System 84). To perform this conversion automatically and, later, download the files containing the information recorded during the operation, a computer software program was developed in Python (version 3.9.10) language for these functions.
When the portable machine moved with the embedded system along the experimental area, its geolocation was obtained by the ECU through the GNSS module. The ECU software then interpreted which cell the machine was in and calculated the angle of revolution of the metering mechanism (setpoint of number of pulses) according to the dose established in the fertilizer application prescription map.
However, to calculate the angle of revolution it was necessary to perform a calibration. The calibration consisted of developing a polynomial equation to estimate the mass of fertilizer applied based on the angular revolution during the rotation of the metering mechanism. The angle of revolution of the mechanism varied using the calibration feature of the machine operation application, and the mass of the fertilizer sample was obtained using a precision scale. After entering the mass values in the application, this curve was generated using linear regression, which derived a first-degree polynomial equation (Equation (2)), correlating the number of encoder pulses (representing the angle of revolution) with the applied dose (mass).
p = 1.5002 m 3.8948   ( R 2 = 0.9921 )
where p is the number of encoder pulses and m is mass of fertilizer, g.
To evaluate the performance of the metering mechanism and ECU, in terms of precision and accuracy of application, ten collectors were positioned in consecutive coffee plants in each of the 21 management cells, totaling 210 collectors. On 8 and 9 November 2022, the machine was used to distribute fertilizer into the collectors. The calibration of the machine was kept constant throughout the operation. The mass contained in the collectors was measured using a precision scale. Distribution precision and accuracy were evaluated based on the deviation and coefficient of variation in the applied mass relative to the prescribed mass. The trial was conducted using the same fertilizer lots that were characterized during the laboratory tests. Additionally, the performance of the developed system was analyzed through three maps: (i) fertilizer application prescription map, with the maps that were sent via application to the ECU; (ii) operation map, generated from the data stored in the ECU; and (iii) application map, with the dose that was applied to the collectors.
The data stored by the ECU include the date and time of each actuation, the prescribed dose, and the geographic coordinates of each applied point. The travel time for each application plus the application time is obtained based on the time difference between actuations. The average operation time in each cell was obtained from the operation data by calculating the effective operational capacity (Equation (3)).
C e i = A i t ¯ i ,
where C e i is the effective operational capacity in each cell (ha·h−1), A i is the area of each cell (ha), t ¯ i is the average time of application in each cell (h), and i is the cell number, which ranges from 1 to 21.

3. Results and Discussion

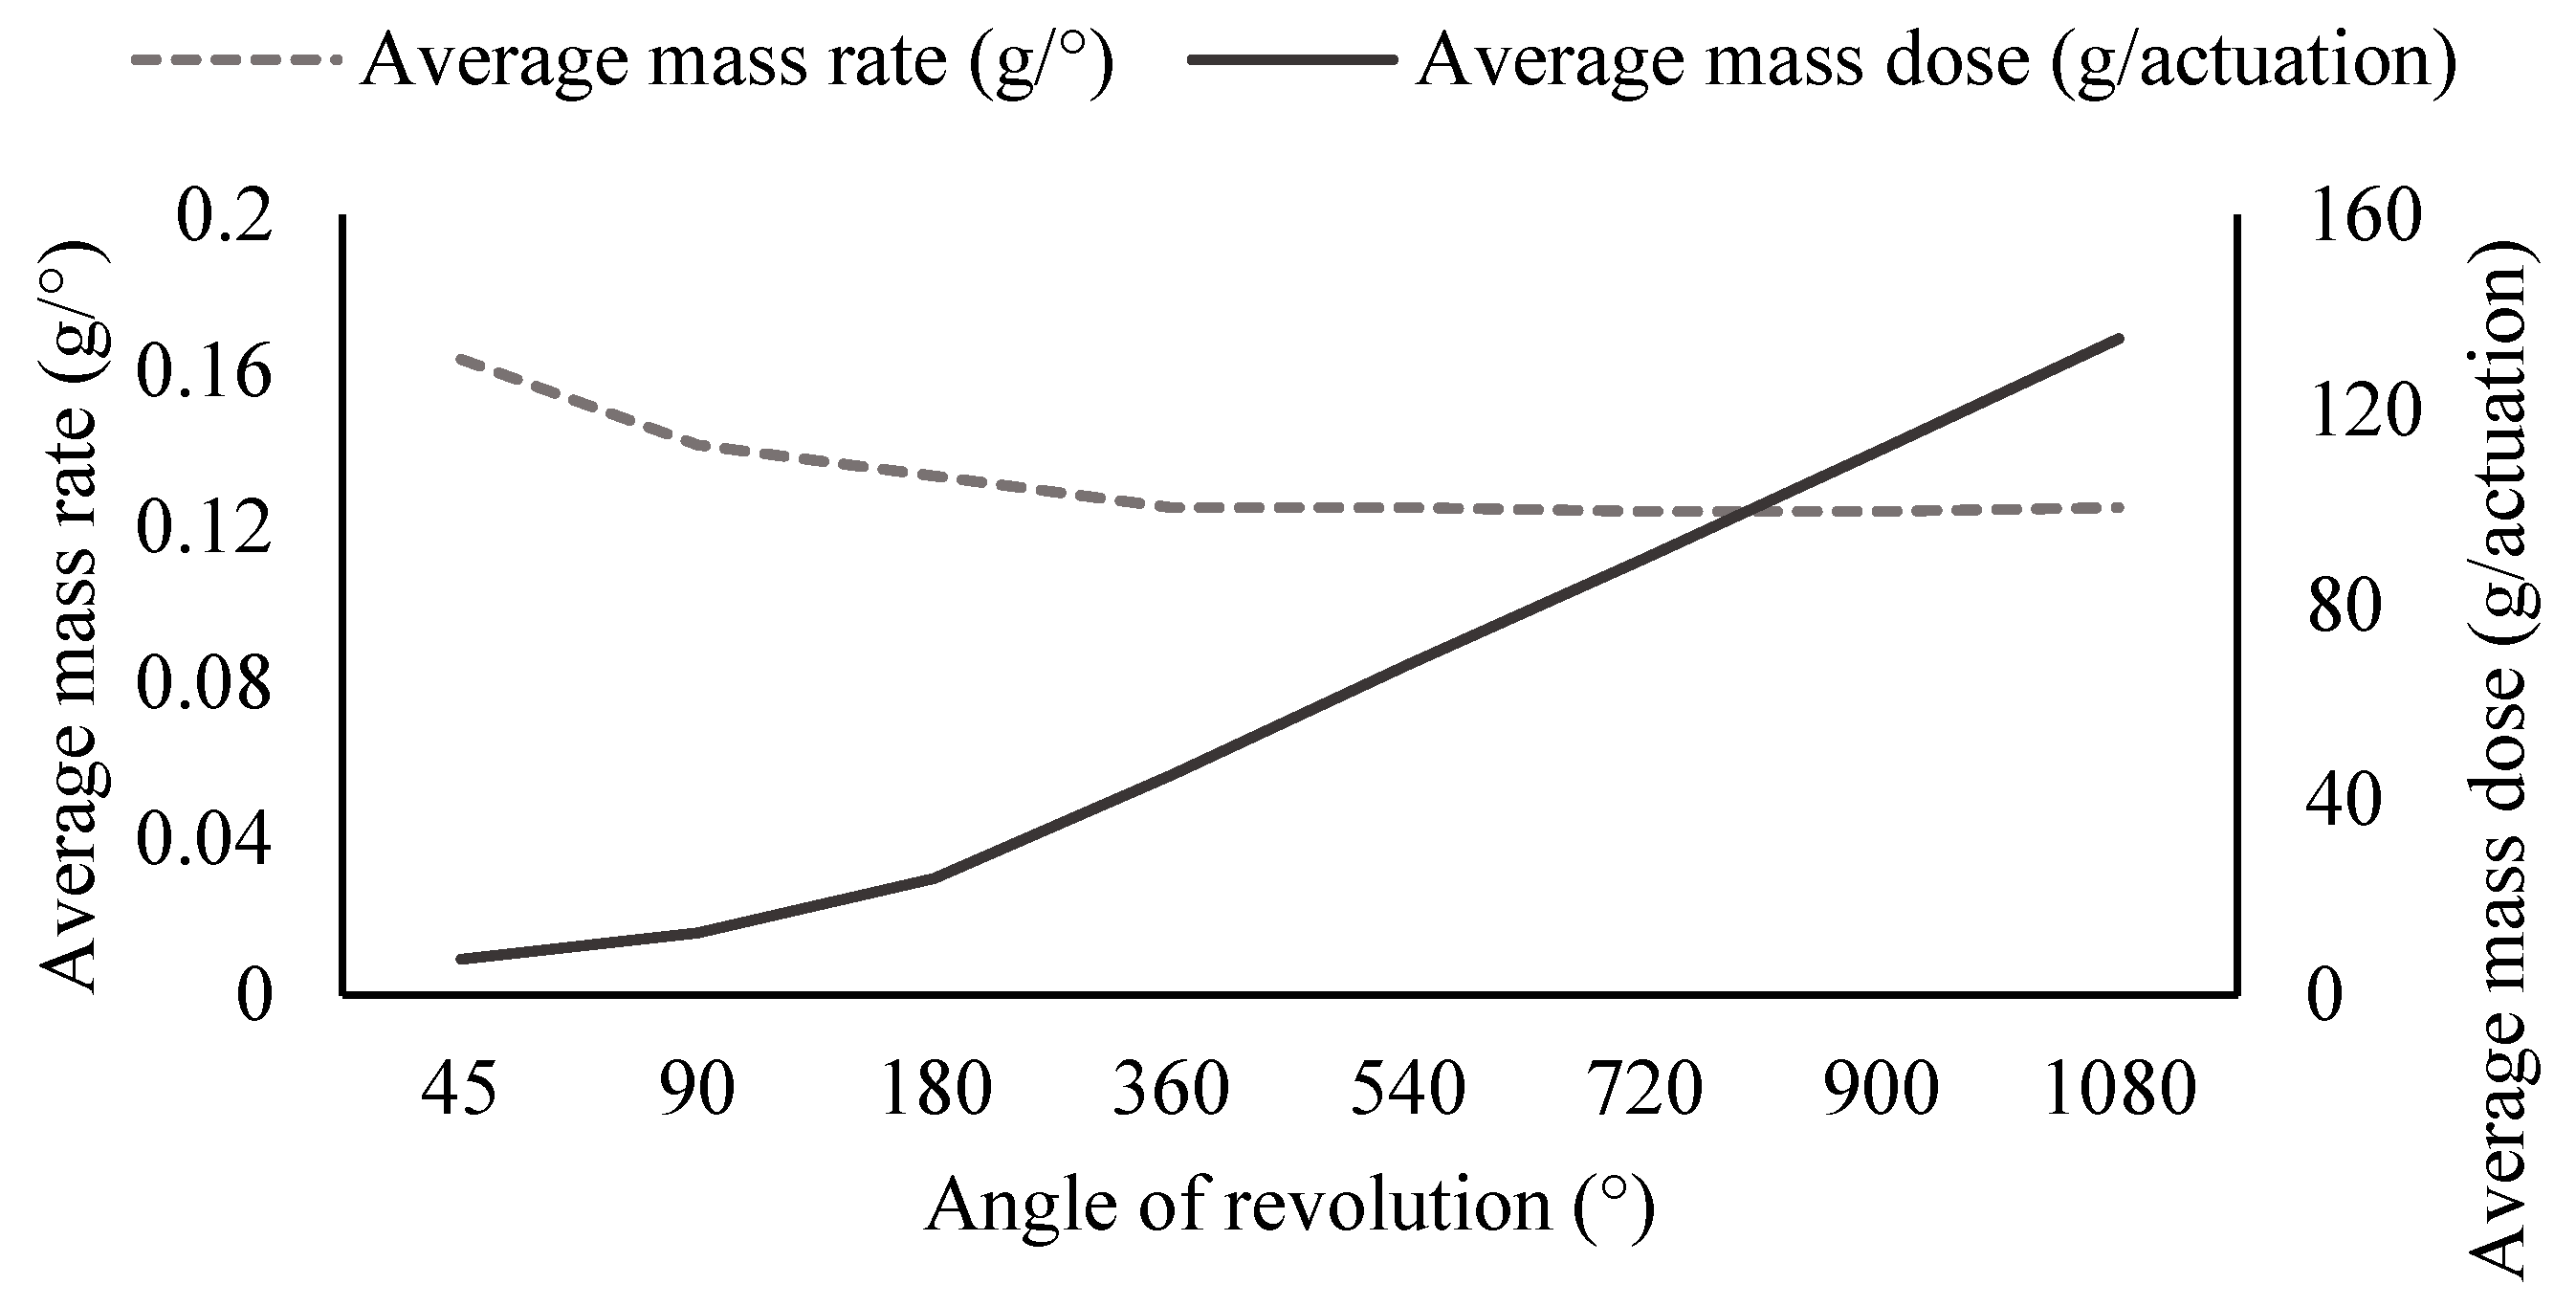
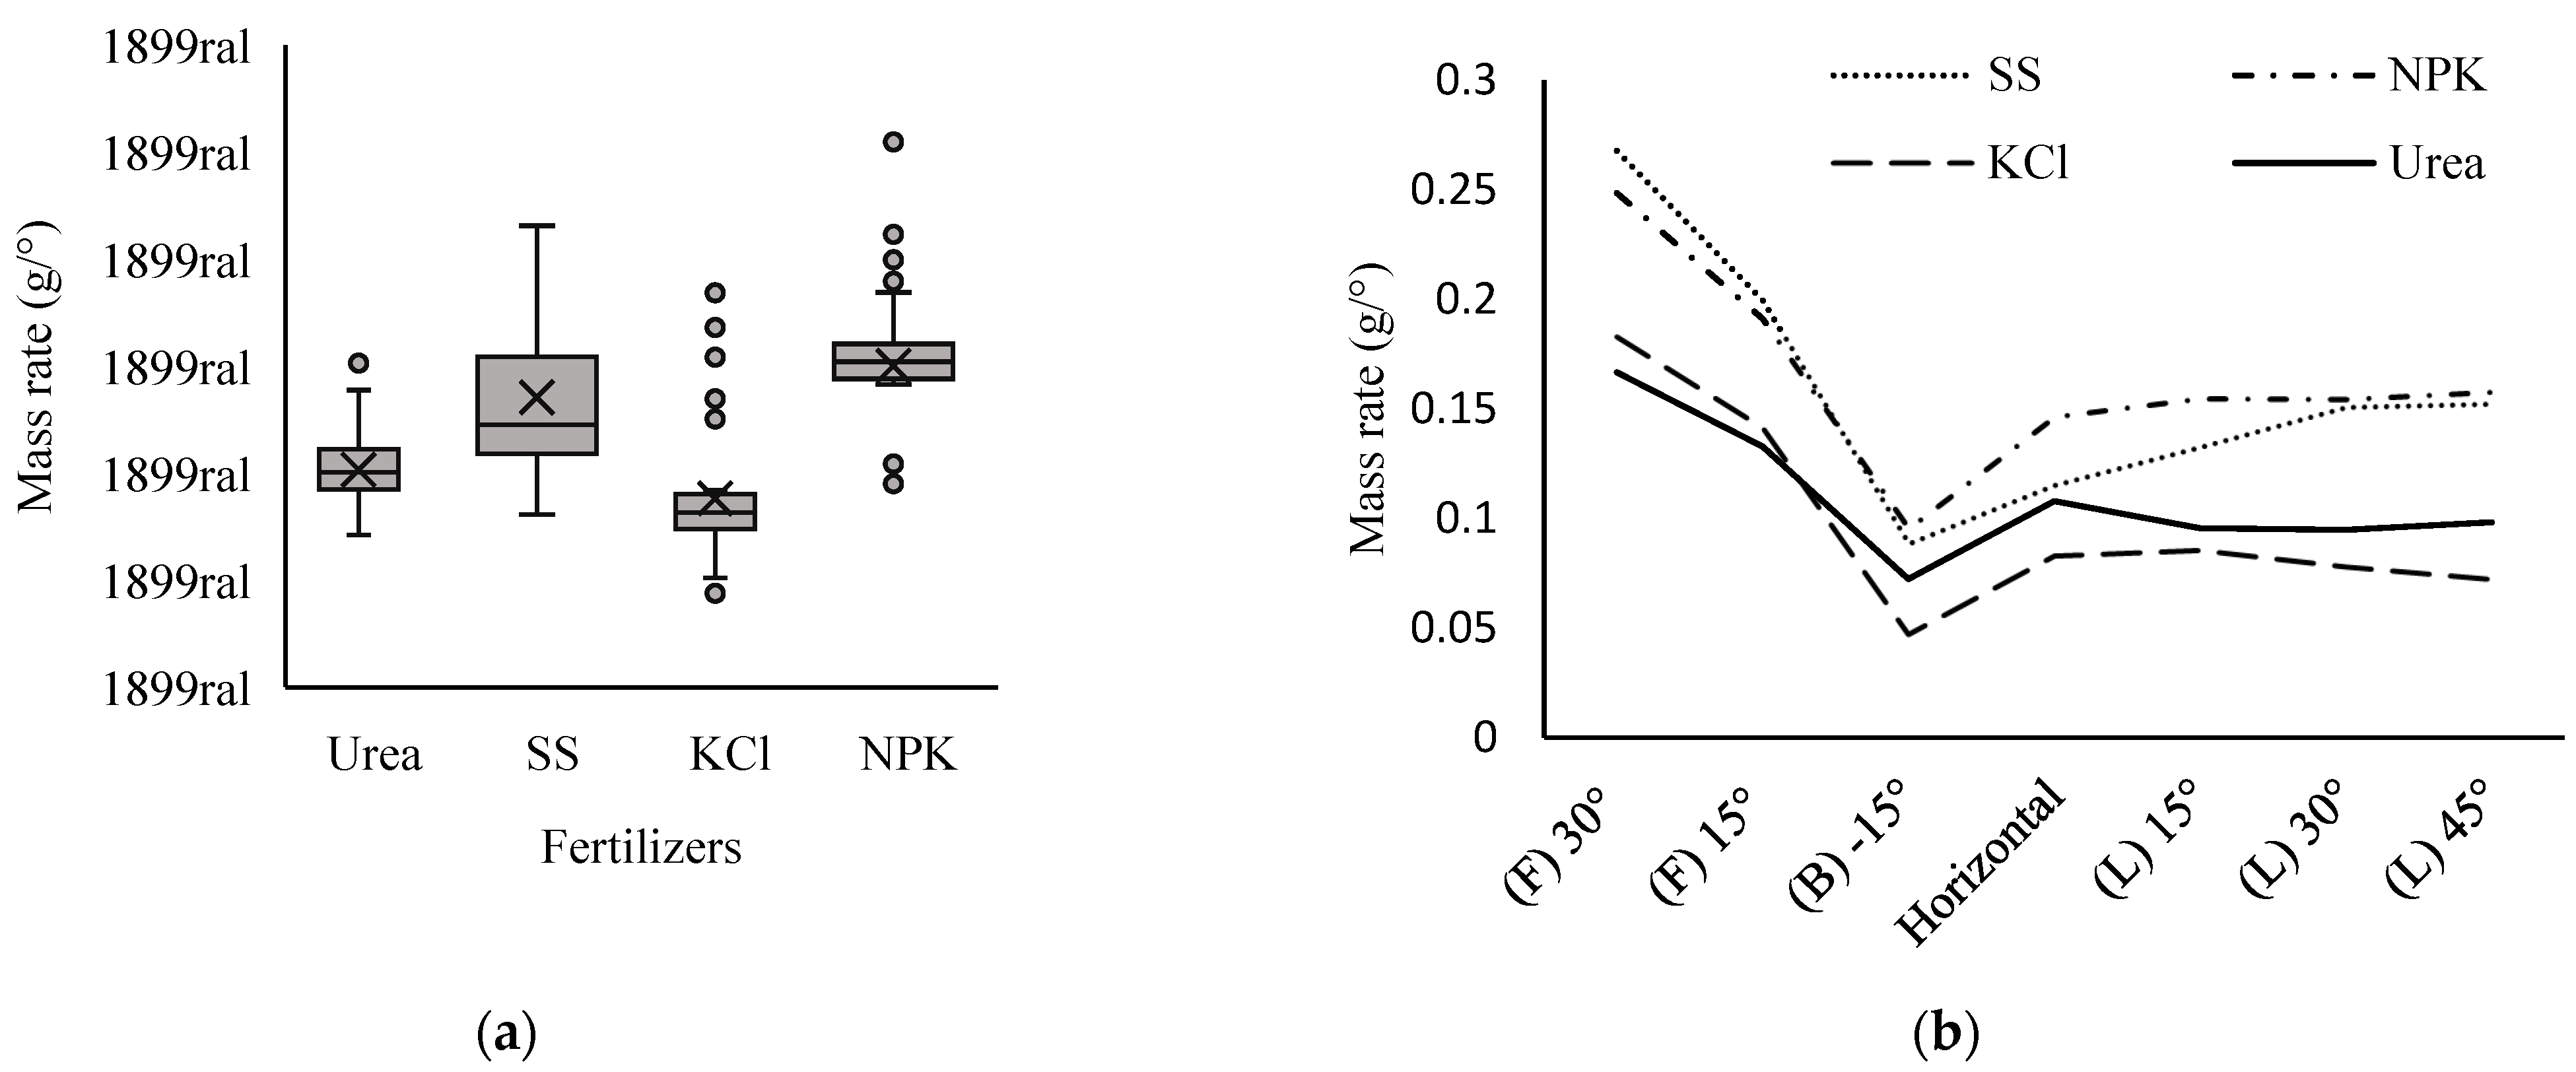
3.1. Evaluation of the Metering Mechanism in the Laboratory

The results of the physical characterization of the fertilizers used are presented in Table 1. Among the four fertilizers tested, two were classified as granulated and two as powdered. It is worth pointing out that the physical properties of these inputs were considered, since, depending on the physical characteristics, the fertilizer used can increase or decrease the amount of mass distributed by the screw metering mechanisms, especially in the case of hygroscopic fertilizers.
The results obtained for the average mass rate of fertilizer and the average mass dose, regardless of the inclination of the metering mechanism and the fertilizer used, for all the data collected, are presented in Figure 5.
The applied dose was directly proportional to the angle of revolution, showing stability in the proportion ratio from the 180° revolution of the metering mechanism shaft. The coefficient of variation (CV) of the application rates, considering the entire data set, was 10.35%. However, when considering only the angles of revolution greater than 180°, the CV decreases to 0.41%. This disparity suggests that the metering mechanism has a significantly higher precision in metering fertilizers for values above 24 g per actuation. Figure 6a shows the variation in the mass rate values for each fertilizer used, between the seven inclination positions of the metering mechanism and the eight rotation angles.
The mean standard deviation for the metering mechanism in the horizontal position (standard working position) was 1.19 g, 1.74 g, 1.02 g, and 1.58 g for urea, SS, KCl, and NPK, respectively. However, for the minimum dose evaluated, corresponding to the angle of revolution of 45°, the standard deviation was higher compared to the other doses. The CV value was higher for fertilizers classified as powdered. This can be attributed to their physical characteristics, suggesting that the metering mechanism developed can be influenced by the particle size of fertilizers. Thus, it was observed that the metering mechanism had greater precision in the applied dose for fertilizers with more uniform granules.
Inclination can influence the applied dose per actuation, with greater impact at longitudinal inclinations (F) 15° and 30°. However, when comparing the inclinations based on the horizontal position, the three longitudinal inclinations (F) −15°, 15°, and 30° showed discrepancies in their values. The fertilizers classified as powdered, SS, and NPK, had higher values and variations in mass rate as a function of the inclination of the metering mechanism.
The discrepancy between the variations observed in the longitudinal positions can be attributed to the fact that the inclinations (F) of 15° and 30° favor the natural fall of the fertilizer since the metering mechanism is tilted forward. On the other hand, at the longitudinal inclination (B) of −15°, the metering mechanism is tilted backwards, implying that the fertilizer was led to the outlet tube only due to its propulsion with the rotation movement of the helicoid.
The cylindrical-conical shape of the screw, as highlighted [11], induces a gradual reduction in the volume of fertilizer transported due to the decrease in its cross-sectional area. This results in a decrease in the space available for fertilizer output, increasing the density of the granules and reducing pulsation in distribution, which contributes to a more uniform application.
The shape of the helicoid of the developed mechanism may have influenced metering precision since its flow variations are proportional to the rotation of the shaft. Adopting a cylindrical-conical double-fillet screw conveyor, which differs from the mechanism developed by [11] and everything that exists in the state of the art, resulted in a greater reduction in the volumetric space and an increase in the density of the mass of granules at the exit of the mechanism.

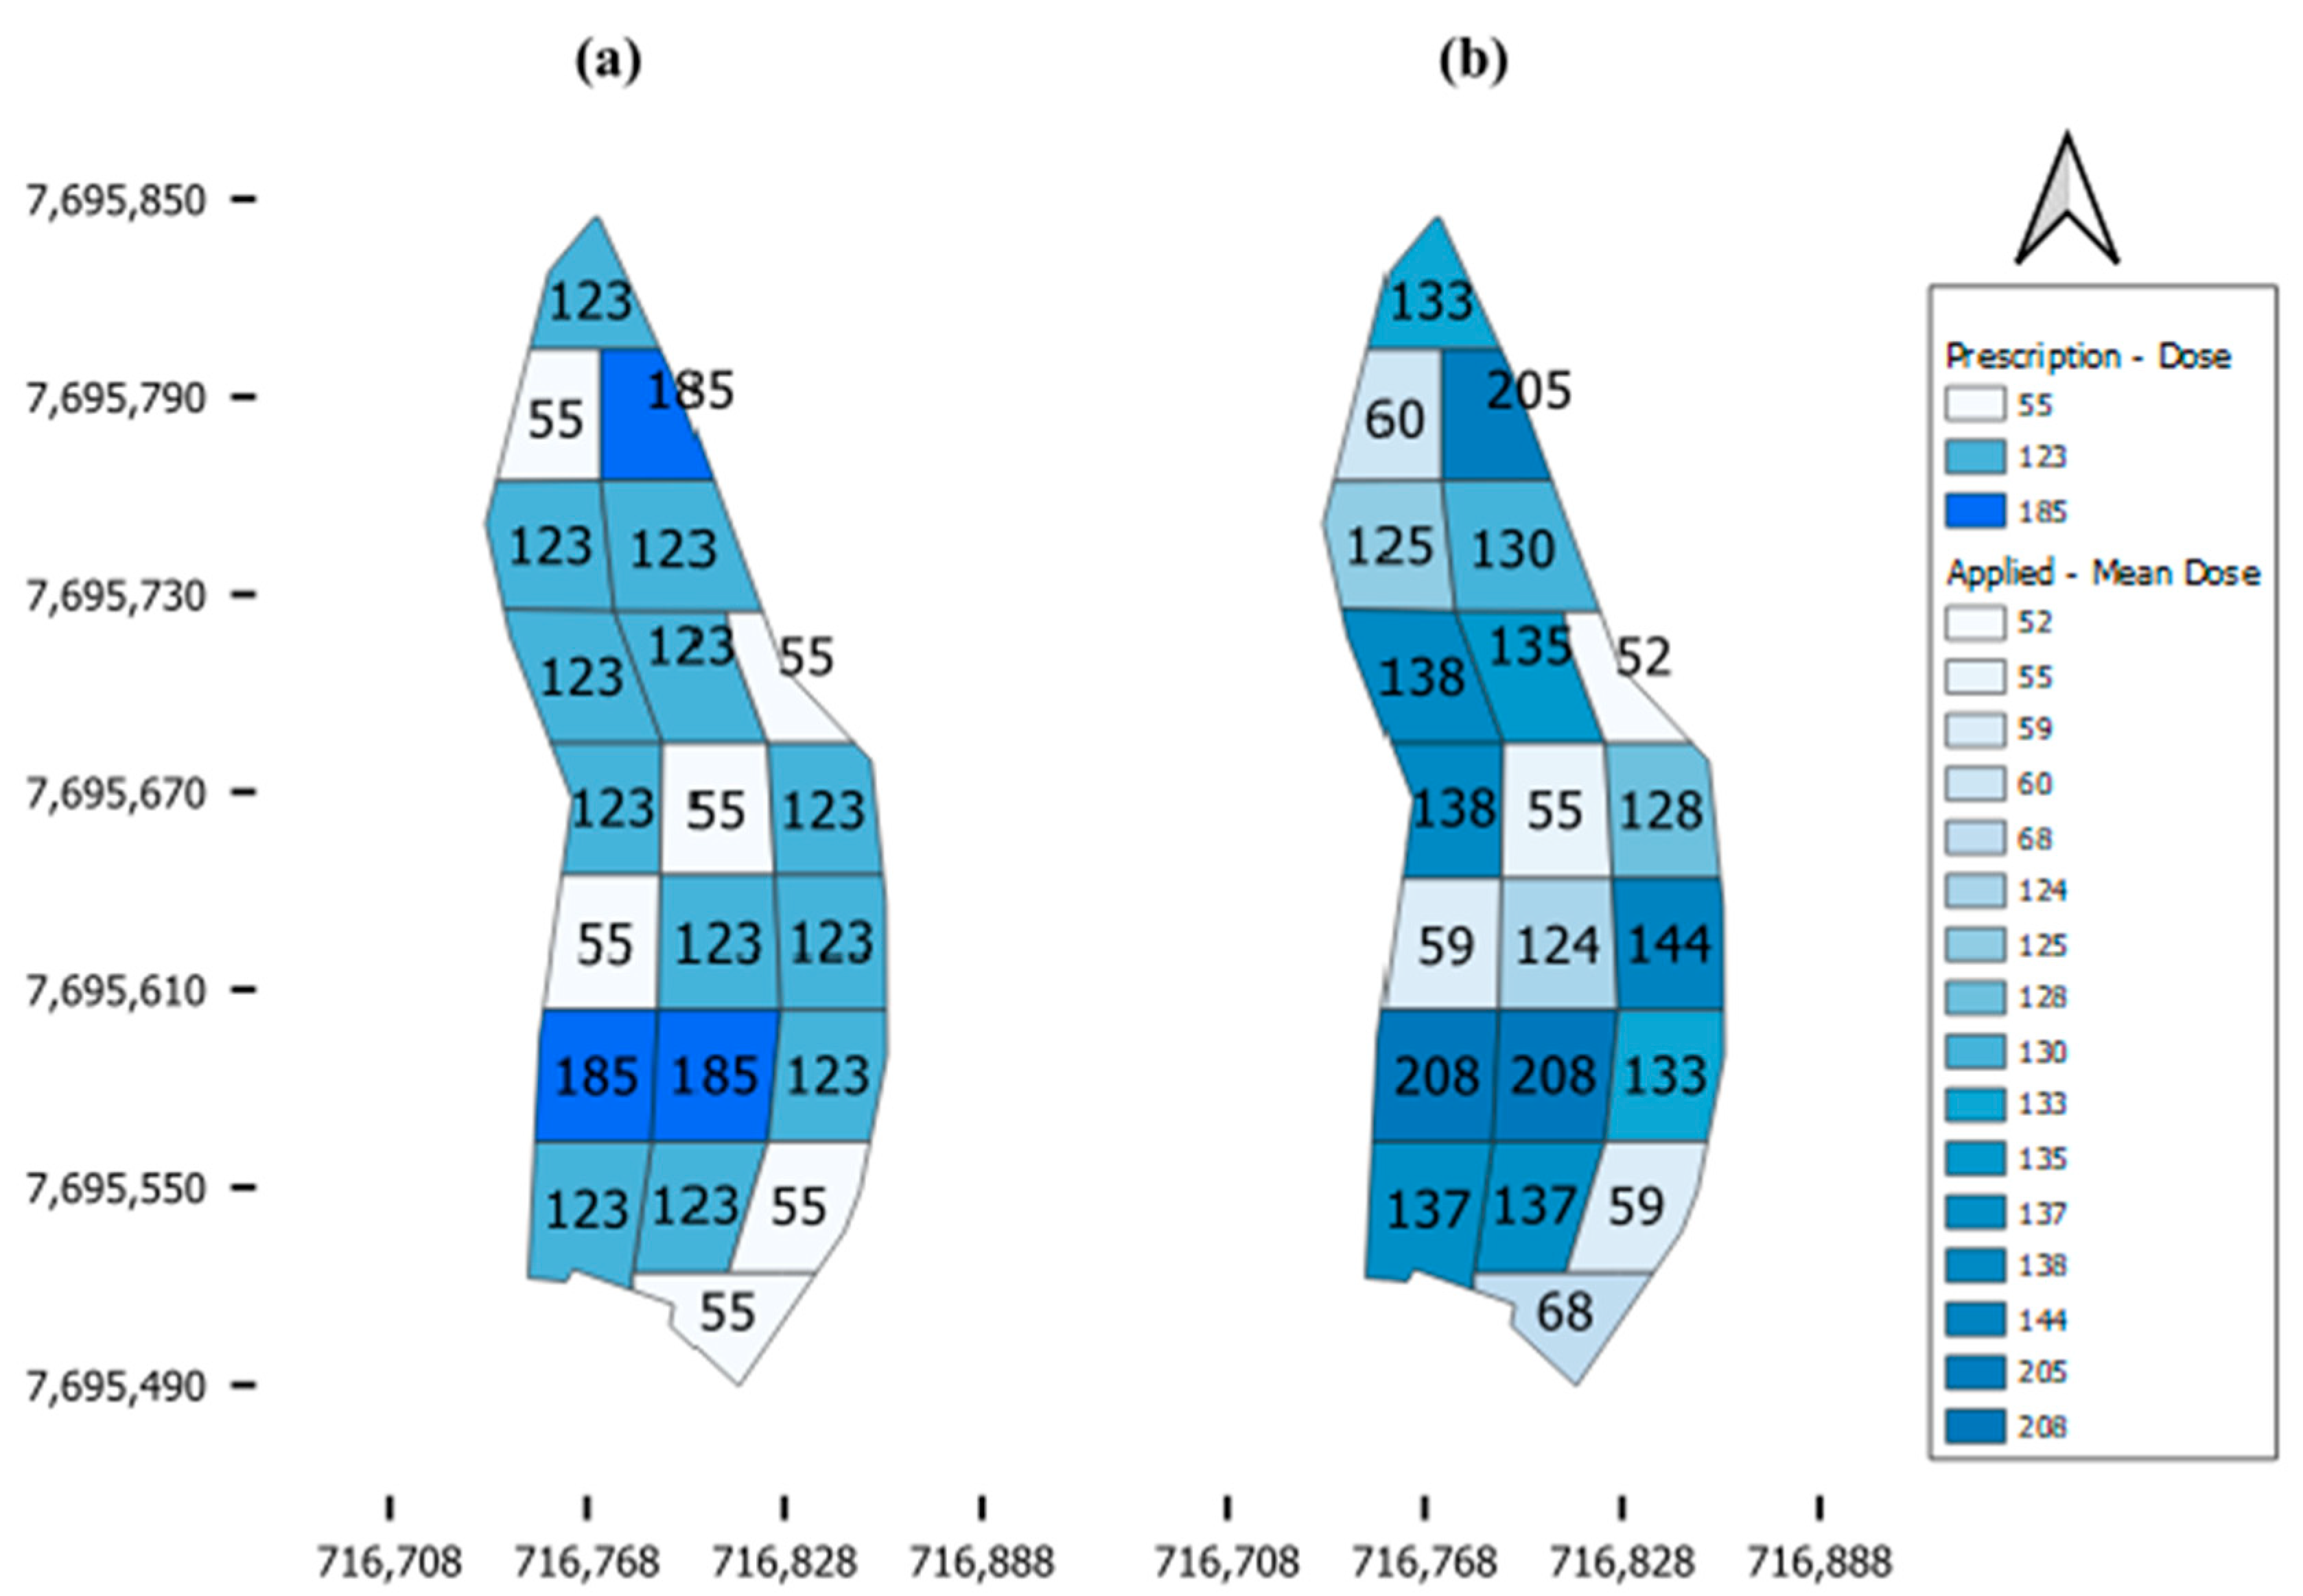
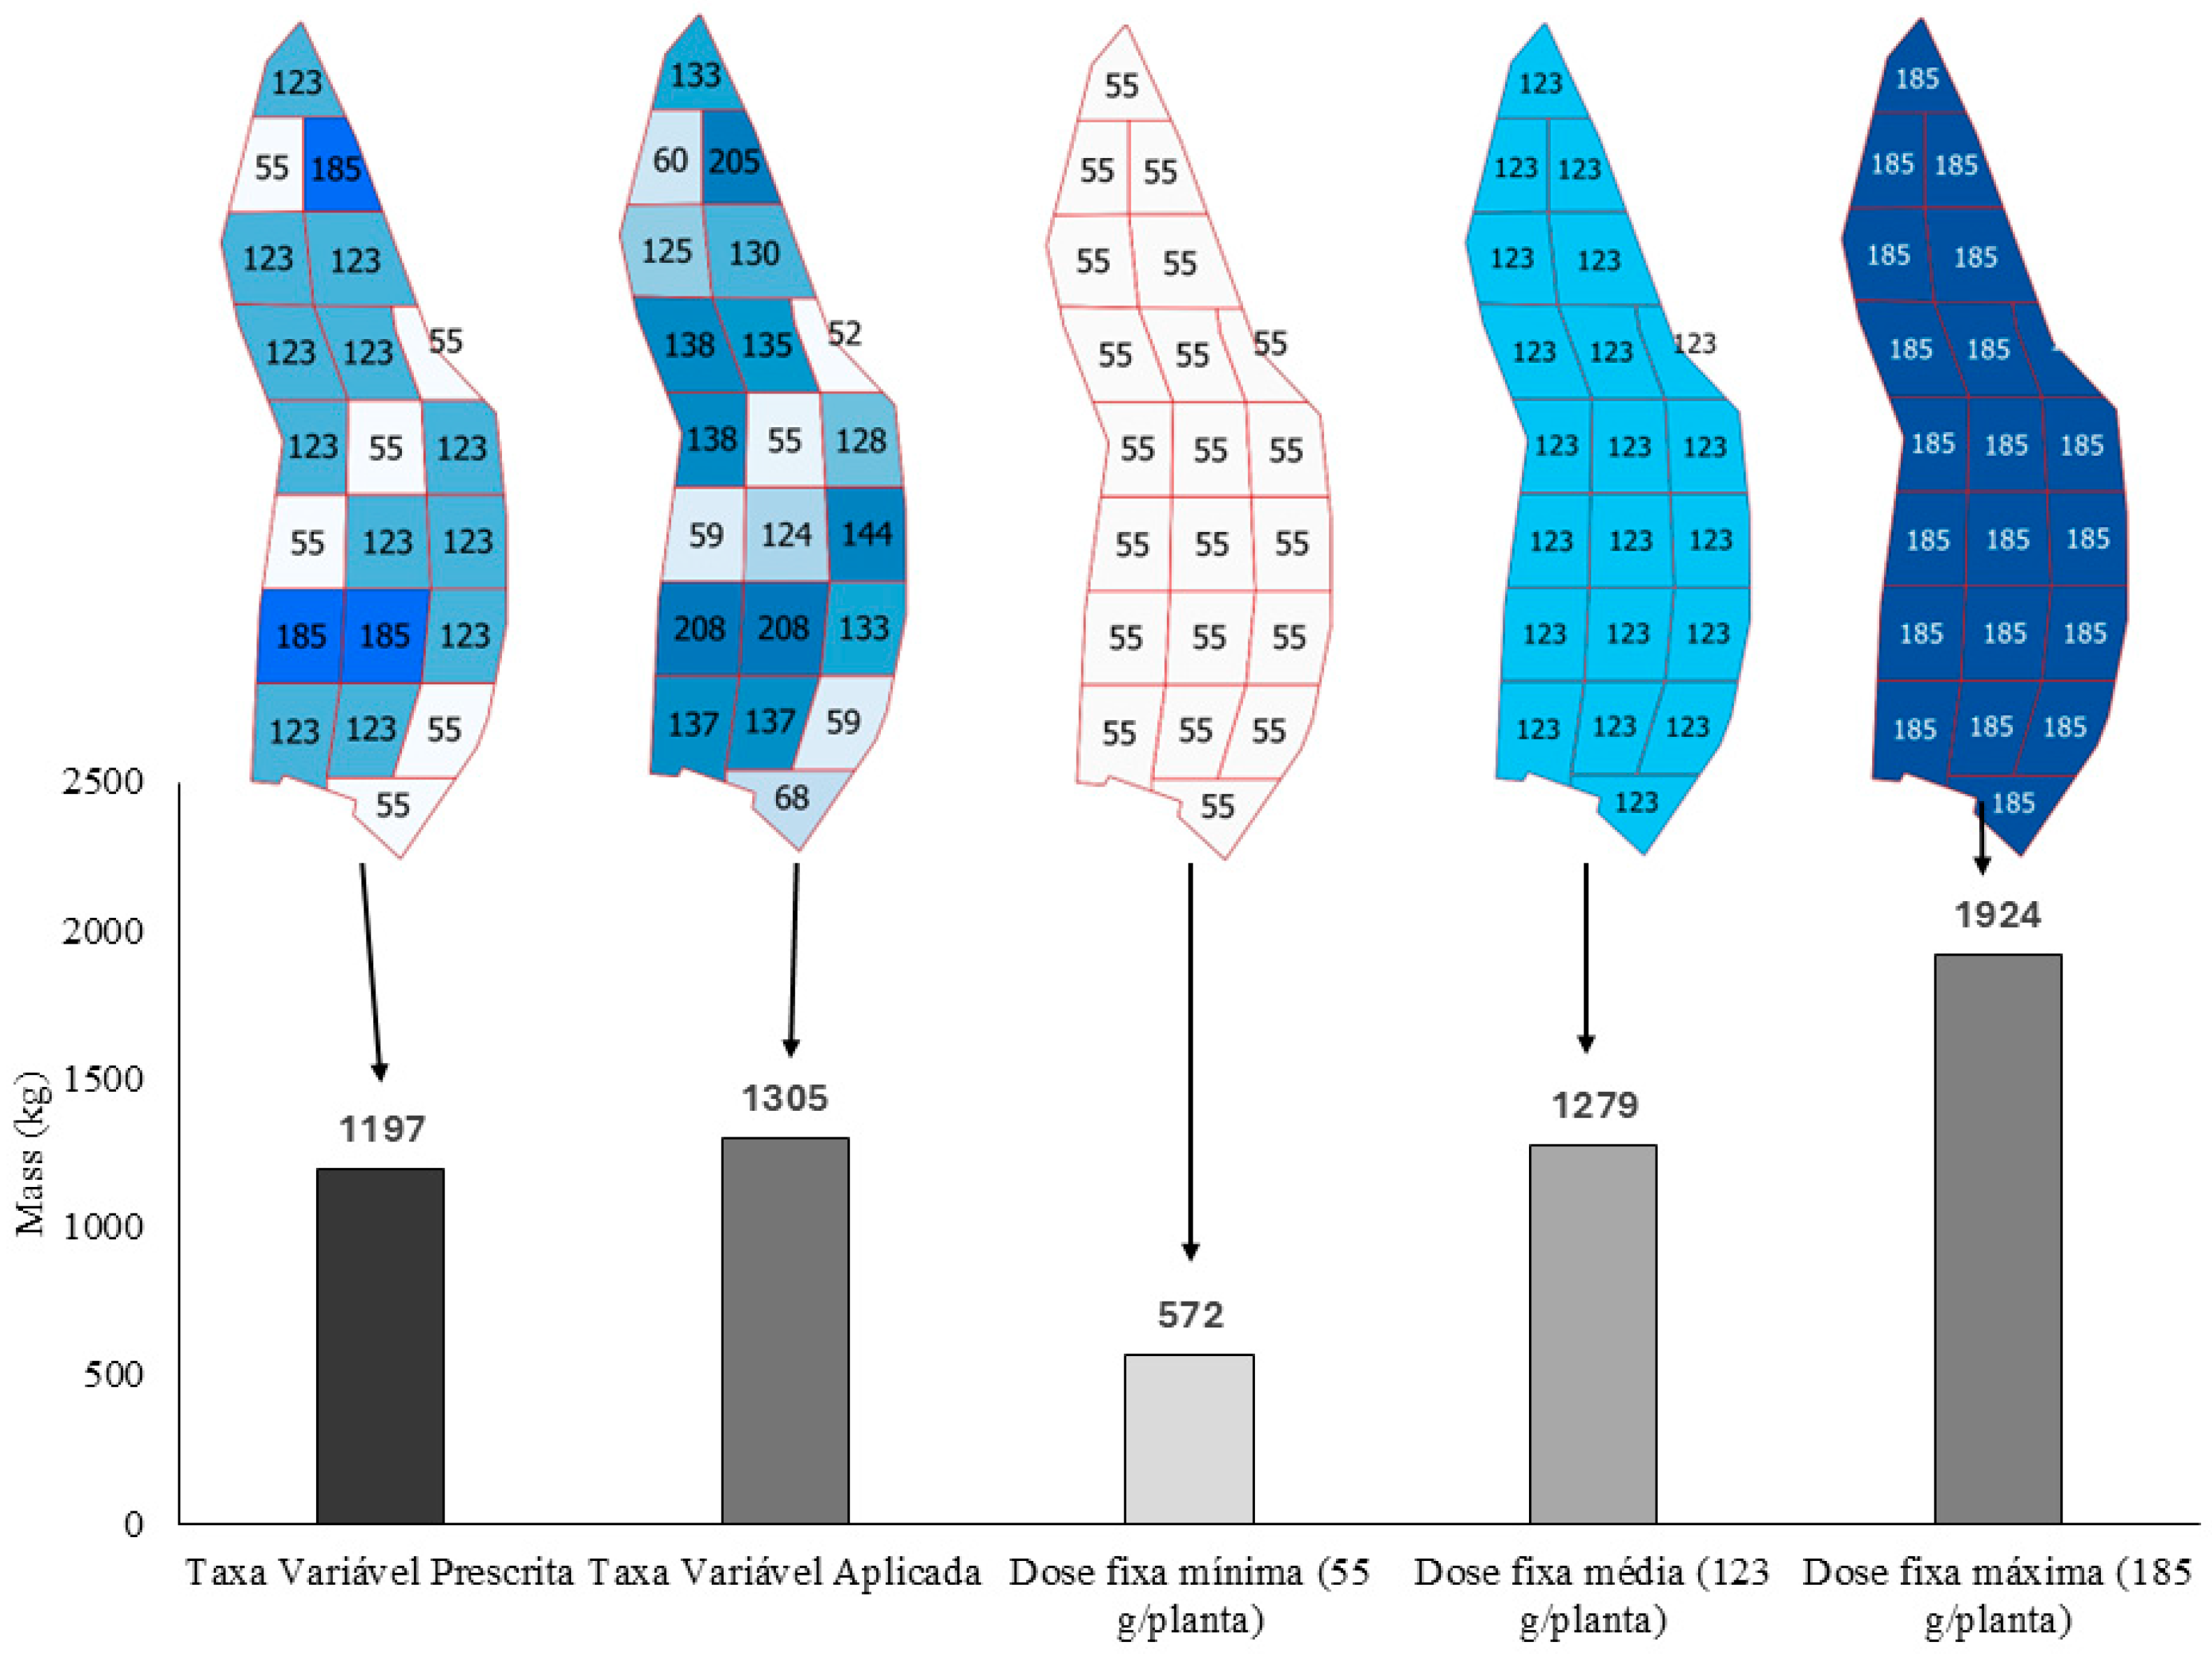
3.2. Evaluation of Machine Performance in the Field

The results of the chemical and physical analyses of the soil, together with the expected coffee yield of 3600 kg/ha (60 bags/ha), were used to generate maps containing the prescription of fertilizer application in each cell. This prescription considered the phosphate (P2O5), nitrogen (N), and potassium (K2O) nutrients, which are contained in specific proportions in the fertilizers used.
Figure 7 shows the KCl prescription map for the 21 cells. KCl prescription varied in three classes, with doses of 55, 123, and 185 g/plant (220, 492, and 740 kg/ha). SS prescription was required only for two cells, 7 and 5, with a prescribed dose of 28 g/plant for both (totaling 112 kg/ha). Finally, Urea prescription was uniform for all cells, with a dose of 262 g/plant (1048 kg/ha).
In this context, only a KCl prescription was used to generate the map and later sent to the machine, where the KCl fertilizer application operation in the area was simulated. It can be observed that the map in Figure 7 has 16 classes for the mean values applied in the field. The application and prescription data are summarized in Table 2.
Figure 8 shows the percentage deviation and absolute values of the prescribed dose and the average dose applied to each cell. It can be observed that in nine cells there was a deviation greater than 10% relative to the mean of the three prescribed doses (55, 123, and 185 g). In these nine cells, an absolute difference of more than 12.10 g was observed between prescription and application. However, when considering all 21 cells, the largest absolute difference observed was 22.72 g, while the smallest was 0.38 g. At percentage deviation, the maximum and minimum were 24.47 and 0.7%, respectively. By adopting continuous fertilizer application, ref. [11] achieved a maximum coefficient of variation of 4.3% between applications. Although a cylindrical-conical screw with a similar geometry was used, the dimensions differ, and in the machine developed in the present work, fertilizer application is localized.
The cells with the greatest differences in the absolute value of the dose were those with the highest prescribed dose (185 g), while the cells with the smallest differences were those with the lowest prescribed dose. This suggests a proportional relationship between the difference in the prescribed dose and the applied dose in relation to the amount of the prescribed dose.
Table 2 and Figure 9 show the values referring to the average operating time in each cell. The areas corresponding to each of the cells, which were used to determine the operational capacity of the machine in each cell, are also presented in Table 2. The number of plants, the prescribed quantity, and the applied quantity of KCl in kilograms for each cell are also presented. The average interval between the applications considering the 21 cells was 8 s. With a population density of 4 thousand plants per hectare, it is concluded that the time required for application in 1 hectare was 8.9 h.
The KCl application map, highlighted in Figure 10, was created from the information recorded by the ECU, which includes the geographic coordinates of each application point and the data related to the applied dose in each collector. The points georeferenced during operation are aligned with the planting rows of the experimental area, showing a correspondence between the application sites and the planting area layout.
Figure 11 presents the comparison between variable-rate and fixed-rate application, showing the values of prescribed quantity at variable rate, effectively applied quantity at variable rate and the total quantity that would be applied if management were carried out with a fixed-rate application in total area, considering the three different doses prescribed: minimum of 55 g per plant, intermediate of 123 g per plant, and maximum of 185 g per plant. The discrepancy between the applied quantity of fertilizer and the quantity prescribed for the entire experimental area was 107.91 kg. This difference is associated with the deviation between the prescribed dose and the applied dose (Figure 7 and Figure 8).
The difference in fertilizer quantities applied using variable-rate and fixed-rate methods, based on a minimum dose of 55 g per plant, amounted to 732.93 kg, reflecting a reduced application in 15 of the 21 sampled cells. This approach would result in a fertilizer deficit in certain parts of the crop. Conversely, if a fixed dose of 123 g per plant were applied across all cells, the difference compared to the prescribed variable rate would be just 89 kg. While overall fertilizer consumption would be similar, some cells would experience a deficit, while others would receive excess fertilizer.
For the maximum dose of 185 g per plant, the difference in applied quantities between the variable-rate and fixed-rate methods would total 686.67 kg more for the entire area. If the operation were conducted using this maximum dose, it would lead to excessive fertilizer application in 18 of the 21 sampled cells, significantly increasing production costs. The use of the appropriate dose in each cell ensures higher profitability, as deficient doses lead to reduced yield, while excessive doses may not result in significant yield gains [7]. On another note, the environmental impacts of applying fertilizers at variable rates are significant. Based on an energy balance analysis considering NPK fertilizer consumption and crop yield, [20] concluded that the adoption of variable-rate fertilizer application reduces energy consumption in coffee cultivation, increasing its energy efficiency without affecting yield. Similar analyses and conclusions are presented in [21,22] for crops such as wheat, spring barley, winter oilseed rape, winter wheat, and faba beans.

4. Conclusions

The machine developed in the present study performed variable-rate fertilizer application, in both laboratory and field settings. The coefficient variation in applied dose was 0.41% for doses above 24 g, independent of fertilizer type or metering device inclination. At the field, the largest and smallest absolute deviation between the prescribed and applied dose was 22.72 and 0.384 g, respectively.
The developed machine has potential applications in future research on mountain agriculture. For instance, it could be used to compare fixed-rate and variable-rate applications, conduct ergonomic and durability analyses, and develop agronomic methods for generating accurate variable-rate prescription maps.

5. Patents

Patent Nature: Invention Patent (IP); Title of Invention: VARIABLE RATE KNAPPER FERTILIZER AND METHOD OF CONTROL; DEPOSIT MADE AT A BRAZILIAN INSTITUTE; Case Number: BR 10 2021 010413 9; INSTITUTO NACIONAL DA PROPRIEDADE INDUSTRIAL—INPI.

Author Contributions

Conceptualization, I.R.Q., A.L.d.F.C., D.S.M.V., D.M.d.Q. and P.H.d.M.R.; methodology, I.R.Q., A.L.d.F.C., D.S.M.V., M.R.F.J. and D.M.d.Q.; software, A.L.d.F.C., I.R.Q. and D.S.M.V.; formal analysis, I.R.Q., D.S.M.V., F.M.d.M.V. and M.R.F.J.; data curation, I.R.Q., D.S.M.V. and F.M.d.M.V.; writing—original draft preparation, I.R.Q., D.S.M.V., F.M.d.M.V., D.M.d.Q. and A.L.d.F.C.; writing—review and editing, I.R.Q., D.S.M.V., D.M.d.Q., A.L.d.F.C., F.M.d.M.V., M.R.F.J. and P.H.d.M.R.; supervision, D.S.M.V., D.M.d.Q. and M.R.F.J.; All authors have read and agreed to the published version of the manuscript.

Funding

This research was funded by Coordination for the Improvement of Higher Education Personnel—Brazil (CAPES), Funding Code 001.

Institutional Review Board Statement

Not applicable.

Data Availability Statement

The data presented in this study are available on request from the corresponding author.

Acknowledgments

This work was made possible thanks to the support of the Coordination for the Improvement of Higher Education Personnel—Brazil (CAPES), Funding Code 001, Foundation for Research Support of Minas Gerais State (FAPEMIG), and National Council for Scientific and Technological Development (CNPq).

Conflicts of Interest

The authors declare no conflicts of interest. The funders had no role in this study; the collection, analysis, or interpretation of data; the writing of the manuscript; or the decision to publish the results.

References

  1. Vitória, E.L.d.; Krohling, C.A.; Borges, F.R.P.; Ribeiro, L.F.O.; Ribeiro, M.E.A.; Chen, P.; Lan, Y.; Wang, S.; Moraes, H.M.F.e.; Furtado Júnior, M.R. Efficiency of fungicide application an using an unmanned aerial vehicle and pneumatic sprayer for control of Hemileia vastatrix and Cercospora coffeicola in mountain coffee crops. Agronomy 2023, 13, 340. [Google Scholar] [CrossRef]
  2. Dou, H.; Wang, C.; Zhang, J.; Cheng, G.; Wang, Z. Transforming mountain agriculture in China: Linking smallholder family production and moderate-scale agriculture. Sustain. Futures 2024, 7, e100208. [Google Scholar] [CrossRef]
  3. Wang, B.; Zhu, J.; Chai, X.; Liu, B.; Zhang, G.; Yao, W. Research status and development trend of key technology of agricultural machinery chassis in hilly and mountainous áreas. Comput. Electron. Agric. 2024, 226, e10445. [Google Scholar] [CrossRef]
  4. Santana, L.S.; Ferraz, G.A.e.S.; Cunha, J.P.B.; Santana, M.S.; Faria, R.d.O.; Marin, D.B.; Rossi, G.; Conti, L.; Vieri, M.; Sarri, D. Monitoring errors of semi-mechanized coffee planting by remotely piloted aircraft. Agronomy 2021, 11, 1224. [Google Scholar] [CrossRef]
  5. Penuels, J.; Coello, F.; Sardans, J. A better use of fertilizers is needed for global food security and environmental sustainability. Agric. Food Secur. 2023, 12, 5. [Google Scholar] [CrossRef]
  6. Kouadio, L.; Deo, C.R.; Byrareddy, V.; Adamowski, J.F.; Shahbaz Mushtaq, S.; Nguyend, V.P. Artificial intelligence approach for the prediction of Robusta coffee yield using soil fertility properties. Comput. Electron. Agric. 2018, 155, 324–338. [Google Scholar] [CrossRef]
  7. Wang, Y.; Yuan, Y.; Yuan, F.; Ata-UI-Karim, S.T.; Liu, X.; Tian, Y.; Zhu, Y.; Cao, W.; Cao, Q. Evaluation of Variable Application Rate of Fertilizers Based on Site-Specific Management Zones for Winter Wheat in Small-Scale Farming. Agronomy 2023, 13, 2812. [Google Scholar] [CrossRef]
  8. Chen, C.; He, P.; Zhang, J.; Li, X.; Ren, Z.; Zhao, J.; He, J.; Wang, Y.; Liu, H.; Kang, J. A fixed-amount and variable-rate fertilizer applicator based on pulse width modulation. Comput. Electron. Agric. 2018, 148, 330–336. [Google Scholar] [CrossRef]
  9. Fulton, J.P.; Shearer, S.A.; Higgins, S.F.; Hancock, D.W.; Stombaugh, T.S. Distribution pattern variability of granular VRT applicators. Trans. ASABE 2005, 48, 2053–2064. [Google Scholar] [CrossRef]
  10. Hu, G.; Chen, J.; Jian, B.; Wan, H.; Liu, L. Modeling and simulation of transportation system of screw conveyors by the discrete element method. In Proceedings of the 2010 International Conference on Mechanic Automation and Control Engineering, Wuhan, China, 26–28 June 2010; pp. 927–930. [Google Scholar] [CrossRef]
  11. Galvão, C.B.; Albiero, D.; Garcia, A.P.; Monteiro, L.A. Fertilizer metering mechanism with helical conic cylindrical thread for family agriculture. Eng. Agric. 2018, 38, 934–940. [Google Scholar] [CrossRef]
  12. Spagnolo, R.T.; Rosa, D.P.; Pinho, M.S.; Schiavon, C.S.; Schmechel, D.H. Performance of helical metering mechanisms in the application of microgranular fertilizer. Eng. Agric. 2020, 4430, 481–488. [Google Scholar] [CrossRef]
  13. Zimmermann, G.G.; Jasper, S.P.; Kmiecik, L.L.; Strapasson, N.L.; Silva, T.X.; Oiole, Y.A. Development of test bench to determine the distribution of granular fertilizers in planting rows using spiral roller, two spiral rollers and fluted roller. PLoS ONE 2020, 15, e0243799. [Google Scholar] [CrossRef] [PubMed]
  14. Spagnolo, R.T.; Rosa, D.P.; Pinho, M.S.; Schiavon, C.S.; Schmechel, D. Models for predicting the performance of fertilizer metering in seed cum fertilizer drill. Braz. J. Agric. Environ. Eng. 2021, 25, 51–57. [Google Scholar] [CrossRef]
  15. Sugirbay, A.M.; Zhao, J.; Nukeshev, S.O.; Chen, J. Determination of pin-roller parameters and evaluation of the uniformity of granular fertilizer application metering devices in precision farming. Comput. Electron. Agric. 2020, 179, 330–336. [Google Scholar] [CrossRef]
  16. Alcarde, J.C.; Malavolta, E.; Borges, A.L.; Muniz, A.S.; Veloso, C.A.; Fabrício, A.C.; Viegas, L.J.M. Higroscopicity evaluation of fertilizers and agricultural liming materials. Sci. Agrícola 1992, 49, 137–144. [Google Scholar] [CrossRef]
  17. Ministry of Agriculture, Livestock and Food Supply of Brazil. Normative Instruction Nº. 61, of July 8, 2020. Available online: https://www.gov.br/agricultura/pt-br/assuntos/insumos-agropecuarios/insumos-agricolas/fertilizantes/legislacao/in-61-de-8-7-2020-organicos-e-biofertilizantes-dou-15-7-20.pdf (accessed on 3 February 2025).
  18. Ribeiro, A.C.; Guimarães, P.T.G.; Alvarez, V.V.H. Soil fertility commission of the State of Minas Gerais. In Recommendations for the Use of Correctives and Fertilizers in Minas Gerais—5th. Approximation, 5th ed.; Minas Gerais State Soil Fertility Commission: Viçosa, Brasil, 1999; pp. 25–32. [Google Scholar]
  19. Qgis Development Team. QGIS Geographic Information System. 2009. Available online: http://qgis.org (accessed on 3 February 2025).
  20. Angnes, G.; Martello, M.; Faulin, G.D.C.; Molin, J.P.; Romanelli, T.L. Energy Efficiency of Variable Rate Fertilizer Application in Coffee Production in Brazil. AgriEngineering 2021, 3, 815–826. [Google Scholar] [CrossRef]
  21. Jovarauskas, D.; Steponavičius, D.; Kemzūraitė, A.; Zinkevičius, R.; Venslauskas, K. Comparative analysis of the environmental impact of conventional and precision spring wheat fertilization under various meteorological conditions. J. Environ. Manag. 2021, 296, e113150. [Google Scholar] [CrossRef]
  22. Kazlauskas, M.; Bručienė, I.; Jasinskas, A.; Šarauskis, E. Comparative Analysis of Energy and GHG Emissions Using Fixed and Variable Fertilization Rates. Agronomy 2021, 11, 138. [Google Scholar] [CrossRef]
Figure 1. Electric metering mechanism with fertilizer outlet hole (1), metering mechanism sleeve (2), bearing unit (3), shaft (4), double-fillet screw conveyor (5) with conical (a) and cylindrical (b) parts: (5), closing cap (6), pulse counter encoder (7), disc coupling (8), electric motor (9), motor power cables (c), encoder fixing to the closing cap (d), trigger connection cable (e) and connector for ECU cable (f).
Agriculture 15 00361 g001
Figure 2. Flowchart of the software developed to be executed in the ECU of the portable machine.
Agriculture 15 00361 g002
Figure 3. Portable machine for variable-rate application of solids, featuring an electric metering mechanism, an Electronic Control Unit (ECU), a lithium-ion battery, and a GNSS antenna.
Agriculture 15 00361 g003
Figure 4. Plot map with cell divisions and soil sampling points. The total area (2.57 ha) was divided into 21 cells averaging 0.12 ha, featuring mountainous terrain, clayey soil, coffee crops in production, and a planting density of 4000 plants per hectare.
Agriculture 15 00361 g004
Figure 5. Graph of the average mass rate of fertilizer and average mass dose for each angle of revolution.
Agriculture 15 00361 g005
Figure 6. (a) Mass rate for each type of fertilizer; (b) mass rate for each type of fertilizer as a function of inclination.
Agriculture 15 00361 g006
Figure 7. Prescription map and application map (a) with prescribed quantity (g/plant) for KCl fertilizer application; (b) applied quantity (g/plant) of KCl fertilizer.
Agriculture 15 00361 g007
Figure 8. Comparison of prescribed and applied potassium chloride (KCl) fertilizer doses across cells. The bar graph displays the average applied dose (g/application) and the prescribed dose for each cell (1 to 21) within the plot. The line plot indicates the percentage deviation between applied and prescribed doses, with values shown on a secondary y-axis. This analysis highlights the variability in fertilizer application accuracy, essential for assessing adherence to prescription guidelines and optimizing nutrient management.
Agriculture 15 00361 g008
Figure 9. Analysis of potassium chloride (KCl) fertilizer application dose and application time across plot cells. The graph compares the average applied KCl dose per cell (g/application) with the corresponding application time for each cell (1 to 21). Bars represent the average applied dose, while the dotted line indicates the application time in seconds, with a horizontal line showing the average application time, values shown on a secondary y-axis. This visualization allows for the assessment of fertilizer application consistency relative to time.
Agriculture 15 00361 g009
Figure 10. KCl fertilizer application operation map: georeferenced doses (grams) applied at each point in each cell.
Agriculture 15 00361 g010
Figure 11. Prescribed and applied quantity compared to the adoption of three fixed rates: 55 g/plant; 123 g/plant; and 185 g/plant.
Agriculture 15 00361 g011
Table 1. Physical characteristics of the fertilizers used in the experiment.
FertilizerParticle-Size ClassificationAngle of Repose (°)Water Content (%)Specific Mass (g/mL)
KClGranulated40.700.42371.044
SSPowdered46.062.39841.210
NPKPowdered39.272.05891.109
UreaGranulated38.860.69780.745
Table 2. Effective operational capacity and operational efficiency data.
CellArea
(ha)
Number of PlantsPrescribed Quantity
(kg)
Applied Quantity
(kg)
Average Time
(hours)
Effective
Operational Capacity
(ha/h)
10.09337245.75649.4331.0020.082
20.10742823.54025.8330.8560.113
30.13554066.42067.3611.3500.090
40.14056068.88077.1280.9960.129
50.11847258.05665.1441.0490.100
60.13052028.60030.8790.9240.129
70.142568105.080117.9861.3570.090
80.14156469.37276.9911.3160.100
90.09839221.56026.8360.6970.129
100.12449661.00868.1261.9010.090
110.12449627.28029.0674.7950.113
120.13052063.96068.8853.1780.129
130.141564104.340117.1322.2870.100
140.14056068.88069.4690.8710.150
150.13152464.45275.4561.0770.113
160.12650461.99264.3041.0080.113
170.12951628.38028.1820.9460.129
180.12550061.50067.3751.0000.113
190.06726814.74013.8200.3130.180
200.15562076.26080.4632.3770.113
210.10441676.96085.0641.3400.069
Disclaimer/Publisher’s Note: The statements, opinions and data contained in all publications are solely those of the individual author(s) and contributor(s) and not of MDPI and/or the editor(s). MDPI and/or the editor(s) disclaim responsibility for any injury to people or property resulting from any ideas, methods, instructions or products referred to in the content.

