Abstract
In agricultural production, numerous nonlinear, time-lagged, and continuously disturbed deterministic processes require effective regulation. This study proposed a window AI control method driven by mechanism and data, which was studied and applied in continuous grain drying process based on the concepts of micro-environment absolute water potential and water potential accumulation. A control system for continuous grain drying was established based on absolute water potential accumulation, and three sets of experiments were conducted: constant temperature drying (water potential accumulation control window, hot air temperatures of three drying sections: 40 °C, 40 °C, 40 °C; relative humidity: 35–40%), increasing temperature drying (water potential accumulation control window, hot air temperatures of three drying sections: 35 °C, 40 °C, 45 °C; relative humidity: 35–40%), and a control experiment (equivalent accumulated temperature control window, hot air temperatures of three drying sections: 40 °C, 40 °C, 40 °C; relative humidity: 35–40%). The results showed that the outlet moisture content ranged from 15.08% to 15.86%, 15.30% to 15.91%, and 15.10% to 15.95%, respectively. The outlet moisture control accuracy ranged from −0.42% to 0.36%, −0.2% to 0.41%, and −0.4% to 0.45%, respectively. Analysis of grain quality indicators (damage percentage, germination percentage, fatty acid value) and microscopic structure revealed the following order: increasing temperature drying > constant temperature drying > control experiment. Compared with the control experiment adopting the equivalent accumulated temperature window control method, the proposed method exhibited higher control accuracy and stability. By integrating coupled temperature and humidity parameters into the variables, the quality of dried grains was effectively guaranteed.
1. Introduction
The grain drying process is characterized by solid coupling, significant time delays, and substantial overshoot. AI control methods have demonstrated superior performance in addressing these challenges. AI control methods can be categorized into mechanism-driven and data-driven control approaches. As early as the 1960s, scholars began establishing theoretical models to simulate the grain drying process. Professor Bakker-Arkema [] derived a theoretical model for grain drying based on the fundamental principles of heat and mass transfer, which is now widely used to simulate the drying of corn, rice, and wheat. Spencer [], Sun et al. [], Srivastava & John [] and Setty & Murthy [] improved and applied the partial differential equations proposed by Professor Bakker-Arkema under various drying conditions. Other scholars also established different drying models [,,,,]. Some scholars have realized drying control systems through data-driven methods, such as PID control [,,], fuzzy control [,,,], neural networks, and support vector machines [,,,,]. Jin et al. [] designed an LSTM-MPC controller, which improved the response speed by 15–30% and the post-drying moisture control accuracy by more than 0.2% compared with the classic PID controller. It also demonstrated stronger robustness. But the boundary conditions of mechanism models are often overly idealized, lacking robust anti-interference capabilities, which can affect the effectiveness of simulations and practical control applications. Data-driven methods, on the other hand, require large amounts of comprehensive and accurate data to ensure control precision, leading to prolonged machine learning time and an increased risk of falling into local optima.
The concept of equivalent accumulated temperature was first proposed by Wu [] and applied to grain drying. Liu et al. [] proposed a continuous drying window control method based on equivalent accumulated temperature, marking the first application of a window AI control method in the field of grain drying. This method optimized the nonlinearity and significant time delay in grain drying. Wu et al. [] proposed a dual-driven mutual window control method for continuous grain drying based on equivalent water potential accumulation. Liu et al. [] further proposed a mechanism-data dual-driven window AI control method for continuous grain drying and established a corresponding control system, which enhanced the control precision and stability of the drying process, achieving a high outlet moisture control accuracy of −0.58% to 0.3%.
Most existing studies primarily focus on improving moisture control accuracy while neglecting the grain quality of dried grains [,,]. To address this limitation, this study proposed a mechanism-driven and data-driven mutual window AI control method based on absolute water potential accumulation, optimizing the shortcomings of single-driven method. The control method consisted of three parts: window selection based on mechanism-driven method, window adjustment and window self-adaptation based on data-driven method. The absolute water potential accumulation drying model was used as the mechanism-driven basis, while process data was acted as the data-driven support. The outlet moisture content, damage percentage, germination percentage, and fatty acid value were measured. And the microscopic structure was also observed to comprehensively evaluate the performance of the proposed method.
2. Materials and Methods
2.1. Water Potential and Water Potential Accumulation for Continuous Grain Drying
The grain drying process is influenced by multiple control factors, including drying temperature, humidity, hot air velocity, and drying time, all of which are considered independent drying variables. Due to the strong coupling property of the grain drying process, analyzing the effect of a single independent factor on the drying process yields inaccurate results. This study combined absolute temperature and humidity to define absolute water potential, which characterized the difficulty of moisture migration and vaporization.
Professor Wu introduced the concept of water potential into grain drying [], proposing that moisture migrated between grains and the drying environment through the grain epidermis (which had a specific thickness and micropores) and that the interior of grains was porous.
For the interior of grains, the water potential of water molecules can be expressed as []:
In Equation (1), R is the universal gas constant, 8.31 J/(mol·K); T is the thermodynamic temperature, K; Vw is the partial molar volume of water, 18 × 10−6 m3/mol; M is the dry-base moisture content of grains, (%, d.b.); Ms is the saturated dry-base moisture content of grains, (%, d.b.); rs is the water activity coefficient within grains.
The atmospheric water potential of the external drying environment can be expressed as []:
In Equation (2), e is the actual vapour pressure of air, hPa; es is the saturated vapour pressure of air, hPa; RH is the relative humidity of air, %.
Go a step further, the absolute water potential can be expressed as []:
In Equations (3) and (4), Pg is the absolute water potential of grains, kJ/kg; Pa is the absolute water potential of air, kJ/kg; Rv is the water vapour gas constant, 0.4619 kJ/(kg·K); Tg is the absolute temperature of grains, K; Ta is the absolute temperature of air, K; AHg is the absolute humidity of grains at temperature Tg, g/m3; AHa is the absolute humidity of air at temperature Ta, g/m3.
The particle absolute moisture migration potential can be expressed as []:
When PT > 0, moisture migrates from the interior of grains to the external air, corresponding to a desorption process.
When PT = 0, the moisture content of grains and air reaches an equilibrium state.
When PT < 0, moisture migrates from the external air to the interior of grains, corresponding to an absorption process.
When the moisture content of grains is high, the absolute water potential is also high, facilitating the evaporation and migration of moisture from grains to the external air. As the moisture content of grains decreases, the absolute water potential decreases accordingly. The absolute water potential can be used to judge the direction of water migration and the precipitation rate during grain drying.
During the drying process, the cumulative absolute water potential of grains over time in each drying stage is defined as the absolute water potential accumulation of grains. The calculation formula can be expressed as [,]:
In Equations (6)–(9), Pgi is the absolute water potential of grains in the i-th drying stage, kJ/kg; Tgi is the temperature of grains in the i-th drying stage, °C; EAHgi is the equilibrium absolute humidity of grains in the i-th drying stage at temperature Tg, g/m3; Mgi is the moisture content of grains, (%, w.b.); ERHgi is the equilibrium relative humidity of grains in the i-th drying stage at temperature Tg, g/m3.
2.2. The Dual-Driven Window AI Control Method for Continuous Grain Drying
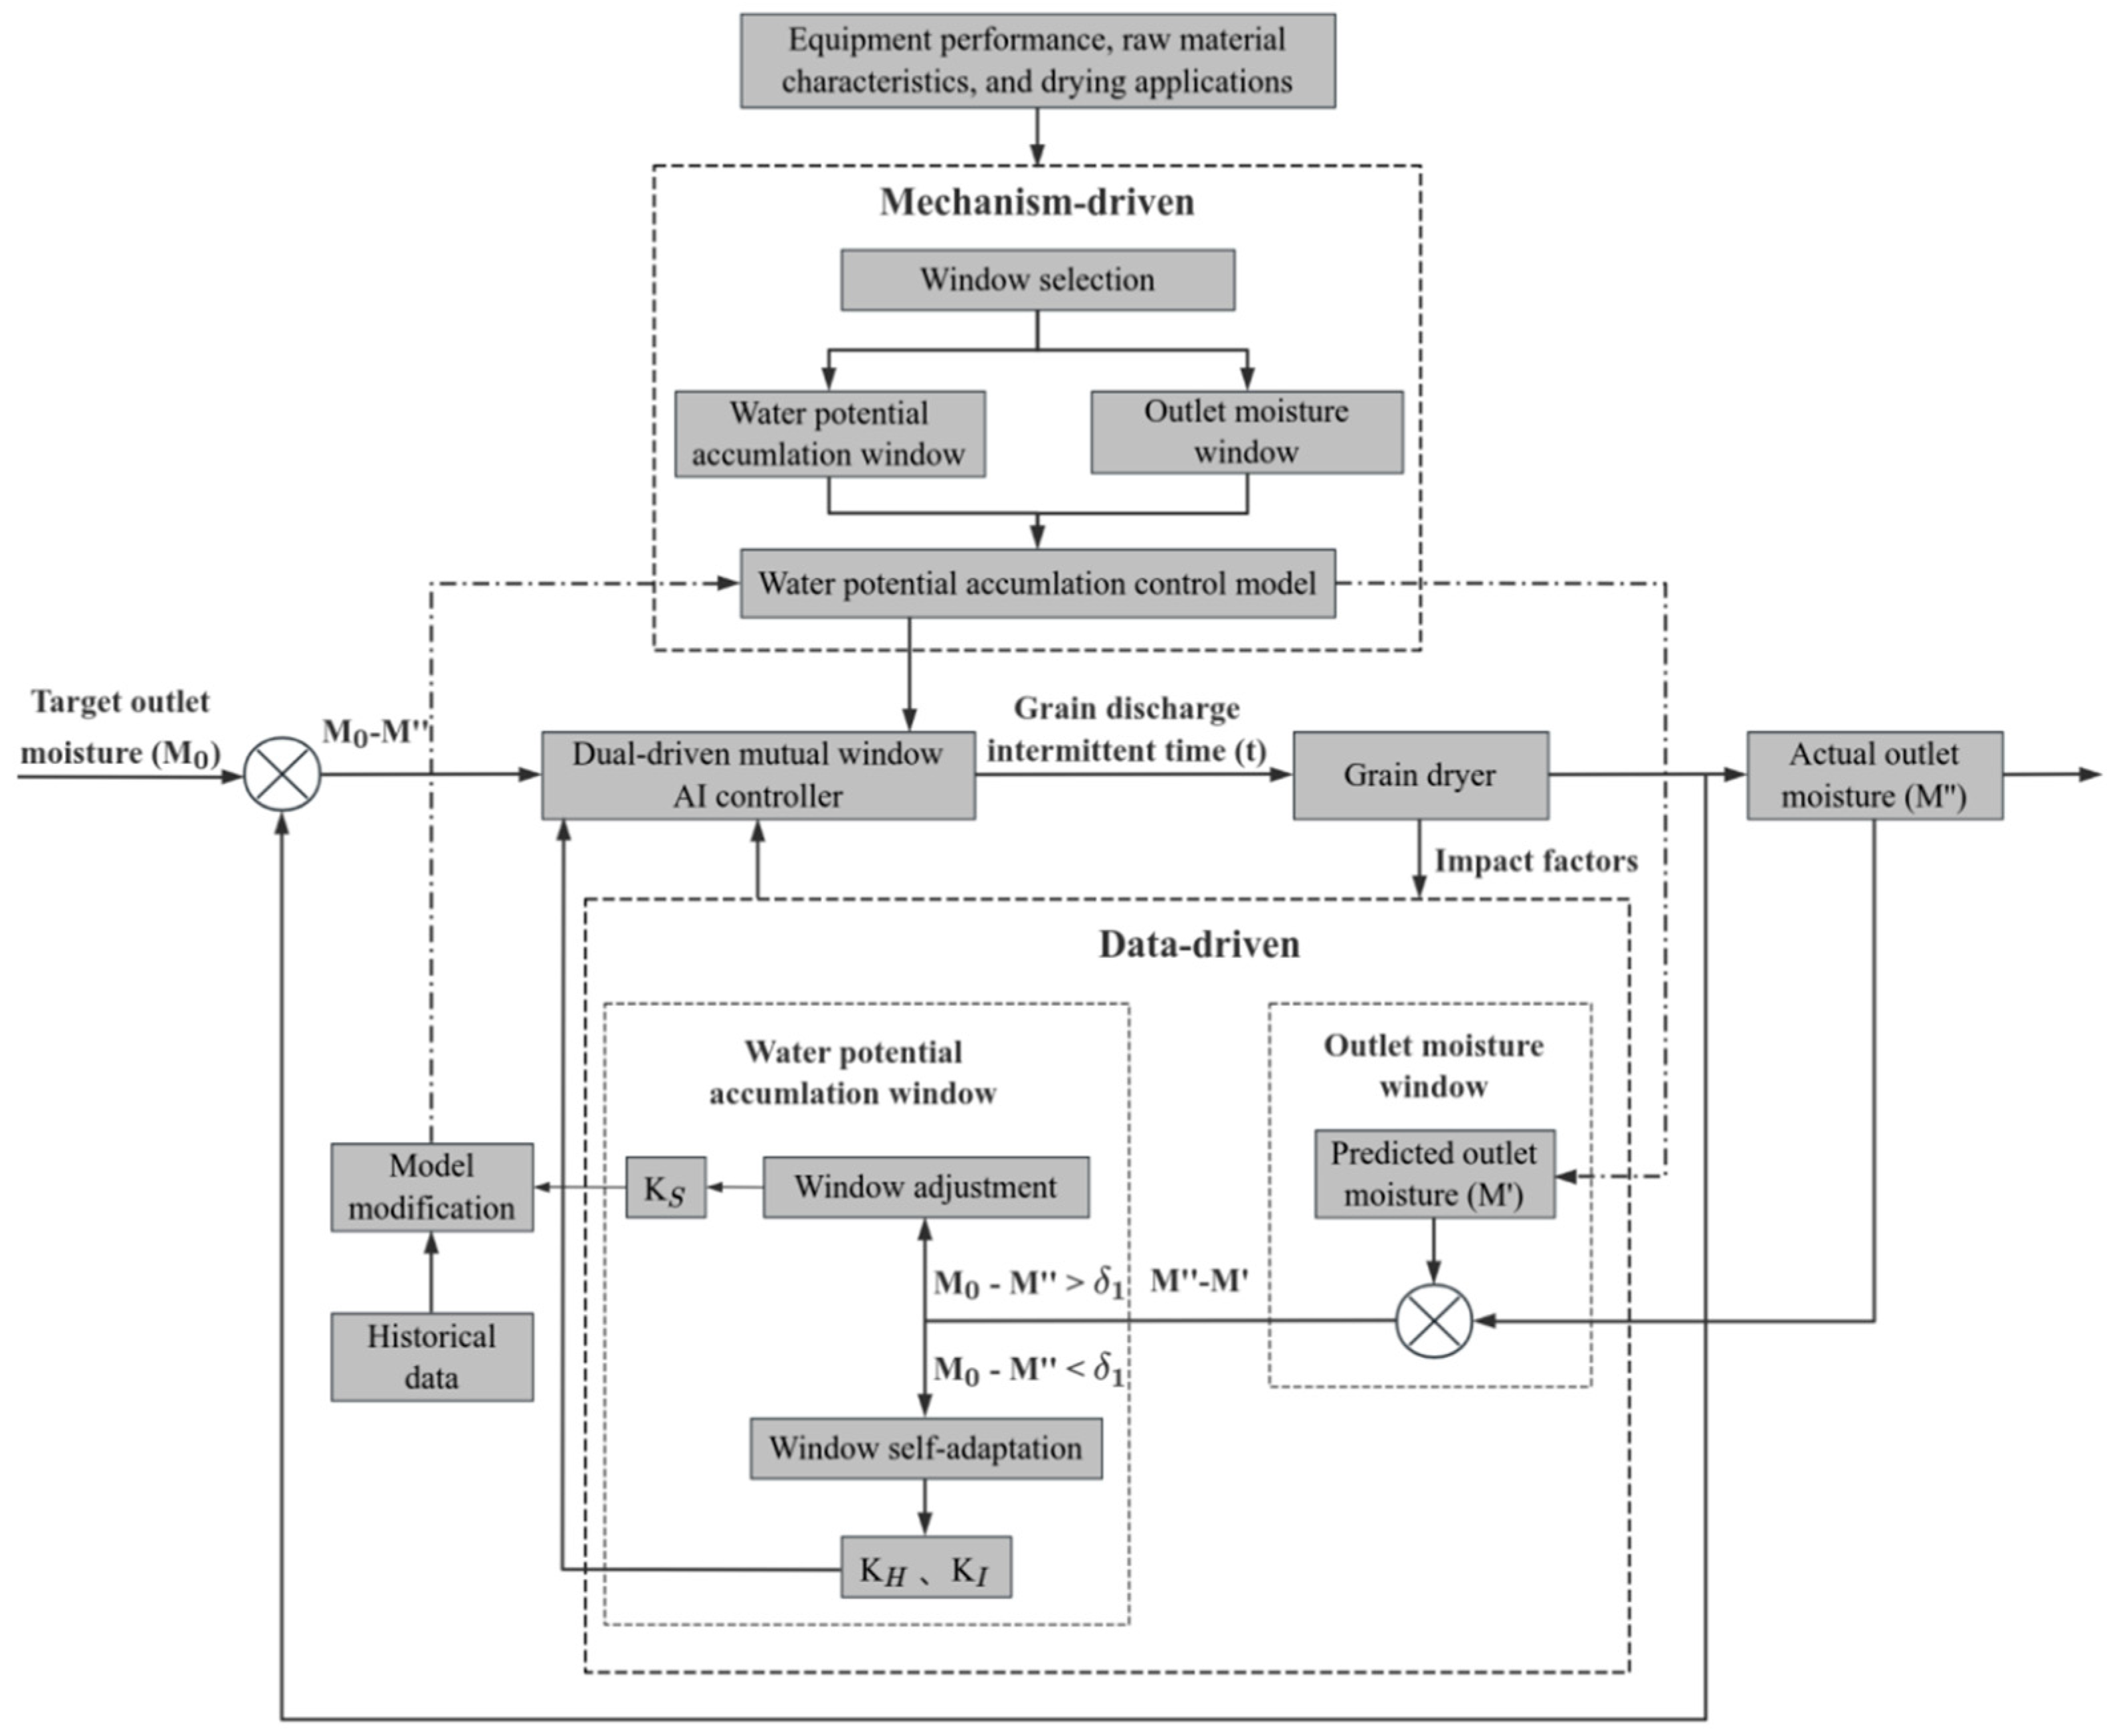
The dual-driven window AI control method optimizes the “window area” based on mechanism-driven methods and automatically adjusts the “window change” through data-driven methods. The schematic diagram of the control principle is shown in Figure 1. The method consists of three parts: window selection, window adjustment, and window self-adaptation. Window selection is realized through model calculation, where water potential and drying time are selected to form the “water potential accumulation” control window, and outlet moisture and drying time are chosen to form the “outlet moisture” realization window. Window adjustment involves modifying the model using neural networks, genetic algorithms, etc., by comparing the characteristics of real-time data with historical data. Window self-adaptation adjusts the window width and aspect ratio using real-time data.
Figure 1.
Schematic diagram of drying process control principle. M0, target outlet moisture; M′, predicted outlet moisture; M′′, actual outlet moisture; kS, area coefficient; kH, width coefficient; kI, width-length ratio coefficient; δ1, threshold of the difference between M0 and M′.
2.2.1. Window Selection Based on Mechanism-Driven Control
As shown in Figure 1, a “mutual window” composed of a water potential accumulation window and an outlet moisture window is selected through a mechanism model. To establish the mechanism model, a two-factor, five-level comprehensive experiment was conducted for variable temperature and humidity thin-layer grain drying (25 experiments in total). The factor levels are shown in Table 1 (drying conditions and experiment data were collected at 1 min intervals). The grains used in the experiment were japonica rice (Daohuaxiang No. 2) produced in Changchun, Jilin Province, China, with an initial moisture content of 22% (w.b.).
Table 1.
Factor levels for the grain comprehensive experiment.
Several common mathematical models (single diffusion equation, two-term diffusion equation, approximate diffusion equation, Lewis equation, Page equation, modified Page equation, and Weibull equation) were used to fit and analyze the thin-layer drying experimental data, and statistical analysis was performed using MATLAB 2018. The fitting results of different models for the same set of experimental data were compared using AIC (Akaike Information Criterion) [,], and BIC (Bayesian Information Criterion) [,]. The Weibull equation () exhibited the optimal fitting effect, with AIC = −111.56032 and BIC = −113.44853. The Weibull Equation was used to fit and analyze 25 sets of thin-layer drying experimental data, and multiple quadratic regression analysis was performed on the four drying constants a, b, k, and N of the Weibull Equation. Terms with p > 0.05 (non-significant terms) were excluded, resulting in quadratic regression equations for four drying constants as functions of hot air temperature X1 and hot air humidity X2, with R2 values of 0.99447, 0.93873, 0.98894, 0.99135, respectively.
Combined with the Weibull equation, the following can be obtained []:
According to the above Equation, the water potential accumulation can be expressed as:
In practical drying operations, the tempering ratio coefficient H is involved, which has a significant impact on the water potential product value. The calculation formula can be expressed as []:
In Equation (16), α is a constant; are the coefficients of the polynomial terms; γ is the tempering ratio.
Subsequently, the water potential accumulation drying model based on the Weibull equation is as follows:
2.2.2. Window Adjustment and Window Self-Adaptation Based on Data-Driven Control
Window adjustment involves comparing the characteristics of real-time data with historical data to modify the area size of the mutual window. Window self-adaptation adjusts the window width and width-length ratio using real-time data without changing the area size of the mutual window. The formula can be expressed as []:
In Equation (18), u(k) is the k-th output value of the controller (change in controller output); kS is the area coefficient; kH is the width coefficient; kI is the width-length ratio coefficient; Pg0 is the target water potential value; Pgi is the water potential value at time i; ∑Pgi is the water potential accumulation value at time i; ΔPgi/Δti is the rate of change in the water potential at time i.
Window Adjustment
Window adjustment refers to optimizing the model parameters using a genetic algorithm when the deviation e between the predicted outlet moisture M’ of the water potential accumulation drying model and the target outlet moisture M0 exceeds the threshold δ1. The deviation e, the rate of change in the deviation ec during the control process, and the correction coefficient in the water potential accumulation drying model are selected as input variables. The compensation amounts for each coefficient of the controller output are adjusted as output variables. When the optimized control conditions are achieved, the theoretical water potential accumulation model is determined. The formula can be expressed as []:
In Equation (19), KS(t) is the objective function; e(k) is the systematic error; u(k) is the output of the controller; tr is the rise time; w1, w2, w3 are weights; n is the number of sampling points of the system; σ% is the overshoot of the control system.
Window Self-Adaptation
Window self-adaptation occurs when the deviation e between the predicted outlet moisture content M’ of the water potential accumulation drying model and the target outlet moisture content M0 is less than the threshold value δ1. Without changing the window area, the predicted outlet moisture content M’ is adjusted to approach the target outlet moisture content M0 using the following formula and a proportional adjustment algorithm, thereby optimizing the “water potential” window. The formula can be expressed as []:
In Equation (20), τ1 is the single intermittent time, min; τ2 is the single grain discharge time, min; CPgi is the theoretical water potential accumulation, (kJ/kg)·min; Pgi is the water potential in the i-th drying stage, kJ/kg; Vi is the volume in the i-th drying stage and tempering stage of the continuous dryer, m3; V is the single grain discharge volume of the continuous dryer, m3.
2.2.3. Mechanism and Data Dual-Driven Mutual Window Control Method Diagram
In Figure 2, the control window area is adjusted from CPg1 to CPg2 (CPg1 ≠ CPg2), and the moisture reduction curve changes from ac to be. When the deviation between the predicted outlet moisture content M’ and the target moisture content M0 is less than or equal to δ1, only the width-length ratio of the window is adjusted without changing the window area. The window is adjusted from CPg31 to CPg32 (CPg31 = CPg32 = CPg3N), and the moisture reduction curve changes from dg to fi. This adjustment continues until the predicted outlet moisture content M’ infinitely approaches the target outlet moisture content M0.
Figure 2.
Theoretical diagram of dual-driven mutual window control.
2.3. Small Continuous Drying Test System
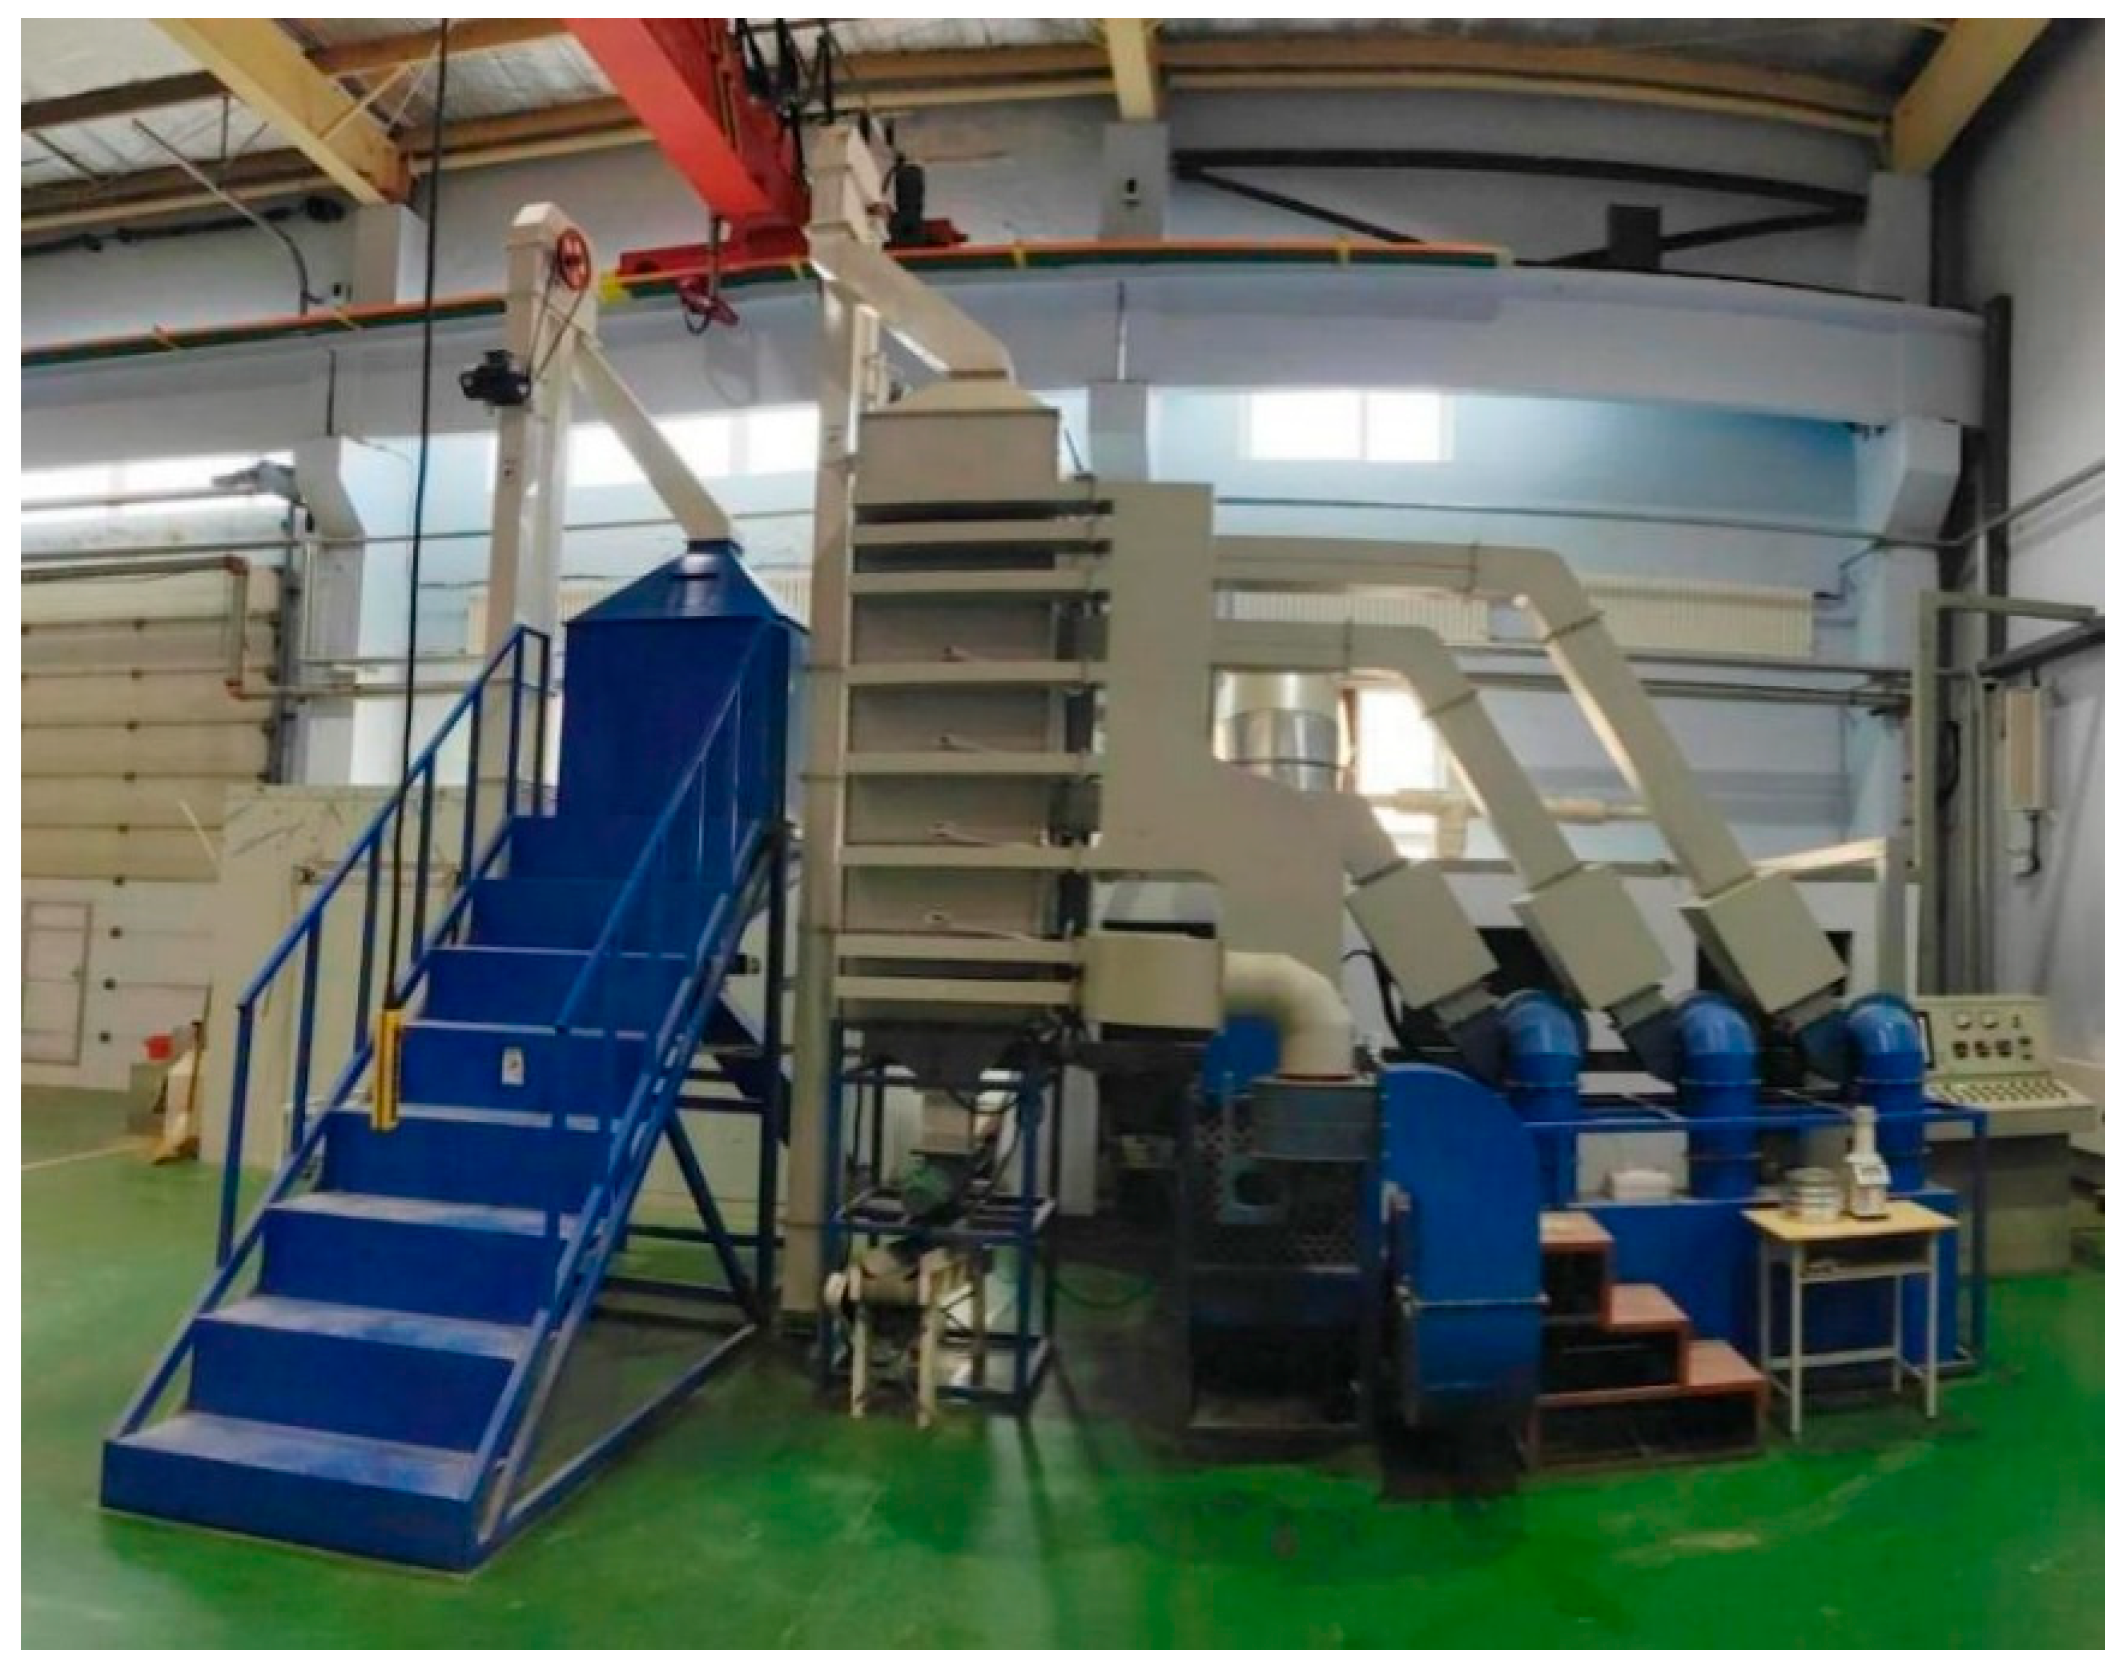
In this experiment, a small-scale continuous grain dryer developed by Changchun JLU science instrument equipment Co. Ltd. (Changchun, China) was used for grain drying. The physical equipment is shown in Figure 3, mainly consisting of a drying tower, heating system, transmission system, and monitoring and control system. The dryer adopts a forward and reverse-flow hot air drying process and is divided into six sections: grain storage section, upper drying and tempering section, middle drying and tempering section, lower drying and tempering section, cooling section, and grain discharge section. The sensor layout is shown in Figure 4, with hot air temperature sensors (T1–T3), grain temperature sensors (T00–T05), tail gas temperature and humidity sensors (TH1–TH8), and a grain moisture sensor (M01). During grain drying, hot air is delivered into the drying tower by a hot air unit to dry the grains. After passing through each drying section, the grains enter the cooling section for cooling and are then discharged from the dryer through the grain discharge section, completing the drying process. To meet the moisture drying requirements, grains are discharged intermittently at regular intervals. The system can detect and automatically record the moisture content, temperature, tail gas temperature, and relative humidity at the grain outlet in real-time for automatic data collection and analysis.
Figure 3.
Physical picture of the small continuous grain dryer.
Figure 4.
Small continuous grain dryer structure and sensor layout.
2.4. Absolute Water Potential Accumulation Model for Small Continuous Dryer
The water potential accumulation model based on the Weibull equation (Equation (17)) serves as the initial theoretical model, providing the theoretical value for the control window. It is also necessary to establish an equivalent absolute water potential accumulation model of grains to achieve process control.
The grain bed in a continuous grain dryer is divided into several thin layers. Let Δt represent the time required for a single thin layer of the grain bed to move. During Δt, it is assumed that the grain bed remains stationary. For each thin layer, the absolute water potential accumulation of grains during the Δt drying time is calculated and summed. The calculation formula for the equivalent absolute water potential accumulation of grains can be transformed into the following Equation:
In Equation (21), n is the number of thin layers; Pgi is the absolute water potential of grains in the i-th thin layer, kJ/kg; Δt is the time required for the grain bed to move from the (i − 1)-th thin layer to the i-th thin layer, min.
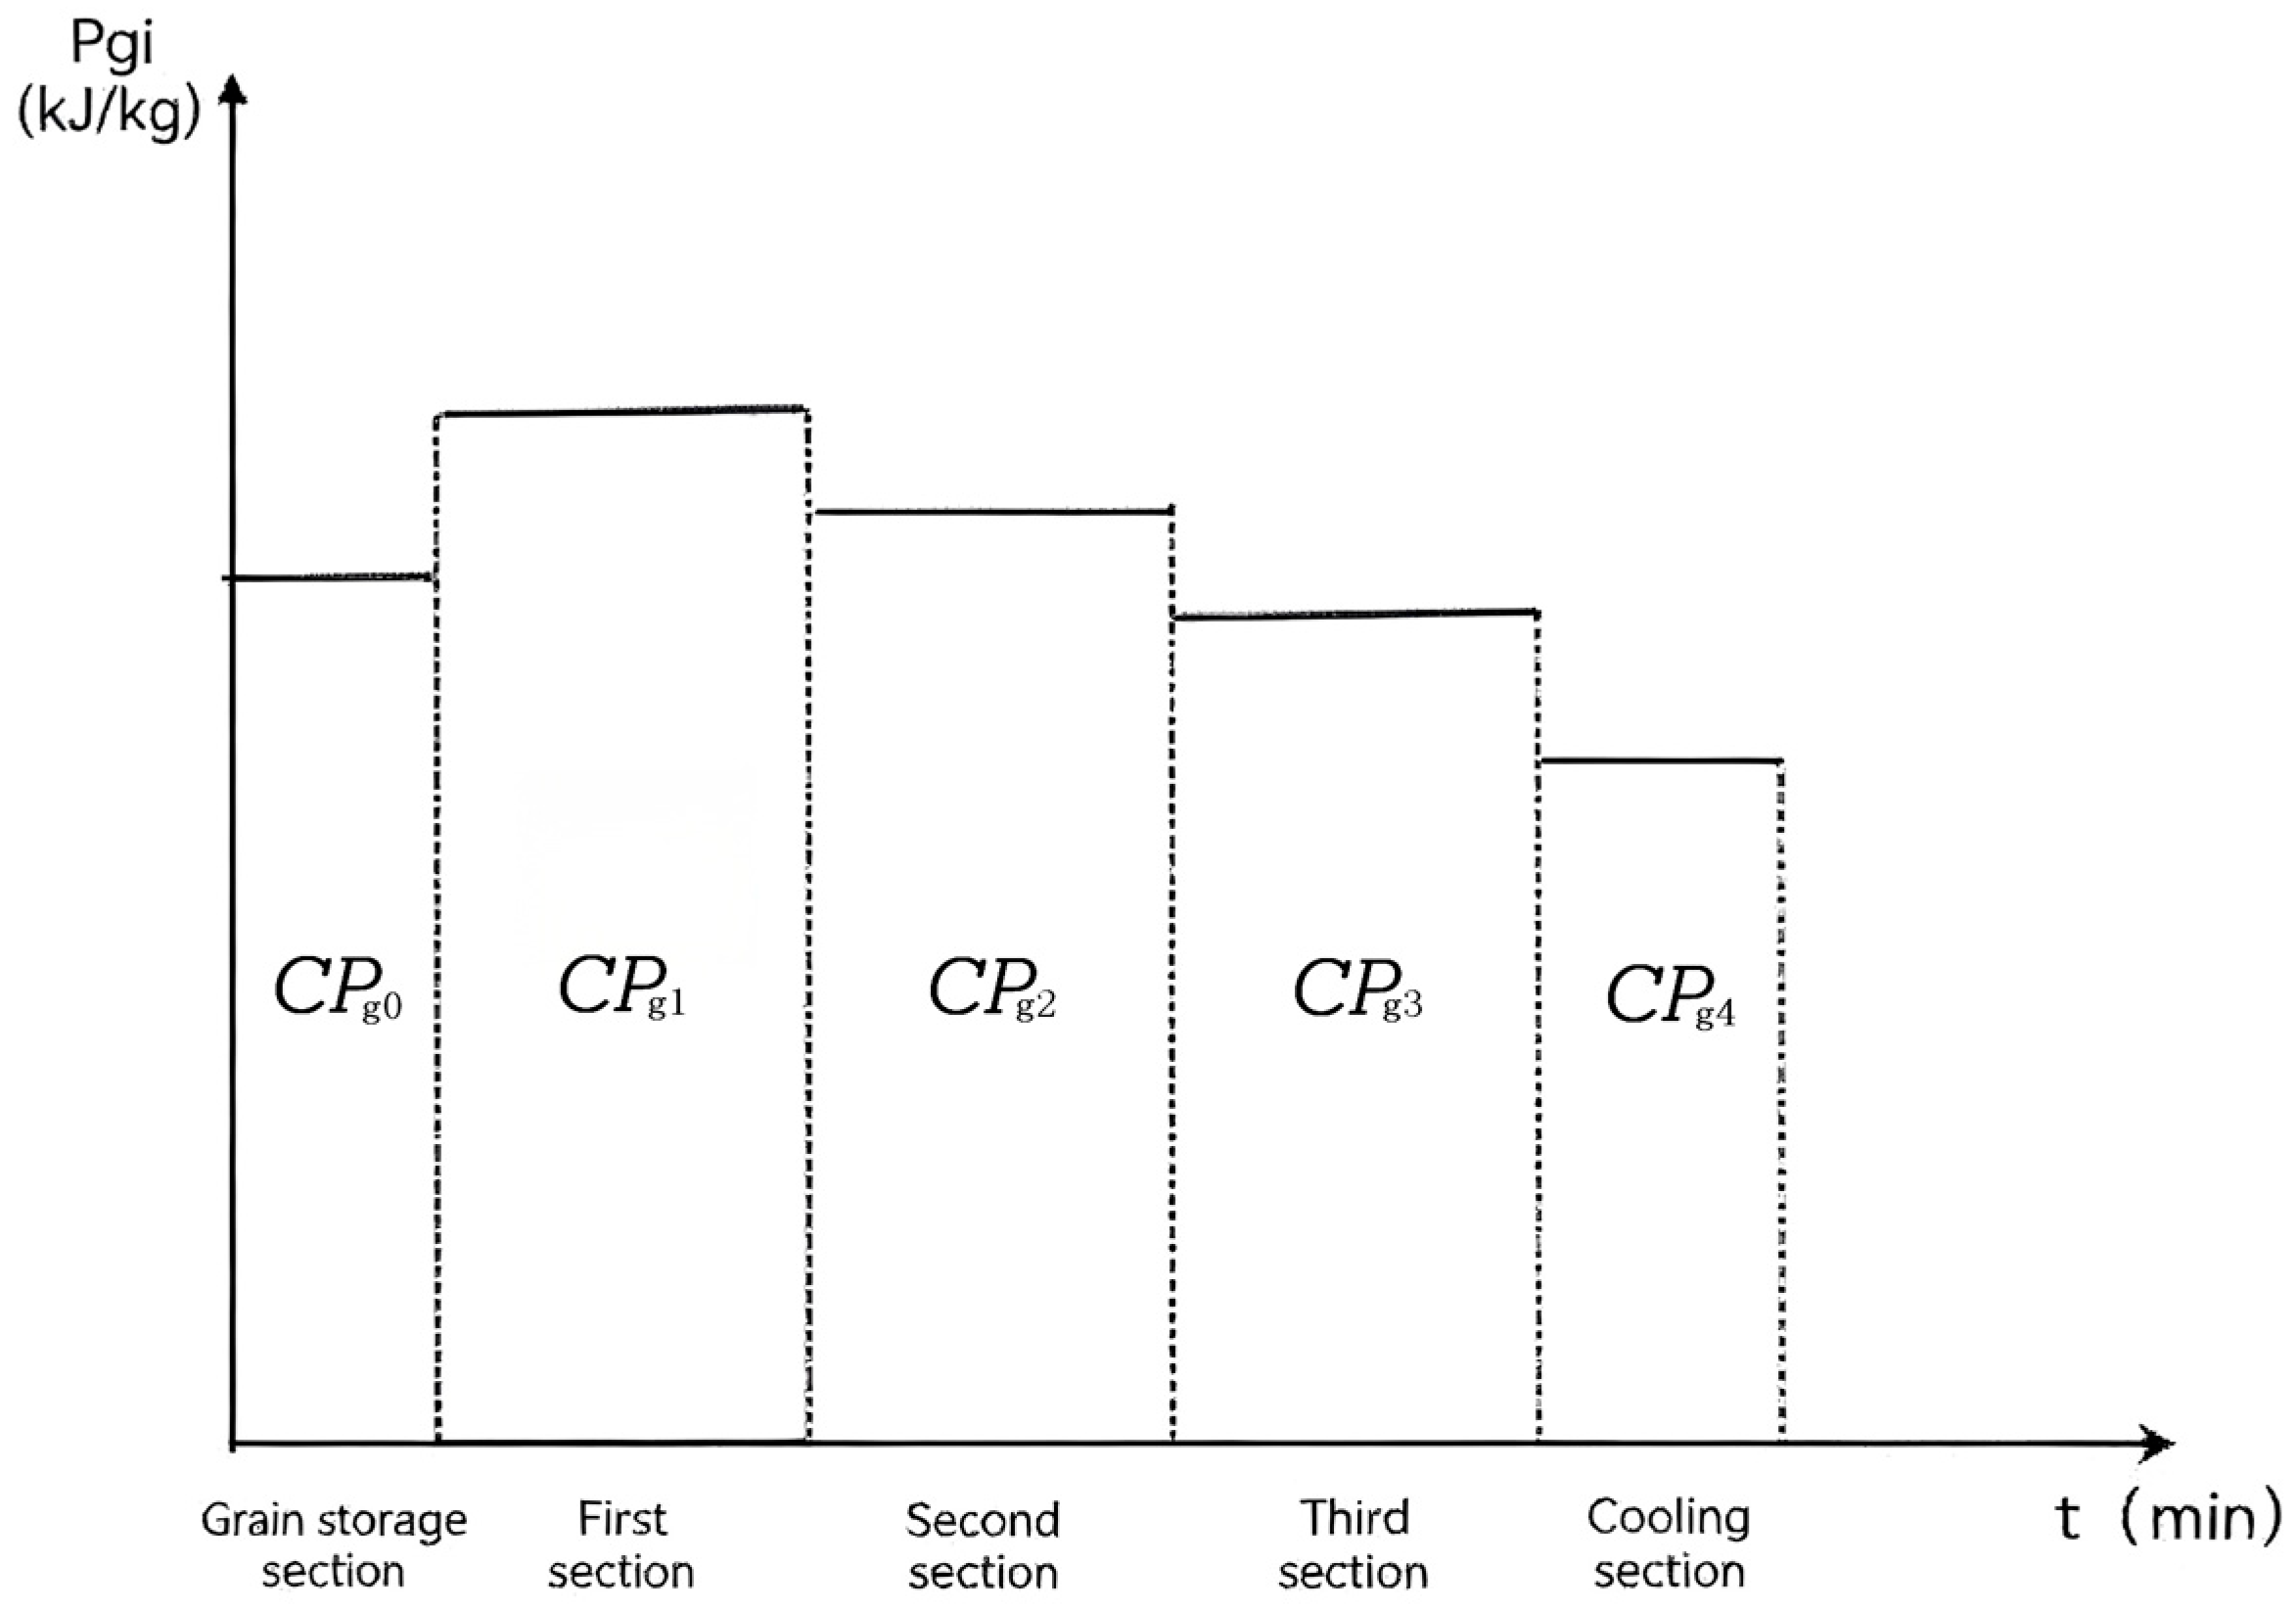
The water potential distribution in each drying section of the dryer is shown in Figure 5.
Figure 5.
Water potential distribution in each drying section.
The above Formula (21) can be rewritten as:
In Equation (22), Pg0, Pg1, Pg2, Pg3, and Pg4 represent the average absolute water potential of grains in each thin layer, which can be calculated using Equations (7)–(9), kJ/kg; t0, t1, t2, t3, t4 represent the time taken for grains to pass through each thin layer, min.
The volumes of the five sections of the dryer (V0, V1, V2, V3, and V4) are 0.09582 m3, 0.11038 m3, 0.11038 m3, 0.11038 m3, and 0.16397 m3, respectively. During a single grain discharge cycle, the single intermittent time is τ1, the single grain discharge time τ2 is 0.5 min, and the single grain discharge volume V is 0.008 m3.
The values of t0, t1, t2, t3, and t4 can be calculated based on the volume of each section of the dryer and the single grain discharge volume:
The equivalent absolute water potential accumulation of grains can be expressed as:
2.5. Experimental Method
The drying test object was japonica rice (Super Rice) produced in Wanchang County, Jilin Province, China. Three sets of continuous drying experiments were conducted using the small-scale continuous grain dryer, with approximately 1.5 tons of grains dried in each experiment. The specific test scheme is shown in Table 2. The tempering ratio is defined as the ratio of tempering time to drying time.
Table 2.
Continuous drying experiment scheme of grain.
Experiment 1 used constant temperature drying, experiment 2 used increasing temperature drying, and experiment 3 used the original method (equivalent accumulated temperature window control method []) under constant temperature drying.
The specific drying process was as follows:
(1) Grains were loaded into the dryer, and the elevator was started to lift raw grains from the preparation warehouse to the top of the dryer. Grains entered the drying tower through the top feed inlet, and grain loading was stopped when the drying tower was fully filled,
(2) Parameters and the initial theoretical value of absolute water potential accumulation were input into the system.
(3) The dryer was then started, and the control system automatically collected sensor data and performed real-time online control (drying conditions and experiment data were collected at 1 min intervals).
(4) When the deviation between the actual outlet moisture and the theoretical outlet moisture was maintained within the threshold value δ1, an appropriate number of grains was randomly sampled from the outlet for quality assessment.
(5) After all grains were discharged from the dryer, the experiment was completed, and the equipment was shut down.
2.6. Experimental Indicators
2.6.1. Outlet Moisture Content
During the drying process, the outlet grain moisture content (%, w.b., the same below) was automatically monitored by the capacitive moisture online detector installed on the dryer, with the precision of ±0.5% []. The moisture content was the average value of three measurements, with results retained to two decimal places.
The similarity between the target outlet moisture curve and the stabilized actual outlet moisture curve of each experiment was calculated using the Pearson correlation coefficient algorithm in Origin8.0 software. The Pearson correlation coefficient is defined as follows:
In Equation (25), X is the target outlet moisture curve; is the average target outlet moisture; Y is the actual outlet moisture curve; is the average actual outlet moisture.
2.6.2. Quality Indicators
Damage percentage: According to GB 1350 [], the damage percentage is one of the grain quality standards, determined using the FCF staining method [].
Germination percentage: As a key indicator of grain vitality, the germination percentage was determined using the TTC staining method [].
Fatty acid value: The fatty acid value reflects the aging degree of grains and can scientifically reflect the harvest life of grains and the quality deterioration degree during storage [], determined in accordance with GB/T 5510 [].
3. Results
3.1. Analysis and Comparison of Outlet Moisture Control Accuracy
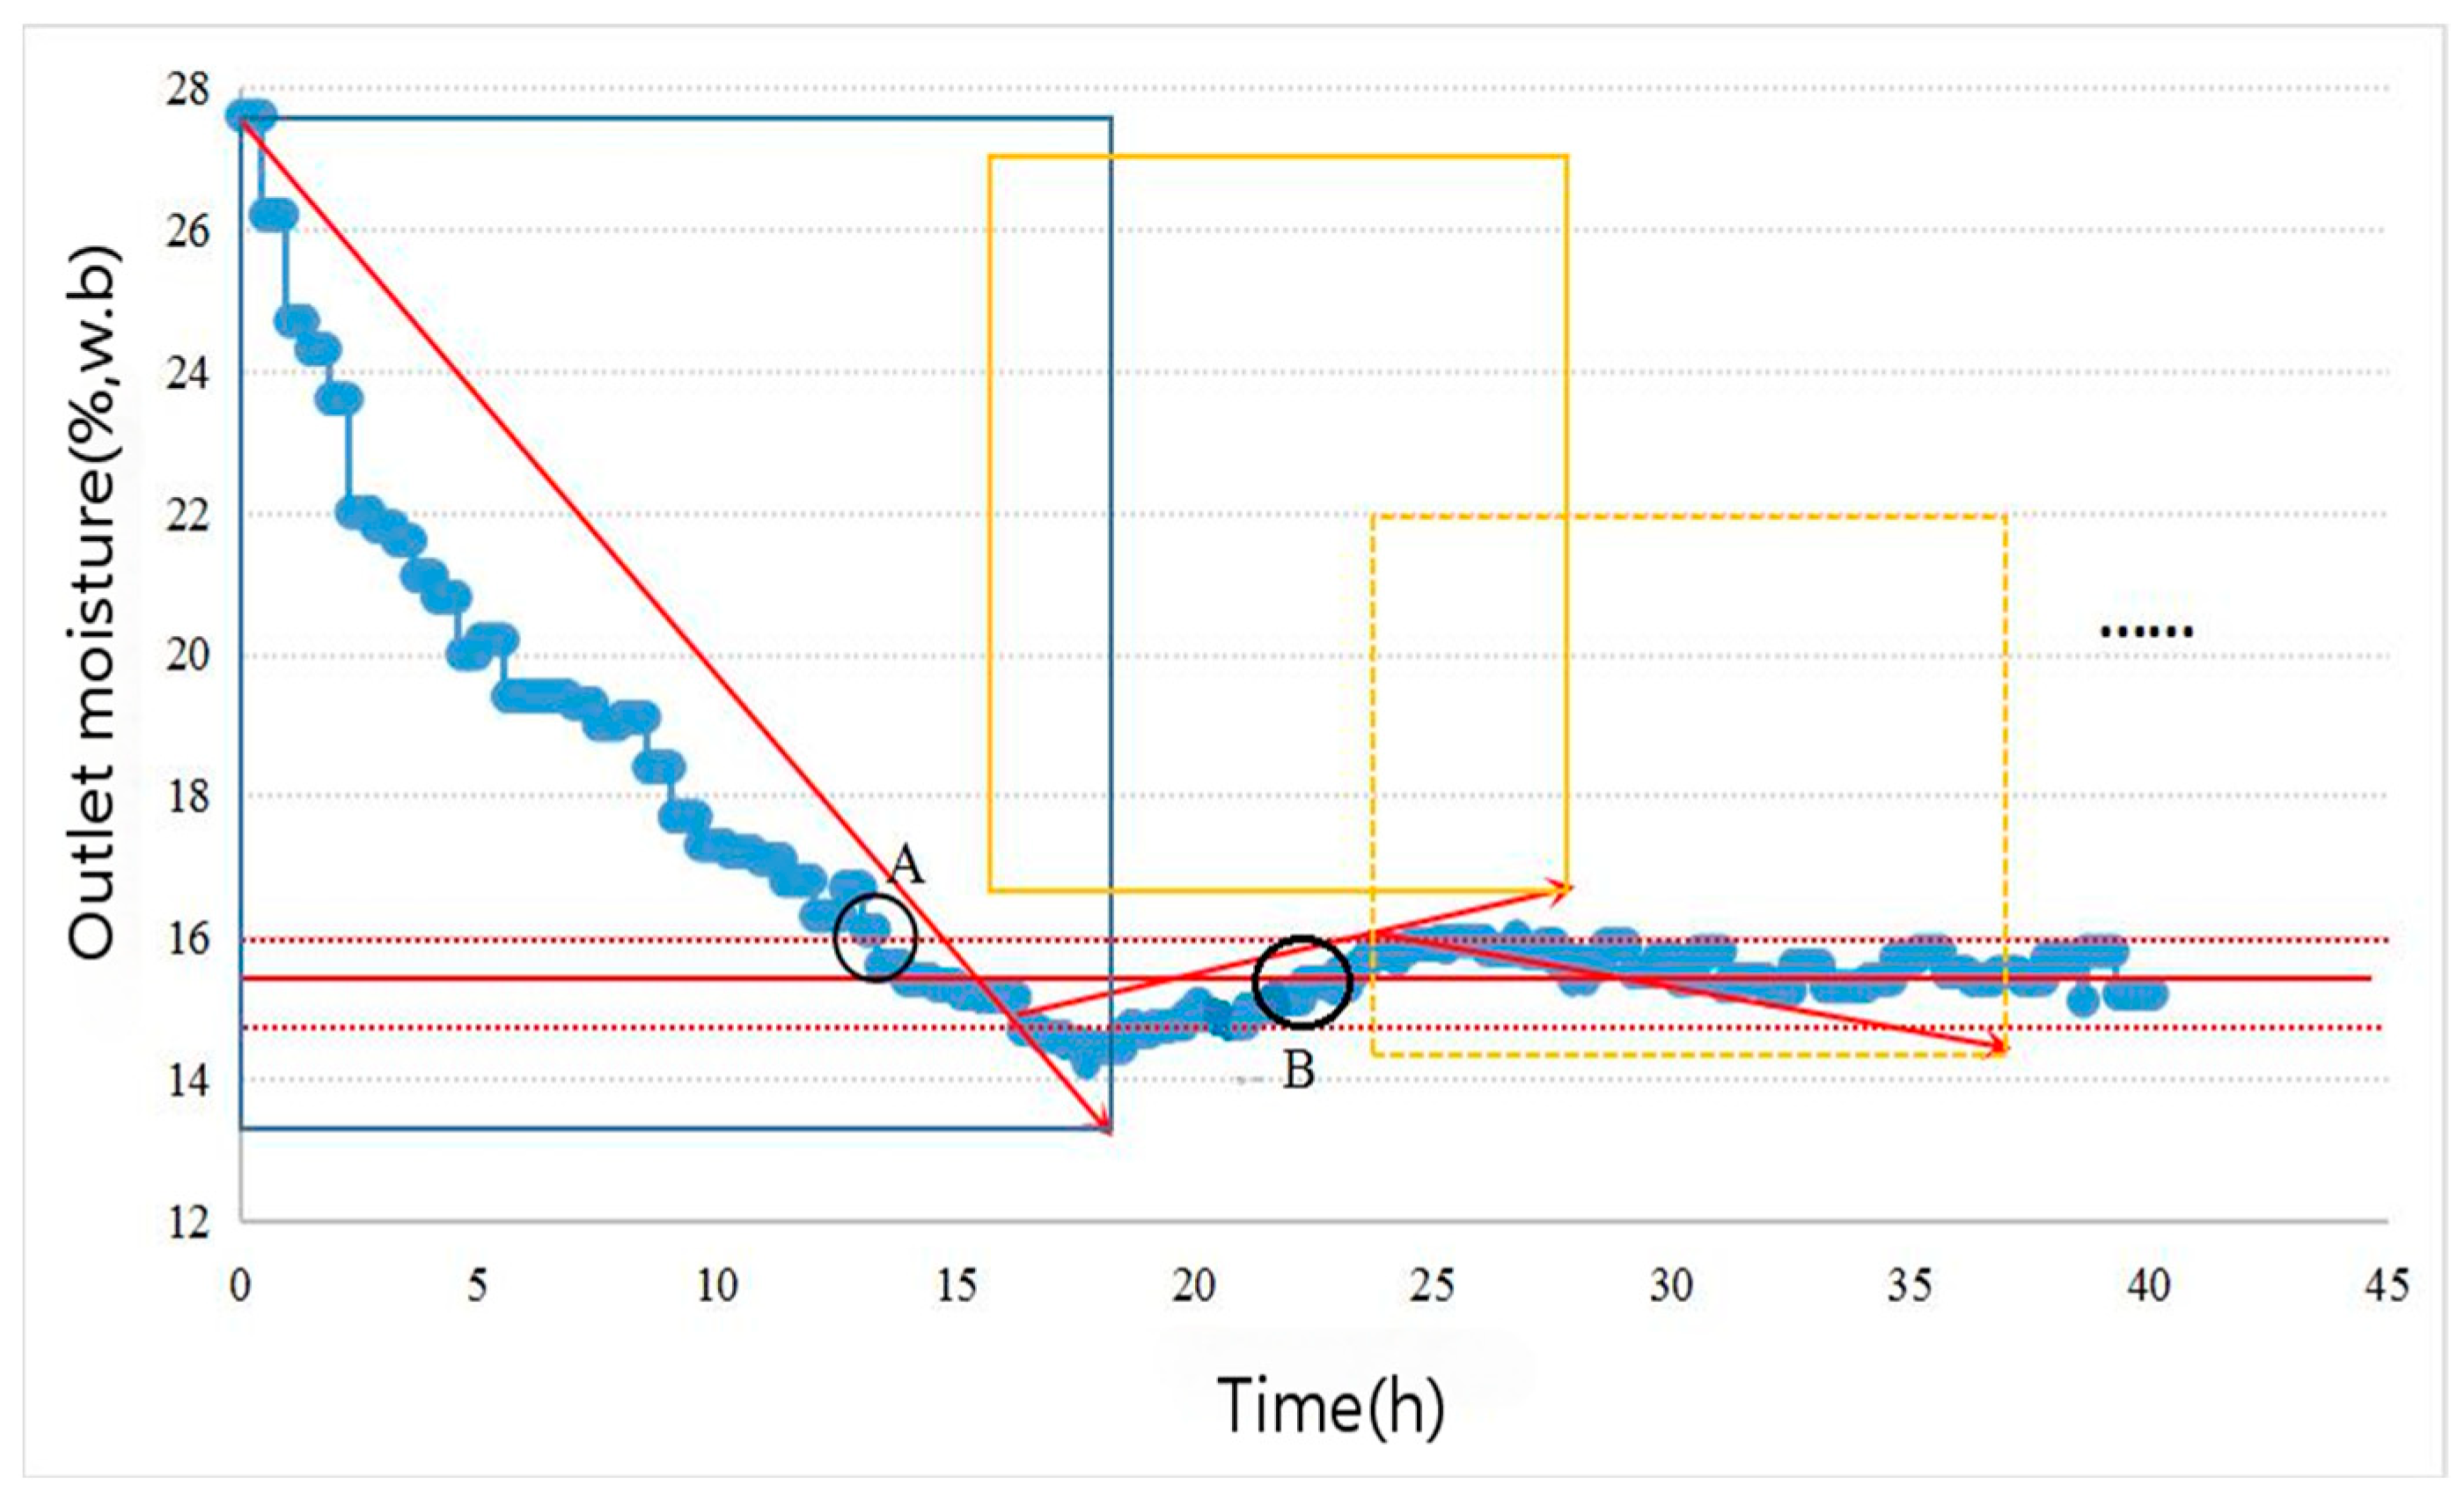
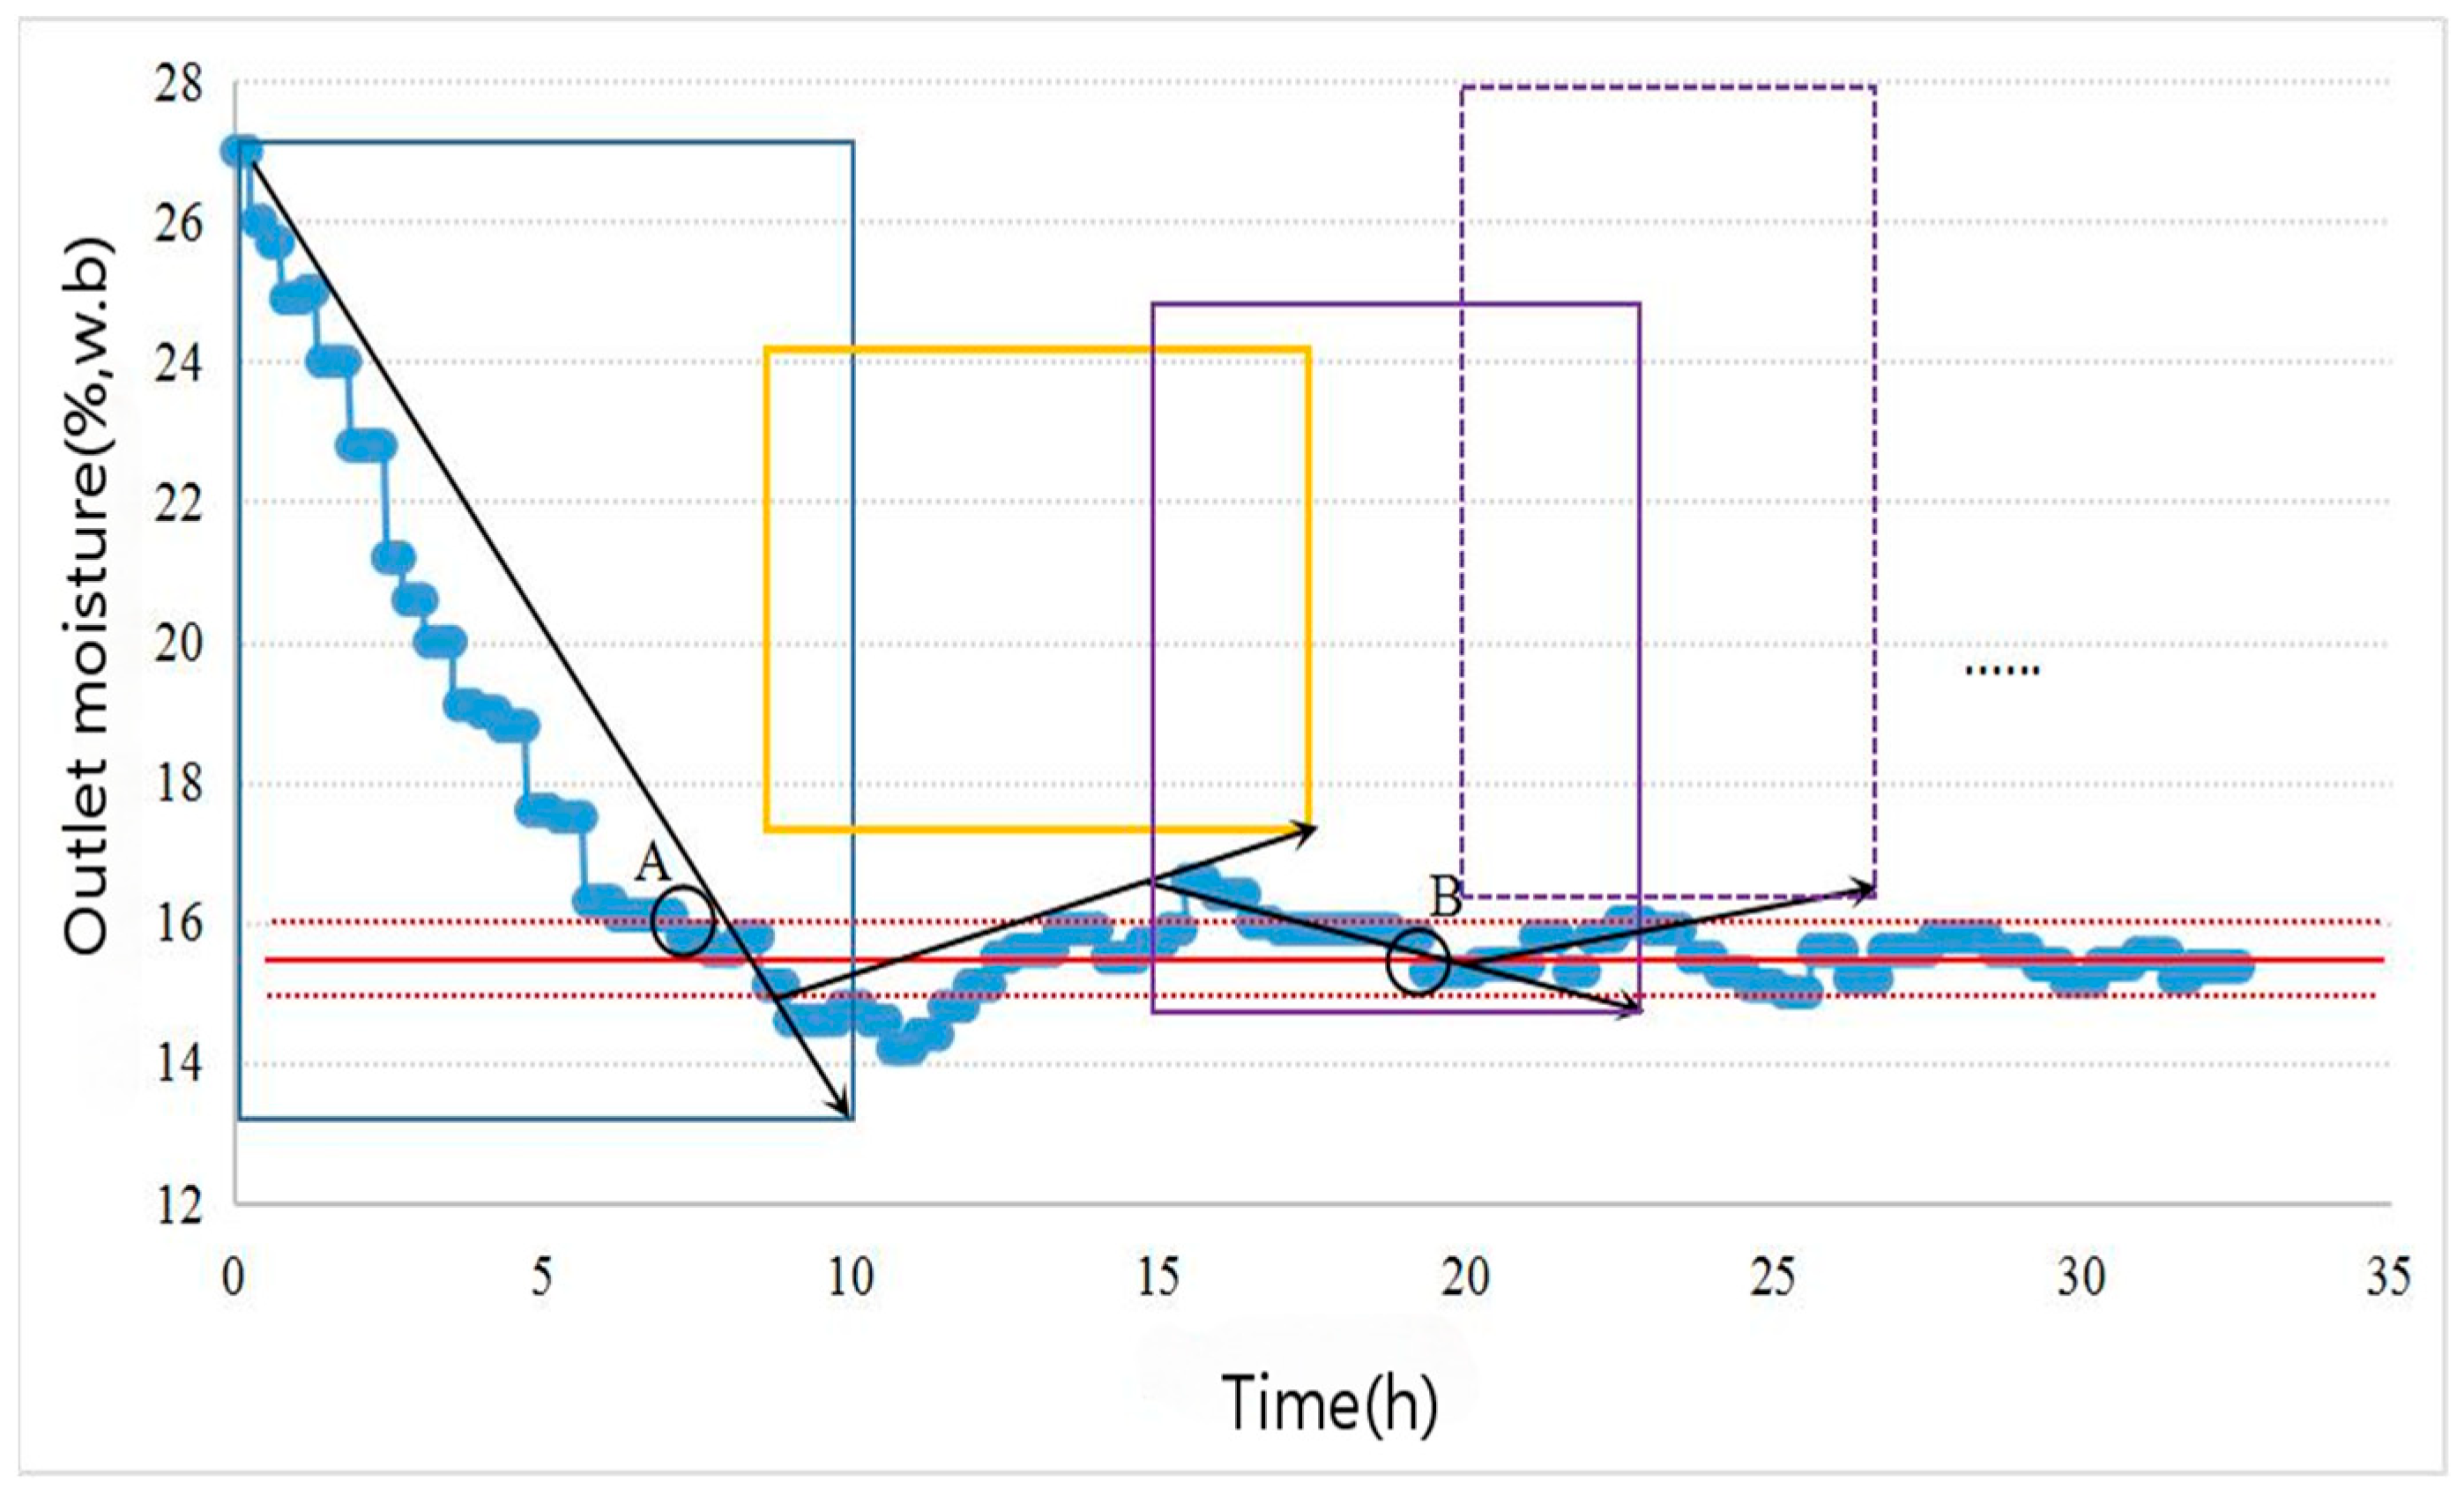
The outlet moisture variation curves for experiments 1, 2, and 3 are shown in Figure 6, Figure 7 and Figure 8, respectively.
Figure 6.
Outlet moisture variation curve for experiment 1. Blue curve, actual outlet moisture; red horizontal solid line, target outlet moisture (15.50%); two red dotted lines, system allowable error range (15.50 ± 0.50%); yellow window, water potential accumulation control window; solid-line window, window area changed compared with the previous; dashed-line window, aspect ratio adjusted while keeping the previous window area unchanged; point A, the first time the outlet moisture reached 15.50 ± 0.50%; point B, the first moment the outlet moisture reached 15.50 ± 0.50% after the system stabilized.
Figure 7.
Outlet moisture variation curve for experiment 2. Blue curve, actual outlet moisture; red horizontal solid line, target outlet moisture (15.50%); two red dotted lines, system allowable error range (15.50 ± 0.50%); yellow window, water potential accumulation control window; solid-line window, window area changed compared with the previous; dashed-line window, aspect ratio adjusted while keeping the previous window area unchanged; point A, the first time the outlet moisture reached 15.50 ± 0.50%; point B, the first moment the outlet moisture reached 15.50 ± 0.50% after the system stabilized.
Figure 8.
Outlet moisture variation curve for experiment 3. Blue curve, actual outlet moisture; red horizontal solid line, target outlet moisture (15.50%); two red dotted lines, system allowable error range (15.50 ± 0.50%); purple window, equivalent accumulated temperature window; solid-line window, window area changed compared with the previous; dashed-line window, aspect ratio adjusted while keeping the previous window area unchanged; point A, the first time the outlet moisture reached 15.50 ± 0.50%; point B, the first moment the outlet moisture reached 15.50 ± 0.50% after the system stabilized.
From the perspective of stability: In experiments 1, 2, and 3, the time to reach point A was 6.67 h, 13.33 h, and 6.33 h, respectively. The time to reach point B was 13.67 h, 21.67 h, and 19.00 h, respectively. The time interval from point A to point B was 7.00 h, 7.33 h, and 12.67 h, respectively. The constant temperature drying experiment reached the target value faster than the increasing temperature drying experiment (Figure 6 and Figure 7), and the adjustment time from the unsteady state (Point A) to the steady state (Point B) was essentially the same for both experiments. The time for the original method to reach the target value was similar to that of the water potential accumulation window method (Figure 6 and Figure 8), but the adjustment time from the unsteady state (Point A) to the steady state (Point B) was significantly longer than that of the drying process using water potential accumulation as the control window.
From the perspective of control accuracy: In experiments 1 and 2, the outlet moisture stabilized after two window area adjustments. After stabilization, the outlet moisture ranged from 15.08% to 15.86% and 15.30% to 15.91%, with average values of 15.37% and 15.53%, respectively. The control accuracy ranged from −0.42% to 0.36% and −0.2% to 0.41%, respectively. In experiment 3, the outlet moisture stabilized after three window area adjustments. After stabilization, the outlet moisture ranged from 15.10% to 15.95%, with an average value of 15.62%. The control accuracy ranged from −0.4% to 0.45%. The dual-driven mutual window AI control method achieved high control accuracy, and the outlet moisture after system stabilization all met the expected targets.
The Pearson correlation coefficients of the three experiments were 0.9074, 0.9060, and 0.8525, respectively, indicating a strong linear correlation between the target and actual outlet moisture curves. The Pearson correlation coefficients of experiments 1 and 2 were higher than that of experiment 3. Additionally, based on the number of window area adjustments before the outlet moisture stabilized, it could be concluded that using water potential accumulation as the control window yields better outlet moisture control accuracy and stability than using equivalent accumulated temperature.
3.2. Analysis and Comparison of Quality Indicators
After the outlet moisture content stabilized, approximately 300 g of grains was collected for quality indicator testing. Five samples were randomly selected, and each sample was measured three times to obtain an average value. The mean of five averaged values was used for comparison with raw grains. In Table 3, the drying quality of three experiments was compared and analyzed based on the change ratio of quality indicators, calculated as (value after drying − value before drying)/value before drying.
Table 3.
Results of grain quality indicators testing.
As shown in Table 3, the change ratios of the damage percentage were 2.48, 1.79, and 2.74, respectively. The change ratios of the germination percentage were −0.12, −0.05, and −0.13, respectively. The change ratios of the fatty acid value were 0.82, 0.46, and 1.01, respectively.
Comparing experiments 1 and 2, the grain quality achieved by the increasing temperature drying process was better than that of the constant temperature drying process, which was consistent with the findings of Zheng et al. []. In the initial stage of drying, the absolute water potential of grains is high, internal moisture and nutrients continuously migrate outward []. If the hot air temperature is too high, it may cause uneven moisture migration, leading to the destruction of internal cells and the loss of more nutrients and aromatic components []. In the later stage of drying, the desorption equilibrium temperature gradually increases. To reduce the difference between the moisture migration rate and evaporation rate, the temperature should be further increased and the humidity reduced, thereby accelerating the internal moisture migration rate and ensuring that grains remain in a desorption state [].
Comparing experiments 1 and 3, the absolute water potential accumulation of grains is significantly correlated with grain quality indicators. The grain drying quality achieved by the water potential accumulation control window was higher than that of the equivalent accumulated temperature control window. The drying rate has a significant impact on grain cracks after drying: the faster the drying rate in the early stage, the more cracked kernels are observed after drying []. Larger microscopic crack areas make grains more sensitive to moisture absorption, which is more likely to lead to quality deterioration.
3.3. Microscopic Structure Observation and Comparison
Raw grains, several grains from experiments 1, 2, and 3 were randomly selected and observed using scanning electron microscopy (SEM) at magnifications of 15×, 30×, and 500× []. The images are shown in Figure 9, Figure 10 and Figure 11, respectively.
Figure 9.
Image of the sample at 15× magnification.
Figure 10.
Image of the sample at 30× magnification.
Figure 11.
Image of the sample at 500× magnification.
In Figure 9, the outer surface of raw grains was tight and smooth. Grains from experiments 1 and 3 exhibited more transverse wrinkles than those from experiment 2. After grain drying, significant temperature differences existed between the interior and exterior, leading to rapid and uneven moisture loss. Differences in moisture migration rates across the pericarp, seed coat, and endosperm, along with variations in expansion and contraction rates, collectively resulted in the formation of transverse wrinkles on the surface, which was consistent with the observations of Huang et al. []. In experiment 2, due to the small temperature difference between the interior and exterior in the initial stage of drying, the moisture gradient inside grains was smaller than that in experiments 1 and 3, resulting in more uniform water loss and fewer transverse stripes on the surface [].
In Figure 10, stress cracks existed in all samples. Raw grains also exhibited stress cracks, which may be caused by high humidity in the field storage environment or other factors [,]. In the initial stage of drying, a larger the moisture gradient inside grains made them more prone to stress cracking. For samples from experiments 1 and 3, a large moisture gradient after heating. When the generated wet stress exceeded the internal tensile stress, stress cracks formed inside grains, which was consistent with the observations of Wei et al. []. These cracks appeared as prominent, relatively long grooves with bifurcations, radiating outward from the center of the endosperm with gradually narrowing widths [], but no macroscopic cracks were formed. Compared with raw grains, stress cracks in experiment 2 showed little change in width but an increase in length, and fewer stress cracks were observed compared with experiment 1. Thermal stress generated at high temperatures created a moisture gradient inside grains, leading to the formation of stress cracks [].
In Figure 11, the endosperm cells of raw grains were polyhedral with distinct edges and corners, and no microscopic cracks were formed between cells. The cellular structure remained intact, with starch granules arranged compactly. In experiment 2, a small number of microscopic cracks along the cell walls could be observed, but the internal cellular organization remained intact. In experiment 1, cracks could be observed at both the cellular and starch levels, penetrating the cell walls and extending along the surfaces of starch granules. Compared with experiment 2, these cracks were more extensive, with irregular and meandering paths and no uniform direction. The cracks in experiment 3 were similar to those in experiment 1, with a large number of cells showing incomplete overall morphologies, indicating that microscopic cracks at the starch level had completely breached the cell walls and radiated outward in all directions.
From the perspective of microscopic structure, the increasing temperature drying process showed the highest grain quality, which was consistent with the previous conclusions.
4. Discussion
This study proposed a dual-driven mutual window AI control method for continuous grain drying based on absolute water potential accumulation, which significantly improved the stability and accuracy of the drying system. Control accuracy is a core indicator for evaluating the reliability of drying control method, assessed by the fluctuation range of stabilized outlet moisture and the correlation between target and actual curves in this study. The dual-driven mutual window AI control method exhibited excellent accuracy: after stabilization, the outlet moisture of the three experiments was within the target range, and the control accuracy fluctuation ranges were all within ±0.50%. Further analysis using the Pearson correlation coefficient showed that the water potential accumulation-based control strategy had a stronger correlation and more stable control effect. This is because the water potential accumulation can characterize the cumulative effect of moisture migration potential during the drying process [], avoiding “over-drying” or “under-drying” caused by the time lag of temperature-time integration in the equivalent accumulated temperature method. The results of grain quality indicators and microscopic structure analysis verified the quality superiority of the increasing temperature drying process with water potential accumulation controls. It could protect the integrity of cell and starch structures, thereby reducing nutrient loss and improving stability.
An evaluation system of “stability—accuracy—microstructure” was constructed, clarifying the mechanism by which the drying process affected grain quality from both macro and micro perspectives. The increasing temperature drying process effectively reduced grain cracks while ensuring drying efficiency, providing a technical basis for improving the quality of commercial grain drying and reducing post-harvest loss. In future research, the experimental scale can be further expanded to include more grain types to enhance the universality of the dual-driven mutual window control method. Additionally, the energy consumption of different processes was not quantified in this study, and the balance between quality improvement and energy saving needs to be analyzed.
5. Conclusions
This study proposed a dual-driven mutual window AI control method for continuous grain drying based on absolute water potential accumulation, which was applied and verified in the continuous grain drying process. Three sets of experiments (constant temperature drying, increasing temperature drying, and a control experiment) were conducted on a small-scale continuous grain dryer. The results showed that the outlet moisture control accuracy ranged from −0.42% to 0.36%, −0.2% to 0.41%, and −0.4% to 0.45%, respectively. Analysis of quality indicators and microscopic structure indicated that the increasing temperature drying experiment outperformed the other two experiments. A lower temperature in the initial stage of drying reduced the moisture gradient and prevented nutrient loss, while a higher temperature in the later stage of drying ensured that grains remained in a desorption state and reduced energy consumption. The increasing temperature drying process effectively reduced grain cracks while ensuring drying efficiency, thereby reducing post-harvest loss. Compared with the equivalent accumulated temperature window control method, the proposed method offered higher control accuracy and stability. By integrating coupled temperature and humidity parameters into the variables, the quality of dried grains was effectively guaranteed. This study provides a new approach for the intelligent control of grain drying and the improvement of post-harvest quality.
Author Contributions
Conceptualization, W.W.; methodology, Z.L.; software, F.H.; validation, Z.L. and X.J.; formal analysis, X.J.; investigation, J.C.; resources, Y.X.; data curation, X.J.; writing—original draft preparation, X.J.; writing—review and editing, and X.J.; visualization, F.H.; supervision, Y.X. All authors have read and agreed to the published version of the manuscript.
Funding
This work was supported by the Youth Science Fund for National Natural Science Foundation of China, grant number 32102034.
Institutional Review Board Statement
Not applicable.
Informed Consent Statement
Not applicable.
Data Availability Statement
The raw data supporting the conclusions of this article will be made available by the authors on request.
Acknowledgments
Thanks for the support of the Youth Science Fund for National Natural Science Foundation of China.
Conflicts of Interest
The authors declare no conflicts of interest.
References
- Bakker-Arkema, F.W.; Bickert, W.G.; Patterson, R.J. Simultaneous heat and mass transfer during the cooling of a deep bed of biological products under varying inlet conditions. J. Agric. Eng. Res. 1967, 12, 297–307. [Google Scholar] [CrossRef]
- Spencer, H.B. A mathematical simulation of grain drying. J. Agric. Eng. Res. 1969, 14, 226–235. [Google Scholar] [CrossRef]
- Sun, Y.; Pantelides, C.C.; Chalabi, Z.S. Mathematical modelling and simulation of near-ambient grain drying. Comput. Electron. Agric. 1995, 13, 243–271. [Google Scholar] [CrossRef]
- Srivastava, V.K.; John, J. Deep bed grain drying modelling. Energy Convers. Manag. 2002, 43, 1689–1708. [Google Scholar] [CrossRef]
- Setty, Y.P.; Murthy, J. Development of a model for drying of solids in a continuous fluidized bed dryer. Indian J. Chem. Technol. 2003, 10, 477–482. [Google Scholar]
- Liu, Q.; Bakker-Arkema, F.W. PH-Postharvest Technology: Automatic Control of Cross-flow Grain Dryers, Part 1: Development of a Process Model. J. Agric. Eng. Res. 2001, 80, 81–86. [Google Scholar] [CrossRef]
- Liu, Q.; Bakker-Arkema, F.W. PH-Postharvest Technology: Automatic Control of Cross-flow Grain Dryers, Part 2: Design of a Model-Predictive Controller. J. Agric. Eng. Res. 2001, 80, 173–181. [Google Scholar] [CrossRef]
- Liu, Q.; Bakker-Arkema, F.W. PH-Postharvest Technology: Automatic Control of Cross-flow Grain Dryers, Part 3: Field Testing of a Model-Predictive Controller. J. Agric. Eng. Res. 2001, 80, 245–250. [Google Scholar] [CrossRef]
- Liu, X.; Chen, X.; Wu, W.; Zhang, Y. Process control based on principal component analysis for maize drying. Food Control 2006, 17, 894–899. [Google Scholar] [CrossRef]
- Prakash, B.; Siebenmorgen, T.J. Single-parameter thin-layer drying equations for long-grain rice. Trans. ASABE 2018, 61, 733–742. [Google Scholar] [CrossRef]
- Forbes, J.F.; Jacobson, B.A. Model based control strategies for commercial grain drying systems. Can. J. Chem. Eng. 1984, 62, 773–779. [Google Scholar] [CrossRef]
- Nybrant, T.G. Modelling and adaptive-control of continuous grain driers. J. Agric. Eng. Res. 1989, 40, 165–173. [Google Scholar] [CrossRef]
- Whitfield, R.D. An unsteady-state simulation to study the control of concurrent and counter-flow dryers. J. Agric. Eng. Res. 2006, 32, 171–178. [Google Scholar]
- Atthajariyaku, S.; Leephakpreeda, T. Fluidized bed paddy drying in optimal conditions via adaptive fuzzy logic control. J. Food Eng. 2006, 75, 104–114. [Google Scholar] [CrossRef]
- Alvinika, Y.; Setyohadi, D.B.; Sulistyoningsih, M. IoT-Based Monitoring and Design of Automatic Fish Drying Equipment Using Fuzzy Logic. IOP Conf. Ser. Earth Environ. Sci. 2021, 704, 012042. [Google Scholar] [CrossRef]
- Soleiman, H.; Alex, M. An adaptive fuzzy logic controller for intelligent drying. Dry. Technol. 2023, 41, 1110–1132. [Google Scholar]
- Kang, C.; Zhang, G.; Zhang, Q.; Gang, M.; Guo, H.; Tong, Y.; Ran, L.; Li, X.; Cheng, Z. Control of multi-energy drying system: Optimal weighted combination prediction of moisture content and fuzzy compensation of wind speed. Therm. Sci. Eng. Prog. 2024, 50, 102503. [Google Scholar] [CrossRef]
- Dai, A.; Zhou, X.; Liu, X.; Liu, J.; Zhang, C. Model of Drying Process for Combined Side-heat Infrared Radiation and Convection Grain Dryer Based on BP Neural Network. Trans. Chin. Soc. Agric. Mach. 2017, 48, 351–360. [Google Scholar]
- Dai, A.; Zhou, X.; Dang, H.; Sun, M.; Wu, Z. Intelligent Modeling Method for a Combined Radiation-Convection Grain Dryer: A Support Vector Regression Algorithm Based on an Improved Particle Swarm Optimization Algorithm. IEEE Access 2018, 6, 14285–14297. [Google Scholar] [CrossRef]
- Dai, A.; Zhou, X.; Liu, X.; Liu, J.; Zhang, C. Intelligent control of a grain drying system using a GA-SVM-IMPC controller. Dry. Technol. 2018, 36, 1413–1435. [Google Scholar] [CrossRef]
- Simonic, M.; Fícko, M.; Klancnik, S. Predicting Corn Moisture Content in Continuous Drying Systems Using LSTM Neural Networks. Foods 2025, 14, 1051. [Google Scholar] [CrossRef]
- Zuo, Y.; Jibril, A.N.; Yan, J.; Xia, Y.; Liu, R.; Chen, K. Optimization of Online Moisture Prediction Model for Paddy in Low-Temperature Circulating Heat Pump Drying System with Artificial Neural Network. Sensors 2025, 25, 2308. [Google Scholar] [CrossRef]
- Jin, Y.; Xie, H.; Yin, J.; Zhang, Z. Research On Intelligent Control Method of Grain Drying Based On LSTM-MPC. Sci. Technol. Cereals Oils Foods 2023, 31, 25–34. [Google Scholar]
- Wu, Y. Study on Temperature-Accumulation Quality Properties of Grain with Measurement and Control Method in Drying Process. Ph.D. Thesis, Jilin University, Changchun, China, 2017. [Google Scholar]
- Liu, Z.; Wu, W.; Han, F.; Xu, Y.; Jin, Y.; Wu, Z. A Control Method for Continuous Grain Drying Based on Equivalent Accumulated Temperature Window. Chinese patent CN110347197A, 18 October 2019. [Google Scholar]
- Wu, W.; Liu, Z.; Han, F.; Zhang, Y.; Chen, J. Dual-Driven Mutual Window Control Method for Continuous Grain Drying Based on Equivalent Water Potential Accumulation. Chinese patent CN113778153A, 10 December 2021. [Google Scholar]
- Liu, Z.; Xu, Y.; Han, F.; Zhang, Y.; Wang, G.; Wu, Z.; Wu, W. Control Method for Continuous Grain Drying Based on Equivalent Accumulated Temperature Mechanism and Artificial Intelligence. Foods 2022, 11, 834. [Google Scholar] [CrossRef] [PubMed]
- Mujumdar, A.S. Editorial: The Making of the Handbook of Industrial Drying. Dry. Technol. 2014, 32, 627–628. [Google Scholar] [CrossRef]
- Wu, W.; Chen, J.; Cheng, R.; Jin, Y.; Wei, X.; Xiao, B.; Xu, Y. Coupling relationship between content of unsaturated fatty acid and drying system of corn grain after variable temperature and humidity drying. Trans. Chin. Soc. Agric. Eng. 2019, 35, 328–333. [Google Scholar]
- Che, G.; Wang, H.; Wan, L.; Wang, X.; Tang, H.; Zhang, C. Design and Test of Varying Temperature Mixing Device on Paddy Rice Drying. Trans. Chin. Soc. Agric. Mach. 2022, 53, 386–392. [Google Scholar]
- Wu, W. Study on Quality Control Principles and Methods of Drying Maize. Ph.D. Thesis, Jilin University, Changchun, China, 2002. [Google Scholar]
- Wu, W.; Chen, S.; Han, F.; Zhang, Y.; Zhang, Z.; Wu, Z. The Moisture Migration of Heat and Humidity Grain Bulk and Granary Aeration Management. J. Chin. Cereals Oils Assoc. 2017, 32, 100–107. [Google Scholar]
- Akaike, H. A new look at the statistical model identification. IEEE Trans. Autom. Control 1974, 19, 716–723. [Google Scholar] [CrossRef]
- Sugiura, N. Further analysts of the data by akaike’s information criterion and the finite corrections. Commun. Stat.-Theory Methods 1978, 7, 13–26. [Google Scholar] [CrossRef]
- Weakliem, D.L. A Critique of the Bayesian Information Criterion for Model Selection. Sociol. Methods Res. 1999, 27, 359–397. [Google Scholar] [CrossRef]
- Wang, S.; Liu, G.; Qi, Z. BIC Scoring Bayesian Network Model and Its Application. Comput. Eng. 2008, 34, 229–230. [Google Scholar]
- Jin, Y.; Wong, K.; Wu, Z.; Qi, D.; Wang, R.; Han, F.; Wu, W. Relationship between accumulated temperature and quality of paddy. Int. J. Food Prop. 2019, 22, 19–33. [Google Scholar] [CrossRef]
- Liu, Z.; Wu, W.; Shen, W.; Chen, Z.; Han, F.; Xu, Y.; Wu, Z. A Differential Capacitive Moisture Detection Structure and Method Suitable for Bulk Material Flow. Chinese patent CN110779964A, 11 February 2020. [Google Scholar]
- GB 1350; Paddy. China Standards Press: Beijing, China, 2009.
- Ren, Q.; Jiang, P.; Zhang, L.; Li, X. Biochemical method for evaluation of grain damage with fast green FCF dye. Sci. Technol. Food Ind. 2016, 3, 49–53. [Google Scholar]
- Li, S.; Yuan, M.; Ren, Y.; Yu, S. Rapid Method of Testing Germination Percentage in Peanut. J. Peanut Sci. 2004, 33, 30–32. [Google Scholar]
- Wang, Y. Discussion on influence factors on determination of corn fatty acid value. Cereal Food Ind. 2009, 16, 52–53. [Google Scholar]
- GB/T 5510; Inspection of grain and oils—Determination of fat acidity value of grain and oilseeds. China Standards Press: Beijing, China, 2011.
- Zheng, X.; Liu, H.; Shen, L.; Wang, J.; Wang, L.; Zhu, Y. Hot-air Drying Technology of Changing Temperature for Paddy Rice Based on Glass Transition Theory. Trans. Chin. Soc. Agric. Mach. 2020, 51, 331–340. [Google Scholar]
- Sarker, N.N.; Kunze, O.R.; Strouboulis, T. Strouboulis, Transient moisture gradients in rough rice mapped with finite element model and related to fissures after heated air drying. Trans. Am. Soc. Agric. Eng. 1996, 39, 625–631. [Google Scholar] [CrossRef]
- Huang, Y.; Wu, W.; Zhao, T.; Lu, M.; Wu, H.; Cao, D. Drying temperature regulates vigor of high moisture rice seeds via involvement in phytohormone, ROS, and relevant gene expression. J. Sci. Food Agric. 2021, 101, 2143–2155. [Google Scholar] [CrossRef]
- Craufurd, R.Q. Sorption and desorption in raw and parboiled paddy. J. Sci. Food Agric. 1963, 14, 744–750. [Google Scholar] [CrossRef]
- Feng, S.; Tian, Y.; Cao, X.; Fang, K. Microstructure Analysis of Brown Rice Based on Mechanical Force Action. J. Henan Univ. Technol. 2019, 40, 70–74. [Google Scholar]
- Huang, B.; Chu, X.; Zhang, L.; Ge, Y.; Xue, X. Study on the Mechanism of Stress Cracks in Rice Drying Process. Agric. Sci. Technol. Equip. 2014, 6, 24–25. [Google Scholar]
- Zhou, X.; Cheng, J.; Zhang, Y.; Liu, N.; Li, Y. Research on stress crack changes of maize by hot-air and vacuum drying. J. Henan Univ. Technol. (Nat. Sci. Ed.) 2011, 32, 1–4+17. [Google Scholar]
- Lan, Y.; Kunze, O.R. Relative humidity effects on the development of fissures in rice. Cereal Chem. 1996, 73, 222–224. [Google Scholar]
- Shao, X.; Xu, W.; Wang, X.; Yang, X.; Shen, F.; Liu, Q. Fissure Development of Three Japonica Rice Grain during Water Desorption. Sci. Agric. Sin. 2022, 55, 390–402. [Google Scholar]
- Wei, S.; Chen, P.; Xie, W.; Wang, F.; Yang, D. Prediction of stress cracks in corn kernels drying based on three-dimensional heat and mass transfer. Trans. Chin. Soc. Agric. Eng. 2019, 35, 296–304. [Google Scholar]
- Li, D.; Mao, Z. Microscopic structure of rough rice after sun drying. Trans. Chin. Soc. Agric. Eng. 2003, 19, 156–159. [Google Scholar]
- Perez, J.H.; Tanaka, F.; Uchino, T. Modeling of mass transfer and initiation of hygroscopically induced cracks in rice grains in a thermally controlled soaking condition: With dependency of diffusion coefficient to moisture content and temperature—A 3D finite element approach. J. Food Eng. 2012, 111, 519–627. [Google Scholar] [CrossRef]
Disclaimer/Publisher’s Note: The statements, opinions and data contained in all publications are solely those of the individual author(s) and contributor(s) and not of MDPI and/or the editor(s). MDPI and/or the editor(s) disclaim responsibility for any injury to people or property resulting from any ideas, methods, instructions or products referred to in the content. |
© 2025 by the authors. Licensee MDPI, Basel, Switzerland. This article is an open access article distributed under the terms and conditions of the Creative Commons Attribution (CC BY) license (https://creativecommons.org/licenses/by/4.0/).