Abstract
Background: Dry eye disease (DED), characterized by tear film hyperosmolarity, can lead to corneal epithelial damage. The mechanisms linking hyperosmotic stress to human corneal epithelial cell (HCEPC) damage are not fully understood. Methods: A DED model was established by exposing HCEPCs to sustained hyperosmotic stress (400 mOsm/L) over multiple passages in vitro. Senescence was assessed using senescence-associated-β-galactosidase (SA-β-gal) staining, 5-ethynyl-2′-deoxyuridine (EdU) assays, p16INK4A and senescence-associated secretory phenotypes (SASP) analysis. Mechanisms were investigated by measuring reactive oxygen species (ROS), mitochondrial function, energy metabolism, DNA damage, and inflammatory signaling. The role of autophagy was probed pharmacologically. Results: Hyperosmotic stress induced HCEPC senescence, driven by mitochondrial dysfunction, oxidative stress, DNA damage, bioenergetic crisis, and compromised autophagy (especially mitophagy). Autophagy and mitophagy play a key role in regulating senescence progression. Enhancing autophagy with LYN-1604 ameliorated oxidative stress, improved energy homeostasis, and attenuated senescence. Inhibiting autophagy exacerbated these states. Conclusion: Hyperosmolarity promotes HCEPC senescence via mitochondrial dysfunction and oxidative damage. Autophagy serves a critical protective role, and its enhancement represents a promising therapeutic strategy for DED.
1. Introduction
Dry eye disease (DED) is a multifactorial chronic inflammatory condition and one of the most prevalent ocular disorders worldwide [1]. It is characterized by loss of tear film homeostasis, accompanied by ocular symptoms such as tear fluid hyperosmolarity, ocular surface inflammation and damage, and neurosensory abnormalities [2]. Mild cases may cause dryness, prickling, and blurred vision, while severe cases can lead to corneal perforation resulting in blindness eventually [3]. Numerous risk factors contribute to DED, including autoimmune diseases, endocrine dysfunction, ocular infections, environmental insults, postoperative complications, and medication side effects [4]. Current global prevalence rates range between 5.5% and 33.7% [5], with estimated rates of 21–30% in China [6]—numbers that continue to rise due to increased screen time, environmental pollution, and an aging population [7]. DED has become the most frequently occurring ocular disease, increasingly affecting younger demographics, posing a substantial threat to public visual health and quality of life [8]. There is thus an urgent need to elucidate the pathogenic mechanisms of DED to establish a theoretical foundation for its prevention and treatment.
DED is primarily classified into two subtypes, aqueous-deficient and evaporative, with the latter accounting for over 80% of cases, which result in hyperosmolarity in the tear, the main characteristic of DED [9]. Under physiological conditions, tear osmolarity is approximately 312 mOsm/L [10]. In DED patients, however, it can rise as high as 360–424 mOsm/L [11,12]. Current research indicates that excessive reactive oxygen species (ROS) production induced by hyperosmotic stress is a central mechanism underlying corneal damage in DED [13]. Elevated ROS levels cause oxidative stress, which is heavily implicated in disease progression. Under normal conditions, endogenous antioxidant systems maintain ROS below pathological thresholds [14]. An imbalance between ROS generation and antioxidant capacity leads to oxidative stress, inflammation, tear film instability, and reduced tear secretion [13,15]. Additionally, mitochondrial oxidative damage is closely associated with lacrimal gland dysfunction: ROS accumulation within mitochondria promotes carbonylated protein aggregation in glandular tissues, triggering inflammation and fibrosis around acinar cells and ultimately contributing to DED [16]. A study by Deng et al. [17] utilizing hyperosmotic culture media to simulate elevated tear fluid osmolarity has demonstrated that such conditions induce oxidative damage in human corneal epithelial cells (HCEPC) in vitro. This is characterized by increased generation of ROS and a disruption in the balance between pro-oxidant and antioxidant enzymes, ultimately leading to mitochondrial DNA damage and peroxidation of cell membrane lipids [17].
In general, hyperosmotic stress in DED elevates intracellular levels of ROS. Our previous work has demonstrated that sustained oxidative stress can trigger cellular senescence [18,19]. However, the precise mechanisms underlying DED-induced corneal damage and its impact on cell fate decisions remain incompletely understood. Therefore, this study aims to elucidate the pathogenic mechanisms and molecular basis of DED, as well as to strategically target its key regulatory hubs, which could pave the way for novel therapeutic interventions.
2. Materials and Methods
2.1. HCEP Cell Culture and Experimental Design
As previously described [20,21], HCEPCs at passage 53 for initiating experiments, derived from a continuous non-transfected HCEP cell line established in our laboratory [22], were cultured in Dulbecco’s Modified Eagle Medium (DMEM)-F12 medium (10-092-CVR, Corning, Corning, NY, USA) supplemented with 10% (v/v) fetal bovine serum (FBS; 10100147, Gibco, Grand Island, NY,, USA) and maintained in a humidified incubator at 37 °C with 5% CO2.
The experiment was designed as follows: (i) hyperosmotic medium (400 mOsm/L) was prepared by supplementing DMEM-F12 culture (312 mOsm/L) with an additional 2.92 g/L of NaCl, and its osmolarity was measured and confirmed using a molarity os-mometer (SMC 30DS, Tianhe, Tianjin, China); (ii) the HCEPCs from a the non-transfected HCEP cell line were trypsinized, resuspended in hyperosmotic medium, seeded into cell culture plates or flasks, collected as the cell confluent monolayer formed and divided into 2 parts: one was cultured in the normal 10% FBS-DMEM/F12 for 24 h allowing stress re-covery before senescence assessment and designated as the first hyperosmotic passage (hs-P1), the other was cultured in the hyperosmotic media for successive induction of se-nescence as hs-P2 or hs-P3; (iii) to explore the role of autophagy in modulating HCEPC senescence, we prepared the autophagy inhibitor SBI-0206965 (5 μM; HY-16966, Med-Chemexpress, Monmouth Junction, NJ, USA) [23] or activator LYN-1604 (2 μM; HY-101923 MedChemexpress, NJ, USA) [24]; (iv) the inhibitor or activator was applied simultaneously with hyperos-motic stress induction and maintained continuously throughout the experimental dura-tion, generating treatment groups designated as hs + SBI-0206965 and hs + LYN-1604; (v) correspondingly, the HCEPCs cultured in the DMEM-F12 without hyperosmotic stress was used as the control group (Ctrl).
2.2. Microscopy Observation
HCEPCs were cultured before a confluent monolayer was achieved under standard conditions (37 °C, 5% CO2). The duration of cell growth was recorded, and cellular morphology was observed using an inverted microscope (TS100, Nikon, Tokyo, Japan). Three 100× fields of view were randomly selected for photography from each cell sample. The area of each cell within these fields was measured using the “area measurement” function of the ImageJ software (Version 1.53 k, NIH, Bethesda, MD, USA).
2.3. Senescence-Associated-β-Galactosidase (SA-β-Gal) Detection
HCEPCs were seeded into 24-well plates and cultured under standard conditions. Cellular senescence was assessed using an SA-β-gal staining kit (C0602, Beyotime, Shanghai, China) according to the manufacturer’s instructions. Stained cells were visualized under an inverted microscope (TS100, Nikon, Tokyo, Japan). Three 100× fields of view were randomly selected for photography from each cell sample. Positively stained cells (blue-stained) and total cell counts were systematically quantified using the “Multi-point Tool” in ImageJ software (Version 1.53 k, NIH, USA). The percentage of SA-β-gal-positive cells was calculated as follows:
SA-β-Gal+% = (Number of SA-β-Gal-positive cells/Total number of cells) × 100%
2.4. Cell Viability and Proliferation
Cell viability was evaluated using a Cell Counting Kit-8 (CCK-8; C0037, Beyotime, Shanghai, China) according to the manufacturer’s protocol. Absorbance was measured at 450 nm using a microplate reader (Multiskan GO, Thermo Fisher, Waltham, MA, USA), and viability was normalized to that of untreated controls. The CCK-8 assay measures mitochondrial dehydrogenase activity and reflects overall metabolic capacity to evaluate the gradual loss of metabolic activity and reduction in cell viability under sustained hyperosmotic stress.
Cell proliferation was assessed using an 5-ethynyl-2′-deoxyuridine (EdU) staining kit (C0071S; Beyotime, Shanghai, China). As per the manufacturer’s instructions, cell nuclei were counterstained with Hoechst 33342 provided in the kit to define cell presence. Three random fields per sample were captured using a 200× fluorescence microscope (E80i, Nikon, Tokyo, Japan). Image processing was performed using ImageJ software (Version 1.53 k, NIH, USA) through the following standardized protocol: first, the “Threshold” function was applied to convert fluorescent images into binary black-and-white images based on automated pixel intensity threshold; subsequently, the “Analyze Particles” module was employed to objectively quantify both EdU-positive cells and total cell counts per field. The percentage of EdU-positive cells was then calculated accordingly. The percentage of EdU-positive cells was calculated as:
EdU+% = (Number of EdU-positive cells/Total number of cells) × 100%.
2.5. Immunofluorescence Staining
The cells were fixed with 4% paraformaldehyde (P1110, Solarbio, Beijing, China) for 15 min and permeabilized with 0.5% Triton X-100 (T8200, Solarbio, Beijing, China) in phosphate-buffered saline (PBS) for 10 min at 25 °C. After blocking with 2% bovine serum albumin (BSA; BS114, Biosharp, Hefei, China) for 30 min, the samples were incubated with primary antibodies for 2 h at room temperature, followed by three washes with PBS. Subsequently, the samples were incubated with appropriate secondary antibodies for 1 h at room temperature. Nuclei were stained with 4′,6-diamidino-2-phenylindole (DAPI; C1006, Beyotime, Shanghai, China), and after thorough washing with PBS. The primary antibodiy of γ-H2AX (1:500; ab303656) was purchased from Abcam (Cambridge, UK). The secondary antibodiy, Alexa Fluor 488 AffiniPure goat anti-rabbit (1:500; RGAR002), was purchased from Proteintech Biotechnology (Chicago, IL, USA). Images of three random fields per sample were captured at 200× magnification using a fluorescence microscope (E80i, Nikon, Tokyo, Japan). Image processing was performed using ImageJ software (Version 1.53 k, NIH, USA) through the following standardized protocol: first, the “Threshold” function was applied to convert fluorescent images into binary black-and-white images based on automated pixel intensity threshold; subsequently, the “Analyze Particles” module was employed to objectively quantify both γ-H2AX -positive cells and total cell counts per field. The percentage of γ-H2AX -positive cells was then calculated accordingly. The percentage of γ-H2AX -positive cells was calculated as:
γ-H2AX+% = (Number of γ-H2AX-positive cells/Total number of cells) × 100%.
2.6. Western Blot
Total cellular proteins were extracted using radio-immunoprecipitation assay lysis buffer (RIPA) lysis buffer (R493085-01, Aladdin, Shanghai, China) containing protease (ST505, Beyotime, Shanghai, China) and phosphatase inhibitors (P885775, Macklin, Shanghai, China). The proteins were separated by sodium dodecyl sulfate-polyacrylamide gel electrophoresis (SDS-PAGE) and transferred onto polyvinylidene difluoride (PVDF) membranes (IPVH00010, Millipore, Bedford, MA, USA). The membranes were blocked with 5% skim milk (D8340, Solarbio, Beijing, China) and then incubated with primary antibodies overnight at 4 °C. After washing with phosphate-buffered saline with Tween 20 (PBST), the membranes were incubated with secondary antibodies for 2 h. Protein bands were visualized using an enhanced chemiluminescence (ECL) substrate kit (SQ201, Epizyme, Shanghai, China) and imaged with an Imaging System (Tannon, Beijing, China). The band optic intensities were quantified using ImageJ software. The primary antibodies were purchased from Proteintech Biotechnology (Chicago, IL, USA) as follows: p16-INK4A (1:1000; 10883-1-AP), p21 (1:1000, 10355-1-AP), nuclear factor kappa-light-chain-enhancer of activated B cells (NF-κB; 1:1000; 66535-1-Ig); cyclic GMP-AMP synthase (cGAS, 1:1000; 68640-1-Ig), stimulator of interferon genes (STING; 1:20,000; 19851-1-AP), phosphorylated adenosine monophosphate-activated protein kinase (p-AMPK; 1:100; 80209-6-RR), AMPK (1:2000; 10929-2-AP), mammalian target of rapamycin complex (mTOR; 1:5000; 66888-1-Ig), silent information regulator factor 2-related enzyme 1 (Sirt1; 1:1000; 13161-1-AP), nicotinamide phosphoribosyl transferase (NAMPT; 1:2000; 11776-1-AP), protein kinase R like endoplasmic reticulum kinase (PERK; 1:500; 24390-1-AP), p-PERK (1:500; 29546-1-AP), activating transcription factor 4 (ATF4; 1:500; 10835-1-AP), microtubule-associated protein 1 light chain 3 (LC3; 1:2000; 14600-1-AP), p62 (1:5000; 18420-1-AP), Unc-51 like autophagy activating kinase 1 (ULK1; 1:500; 20986-1-AP), PTEN-induced kinase 1 (PINK; 1:1000; 23274-1-AP), Nip3-like protein X (NIX; 1:500; 12986-1-AP), glyceraldehyde-3-phosphate dehydrogenase (GAPDH; 1:20,000; 60004-1-Ig), and β-actin (1:20,000; 66009-1-Ig). The secondary antibodies, HRP-Goat Anti-Rabbit (1:10,000; RGAR001) and HRP-Goat Anti-Mouse (1:10,000; RGAM001), were purchased from Proteintech Biotechnology (Chicago, IL, USA).
2.7. Enzyme-Linked Immunosorbent Assay (ELISA)
We employed the commercial ELISA kits for Interleukin (IL)-1β (JL13662, Jonlnbio, Shanghai, China), IL-6 (JL14113, Jonlnbio, Shanghai, China), and IL-8 (JL19291, Jonlnbio, Shanghai, China) measuring the IL-1β/6/8 levels in the cell culture supernatants according to the manufacturer’s instructions to evaluate changes in senescence-associated secretory phenotypes (SASP) secretion.
2.8. ROS Determination
The ROS were determined by incubating the HCEPCs with 10 μM DCFH-DA (in DMEM/F12; S0033S, Beyotime, Shanghai, China) for 40 min according to the manufacturer’s protocol. Three randomly selected fields of each sample were observed and imaged under a 200× fluorescence microscope (E80i, Nikon, Tokyo, Japan). The captured images were then converted into thresholded binary images by automatically setting the pixel intensity threshold with the “Threshold” function in ImageJ software (Version 1.53 k, NIH, USA). The mean fluorescence intensity of each image was subsequently measured using the “Measurement” tool.
2.9. JC-1 Staining
Mitochondrial membrane potential was assessed using the JC-1 mitochondrial membrane potential assay kit (C2003S, Beyotime, Shanghai, China) according to the manufacturer’s protocol. Fluorescence signals were detected using a fluorescence plate reader (Infinite M200Pro, TECAN, Männedorf, Switzerland). The mitochondrial membrane potential was expressed as the ratio of aggregated JC-1 (excitation/emission = 580/590 nm) to monomeric JC-1 (excitation/emission = 514/529 nm). Simultaneously, fluorescence micrographs of both the red channel (aggregated JC-1) and green channel (monomeric JC-1) were acquired from three random fields of view per cell sample using a 200× fluorescence microscope (E80i, Nikon, Tokyo, Japan) to visually assess the mitochondrial activity.
2.10. ADP/ATP Ratio Assay
The ADP/ATP ratio was evaluated using a commercial ADP/ATP ratio assay kit (MAK135, Sigma-Aldrich, St. Louis, MO, USA) following the manufacturer’s instructions and measured with a fluorescence plate reader (Infinite M200Pro, TECAN, Männedorf, Switzerland).
2.11. Nicotinamide Adenine Dinucleotide (NAD+) Level and NAD+/NADH Ratio Assay
Intracellular NAD+ concentration and the NAD+/NADH ratio were measured using an NAD+/NADH assay kit (S0175, Beyotime, Shanghai, China) with a microplate reader (Multiskan GO, Thermo Fisher, MA, USA), in accordance with the manufacturer’s standard protocol.
2.12. Glucose Uptake, Consumption and Lactic Acid Excretion
Glucose uptake tests were conducted and measured using a 2-NBDG fluorescence assay (HY-116215, MedChemexpress, NJ, USA) according to previous reports [25]. The glucose consumption experiment was conducted according to previous methods [26] and measured using a glucose consumption detection kit (S0201S, Beyotime, Shanghai, China). The lactate release experiment was conducted according to previous methods [27] and lactate was detected using an Assay Kit (ab65330, Abcam, Cambridge, UK).
2.13. Real-Time Reverse Transcription Polymerase Chain Reaction (RT-qPCR)
Total RNA was extracted from HCEPCs using a total RNA extraction kit (DP419, Tiangen, Beijing, China). RT-qPCR was subsequently performed using the One Step RT-PCR Kit (RR066A, Takara, Shiga, Japan) on a Roche Light Cycler 480 Real-Time PCR System (Roche, Basel, Switzerland), in accordance with the manufacturers’ standard protocols. The expression levels of the following autophagy-related genes were analyzed: Autophagy-related gene (ATG) 1 (NM_003565.4, forward: 5′-CCAGAGCAACATGATGGCG-3′, reverse: 5′-CCTTCCCGTCGTAGTGCTG-3′), ATG6 (NM_017749.3, forward: 5′-GGTGTCTCTCGCAGATTCATC-3′, reverse: 5′-TCAGTCTTCGGCTGAGGTTCT-3′), ATG7 (NM_001144912.2, forward: 5′-CAGTTTGCCCCTTTTAGTAGTGC-3′, reverse: 5′-CCAGCCGATACTCGTTCAGC-3′), and ATG12 (NM_004707.4, forward: 5′-TAGAGCGAACACGAACCATCC-3′, reverse: 5′-CACTGCCAAAACACTCATAGAGA-3′). β-actin (NM_001101.5, forward: 5′-GAAGGTGACAGCAGTCGGTT-3′, reverse: 5′-AGTGGGGTGGCTTTTAGGAT-3′) was used as an internal reference gene for normalization.
2.14. Monodansylcadaverine (MDC) Staining
Autophagic activity was evaluated using an MDC staining kit (G0170, Solarbio, Beijing, China) according to the manufacturer’s instructions. Three randomly selected fields of each sample were observed and imaged under a 200× fluorescence microscope (E80i, Nikon, Tokyo, Japan). The captured images were then converted into thresholded binary images by automatically setting the pixel intensity threshold with the “Threshold” function in ImageJ software (Version 1.53 k, NIH, USA). The mean fluorescence intensity of each image was subsequently measured using the “Measurement” tool.
2.15. Janus Green B Staining
To visualize mitochondria, HCEPCs were stained with Janus Green B solution (G1571, Solarbio, Beijing, China) for 10 min at 37 °C. After washing with Ringer’s solution, three random fields per cell sample were recorded at both 400× and 1000× magnifications. The mitochondrial granules within cells under the 1000× fields were quantified using the “Multi-point Tool” in ImageJ software (Version 1.53 k, NIH, USA).
2.16. Mitophagy Assay
Mitophagy was assessed by co-staining mitochondria, lysosomes, and autophagosomes using MitoTracker Green (C1048, Beyotime, Shanghai, China), LysoTracker Red (C1046, Beyotime, Shanghai, China), and MDC, respectively, following the manufacturers’ protocols. The co-localization in three randomly selected fields of view for each cell sample was observed and imaged under a 1000× confocal laser scanning microscope (TCS SP8, Leica, Veszprém, Germany). The positive spots within cells under the 1000× fields were quantified using the “Multi-point Tool” in ImageJ software (Version 1.53 k, NIH, USA).
2.17. Statistical Analysis
Data are expressed as mean ± standard error of the mean (SEM). The mean value of triplicate experiments was calculated. Statistical significance was analyzed using one-way analysis of variance, followed by Tukey’s post hoc test for multiple comparisons. p < 0.05 was considered statistically significant; p < 0.01 was considered highly statistically significant.
3. Results
3.1. Establishment of a Dry Eye Disease Cellular Model Using Hyperosmotic Stress-Treated HCEPCs and Induction of HCEPC Senescence
Establishment of a DED model in vitro was achieved by maintaining HCEPCs in 400 mOsm/L medium supplemented with NaCl over three consecutive passages to ensure sustained hyperosmotic stress. Preliminary observations revealed a progressive increase in cell surface area (Figure 1A,B), the time required to form confluent monolayers (Figure 1C), and the proportion of SA-β-gal-positive cells (Figure 1G,H) with successive passages under hyperosmotic conditions. Concurrently, a gradual decline in both proliferative capacity (Figure 1D,E) and cell viability (Figure 1F) was observed. These morphological and functional alterations collectively suggested the emergence of a senescent phenotype in HCEPCs under prolonged hyperosmotic exposure. To further corroborate cellular senescence, Western blot analysis was performed to assess the expression of the senescence-associated marker p16INK4A(Figure 1I) [28]. A consistent upregulation of p16INK4A protein levels was detected (Figure 1J), indicative of cell cycle arrest. In addition, the secretion of SASP factors [29], including IL-1β, IL-6, and IL-8, was found to increase progressively with successive passages in the hyperosmotic environment (Figure 1K–M). In summary, these results demonstrate that sustained exposure to 400 mOsm/L hyperosmotic stress effectively induces senescence in HCEPCs.
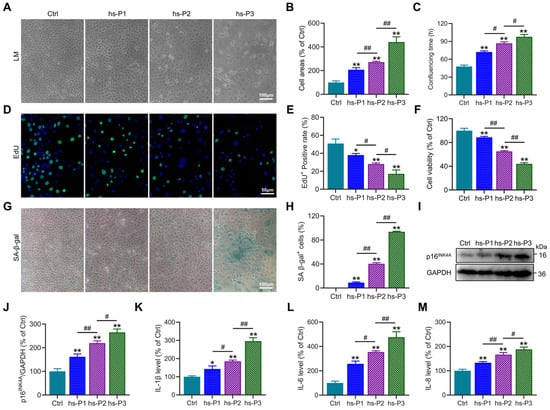
Figure 1.
Hyperosmotic stress (400 mOsm/L) induces cellular senescence in HCEPCs. (A) Light microscopic images of HCEPCs treated with 400 mOsm/L hypertonic culture medium from hs-P1 to hs-P3 compared to the Ctrl. (B) Statistical analysis of cell area in A. (C) Statistical analysis of confluencing time in HCEPCs from hs-P1 to hs-P3 compared to the Ctrl. (D,E) EdU staining images and statistical analysis in HCEPCs from hs-P1 to hs-P3 compared to the Ctrl. Representative micrographs display EdU-positive cells (green) and total cells (blue). (F) Analysis of cell viability in HCEPCs from hs-P1 to hs-P3 compared to the Ctrl. (G,H) SA-β-gal staining images and quantitative analysis in HCEPCs from hs-P1 to hs-P3 compared to the Ctrl. (I,J) Western blot images and optical density analysis of p16INK4A expression in HCEPCs from hs-P1 to hs-P3 compared to the Ctrl. (K–M) Secretion levels of IL-1β, IL-6, and IL-8 in HCEPCs from hs-P1 to hs-P3 compared to the Ctrl. hs-P denotes the number of successive passages under 400 mOsm/L hyperosmotic medium. Data are expressed as mean ± SEM (n = 3). * p < 0.05, ** p < 0.01 vs. blank controls (Ctrl), and # p < 0.01, ## p < 0.01 among different experimental groups.
3.2. Hyperosmotic Stress Mediates the Induction of Chromatin Damage and Subsequent Inflammatory Activation in HCEPCs
To further investigate the DNA damage effects of hyperosmotic stress on HCEPCs, immunofluorescence staining of the DNA damage marker γ-H2AX was performed, revealing a significant increase in the proportion of γ-H2AX-positive cells (Figure 2A,B). Concurrently, Western blot analysis showed a marked reduction in the expression of Lamin B1, a core component of the nuclear lamina, along with a gradual upregulation of p21 (Figure 2C–E). These findings indicate that hyperosmotic stress compromises nuclear envelope integrity and induces chromatin damage in HCEPCs, thereby initiating DNA damage response and upregulates p21, leading to cell cycle arrest and ultimately promoting cellular senescence. Further immunoblotting analyses showed that hyperosmotic exposure significantly upregulated the expression of key signaling molecules, including cGAS, STING, and NF-κB (Figure 2F–I), accompanied by markedly enhanced SASP factors secretion (Figure 1K–M). Taken together, these data suggest that hyperosmotic stress triggers nuclear damage in HCEPCs, leading to the leakage of DNA into the cytoplasm, which in turn activates the cGAS–STING–NF-κB signaling axis [30]. This cascade promotes inflammatory responses and SASP factors secretion, thereby creating a feed-forward loop that exacerbates cellular senescence [31].
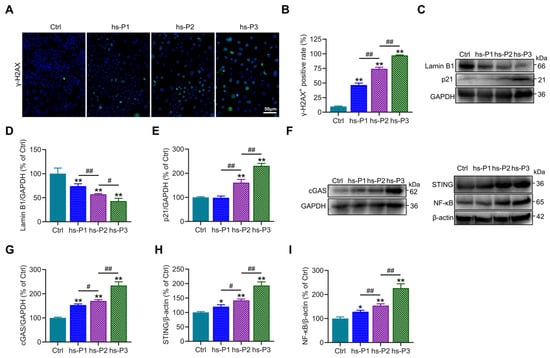
Figure 2.
Hyperosmotic stress induces DNA damage and inflammatory response in HCEPCs. (A,B) Immunofluorescence staining and statistical analysis of γ-H2AX in HCEPCs from hs-P1 to hs-P3 compared to the Ctrl. Representative micrographs display γ-H2AX-positive cells (green) and total cells (blue). (C–E) Western blot images and optical density analysis of Lamin B1 and p21 expression in HCEPCs from hs-P1 to hs-P3 compared to the Ctrl. (F–I) Western blot images and optical density analysis of cGAS, STING, and NF-κB expression in HCEPCs from hs-P1 to hs-P3 compared to the Ctrl. hs-P denotes the number of successive passages under 400 mOsm/L hyperosmotic medium. Data are expressed as mean ± SEM (n = 3). * p < 0.05, ** p < 0.01 vs. blank controls (Ctrl), and # p < 0.01, ## p < 0.01 among different experimental groups.
3.3. Hyperosmotic Stress Causes Oxidative Stress in HCEPCs, Leading to Energy Stress Response and Unfolded Protein Response (UPR)
To further investigate the mechanisms underlying hyperosmotic stress-induced senescence in HCEPCs, we first assessed ROS levels in HCEPCs subjected to hyperosmotic stress across hs-P1-3. Results demonstrated a significant, passage-dependent increase in ROS levels in hs-P1 to hs-P3 HCEPCs compared to Ctrl group (Figure 3A,B), suggesting that hyperosmotic stress-induced senescence may be associated with oxidative stress. To investigate the intracellular source of ROS, mitochondrial membrane potential (ΔΨm) was evaluated using JC-1 staining. This analysis revealed a progressive decline in ΔΨm with successive passages under hyperosmotic stress (Figure 3C and Figure S1), demonstrating that loss of ΔΨm and disruption of the electron transport chain constitute a significant source of elevated intracellular ROS. Mitochondrial dysfunction is frequently accompanied by impaired aerobic respiration and cellular energy deficits [32]. Consistent with this conjecture, we observed a progressive increase in the ADP/ATP ratio (Figure 3D) and a sustained decline in the NAD+/NADH ratio following an initial peak in hs-P1 (Figure 3E). Concomitant with rising ADP levels in hyperosmotic stress-treated HCEPCs, the expression of p-AMPK and total AMPK—key energy-sensing and metabolic regulatory kinases—was significantly elevated (Figure 3F,H,I). This was accompanied by a pronounced and sustained increase in cellular glucose uptake (Figure 3Q), glucose consumption (Figure 3R), and lactic acid production (Figure 3S). Furthermore, analysis of AMPK downstream effectors revealed that mTOR expression was significantly reduced in hs-P1 but subsequently increased (Figure 3J). Protein levels of Sirt1 and NAMPT (Figure 3K,L), along with cellular NAD+ levels (Figure 3P), peaked in hs-P1 and subsequently declined. In parallel, Western blot analysis showed that protein levels of PERK, p-PERK, and ATF4 were markedly increased in hs-P1 but progressively decreased thereafter (Figure 3G,M–O), indicating that heightened intracellular ROS triggered endoplasmic reticulum (ER) stress and the UPR [33]. Collectively, these findings outline a mechanistic cascade in which hyperosmotic stress triggers oxidative stress in HCEPCs, resulting in the decrease in mitochondrial membrane potential. This mitochondrial dysfunction further drives excessive production of ROS, thereby amplifying the initial oxidative stress. This, on one hand, disrupts cellular energy homeostasis, activating the AMPK/mTOR/NAMPT/Sirt1 signaling axis and triggering an energy stress response. On the other hand, it induces ER stress, activating the PERK/ATF4 signaling pathway and eliciting the UPR [34].
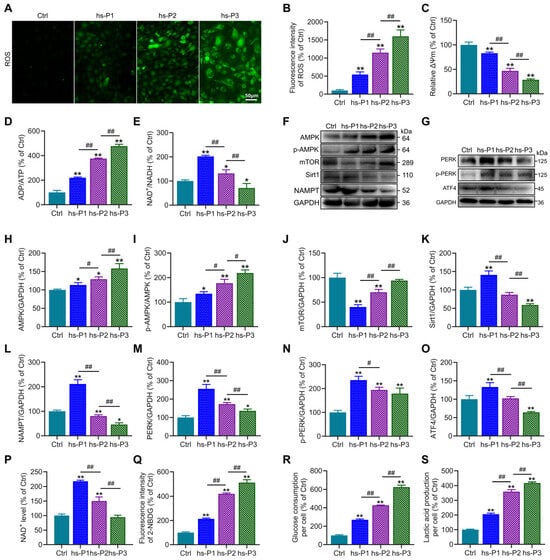
Figure 3.
Hyperosmotic stress triggers oxidative stress-mediated energy crisis and UPR in HCEPCs. (A) ROS staining in HCEPCs from hs-P1 to hs-P3. (B) Statistical analysis of ROS levels in A. (C) Statistical analysis of mitochondrial membrane potential. (D) ADP/ATP ratio in HCEPCs under hyperosmotic stress from hs-P1 to hs-P3. (E) NAD+/NADH ratio in HCEPCs under hyperosmotic stress from hs-P1 to hs-P3. (F) Western blot images of p-AMPK, AMPK, mTOR, Sirt1, and NAMPT expression in HCEPCs from hs-P1 to hs-P3. (G) Western blot images of PERK, p-PERK, and ATF4 in HCEPCs from hs-P1 to hs-P3. (H–L) Optical density analysis of p-AMPK, AMPK, mTOR, Sirt1, and NAMPT in (F). (M–O) Optical density analysis of PERK, p-PERK, and ATF4 in (G). (P) Statistical analysis of intracellular NAD+ levels in HCEPCs from hs-P1 to hs-P3. (Q) Statistical analysis of glucose uptake in HCEPCs from hs-P1 to hs-P3. (R) Statistical analysis of glucose consumption in HCEPCs from hs-P1 to hs-P3. (S) Statistical analysis of lactic acid production in HCEPCs from hs-P1 to hs-P3. hs-P denotes the number of successive passages under 400 mOsm/L hyperosmotic medium. Data are expressed as mean ± SEM (n = 3). * p < 0.05, ** p < 0.01 vs. blank controls (Ctrl), and # p < 0.01, ## p < 0.01 among different experimental groups.
3.4. Autophagy, Particularly Mitophagy, in HCEPCs Are Activated by Oxidative Stress-Induced Energy Stress Response and UPR
Autophagy, a conserved cellular self-degradative process, plays pivotal roles in maintaining energy homeostasis and clearing misfolded proteins, protein aggregates, and damaged organelles [35]. Our protein analyses revealed elevated expression of ATF4, a master transcriptional regulator of autophagy-related genes, in hyperosmotically stressed HCEPCs. To functionally validate ATF4’s role, we quantified mRNA levels of key ATGs (ATG1, ATG6, ATG7, ATG12) using RT-PCR. Consistent with ATF4 protein dynamics, the mRNA levels of these genes peaked at hs-P1 and progressively declined thereafter (Figure 4A–D). Concurrently, the AMPK/mTOR/NAMPT/Sirt1 signaling axis, known to regulate autophagy activation, was dynamically modulated. We next assessed autophagic flux using MDC staining to label autophagosomes. Autophagy was significantly activated upon hyperosmotic stress, reaching maximal levels at hs-P1 before declining with successive passages (Figure 4E,G). This activation profile was corroborated by concordant trends in the protein expression of autophagy markers ULK1, LC3 and p62 (Figure 4I,K–M). These findings indicate that the energy crisis response and UPR triggered by oxidative stress promote autophagy activation and related gene transcription, likely as an adaptive mechanism to alleviate energy deficits and clear misfolded proteins [36]. Given that excessive ROS generation—a major incentive of intracellular dyshomeostasis under hyperosmotic stress—primarily originates from damaged mitochondria, we investigated the role of mitophagy, the selective autophagic clearance of mitochondria. Western blot analysis revealed that protein levels of PINK1 (a key protein of ubiquitin-dependent mitophagy) and NIX (a key protein of ubiquitin-independent mitophagy) peaked at hs-P1 and subsequently declined (Figure 4J,N,Q). Notably, total mitochondrial mass, assessed by Janus green B staining, was highest at hs-P1 and then decreased (Figure 4F,H), aligning with changes in mitophagic activity. Based on this findings, we hypothesize that mitophagy may exert a regulatory influence on mitochondrial biogenesis [37]. We performed co-staining with MitoTracker Green (mitochondria) and LysoTracker Red (lysosomes) observing mitophagy directly in comparison with total autophagosomes (MDC) to calculate the mitophagic rate in total autophagy. Hyperosmotic stress significantly increased the number of MitoTracker Green/LysoTracker Red double-positive puncta (indicating mitolysosome formation), which peaked at hs-P1 and declined thereafter (Figure 4O,R). Furthermore, the proportion of mitophagy relative to total autophagy and the ratio of mitochondria undergoing mitophagy significantly increased with stress exposure (Figure 4P,S,T). Collectively, these results delineate a coordinated adaptive response: Oxidative stress, on one hand, activates the AMPK signaling pathway via the energy crisis response, promoting autophagosome biogenesis. On the other hand, it induces the UPR, activating the PERK/ATF4 signaling axis to enhance transcription of autophagy genes. This dual activation significantly elevates overall autophagy levels to counteract cellular dyshomeostasis. Critically, as damaged mitochondria are the primary source of ROS, mitophagy is robustly upregulated—particularly during early stress (hs-P1)—facilitating mitochondrial quality control and renewal. However, the relentless accumulation of ROS under sustained hyperosmotic stress ultimately overwhelms these protective mechanisms, precipitating irreversible cellular damage and senescence.
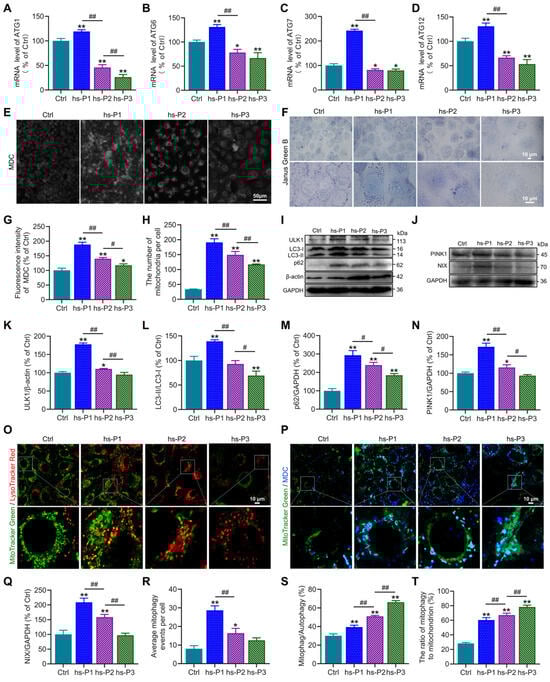
Figure 4.
Hyperosmotic stress activates autophagy and mitophagy in HCEPCs to counterbalance cellular homeostasis. (A–D) Detection and statistical analysis of mRNA expression levels of ATF4 target genes ATG1, ATG6, ATG7, and ATG12 in hypertonic-stressed HCEPCs. (E) Fluorescent images of MDC staining in hypertonic-stressed HCEPCs of different passages. (F) Images of Janus green B staining in hypertonic-stressed HCEPCs of different passages. (G) Statistical analysis of MDC staining in (G). (H) Statistical analysis of mitochondrial numbers in (F). (I) Western blot images of ULK1, LC3 and p62 in hypertonic-stressed HCEPCs of different passages. (J) Western blot images of PINK and NIX in hypertonic-stressed HCEPCs of different passages. (K–M) Optical density analysis of ULK1, LC3 and p62 immunoblots in (I). (N,Q) Optical density analysis of PINK and NIX immunoblots in (J). (O) Co-localization fluorescence images of MitoTracker Green/LysoTracker Red in hypertonic-stressed HCEPCs of different passages. Representative micrographs display mitochondria (green) and lysosomes (red). (P) Co-localization fluorescence images of MitoTracker Green/MDC in hypertonic-stressed HCEPCs of different passages. Representative micrographs display mitochondria (green) and autophagosomes (blue). (R) Statistical analysis of mitochondrial autophagy-positive points in (O). (S) Statistical analysis of the proportion of mitochondrial autophagy to total autophagy in (P). (T) Statistical analysis of the proportion of autophagic mitochondria to total mitochondria in (P). hs-P denotes the number of successive passages under 400 mOsm/L hyperosmotic medium. Data are expressed as mean ± SEM (n = 3). * p < 0.05, ** p < 0.01 vs. blank controls (Ctrl), and # p < 0.01, ## p < 0.01 among different experimental groups.
3.5. Activation of Autophagy Attenuates Oxidative Stress by Enhancing Mitophagy in Hyperosmotically Stressed HCEPCs
To further elucidate the functional role of autophagy in hyperosmotic stress-induced HCEPC senescence, we employed the autophagy inhibitor SBI-0206965 and activator LYN-1604 to modulate autophagic activity. MDC staining (Figure S2A and Figure 5A) confirmed that SBI-0206965 effectively suppressed, while LYN-1604 robustly enhanced, autophagic flux in stressed HCEPCs (compared to the hs group alone). Concomitantly, SBI-0206965 treatment significantly exacerbated intracellular ROS levels across passages P1–P3 under hyperosmotic stress. Conversely, LYN-1604 markedly attenuated oxidative stress in all passages examined (Figure S2B and Figure 5B). To determine whether altered autophagy influences ROS levels by modulating mitochondrial integrity, ΔΨm was assessed via JC-1 staining. Strikingly, autophagy inhibition further potentiated the loss of ΔΨm induced by hyperosmotic stress. In contrast, autophagy activation effectively preserved ΔΨm, indicating reduced mitochondrial damage (Figure 5C). Subsequently, we evaluated mitophagic activity using MitoTracker Green/LysoTracker Red (Figure S2C) and MitoTracker Green/MDC (Figure S2D) co-localization assays. SBI-0206965 significantly inhibits autophagy, most of which is mitophagy (Figure 5D) while concurrently increasing both the proportion of mitophagy relative to total autophagy (Figure 5E), and the fraction of mitochondria undergoing mitophagy (Figure 5F). Conversely, LYN-1604 significantly enhances autophagy, most of which is mitophagy, while reducing the aforementioned mitophagy proportions. Collectively, these results demonstrate that pharmacological activation of autophagy using LYN-1604 significantly enhances mitophagic flux in hyperosmotically stressed HCEPCs, thereby attenuating ROS generation and alleviating cellular oxidative burden. Conversely, autophagy inhibition synergistically with hyperosmotic stress exacerbated mitochondrial damage and intensified the cellular oxidative stress response.
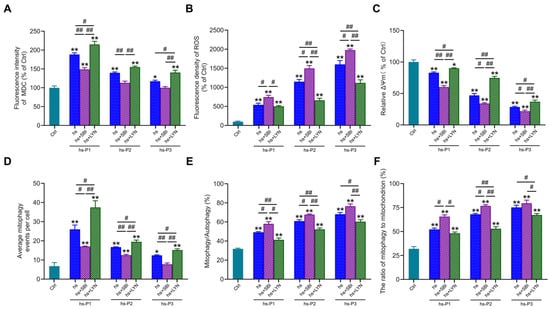
Figure 5.
Activation of autophagy in response to hyperosmotic stress enhances mitophagic activity and ameliorates oxidative stress in HCEPCs. (A) Statistical analysis of MDC staining in hyperosmotic-stressed HCEPCs after treatment with autophagy inhibitors/activators.in Figure S2A. (B) Statistical analysis of ROS levels in hyperosmotic-stressed HCEPCs after treatment with autophagy inhibitors/activators.in Figure S2B. (C) Statistical analysis of mitochondrial membrane potential in hyperosmotic-stressed HCEPCs after treatment with autophagy inhibitors/activators. (D) Statistical analysis of mitochondrial autophagy-positive points in hyperosmotic-stressed HCEPCs after treatment with autophagy inhibitors/activators in Figure S2C. (E) Statistical analysis of the proportion of mitochondrial autophagy to total autophagy in hyperosmotic-stressed HCEPCs after treatment with autophagy inhibitors/activators in Figure S2D. (F) Statistical analysis of the proportion of autophagic mitochondria to total mitochondria in hyperosmotic-stressed HCEPCs after treatment with autophagy inhibitors/activators in Figure S2D. P denotes the number of successive passages. Data are expressed as mean ± SEM (n = 3). * p < 0.05, ** p < 0.01 vs. blank controls (Ctrl), and # p < 0.01, ## p < 0.01 among different experimental groups.
3.6. Mitophagy Activation Mitigates Energy Stress, DNA Damage, and Inflammation by Enhancing Mitophagy in HCEPCs Under Hyperosmotic Stress
We next assessed key energy parameters—ADP/ATP ratio (Figure 6A), NAD+ levels (Figure 6B), and NAD+/NADH ratio (Figure 6C)—in autophagy-modulated HCEPCs under hyperosmotic stress. This evaluated whether autophagy-dependent changes in mitochondrial integrity and oxidative burden influence the cellular energy crisis. Notably, compared to the hyperosmotic stress (hs) group alone, autophagy inhibition significantly exacerbated the energy deficit, manifested by (i) elevated ADP/ATP ratio, (ii) reduced NAD+ levels, and (iii) diminished NAD+/NADH ratio. Conversely, mitophagy activation markedly improved cellular energetics, demonstrating: (i) decreased ADP/ATP ratio, (ii) increased NAD+ levels, and (iii) enhanced NAD+/NADH ratio. Concomitantly, autophagy inhibition further amplified hyperosmotic stress-induced glycolytic activity, evidenced by significant increases in cellular glucose uptake (Figure 6D), glucose consumption (Figure 6E) and lactic acid production (Figure 6F). Autophagy activation effectively suppressed this hyperosmotic stress-induced glycolytic shift. Collectively, these metabolic findings indicate that impaired mitophagy aggravates the energy crisis under hyperosmotic stress, whereas enhanced mitophagy alleviates oxidative stress and energy deficits by improving mitochondrial biogenesis and bioenergetic output. Given that ROS overproduction under hyperosmotic stress induces DNA damage, and cytosolic accumulation of fragmented DNA may potentiate inflammatory responses, we examined DNA integrity and inflammation. Mitophagy inhibition potentiated DNA damage, marked by increased γ-H2AX-positive cell (Figure 6G,H), and exacerbated inflammatory cytokine release (IL-1β: Figure 6I; IL-6: Figure 6J; IL-8: Figure 6K). Strikingly, mitophagy activation significantly attenuated both DNA damage and inflammatory cytokine secretion. These results delineate a dual protective mechanism: Enhancing autophagy, particularly mitophagy, in hyperosmotically stressed HCEPCs, on one hand, promotes mitochondrial renewal and enhances bioenergetic capacity, thereby alleviating the energy crisis. On the other hand, it suppresses ROS generation, mitigating DNA damage and subsequent inflammatory cascades.
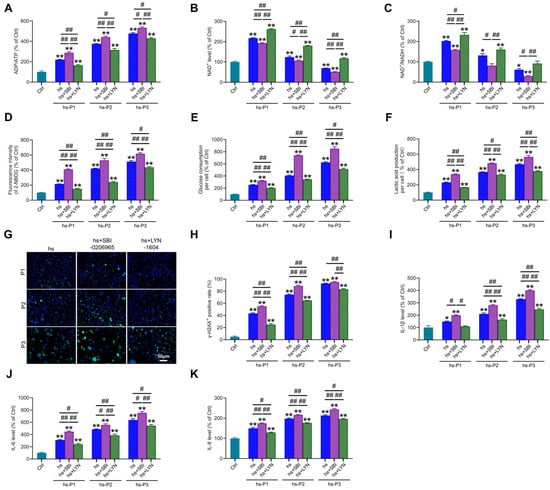
Figure 6.
Autophagy activation alleviates energy crisis, DNA damage, and inflammatory response in hyperosmotic-stressed HCEPCs. (A) Detection of ATP/ADP levels in hypertonic-stressed HCEPCs after treatment with autophagy inhibitors/activators. (B) Detection of NAD+ levels in hypertonic-stressed HCEPCs after treatment with autophagy inhibitors/activators. (C) Detection of the NAD+/NADH ratio in hyperosmotic-stressed HCEPCs after treatment with autophagy inhibitors/activators. (D) Detection of cellular glucose uptake levels in hyperosmotic-stressed HCEPCs after treatment with autophagy inhibitors/activators. (E) Detection of glucose consumption levels in hyperosmotic-stressed HCEPCs after treatment with autophagy inhibitors/activators. (F) Detection of lactic acid production levels in HCEPCs subjected to hyperosmolar stress after treatment with autophagy inhibitors/activators. (G,H) Immunofluorescence staining images and statistical analysis of γ-H2AX in hyperosmotic-stressed HCEPCs treated with autophagy inhibitors/activators. Representative micrographs display γ-H2AX -positive cells (green) and total cells (blue). (I–K) Detection of IL-1β, IL-6, and IL-8 secretion levels in hyperosmotic-stressed HCEPCs treated with autophagy inhibitors/activators. P denotes the number of successive passages. Data are expressed as mean ± SEM (n = 3). * p < 0.05, ** p < 0.01 vs. blank controls (Ctrl), and # p < 0.01, ## p < 0.01 among different experimental groups.
3.7. Mitophagy Activation Attenuates Cellular Senescence in Hyperosmotically Stressed HCEPCs
Building upon the established role of autophagy in regulating multiple stress-response pathways, we investigated its ultimate impact on senescence hallmarks. Notably, compared to the hs group, autophagy (particularly mitophagy) inhibition further exacerbated senescence-associated phenotypes, manifested by: (i) increased cell surface area (Figure 7A,B), (ii) prolonged time to reach confluency (Figure 7C), and (iii) elevated proportion of SA-β-gal-positive cells (Figure 7D,E). Conversely, pharmacological activation of mitophagy significantly mitigated these alterations. Concomitantly, mitophagy inhibition markedly reduced cell viability (Figure 7F) and proliferative capacity (Figure 7G,H), whereas mitophagy enhancement robustly preserved both parameters relative to the hs group. Collectively, these findings demonstrate that augmenting mitophagy following hyperosmotic stress enhances mitochondrial quality control, thereby attenuating oxidative burden, energy crisis, DNA damage, and inflammatory cascades. This coordinated mitigation significantly decelerates the progression of HCEPC senescence. In stark contrast, mitophagy impairment profoundly accelerates the senescence trajectory.
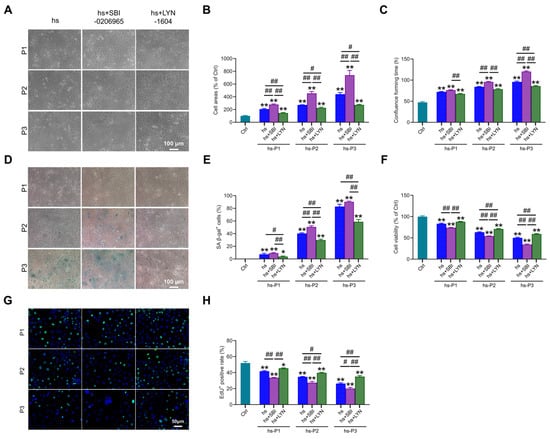
Figure 7.
Autophagy activation delays hyperosmotic stress-induced senescence in HCEPCs. (A) Light microscope images of HCEPCs subjected to hyperosmotic stress after treatment with autophagy inhibitors/activators. (B) Statistical analysis of cell area in (A). (C) Statistical analysis of confluence time of HCEPCs subjected to hyperosmotic stress after treatment with autophagy inhibitors/activators. (D) SA-β-gal staining images of HCEPCs subjected to hyperosmotic stress after treatment with autophagy inhibitors/activators. (E) Statistical analysis of the percentage of SA-β-gal-positive cells in (D). (F) Cell viability assay of HCEPCs subjected to hyperosmotic stress after treatment with autophagy inhibitors/activators. (G,H) EdU staining images and statistical analysis of HCEPCs subjected to hyperosmotic stress after treatment with autophagy inhibitors/activators. Representative micrographs display EdU-positive cells (green) and total cells (blue). P denotes the number of successive passages. Data are expressed as mean ± SEM (n = 3). * p < 0.05, ** p < 0.01 vs. blank controls (Ctrl), and # p < 0.01, ## p < 0.01 among different experimental groups.
4. Discussion
Current clinical management strategies of DED—including artificial tears, anti-inflammatory agents (e.g., cyclosporine A, corticosteroids), and physical therapies (e.g., thermal pulsation, meibomian gland massage)—mainly alleviate symptoms but often lead to recurrence upon discontinuation [38]. The lack of lasting efficacy of these therapies stems from an incomplete understanding of their underlying mechanisms, hampering the development of targeted therapies. Therefore, clarifying DED pathogenesis and identifying novel therapeutic targets are of critical scientific and clinical importance.
The tear hyperosmolarity induced by DED triggers the release of pro-inflammatory factors such as IL-1, IL-6, and IL-8 exacerbates ocular surface inflammation [39]. This process not only produces the symptoms and tissue damage associated with DED but also further elevates tear osmolarity, thereby creating a self-perpetuating vicious cycle [40]. Studies have elucidated that hyperosmotic stress induces corneal epithelial defects and thickening in mice [41]. In parallel, extensive in vitro investigations have revealed that hyperosmotic exposure elicits inflammatory responses in HCEPCs, which can even lead to cell death [42,43,44]. Meanwhile, a growing number of studies have revealed that oxidative stress, triggered by hyperosmotic stress, is a key mediator of the inflammatory response and ocular surface damage in dry eye disease [45,46,47,48,49], thereby promoting corneal epithelial cell senescence [50,51,52,53,54].
Autophagy is a highly conserved intracellular degradation process in eukaryotic cells that facilitates the lysosome-mediated breakdown of misfolded proteins and damaged organelles [55]. The sequential stages of autophagy encompass initiation (via ULK1 complex assembly), autophagosome formation (characterized by the conversion of LC3-I to LC3-II), and ultimately, cargo degradation following autophagosome-lysosome fusion (a process mediated by the adaptor protein p62) [56]. Under physiological conditions, autophagy supports cellular renewal and protein quality control; during nutrient deprivation [57], it serves as a survival mechanism by recycling non-essential components [58]; under stress, it clears damaged proteins and organelles to mitigate cytotoxicity [59].
Clinical studies have reported elevated autophagy markers in the tear film and conjunctival epithelium of DED patients [60], and evidence from studies in vitro consistently demonstrates autophagy activation in cellular models of dry eye or hyperosmotic stress [61]. Moderate autophagy activation protects cells by clearing damaged mitochondria, reducing oxidative stress, and suppressing inflammation [62,63,64]. However, excessive oxidative stress can lead to autophagosome accumulation and impaired autophagic flux, exacerbating corneal epithelial injury [65]. Recent research has further elucidated the molecular mechanisms underlying autophagy-mediated protection in DED. Evodiamine alleviates oxidative stress and promotes corneal epithelial repair in dry eye disease by activating autophagy through the p53/mTOR pathway [66], while Salidroside reduces oxidative damage in dry eye by enhancing autophagy via the AMPK-Sirt1/Nrf2 axis [67]. Therefore, targeted and controlled activation of autophagy represents a promising therapeutic strategy for DED.
The present study elucidates the intricate molecular cascade through which chronic hyperosmotic stress drives HCEPC senescence, a pivotal mechanism in DED pathogenesis. We establish that sustained exposure to 400 mOsm/L—mirroring peak clinical tear hyperosmolarity—induces a progressive senescent phenotype characterized by increased cell area, proliferative arrest, declined cell viability, DNA damage, nuclear lamina disassembly, and amplified SASP factors secretion. Notably, Lamin B1 disruption signifies irreversible nuclear envelope damage, a recognized commitment point to senescence [68]. DNA damage activates the cGAS-STING-NF-κB signaling pathway, which subsequently triggers the secretion of SASP factors and a pro-inflammatory response. This cascade ultimately exacerbates cellular senescence and perpetuates ocular surface inflammation in DED [69]. Crucially, our research results reveal that this process is orchestrated through mitochondrial dysfunction-induced oxidative stress and bioenergetic crisis, with autophagy (especially mitophagy) acting as a critical adaptive nexus determining cellular fate.
We demonstrate that hyperosmolarity induces a metabolic vicious cycle: hyperosmotic stress leads to intracellular environmental disorder, intracellular environmental disorder impairs the functions of organelles such as mitochondria, ER. The dysfunctional mitochondria produce excess ROS exacerbating oxidative damage to further compromise ATP synthesis resulting in an increase in ADP/ATP ratios. The excess ROS also exert oxidative stress on ER leading to misfolded protein accumulation synergizes with oxidative injury to overwhelm cellular homeostasis. In response to the oxidative stress on mitochondria and ER, the increased ADP/ATP ratios activate AMPK/mTOR/NAMPT/Sirt1 axis to increase conversion of LC3I to LC3II and the misfolded protein accumulation activates UPR of PERK/ATF4 pathways to enhance the expression of ATGs (ATG1, ATG6, etc.). Thus, both the increased conversion of LC3I to LC3II and upregulated ATGs expression trigger autophagy to highlight a compensatory effort of restoring metabolic balance. However, these protective adaptive responses eventually succumb to persistent hyperosmotic stress, resulting in the collapse of cellular homeostasis and thereby triggering irreversible DNA damage (γ-H2AX accumulation) and SASP factors secretion (IL-1β, IL-6, IL-8), mirroring the chronic inflammatory milieu observed in DED [70].
Our data position autophagy as a pivotal regulator of HCEPCs survival under hyperosmotic stress. In the early of hypertonic stress (hs-P1), the activation of autophagy, marked by elevated LC3-II/LC3-I ratios, ULK1 and p62 level, and ATF4-driven transcription, reflects its dual role in mitigating both energy crises and proteotoxic stress. However, sustained stress exhausts autophagic capacity, permitting ROS accumulation and irreversible damage. Critically, mitophagy—the selective clearance of damaged mitochondria—emerges as a cornerstone of this response. The peak expression of PINK1 and NIX in early passages, coupled with increased mitophagic flux (MitoTracker/LysoTracker co-localization), demonstrates that autophagy prioritizes mitochondrial quality control to curb ROS overproduction. This is corroborated by the pharmacological experiments: autophagy inhibition (SBI-0206965) exacerbates mitochondrial depolarization and oxidative burden, while its activation (LYN-1604) preserves ΔΨm and reduces ROS, thereby attenuating downstream DNA damage and SASP factors secretion. The disproportionate impact of autophagy on mitophagy (the proportion of mitophagy relative to total autophagy) underscores mitochondrial quality control as the primary therapeutic node.
The reciprocal crosstalk between autophagy and energy metabolism crucially amplifies its cytoprotective effects. Mitophagy activation enhances mitochondrial biogenesis to improve aerobic respiration, which not only alleviates ADP/ATP imbalance and replenishes NAD+ levels but also strikingly suppresses hyperosmotic stress-induced glycolytic hyperactivity—evidenced by reduced glucose uptake/consumption and diminished lactate production. This metabolic reprogramming resolves bioenergetic crises, thereby preserving cellular viability and proliferative capacity, ultimately contributing to significant attenuation of senescence progression in hyperosmotically stressed HCEPCs.
Collectively, we propose a sequential model (as shown in Figure 8): Hyperosmotic stress compromises mitochondrial integrity → ROS overproduction induces oxidative damage, energy deficit (activating AMPK), and ER stress (activating PERK/ATF4) → The AMPK and ATF4 pathways converge to upregulate general autophagy most of which are mitophagy → Efficient mitophagy clears damaged mitochondria, curbing ROS at its source and preserving energy output → This attenuates DNA damage, metabolic disturbance, and inflammatory cascades → Cellular homeostasis is temporarily preserved, delaying senescence. However, sustained hyperosmotic stress eventually overwhelms autophagic capacity, leading to mitochondrial collapse, metabolic disturbance, and senescence execution.
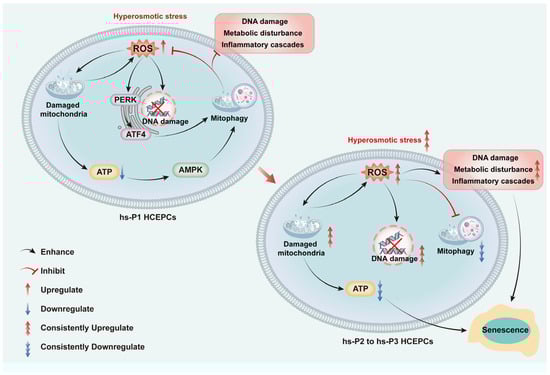
Figure 8.
Graphical mechanism of HCEC senescence induced by hyperosmolarity through oxidative stress-dependent DNA damage, metabolic disturbance and mitophagy decline.
Current DED therapies primarily target surface inflammation or tear replacement [71], yet our data suggest that restoring autophagy could address the root causes of epithelial dysfunction. By enhancing mitochondrial turnover and suppressing oxidative stress, autophagy modulation may offer a dual benefit: preserving HCEPCs integrity and dampening the chronic inflammatory loop. This aligns with emerging evidence linking autophagy dysregulation to age-related ocular surface diseases, positioning autophagy activators (e.g., LYN-1604) as promising candidates for adjunctive therapies. However, several questions remain. For instance, the long-term efficacy of autophagy modulation in vivo, the potential off-target effects of pharmacological agents, and the interplay between autophagy and other stress-responsive pathways warrant further investigation.
While this study provides mechanistic insights, it is limited to in vitro models. Future research should validate these findings in ex vivo human corneal tissues and in vivo DED models. Longitudinal studies assessing autophagy dynamics in patient-derived HCEPCs could bridge the gap between bench and bedside. Furthermore, high-throughput screening for autophagy-modulating compounds with ocular bioavailability would accelerate therapeutic development.
5. Conclusions
In conclusion, this study demonstrates that hyperosmolarity-induced oxidative stress is a central driver of HCEPC senescence in dry eye disease. Hyperosmotic stress compromises mitochondrial dysfunction, which triggers concurrent DNA damage and bioenergetic crisis. A critical finding is the progressive failure of compensatory mitophagy under sustained stress, leading to the accumulation of damaged mitochondria, which perpetuates oxidative injury and amplifies inflammatory signaling. Our results establish that the potentiation of mitophagy serves as a key protective mechanism, highlighting its potential as a therapeutic target to decelerate corneal epithelial senescence and disrupt the pathogenic cycle of DED.
Supplementary Materials
The following supporting information can be downloaded at https://www.mdpi.com/article/10.3390/antiox14111381/s1, Figure S1: Fluorescent images of JC-1 staining in hypertonic-stressed HCEPCs of different passages. Figure S2: Effects of autophagy modulators on autophagy, ROS production, and mitophagy in hyperosmotic-stressed HCEPCs.
Author Contributions
Y.Z.: writing—original draft preparation, investigation, formal analysis, data curation. T.F.: writing—review and editing, supervision, project administration, funding acquisition, validation, methodology. All authors have read and agreed to the published version of the manuscript.
Funding
This research was funded by of Ministry of Science and Technology of the People’s Republic of China under the National Key Research and Development Program [2018YFC1106000/2018YFC1106001].
Institutional Review Board Statement
Not applicable.
Informed Consent Statement
Not applicable.
Data Availability Statement
The data presented in this study are available from the corresponding author upon reasonable request.
Acknowledgments
Special thanks to Guojian Jiang from Key Laboratory for Corneal Tissue Engineering for his assistance in article review and polishing.
Conflicts of Interest
The authors declare no conflicts of interest.
Abbreviations
The following abbreviations are used in this manuscript:
| 2-NBDG | 2-(N-(7-Nitrobenz-2-oxa-1,3-diazol-4-yl)Amino)-2-Deoxyglucose |
| AMPK | adenosine monophosphate-activated protein kinase |
| ATG | autophagy-related gene |
| CCK-8 | Cell Counting Kit-8 |
| cGAS | cyclic GMP-AMP synthase |
| DAPI | 4′,6-diamidino-2-phenylindole |
| DED | Dry eye disease |
| DMEM | Dulbecco’s Modified Eagle Medium |
| ECL | enhanced chemiluminescence |
| EdU | 5-ethynyl-2′-deoxyuridine |
| ELISA | enzyme-linked immunosorbent assay |
| ER | endoplasmic reticulum |
| FBS | fetal bovine serum |
| GAPDH | glyceraldehyde-3-phosphate dehydrogenase |
| HCEPC | human corneal epithelial cells |
| IL | Interleukin |
| LC3 | microtubule-associated protein 1 light chain 3 |
| MDC | monodansylcadaverine |
| MMPs | matrix metalloproteinases |
| mTOR | mammalian target of rapamycin complex |
| NAD | nicotinamide adenine dinucleotide |
| NAMPT | nicotinamide phosphoribosyl transferase |
| NF-κB | nuclear factor kappa-light-chain-enhancer of activated B cells |
| NIX | Nip3-like protein X |
| PBS | Phosphate-buffered saline |
| PBST | phosphate-buffered saline with Tween 20 |
| PERK | protein kinase R like endoplasmic reticulum kinase |
| PINK1 | PTEN-induced kinase 1 |
| PVDF | polyvinylidene difluoride |
| RIPA | radio-immunoprecipitation assay lysis buffer |
| ROS | reactive oxygen species |
| RT-qPCR | real-time reverse transcription polymerase chain reaction |
| SASP | senescence-associated secretory phenotype |
| SA-β-gal | senescence-associated-β-galactosidase |
| SDS-PAGE | sodium dodecyl sulfate-polyacrylamide gel electrophoresis |
| SEM | standard error of the mean |
| Sirt1 | silent information regulator factor 2-related enzyme 1 |
| STING | stimulator of interferon genes |
| TNF-α | tumor necrosis factor-α |
| ULK1 | Unc-51 like autophagy activating kinase 1 |
| UPR | unfolded protein response |
References
- Shetty, R.; Sethu, S. Newer Paradigms in Dry Eye Disease Research. Ind. J. Ophthalmol. 2023, 71, 1064. [Google Scholar] [CrossRef]
- Gupta, P.K.; Toyos, R.; Sheppard, J.D.; Toyos, M.; Mah, F.S.; Bird, B.; Theriot, P.E.; Higgins, D. Tolerability of Current Treatments for Dry Eye Disease: A Review of Approved and Investigational Therapies. Clin. Ophthalmol. 2024, 18, 2283–2302. [Google Scholar] [CrossRef]
- Verma, S.; Montoya, P.A.G.; Sun, M.; Puri, S.; Yuksel, S.; Wilkerson, A.; Gesteira, T.F.; Butovich, I.A.; Coulson-Thomas, V.J. Comparative Analysis of Age-Associated Changes in Meibum Composition, Distribution, and Function in Mice with Altered Hyaluronan Expression. Investig. Ophthalmol. Vis. Sci. 2025, 66, 72. [Google Scholar] [CrossRef]
- Ji, H.; Zhu, Y.; Zhang, Y.; Li, Z.; Ge, J.; Zhuo, Y. Dry Eye Disease in Patients with Functioning Filtering Blebs after Trabeculectomy. PLoS ONE 2016, 11, e0152696. [Google Scholar] [CrossRef] [PubMed]
- Jiang, Y.; Lin, S.; Gao, Y. Mesenchymal Stromal Cell-Based Therapy for Dry Eye: Current Status and Future Perspectives. Cell Transplant. 2022, 31, 9636897221133818. [Google Scholar] [CrossRef] [PubMed]
- Liu, Z.G. [Emphasis on standardization and refinement in the diagnosis and treatment of dry eye]. Chin. J. Ophthalmol. 2017, 53, 641–644. [Google Scholar]
- Shan, H.; Liu, W.; Li, Y.; Pang, K. The Autoimmune Rheumatic Disease Related Dry Eye and Its Association with Retinopathy. Biomolecules 2023, 13, 724. [Google Scholar] [CrossRef]
- Liao, H.-J.; Hsu, P.-N. Immunomodulatory Effects of Extracellular Vesicles from Mesenchymal Stromal Cells: Implication for Therapeutic Approach in Autoimmune Diseases. Kaohsiung J. Med. Sci. 2024, 40, 520–529. [Google Scholar] [CrossRef]
- Molero Senosiaín, M.; Burgos-Blasco, B.; Perez-García, P.; Sánchez-Ventosa, Á.; Villalba-González, M.; López Pérez, M.D.; Díaz, J.C.; Díaz-Mesa, V.; Villarrubia Cuadrado, A.; Artiaga Elordi, E.; et al. Performance and Safety of a Sodium Hyaluronate, Xanthan Gum, and Osmoprotectants Ophthalmic Solution in the Treatment of Dry Eye Disease: An Observational Clinical Investigation. Ophthalmol. Ther. 2025, 14, 675–692. [Google Scholar] [CrossRef]
- Martone, G.; Balestrazzi, A.; Ciprandi, G.; Balestrazzi, A. Alpha-Glycerylphosphorylcholine and D-Panthenol Eye Drops in Patients Undergoing Cataract Surgery. J. Ophthalmol. 2022, 2022, 1951014. [Google Scholar] [CrossRef]
- Gilbard, J.P.; Farris, R.L.; Santamaria, J. Osmolarity of Tear Microvolumes in Keratoconjunctivitis Sicca. Arch. Ophthalmol. 1978, 96, 677–681. [Google Scholar] [CrossRef] [PubMed]
- Yu, K.; Bunya, V.; Maguire, M.; Asbell, P.; Ying, G.-S. Dry Eye Assessment and Management Study Research Group Systemic Conditions Associated with Severity of Dry Eye Signs and Symptoms in the Dry Eye Assessment and Management Study. Ophthalmology 2021, 128, 1384–1392. [Google Scholar] [CrossRef] [PubMed]
- Dogru, M.; Kojima, T.; Simsek, C.; Tsubota, K. Potential Role of Oxidative Stress in Ocular Surface Inflammation and Dry Eye Disease. Investig. Ophthalmol. Vis. Sci. 2018, 59, DES163–DES168. [Google Scholar] [CrossRef] [PubMed]
- Zhu, Q.; Ding, D.; Yang, H.; Zou, W.; Yang, D.; Wang, K.; Zhang, C.; Chen, B.; Ji, D.; Hao, Y.; et al. Melatonin Protects Mitochondrial Function and Inhibits Oxidative Damage against the Decline of Human Oocytes Development Caused by Prolonged Cryopreservation. Cells 2022, 11, 4018. [Google Scholar] [CrossRef]
- Navel, V.; Sapin, V.; Henrioux, F.; Blanchon, L.; Labbé, A.; Chiambaretta, F.; Baudouin, C.; Dutheil, F. Oxidative and Antioxidative Stress Markers in Dry Eye Disease: A Systematic Review and Meta-Analysis. Acta Ophthalmol. 2022, 100, 45–57. [Google Scholar] [CrossRef]
- Uchino, Y.; Kawakita, T.; Ishii, T.; Ishii, N.; Tsubota, K. A New Mouse Model of Dry Eye Disease: Oxidative Stress Affects Functional Decline in the Lacrimal Gland. Cornea 2012, 31 (Suppl. S1), S63–S67. [Google Scholar] [CrossRef]
- Deng, R.; Hua, X.; Li, J.; Chi, W.; Zhang, Z.; Lu, F.; Zhang, L.; Pflugfelder, S.C.; Li, D.-Q. Oxidative Stress Markers Induced by Hyperosmolarity in Primary Human Corneal Epithelial Cells. PLoS ONE 2015, 10, e0126561. [Google Scholar] [CrossRef]
- Jiang, G.-J.; You, X.-G.; Fan, T.-J. Ultraviolet B Irradiation Induces Senescence of Human Corneal Endothelial Cells In Vitro by DNA Damage Response and Oxidative Stress. J. Photochem. Photobiol. B 2022, 235, 112568. [Google Scholar] [CrossRef]
- Zheng, X.; Jiang, G.-J.; Fan, T.-J. Blue Light Irradiation Elicits Senescence of Corneal Endothelial Cells In Vitro by Provoking Energy Crisis, Inflammasome Assembly and DNA Damage. Curr. Eye Res. 2025, 50, 791–802. [Google Scholar] [CrossRef]
- Yang, T.; Fan, T.-J.; Xu, B. Norfloxacin Induces Apoptosis and Necroptosis in Human Corneal Epithelial Cells. Toxicol. In Vitro 2020, 66, 104868. [Google Scholar] [CrossRef]
- Li, H.; Fan, T.-J.; Zou, P.; Xu, B. Diclofenac Sodium Triggers P53-Dependent Apoptosis in Human Corneal Epithelial Cells via ROS-Mediated Crosstalk. Chem. Res. Toxicol. 2021, 34, 70–79. [Google Scholar] [CrossRef]
- Fan, T.-J.; Xu, B.; Zhao, J.; Yang, H.-S.; Wang, R.-X.; Hu, X.-Z. Establishment of an Untransfected Human Corneal Epithelial Cell Line and Its Biocompatibility with Denuded Amniotic Membrane. Int. J. Ophthalmol. 2011, 4, 228–234. [Google Scholar]
- Lu, J.; Zhu, L.; Zheng, L.; Cui, Q.; Zhu, H.; Zhao, H.; Shen, Z.; Dong, H.; Chen, S.; Wu, W.; et al. Overexpression of ULK1 Represents a Potential Diagnostic Marker for Clear Cell Renal Carcinoma and the Antitumor Effects of SBI-0206965. eBioMedicine 2018, 34, 85. [Google Scholar] [CrossRef] [PubMed]
- Zhang, L.; Fu, L.; Zhang, S.; Zhang, J.; Zhao, Y.; Zheng, Y.; He, G.; Yang, S.; Ouyang, L.; Liu, B. Discovery of a Small Molecule Targeting ULK1-Modulated Cell Death of Triple Negative Breast Cancer In Vitro and In Vivo. Chem. Sci. 2017, 8, 2687–2701. [Google Scholar] [CrossRef] [PubMed]
- Ding, W.; Zhang, X.; Xiao, D.; Chang, W. Decreased in N-3 DHA Enriched Triacylglycerol in Small Extracellular Vesicles of Diabetic Patients with Cardiac Dysfunction. J. Diabetes 2023, 15, 1070. [Google Scholar] [CrossRef] [PubMed]
- Cui, Z.; Li, C.; Liu, W.; Sun, M.; Deng, S.; Cao, J.; Yang, H.; Chen, P. Scutellarin Activates IDH1 to Exert Antitumor Effects in Hepatocellular Carcinoma Progression. Cell Death Dis. 2024, 15, 267. [Google Scholar] [CrossRef]
- Zhao, L.; Kang, M.; Liu, X.; Wang, Z.; Wang, Y.; Chen, H.; Liu, W.; Liu, S.; Li, B.; Li, C.; et al. UBR7 Inhibits HCC Tumorigenesis by Targeting Keap1/Nrf2/Bach1/HK2 and Glycolysis. J. Exp. Clin. Cancer Res. 2022, 41, 330. [Google Scholar] [CrossRef]
- Aguayo-Mazzucato, C.; van Haaren, M.; Mruk, M.; Lee, T.B.; Crawford, C.; Hollister-Lock, J.; Sullivan, B.A.; Johnson, J.W.; Ebrahimi, A.; Dreyfuss, J.M.; et al. β-Cell Aging Markers Have Heterogeneous Distribution and Are Induced by Insulin Resistance. Cell Metab. 2017, 25, 898–910.e5. [Google Scholar] [CrossRef]
- Voskamp, C.; Koevoet, W.J.L.M.; Van Osch, G.J.V.M.; Narcisi, R. Senescence during Early Differentiation Reduced the Chondrogenic Differentiation Capacity of Mesenchymal Progenitor Cells. Front. Bioeng. Biotechnol. 2023, 11, 1241338. [Google Scholar] [CrossRef]
- Al-Azab, M.; Safi, M.; Idiiatullina, E.; Al-Shaebi, F.; Zaky, M.Y. Aging of Mesenchymal Stem Cell: Machinery, Markers, and Strategies of Fighting. Cell. Mol. Biol. Lett. 2022, 27, 69. [Google Scholar] [CrossRef]
- Guo, C.; Li, X.; Fan, Z.; Zhang, J.; Chen, M. Progress in the Study of the Role of C5a-Induced Tubular Cell Senescence in the Progression of Diabetic Kidney Disease. Ann. Med. 2025, 57, 2561232. [Google Scholar] [CrossRef] [PubMed]
- Deng, J.; Jiang, Y.; Chen, Z.B.; Rhee, J.-W.; Deng, Y.; Wang, Z.V. Mitochondrial Dysfunction in Cardiac Arrhythmias. Cells 2023, 12, 679. [Google Scholar] [CrossRef] [PubMed]
- Yan, R.; Zhang, X.; Xu, W.; Li, J.; Sun, Y.; Cui, S.; Xu, R.; Li, W.; Jiao, L.; Wang, T. ROS-Induced Endothelial Dysfunction in the Pathogenesis of Atherosclerosis. Aging Dis. 2024, 16, 250–268. [Google Scholar] [CrossRef]
- Wang, R.; Liang, L.; Matsumoto, M.; Iwata, K.; Umemura, A.; He, F. Reactive Oxygen Species and NRF2 Signaling, Friends or Foes in Cancer? Biomolecules 2023, 13, 353. [Google Scholar] [CrossRef]
- Liu, W.; Jiang, Y.; Sun, J.; Geng, S.; Pan, Z.; Prinz, R.A.; Wang, C.; Sun, J.; Jiao, X.; Xu, X. Activation of TGF-β-Activated Kinase 1 (TAK1) Restricts Salmonella Typhimurium Growth by Inducing AMPK Activation and Autophagy. Cell Death Dis. 2018, 9, 570. [Google Scholar] [CrossRef]
- He, J.; Liu, D.; Zhao, L.; Zhou, D.; Rong, J.; Zhang, L.; Xia, Z. Myocardial Ischemia/Reperfusion Injury: Mechanisms of Injury and Implications for Management (Review). Exp. Ther. Med. 2022, 23, 430. [Google Scholar] [CrossRef]
- Liu, L.; Li, Y.; Chen, G.; Chen, Q. Crosstalk between Mitochondrial Biogenesis and Mitophagy to Maintain Mitochondrial Homeostasis. J. Biomed. Sci. 2023, 30, 86. [Google Scholar] [CrossRef]
- Zhang, D.; Chen, T.; Liang, Q.; Feng, X.; Jiang, J.; Chen, Z.; Tang, Y.; Chu, Y.; Wang, B.; Hu, K. A First-in-Human, Prospective Pilot Trial of Umbilical Cord-Derived Mesenchymal Stem Cell Eye Drops Therapy for Patients with Refractory Non-Sjögren’s and Sjögren’s Syndrome Dry Eye Disease. Stem Cell Res. Ther. 2025, 16, 202. [Google Scholar] [CrossRef]
- Liu, X.; Xu, W.; Feng, J.; Wang, Y.; Li, K.; Chen, Y.; Wang, W.; Zhao, W.; Ge, S.; Li, J. Adoptive Cell Transfer of Piezo-Activated Macrophage Rescues Immunosuppressed Rodents from Life-Threating Bacterial Infections. Nat. Commun. 2025, 16, 1363. [Google Scholar] [CrossRef]
- Kim, M.; Chun, Y.S.; Kim, K.W. Different Perception of Dry Eye Symptoms between Patients with and without Primary Sjogren’s Syndrome. Sci. Rep. 2022, 12, 2172. [Google Scholar] [CrossRef]
- Huo, J.; Xie, H.; Li, J.; Zhou, D. [A primary study of L-carnitine protective effect on corneal and conjunctival epithelium of mouse dry eye model induced by hyperosmolar saline]. Chin. J. Ophthalmol. 2012, 48, 330–336. [Google Scholar]
- López-Cano, J.J.; González-Cela-Casamayor, M.A.; Andrés-Guerrero, V.; Herrero-Vanrell, R.; Benítez-Del-Castillo, J.M.; Molina-Martínez, I.T. Combined Hyperosmolarity and Inflammatory Conditions in Stressed Human Corneal Epithelial Cells and Macrophages to Evaluate Osmoprotective Agents as Potential DED Treatments. Exp. Eye Res. 2021, 211, 108723. [Google Scholar] [CrossRef]
- Ren, Y.; Lu, H.; Reinach, P.S.; Zheng, Q.; Li, J.; Tan, Q.; Zhu, H.; Chen, W. Hyperosmolarity-Induced AQP5 Upregulation Promotes Inflammation and Cell Death via JNK1/2 Activation in Human Corneal Epithelial Cells. Sci. Rep. 2017, 7, 4727. [Google Scholar] [CrossRef] [PubMed]
- Ngoenkam, J.; Pejchang, D.; Nuamchit, T.; Wichai, U.; Pongcharoen, S.; Laorob, T.; Paensuwan, P. Nitro Dihydrocapsaicin Attenuates Hyperosmotic Stress-Induced Inflammation in the Corneal Epithelial Cells via SIRT1/Nrf2/HO-1 Pathway. Exp. Eye Res. 2025, 261, 110680. [Google Scholar] [CrossRef] [PubMed]
- Xia, Y.; Zhang, Y.; Du, Y.; Wang, Z.; Cheng, L.; Du, Z. Comprehensive Dry Eye Therapy: Overcoming Ocular Surface Barrier and Combating Inflammation, Oxidation, and Mitochondrial Damage. J. Nanobiotechnol. 2024, 22, 233. [Google Scholar] [CrossRef] [PubMed]
- Zhao, D.; Zhao, H.; He, Y.; Zhang, M. BMSC Alleviates Dry Eye by Inhibiting the ROS-NLRP3-IL-1β Signaling Axis by Reducing Inflammation Levels. Curr. Eye Res. 2024, 49, 698–707. [Google Scholar] [CrossRef]
- Chen, J.; Zhang, W.; Zheng, Y.; Xu, Y. Ameliorative Potential of Resveratrol in Dry Eye Disease by Restoring Mitochondrial Function. Evid.-Based Complement. Altern. Med. 2022, 2022, 1013444. [Google Scholar] [CrossRef]
- Hu, R.; Shi, J.; Xie, C.-M.; Yao, X.-L. Dry Eye Disease: Oxidative Stress on Ocular Surface and Cutting-Edge Antioxidants. Glob. Chall. 2025, 9, e00068. [Google Scholar] [CrossRef]
- Zou, H.; Hong, Y.; Xu, B.; Wang, M.; Xie, H.; Lin, Q. Multifunctional Cerium Oxide Nanozymes with High Ocular Surface Retention for Dry Eye Disease Treatment Achieved by Restoring Redox Balance. Acta Biomater. 2024, 185, 441–455. [Google Scholar] [CrossRef]
- Guo, X.-X.; Chang, X.-J.; Pu, Q.; Li, A.-L.; Li, J.; Li, X.-Y. Urolithin A Alleviates Cell Senescence by Inhibiting Ferroptosis and Enhances Corneal Epithelial Wound Healing. Front. Med. 2024, 11, 1441196. [Google Scholar] [CrossRef]
- Xiao, X.; Xu, M.; Yu, H.; Wang, L.; Li, X.; Rak, J.; Wang, S.; Zhao, R.C. Mesenchymal Stem Cell-Derived Small Extracellular Vesicles Mitigate Oxidative Stress-Induced Senescence in Endothelial Cells via Regulation of miR-146a/Src. Signal Transduct. Target. Ther. 2021, 6, 354. [Google Scholar] [CrossRef]
- Wang, Z.; Wei, D.; Xiao, H. Methods of Cellular Senescence Induction Using Oxidative Stress. Methods Mol. Biol. 2013, 1048, 135–144. [Google Scholar]
- von Zglinicki, T. Oxidative Stress and Cell Senescence as Drivers of Ageing: Chicken and Egg. Ageing Res. Rev. 2024, 102, 102558. [Google Scholar] [CrossRef]
- Ogawa, Y.; Kawakami, Y.; Tsubota, K. Cascade of Inflammatory, Fibrotic Processes, and Stress-Induced Senescence in Chronic GVHD-Related Dry Eye Disease. Int. J. Mol. Sci. 2021, 22, 6114. [Google Scholar] [CrossRef]
- Zhou, P.; Wu, W.; Wei, J.; Yang, Y.; Jongkaewwattana, A.; Xiao, Y.; Jin, H.; Zhou, H.; Luo, R. MARCH6 Suppresses Tembusu Virus Replication by Targeting Viral NS5 Protein for TOLLIP-Mediated Selective Autophagic Degradation. J. Virol. 2025, 99, 7. [Google Scholar] [CrossRef]
- Zhang, X.; Chen, S.; Huang, K.; Le, W. Why Should Autophagic Flux Be Assessed? Acta Pharmacol. Sin. 2013, 34, 595–599. [Google Scholar] [CrossRef] [PubMed]
- Grassi, G.; Di Caprio, G.; Santangelo, L.; Fimia, G.M.; Cozzolino, A.M.; Komatsu, M.; Ippolito, G.; Tripodi, M.; Alonzi, T. Autophagy Regulates Hepatocyte Identity and Epithelial-to-Mesenchymal and Mesenchymal-to-Epithelial Transitions Promoting Snail Degradation. Cell Death Dis. 2015, 6, e1880. [Google Scholar] [CrossRef] [PubMed]
- Singh, A.B. EGFR-Signaling and Autophagy: How They Fit in the Cancer Landscape. J. Adenocarcinoma 2016, 1, 9. [Google Scholar] [CrossRef] [PubMed]
- Goenka, L.; Rajappa, M.; Gochhait, D.; Manivannan, P.; Chaturvedula, L.; L, C.; Charanraj Goud, A.; Dubashi, B.; Kayal, S.; Ganesan, P. Assessing Autophagy Activation in Advanced Ovarian Cancer Using Ascitic Fluid: A Feasibility Study. Cureus 2025, 17, e79371. [Google Scholar] [CrossRef]
- Byun, Y.-S.; Lee, H.J.; Shin, S.; Chung, S.-H. Elevation of Autophagy Markers in Sjögren Syndrome Dry Eye. Sci. Rep. 2017, 7, 17280. [Google Scholar] [CrossRef]
- Jeyabalan, N.; Pillai, A.M.; Khamar, P.; Shetty, R.; Mohan, R.R.; Ghosh, A. Autophagy in Dry Eye Disease: Therapeutic Implications of Autophagy Modulators on the Ocular Surface. Indian J. Ophthalmol. 2023, 71, 1285–1291. [Google Scholar] [CrossRef]
- Liu, Z.; Chen, D.; Chen, X.; Bian, F.; Gao, N.; Li, J.; Pflugfelder, S.C.; Li, D.-Q. Autophagy Activation Protects Ocular Surface from Inflammation in a Dry Eye Model In Vitro. Int. J. Mol. Sci. 2020, 21, 8966. [Google Scholar] [CrossRef] [PubMed]
- Hernandez, E.; Taisne, C.; Lussignol, M.; Esclatine, A.; Labetoulle, M. Commercially Available Eye Drops Containing Trehalose Protect Against Dry Conditions via Autophagy Induction. J. Ocul. Pharmacol. Ther. 2021, 37, 386–393. [Google Scholar] [CrossRef] [PubMed]
- Wang, B.; Zuo, X.; Peng, L.; Wang, X.; Zeng, H.; Zhong, J.; Li, S.; Xiao, Y.; Wang, L.; Ouyang, H.; et al. Melatonin Ameliorates Oxidative Stress-Mediated Injuries through Induction of HO-1 and Restores Autophagic Flux in Dry Eye. Exp. Eye Res. 2021, 205, 108491. [Google Scholar] [CrossRef] [PubMed]
- Wang, B.; Peng, L.; Ouyang, H.; Wang, L.; He, D.; Zhong, J.; Xiao, Y.; Deng, Y.; Li, M.; Li, S.; et al. Induction of DDIT4 Impairs Autophagy Through Oxidative Stress in Dry Eye. Investig. Ophthalmol. Vis. Sci. 2019, 60, 2836–2847. [Google Scholar] [CrossRef]
- Li, B.; Liu, J.; Zhang, D.; Chu, Y.; Chen, Z.; Tsao, J.; Chen, T.; Jiang, J.; Hu, K. Evodiamine Promotes Autophagy and Alleviates Oxidative Stress in Dry Eye Disease Through the P53/mTOR Pathway. Investig. Ophthalmol. Vis. Sci. 2025, 66, 44. [Google Scholar] [CrossRef]
- Liang, Q.; Guo, R.; Tsao, J.-R.; He, Y.; Wang, C.; Jiang, J.; Zhang, D.; Chen, T.; Yue, T.; Hu, K. Salidroside Alleviates Oxidative Stress in Dry Eye Disease by Activating Autophagy through AMPK-Sirt1 Pathway. Int. Immunopharmacol. 2023, 121, 110397. [Google Scholar] [CrossRef]
- Chmielewski, P.P.; Data, K.; Strzelec, B.; Farzaneh, M.; Anbiyaiee, A.; Zaheer, U.; Uddin, S.; Sheykhi-Sabzehpoush, M.; Mozdziak, P.; Zabel, M.; et al. Human Aging and Age-Related Diseases: From Underlying Mechanisms to Pro-Longevity Interventions. Aging Dis. 2024, 16, 1853–1877. [Google Scholar] [CrossRef]
- Hansel, C.; Jendrossek, V.; Klein, D. Cellular Senescence in the Lung: The Central Role of Senescent Epithelial Cells. Int. J. Mol. Sci. 2020, 21, 3279. [Google Scholar] [CrossRef]
- Messmer, E.M. The Pathophysiology, Diagnosis, and Treatment of Dry Eye Disease. Dtsch. Ärztebl. Int. 2015, 112, 71–82. [Google Scholar] [CrossRef]
- Sheppard, J.; Shen Lee, B.; Periman, L.M. Dry Eye Disease: Identification and Therapeutic Strategies for Primary Care Clinicians and Clinical Specialists. Ann. Med. 2023, 55, 241–252. [Google Scholar] [CrossRef]


Disclaimer/Publisher’s Note: The statements, opinions and data contained in all publications are solely those of the individual author(s) and contributor(s) and not of MDPI and/or the editor(s). MDPI and/or the editor(s) disclaim responsibility for any injury to people or property resulting from any ideas, methods, instructions or products referred to in the content. |
© 2025 by the authors. Licensee MDPI, Basel, Switzerland. This article is an open access article distributed under the terms and conditions of the Creative Commons Attribution (CC BY) license (https://creativecommons.org/licenses/by/4.0/).