Abstract
This study investigated the epigenetic mechanisms through which graded levels of dietary methionine (Met) regulates growth, muscle quality, and health in juvenile Megalobrama amblycephala fed an all-plant-protein diet. Dietary Met supplementation improved growth performance in a dose-dependent manner and enhanced muscle nutritional quality, particularly protein content and amino acid composition. Optimal Met intake also strengthened hepatic antioxidant defenses, stabilized mitochondrial function, and modulated plasma metabolite profiles, including metabolites associated with antioxidant, anti-inflammatory, and antimicrobial activity. Epigenetic analysis revealed that dietary Met influenced hepatic N6-methyladenosine (m6A) RNA methylation and the expression of genes involved in autophagy and apoptosis, suggesting that these molecular pathways contribute to the observed physiological benefits. Collectively, these findings indicate that appropriate dietary Met of 10.1 g/kg not only supports growth and nutrient utilization but also promotes metabolic and cellular homeostasis through epigenetic regulation. This work provides novel insights into the nutritional and molecular strategies for improving the health and performance of juvenile M. amblycephala under plant-based feeding regimes, with potential implications for sustainable aquaculture practices.
1. Introduction
In recent years, the growing significant challenges to the sustainable development of aquaculture and the feed industry have led to an increasing interest in developing alternative non-grain protein sources (e.g., plant proteins, insects, fungi, microalgae, and single-cell proteins from bacteria) to replace fish meal [1]. Among these, plant proteins have become the dominant protein source in aquafeeds due to their wide availability and cost-effectiveness [2]. However, The application of plant proteins in aquafeeds is often limited by anti-nutritional factors and deficiencies in essential amino acids (EAA), which restrict their effectiveness as complete fish meal replacements [3,4]. Supplementing plant-based diets with these limiting amino acids, tailored to the species’ nutritional requirements, can substantially improve protein utilization [5,6,7].
Methionine (Met), a vital sulfur-containing EAA for aquatic species and the first limiting amino acid in plant protein-based diets, is crucial in promoting somatic growth and improving feed conversion efficiency. Beyond its fundamental function as a precursor for protein synthesis, Met is intricately involved in various metabolic processes, including immune regulation and antioxidant defense mechanisms [8,9,10]. Moreover, it is a primary methyl group donor, contributing significantly to biochemical reactions and epigenetic modifications. In aquatic animals, Met is metabolized through four main pathways: (1) it functions directly as a substrate for protein translation [10]; (2) it is converted into S-adenosylmet (SAM), a universal methyl donor involved in the methylation of proteins, DNA, and RNA, and can be remethylated to regenerate Met [11]; (3) upon activation to SAM, it contributes to polyamine biosynthesis, leading to the formation of spermidine and spermine [12]; (4) through transmethylation its intermediate product homocysteine (Hcy) is further metabolized to produce glutathione (GSH) and taurine, both of which show strong antioxidant properties [13]. These metabolic pathways underscore the key role of Met in protein synthesis, methyl donor (SAM), and antioxidant precursors (GSH/taurine) in aquatic animals.
N6-methyladenosine (m6A), the most abundant and evolutionarily conserved internal modification in eukaryotic mRNA, is a methylation at the nitrogen-6 position of adenosine and is dynamically regulated by methyltransferases (writers, e.g., methyltransferase like 3 (mettl3) and methyltransferase like 14 (mettl14)), demethylases (erasers, e.g., fat mass and obesity-associated protein (fto) and alkylation repair homolog 5 (alkbh5)), and m6A-binding proteins (readers, e.g., YTH domain family member (ythdf1/2/3) and embryonic lethal abnormal vision-like protein1 (elavl1)) [14,15]. This epitranscriptomic mark is regulated dynamically and reversibly by a specialized enzymatic machinery comprising m6A modification regulates various post-transcriptional processes, including pre-mRNA splicing, 3′-end processing, translational regulation, nuclear export, mRNA degradation, and the biogenesis of non-coding RNAs. Accordingly, m6A has regulated diverse physiological and pathological pathways, such as tumorigenesis, immune homeostasis, and metabolic disorders (obesity) [16]. Met, as an important methyl group donor, is converted to SAM and participates directly in regulating m6A methylation in vivo. In mammals, supplementation with lysine and Met in low-protein diets has been shown to modulate lipid metabolism and reduce fat deposition in lambs by downregulating the levels of methyltransferases (mettl3, mettl14) and demethylases (fto, alkbh5) [17]. Similarly, selenomethionine (SeMet) has been reported to alleviate hepatic oxidative stress and inflammation in laying hens by reducing mettl3-mediated m6A methylation of nuclear factor erythroid-2-related factor 2 (nrf2), thus enhancing liver antioxidant and anti-inflammatory capacity [18].
Blunt snout bream (Megalobrama amblycephala), commonly known as Wuchang bream, is a widely favored freshwater herbivorous fish species, with considerable potential and high economic value for aquaculture development due to its low production cost, rapid growth, high survival rate and high proportion of edible flesh. M. amblycephala is naturally distributed in the Yangtze River, China and is primarily cultured in freshwater polyculture systems across the country [19]. Existing literature indicates that species-specific characteristics, developmental stage, and rearing conditions influence the dietary Met requirement in fish. For example, juvenile M. amblycephala (3.34 ± 0.03 g) have been reported to require 8.4–8.5 g/kg Met when fed low-fishmeal diets containing 5% fishmeal [20], whereas fingerlings (101.80 ± 1.30 g) under similar dietary conditions show a lower requirement of 7.4–7.6 g/kg [21]. However, under the current demand for sustainable aquaculture, the Met requirement and its functional effects in juvenile M. amblycephala fed fishmeal-free, all-plant-protein diets remain unclear. Notably, no study has yet linked methionine supplementation to epigenetic (m6A) regulation in fish fed all-plant diets. Therefore, this study examined the optimal dietary Met demand for juvenile M. amblycephala under a completely plant-based diet and evaluated the potential epigenetic mechanisms by which Met (as a methyl donor) regulates nutrient metabolism and health in this species.
2. Materials and Methods
2.1. Ethics Approval and Consent to Participate
All experimental protocols, methods, and feeding procedures were approved by the Institutional Animal Care and Use Committee of the Freshwater Fisheries Research Center, Chinese Academy of Fishery Sciences. All animal handling and experimental procedures were conducted in accordance with the approved ethical guidelines.
2.2. Fish and Diets
This study evaluated the effects of graded levels of DL-Met supplementation in plant protein-based diets on juvenile M. amblycephala (Huahai No. 1 strain). Six isonitrogenous and isoenergetic diets were formulated with increasing DL-Met levels, resulting in measured dietary Met concentrations of 4.4 g/kg (CON), 7.0 g/kg (MET1), 8.6 g/kg (MET2), 10.1 g/kg (MET3), 12.5 g/kg (MET4), and 14.2 g/kg (MET5), respectively. The detailed composition of the basal diet and corresponding amino acid profiles are provided in Table A1 and Table 1.

Table 1.
Amino acid composition of experimental feed.
2.3. Feeding Trial and Management
Approximately 480 healthy juvenile M. amblycephala with uniform body weight (initial mean weight: 12.34 ± 0.07 g) were randomly allocated into six experimental groups, each comprising four replicates. The feeding trial was conducted under a controlled indoor temperature-regulated recirculating aquaculture system at the Nanquan Facility of the Freshwater Fisheries Research Center, affiliated with the Chinese Academy of Fishery Sciences (Wuxi, China). After a one-week acclimatization phase in indoor glass tanks (water capacity: 300 L), the formal 10-week feeding trial was initiated. Fish were hand-fed to apparent satiation thrice daily (07:00, 12:00, and 17:00), allowing clear observation of the fish’s feeding behavior and activity through the transparent glass walls. When the fish ceased to respond actively to the feed, feeding was stopped to ensure that all pellets were completely consumed without residue. One-third of the tank water was replaced bi-daily to maintain optimal water conditions. The water quality during the feeding trial was explained in Appendix B.1.
2.4. Sample Collection
After 24 h of fasting, all fish were anesthetized using 3-aminobenzoic acid ethyl ester methanesulfonate (MS-222) at the concentration of 100 mg/L for sampling procedures. Growth performance and feed conversion ratio were recorded based on total biomass and fish count/tank. Blood samples were obtained from three fish per tank via caudal vein puncture using 1.0 mL syringes pre-treated with sterilized sodium heparin. Plasma and liver tissues were collected and processed for biochemical, metabolomic, and molecular analyses. Dorsal muscle samples were collected post skin removal (both flanks) for nutritional components and hydrolyzed amino acids determination. Moreover, three other fish were selected from each tank for immediate liver dissection, and mitochondrial membrane potential (MMP) and reactive oxygen species (ROS) levels were measured. The sample collection procedure was explained in Appendix B.2. Equal amounts of liver tissue from three fish originating from the same rearing glass tank were pooled, and four pooled liver samples from each treatment group were used for determining hepatic m6A levels, SAM contents and m6A methylation sequencing.
2.5. Laboratory Analysis
2.5.1. Growth Performance Calculation
Final body weight (FBW, g) = Wt/N;
Weight gain rate (WGR, %) = 100 × (Wt − W0)/W0;
Specific growth rate (SGR, % day−1) = 100 × (ln Wt − ln W0)/t;
Feed conversion ratio (FCR) = F/(Wt − W0).
Note: W0 is the total weight of each tank of fish at the beginning of the culture test (g); Wt is the total weight of each tank of fish at the end of the feeding trial (g); t is the feeding days (d); F is the total intake of feed (dry basis, g); N is the number of fish per tank at the end of the culture test.
2.5.2. Assessment of Plasma Biochemical and Hepatic Antioxidant Indexes
Plasma concentrations of alanine aminotransferase (ALT), aspartate aminotransferase (AST), lactate dehydrogenase (LDH), and glucose (GLU) were quantified using a fully automated biochemical analyzer (Mindray Bio-Medical Electronics Co., Ltd., Shenzhen, China) in combination with commercially available assay kits (Shanghai Zhicheng Biotechnology Co., Ltd., Shanghai, China). The supernatants of 10% liver homogenates were collected for determining enzymatic activity of catalase (CAT) and levels of glutathione (GSH), malondialdehyde (MDA), and total antioxidant capacity (T-AOC) via specific commercial kits (Nanjing Jiancheng Bioengineering Institute, Nanjing, China).
2.5.3. Determination of Hepatic MMP and ROS Production
Mitochondria were isolated, and the MMP and intracellular ROS levels were quantified using the JC-1 assay and the DCFH-DA method using commercially available kits, respectively, by the supplied instructions (Shanghai Biyuntian Biotechnology Co., Ltd., Shanghai, China). Fluorescence microscopy (Leica Microsystems, Wetzlar, Germany) was employed for visualization. Intracellular ROS oxidizes the non-fluorescent DCFH to its fluorescent form (DCF), indicating oxidative stress. For MMP analysis, high membrane potential leads to JC-1 aggregation within the mitochondrial matrix, emitting red fluorescence. However, reduced membrane potential prevents JC-1 aggregation, resulting in green fluorescence due to monomeric forms. Fluorescence intensity was quantified via Image J software (v1.8.0), and results were expressed accordingly.
2.5.4. Determination of Muscle Nutritional Components
Muscle nutrient components including dry matter content, crude protein content, crude fat content, and ash content were determined with reference to the methods specified in the national standard of the atmospheric pressure drying method, Kjeldahl nitrogen fixation, Soxhlet extraction, and the calcination method of 560 °C.
2.5.5. Determination of Hydrolyzed Amino Acids (HAA) in Muscle and FAA in Plasma
The amino acid composition in muscle (including taurine) were quantified after acid hydrolysis using an amino acid analyzer of Agilent 1100 (Agilent, Santa Clara, CA, USA). High-performance liquid chromatography (HPLC) was employed to measure FAA composition and content in plasma using a Waters 2695 HPLC system (Waters, Milford, MA, USA). The sample treatment procedure was explained in Appendix B.3.
2.5.6. LC-MS-Based Untargeted Metabolomics Analysis of Plasma
Plasma metabolites were analyzed using LC-MS. using a Vanquish UHPLC system coupled with a mass spectrometer (Q Exactive™ HF-X, ThermoFisher Scientific, Waltham, MA, USA). The plasma metabolomics analysis procedure was explained in Appendix B.4.
2.5.7. Analysis of Hepatic m6A Level and SAM Content
The EpiQuik™ m6A RNA Methylation Quantification Kit (Colorimetric; Beijing Chunye Technology Co., Ltd., Beijing, China) was used to quantify N6-methyladenosine (m6A) modifications in hepatic RNA. Liver SAM content was quantified using a fish SAM ELISA kit (Shanghai ChaoRui Biotechnology Co., Ltd., Shanghai, China). Absorbance was measured at 450 nm using a microplate reader, and SAM concentrations were calculated accordingly. The hepatic m6A level and SAM content analysis procedures were explained in Appendix B.5.
2.5.8. M6A Methylation Sequencing
Trizol (Invitrogen, CA, USA) was used to extract and purify RNA from liver tissue. The Epicentre Ribo-Zero Gold Kit (Illumina, San Diego, CA, USA) was used to remove the rRNA of total RNA that met the conditions, and then the RNA was fragmented using the magnesium ion interruption Kit (NEBNext® Magnesium RNA Fragmentation Module, Ipswich, MA, USA) under high-temperature conditions. Finally, m6A-seq and RNA-seq libraries were constructed and sequenced according to the reported method [22].
2.5.9. Hepatic Gene Expression Analysis
Gene expression levels in liver tissue were determined via qRT-PCR analysis [23]. Target gene transcripts were quantified using a CFX96 Touch real-time PCR detection system (Bio-Rad, Hercules, CA, USA). Primers were designed using the NCBI Primer Blast tool (Table A2) and synthesised by Shanghai BioEngineering Co., Ltd (Shanghai, China). β-actin was selected as the housekeeping gene, and relative transcription levels were analyzed using the 2−ΔΔCT method.
2.6. Statistical Analyses
Data was statistically analyzed via SPSS 27.0 (SPSS Inc., Chicago, IL, USA). Experimental data were examined for normality using the Shapiro–Wilk test, confirming adherence to the assumptions of normal distribution and homogeneity of variance. Substantial variations among groups were analyzed using one-way analysis of variance (ANOVA) followed by Duncan’s multiple comparison test, with a significance threshold set at p < 0.05. For comparison between the CON and MET3 groups, an independent samples t-test was conducted. A p-value < 0.05 was depicted as statistically significant, while p < 0.01 was interpreted as highly significant. General Linear Model (Univariate) was conducted to estimate effect size (the Partial Eta Squared, η2). Data are shown as mean ± SEM.
3. Results
3.1. Growth Performance and Feed Efficiency in Response to Dietary Met Supplementation
Dietary Met supplementation induced quadratic changes in growth performance, with FBW, WGR, and SGR increasing and then decreasing, while FCR exhibited the opposite trend. All Met-supplemented groups showed significantly higher FBW than CON, with MET3 achieving the highest value (p < 0.05, η2 = 0.866). Similarly, WGR (η2 = 0.855) and SGR (η2 = 0.766) were elevated in all Met groups, peaking in MET3 (p < 0.05). FCR decreased significantly in all Met groups compared with CON, with MET3 showing the lowest value (p < 0.05, η2 = 0.837, Figure 1A–D). Quadratic regression analysis (Figure 1E–G) revealed that the optimal dietary Met inclusion level was approximately 11 g/kg. Specifically, the levels for maximizing weight gain rate (WGR) and specific growth rate (SGR) and minimizing feed conversion ratio (FCR) were 10.93 g/kg (corresponding to a maximum WGR of 200.34%), 11.02 g/kg (maximum SGR of 1.567%/d), and 11.25 g/kg (minimum FCR of 1.874), respectively.
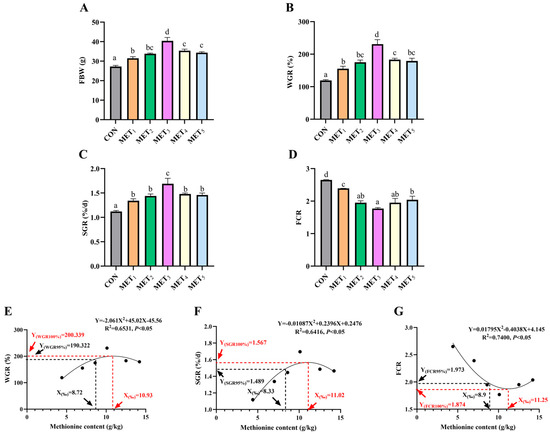
Figure 1.
Effects of methionine supplementation in all-plant-protein diet on growth performance and feed utilization of juvenile M. amblycephala. (A) final body weight; (B) weight gain rate; (C) specific growth rate; (D) feed conversion ratio; (E–G) quadratic regression fitting curve of optimal methionine content in all-plant-protein diet (WGR, SGR, FCR). The various superscripts represent remarkable differences across six groups (p < 0.05). Effect size classification based on Partial Eta Squared (η2): Small effect: 0.01 ≤ η2 < 0.06; Medium effect: 0.06 ≤ η2 < 0.14; Strong effect: η2 ≥ 0.14.
3.2. Plasma Biochemical Indicators and Hepatic Antioxidant Profile Against Dietary Met Supplementation
Progressive addition of Met in the all-plant-protein diet was associated with a general decline in plasma ALT and LDH activities. ALT levels were remarkably reduced in the MET2, MET3, and MET5 groups compared to the CON and MET1 groups (p < 0.05, η2 = 0.311, Figure 2A). Similarly, LDH activities in MET2 through MET5 were substantially lower than those in the CON group, while MET2, MET3, and MET4 showed lower values than MET1 (p < 0.05, η2 = 0.442, Figure 2C). AST activity depicted a biphasic pattern, initially decreasing and increasing with elevated Met supplementation. AST levels in the MET1-4 groups were statistically distinct from those in the CON and MET5 groups, with the MET5 group showing elevated levels relative to the CON group (p < 0.05, η2 = 0.624, Figure 2B). Plasma GLU concentrations showed a transient elevation followed by a decline as Met levels increased. The MET2 group represented the highest GLU value, which was significantly higher than those in the CON, MET1, MET4, and MET5 groups. The MET3 group also displayed higher GLU levels than both the CON and MET5 groups (p < 0.05, η2 = 0.442, Figure 2D).
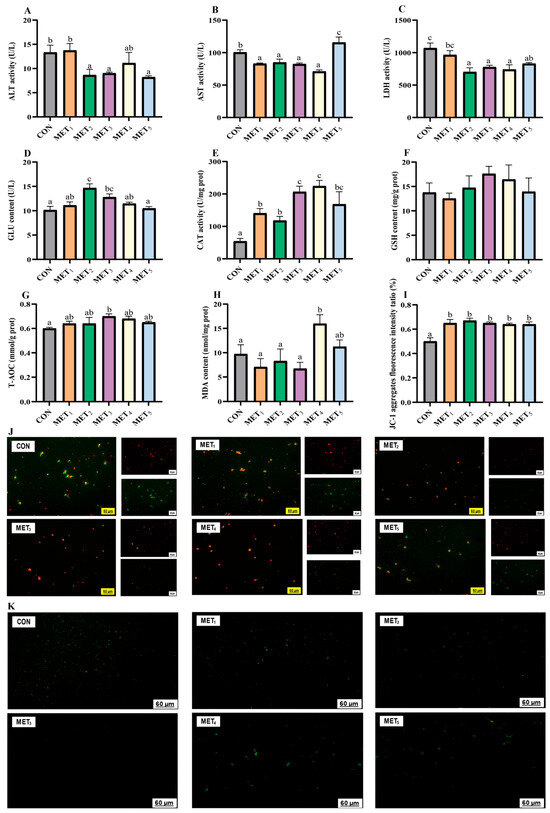
Figure 2.
Effects of methionine supplementation in all-plant-protein diet on plasma biochemical index and hepatic reactive oxygen species of juvenile M. amblycephala. (A) alanine aminotransferase; (B) aspartate aminotransferase; (C) lactate dehydrogenase; (D) glucose; (E) catalase; (F) glutathione; (G) total antioxidant capacity; (H) malondialdehyde; (I,J) hepatic mitochondrial membrane potential ((I) ratio of red fluorescence intensity to red and green fluorescence intensity; (J) the red fluorescence is JC-1 aggregates, the green fluorescence is JC-1 monomer;) (K) hepatic reactive oxygen species in mitochondria. The various superscripts represent remarkable differences across six groups (p < 0.05).
Liver antioxidant capacity was modulated by dietary Met levels, showing a biphasic response. Both CAT activity and T-AOC increased with moderate Met supplementation and declined at higher levels. Both MET3 and MET4 groups showed the highest CAT activity, showing significant variations relative to the CON, MET1, and MET2 groups, while the MET5 group also depicted significantly elevated CAT activity relative to the CON group (p < 0.05, η2 = 0.482, Figure 2E). T-AOC was maximized in the MET3 group, which presented considerably higher values than the CON group (p < 0.05; η2 = 0.171, Figure 2G). MDA levels in the MET4 group were remarkably elevated in comparison to CON and MET1-3 groups (p < 0.05, η2 = 0.272, Figure 2H), indicating increased lipid peroxidation. No significant differences were observed in hepatic GSH levels among the experimental groups (p > 0.05, η2 = 0.067, Figure 2F), suggesting that GSH content remained stable despite variations in Met intake. The MMP levels were positively correlated with the red fluorescence/red-to-green fluorescence intensity ratio (Figure 2I,J), and compared to the CON group, the MMP levels in the Met addition groups were considerably higher (p < 0.05). The ROS levels in the liver were positively correlated with the green fluorescence intensity, as shown in Figure 2K. With increasing Met addition, the fluorescence intensity of ROS initially decreased and then increased.
3.3. Changes in Muscle Nutritional Components and HAA Profiles in Response to Dietary Met Supplementation
Variations in dietary Met levels exerted a differential influence on muscle composition in juvenile M. amblycephala. As Met concentration increased, a non-linear trend was observed in moisture and crude protein content. Muscle moisture content showed an initial decline followed by an increase. Both MET3 and MET4 groups showed lower moisture levels than the CON, MET1, and MET5 groups, with the MET3 group also showing a significant reduction relative to MET2 group (p < 0.05; Figure 3A). Crude protein content increased at moderate Met levels, initially rising and then declining with higher Met inclusion, with the MET3 and MET4 groups exhibiting the highest values (p < 0.05; Figure 3C).
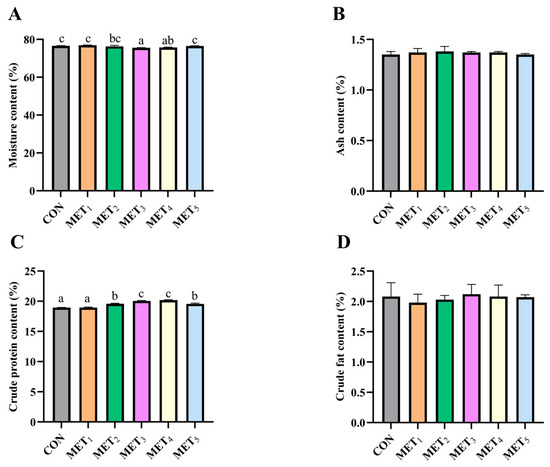
Figure 3.
Effects of methionine supplementation in all-plant-protein diet on muscle nutritional components of juvenile M. amblycephala. (A) moisture content in muscle; (B) crude ash content in muscle; (C) crude protein content in muscle; (D) crude fat content in muscle. The various superscripts represent remarkable differences across six groups (p < 0.05).
As presented in Table 2, the hydrolyzed Met content in muscle increased with rising dietary Met levels and reached a stable phase. The MET2–5 groups showed higher Met levels compared to the CON group (p < 0.05). Among the non-essential amino acids (NEAA), hydrolyzed serine, taurine, and cysteine concentrations initially increased and decreased with higher dietary Met levels. Serine levels were elevated in the MET3–5 groups relative to the CON and MET1 groups (p < 0.05). Taurine concentration reached its highest level in the MET4 group and differed from the values observed in the CON, MET1, MET2, and MET5 groups (p < 0.05). Taurine levels in the MET3 and MET5 groups were also higher than that in the CON, MET1, and MET2 groups (p < 0.05). Cysteine content was higher in the MET4 group and exceeded the levels in the CON and MET1 groups (p < 0.05).
Table 2.
Content of hydrolyzed amino acids in muscle of juvenile M. amblycephala (wet weight).
3.4. Changes in Plasma FAA Profiles in Response to Dietary Met Supplementation
As presented in Table 3, no differences were observed in plasma free Met levels among the groups. However, the levels of histidine, threonine, and arginine were affected by dietary Met content. Dietary Met supplementation induced distinct alterations in the plasma concentrations of FAAs in juvenile M. amblycephala. A progressive increase in plasma taurine levels was observed with increasing Met levels, with the MET4 and MET5 groups showing significantly elevated concentrations relative to the CON and MET1 groups (p < 0.05). Plasma serine levels demonstrated a biphasic trend, increasing initially and declining. The MET2 and MET3 groups displayed the highest serine concentrations, which were statistically greater than those in the CON, MET1, and MET5 groups (p < 0.05), while the MET4 group also showed elevated levels relative to CON and MET1 (p < 0.05).
Table 3.
Content of free amino acids in plasma of juvenile M. amblycephala.
In addition, the levels of plasma free histidine and free threonine were increased across all Met-supplemented groups (p < 0.05), while the arginine level in the MET3 group was significantly higher than in MET4 and MET5 (p < 0.05). Glycine content was significantly higher in the MET1 group than in the CON, MET2, and MET3 groups (p < 0.05). Aspartic acid concentration was significantly reduced in the MET5 group compared to all other treatments (p < 0.05). In case of glutamic acid, plasma concentrations were significantly elevated in the MET3 and MET4 groups in comparison to other groups (p < 0.05). The total FAA levels in all Met-treated groups (MET1–5) were significantly elevated in contrast to the CON group (p < 0.05). A comparable trend was observed for plasma EAA, where MET1–4 groups demonstrated increased concentrations relative to the CON and MET5 groups (p < 0.05).
3.5. Plasma Metabolomic Analysis
Figure 4A shows that partial least squares discriminant analysis (PLS-DA) revealed distinct clustering and separation of plasma metabolites between the CON and MET3 groups, indicating clear metabolic differences. As shown in the volcano plot (Figure 4B), approximately 52 differential metabolites were detected in the MET3 group relative to the CON group, with 26 metabolites showing increased and 26 revealing decreased levels.
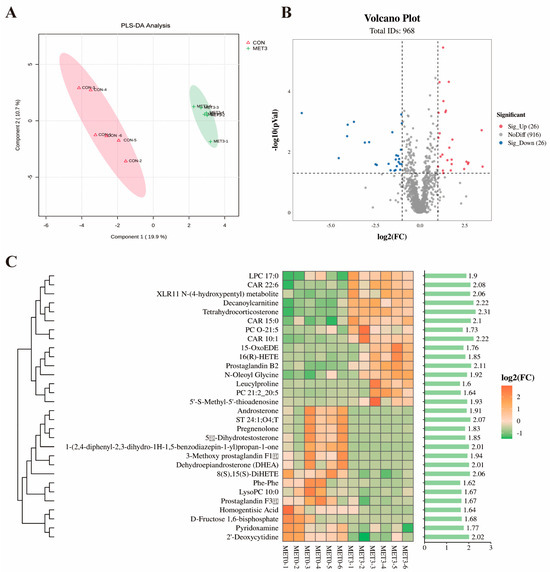
Figure 4.
Plasma metabolomic analysis between CON and MET3 groups. (A) partial least squares discriminant (PLS-DA) analysis: pink represents CON group and green represents MET3 group; (B) volcanic map: red indicates significant increase, blue indicates significant decrease, and gray indicates no significant difference; (C) differential metabolite heatmap and VIP bar graphs: the higher the VIP value, the greater the contribution of metabolites to sample classification.
Based on the absolute value of Log2(MET3/CON), the Heatmap analysis of differential metabolites identified 30 differential metabolites between the MET3 and CON groups, including the top 14 metabolites with significantly increased levels and the top 16 metabolites with significantly decreased levels. As shown in Figure 4C, the metabolites with significantly increased levels in the MET3 group’s plasma included tetrahydrocorticosterone, 16(R)-hydroxyeicosatetraenoic acid (16(R)-HETE), prostaglandin B2, leucylproline, and 5′-S-methyl-5′-thioadenosine (MTA) (p < 0.05), while the metabolites with significantly decreased levels included androsterone, dehydroepiandrosterone (DHEA), lysophosphatidylcholine (LysoPC), prostaglandin F3β, and homogentisic acid (p < 0.05).
3.6. Hepatic m6A Methylation Analysis
An upward adjustment in dietary Met levels was associated with a non-linear pattern in hepatic m6A methylation and SAM content in juvenile M. amblycephala, characterized by an initial decline followed by an elevation. The m6A levels in the MET3 and MET4 groups were lower than those in the CON, MET1, and MET2 groups, while the MET5 group showed reduced levels relative to the CON and MET1 groups. Furthermore, the MET2 group revealed decreased m6A levels in comparison to the CON group (p < 0.05; Figure 5A). Hepatic SAM content in the MET3 group was also lower than that in the CON group (p < 0.05; Figure 5B). The gene-wide distribution of m6A peaks in the CON group revealed that 43% of genes harbored a single m6A modification site, and 87% possessed between one and three sites. A comparable distribution pattern was identified in the MET3 group, where 40% of genes contained a single site and 86% contained one to three sites (Figure 5C). Enrichment analysis of m6A peak locations demonstrated a preferential accumulation at the 3′ UTR initiation sites and the 5′ UTR terminal sites. The coding sequence (CDS) regions displayed a relatively lower peak density. Compared to the CON group, a reduction in m6A peak density at the 3′ UTR start region was observed in the MET3 group (Figure 5D). The proportional distribution of m6A methylation sites in the liver of the CON group was as follows: 38.7% in the CDS region, 27.4% in the terminator region, 14.4% in the start codon region, 14.7% in the 3′ UTR, and 4.8% in the 5′ UTR. In the MET3 group, the proportions were 34.4%, 28.4%, 15.1%, 16.9%, and 5.2%, respectively (Figure 5E). Approximately 20,974 and 22,068 m6A methylation sites were identified in the CON and MET3 groups, respectively, with 4577 sites shared between both groups, as illustrated in Figure 5F. Motif analysis revealed the presence of the common m6A motif GGAC in both the CON and MET3 groups, consistent with the typical m6A modification pattern (Figure 5G).
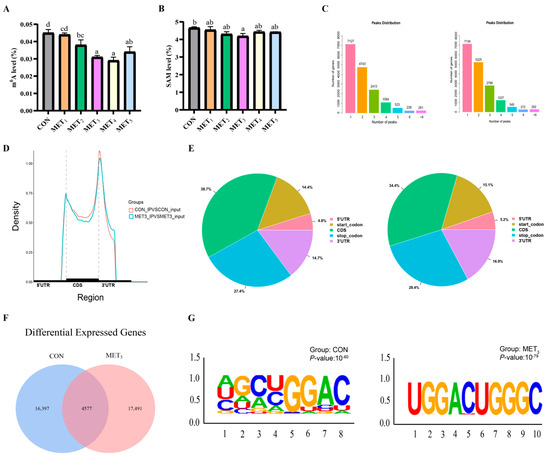
Figure 5.
Hepatic m6A methylation analysis between CON and MET3 groups. For MeRIP-Seq, m6A peaks were identified with exomePeak2 (v1.12.0; p < 1 × 10⁻⁵) and annotated by ANNOVAR (Ver. 20240617). Significant peaks met |log2FC| > 1 and FDR < 0.05. Motifs were discovered with HOMER (v4.11) and visualized via ggseqlogo/ggplot2. Differential peaks were analyzed with DiffBind (v2.8.0). For RNA-Seq, transcripts were assembled with StringTie (v1.3.4), quantified with RSEM (v1.2.19), and DEGs identified with DESeq2 (v1.20.0; |log2FC| ≥ 2, FDR < 0.05). (A) m6A level, the various superscripts represent remarkable differences across six groups (p < 0.05); (B) S-adenosyl methionine content, the various superscripts represent remarkable differences across six groups (p < 0.05); (C) the number of m6A modification sites of CON (left) and MET3 (right) group genes; (D) differences in the cumulative distribution of m6A peaks in the CON and MET3 groups; (E) distribution position of m6A peaks in CON (left) and MET3 (right) groups; (F) Venn diagram of m6A modification sites in mRNAs of CON and MET3 groups; (G) analysis and comparison of m6A motif enrichment in mRNAs of CON and MET3 groups.
3.7. Combined Analysis of m6A-Seq and RNA-Seq
A combined analysis of differentially modified m6A methylation genes and differentially expressed mRNAs between the CON and MET3 groups revealed 284 genes with similar changes in both m6A methylation and transcriptional expression (Figure 6A). These genes were classified into four regulatory categories: a subset of 87 genes, including casp3b, foxo4, and atg9a, showed upregulation of m6A methylation and mRNA expression (Hyper-up); 51 genes, such as cep112, apba1b, and eva1ba, showed increased m6A methylation along with reduced mRNA expression (Hyper-down); 120 genes, including csdc2b, marchf2, and bach1b, demonstrated decreased m6A methylation alongside elevated mRNA expression (Hypo-up); and 26 genes, such as mapta, cadpsb, and cracdlb, displayed downregulation of both m6A methylation and mRNA expression (Hypo-down). KEGG pathway enrichment analysis (Figure 6B) indicated that these overlapping genes were primarily enriched in pathways related to autophagy (Autophagy-Other; Autophagy-Animal), sphingolipid metabolism, hepatocellular carcinoma, and MAPK signaling.
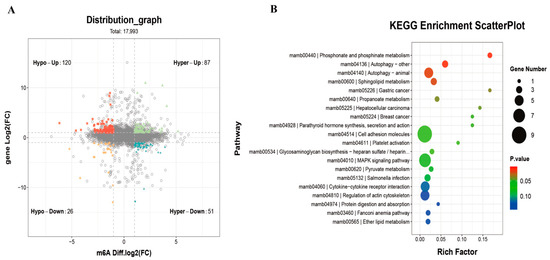
Figure 6.
Association analysis between differential m6A methylation modified genes and differential RNA transcription and expression genes. Functional enrichment of peak-related genes and DEGs was performed using GO.db (v3.14.0) and KEGG (Release 101; adjusted p < 0.05). Differential expression and m6A peaks were further analyzed with edgeR (v4.4.1; |log2FC| > 1, p < 0.05). (A) four quadrant diagram of association analysis between differential m6A methylation modified genes and differential RNA transcription and expression genes; (B) KEGG richness analysis of differential expressing genes by joint m6A-seq and RNA-seq analysis.
3.8. Expression of Regulatory Genes Related to Liver Methylation and Inflammatory Injury
Compared to the CON group, the expression of the methyltransferase watp in the liver of juveniles in the MET3 group was significantly downregulated (p < 0.05, Figure 7A), while the expression of the demethylase fto was upregulated (p < 0.01, Figure 7B). There were no substantial variations in the expression of ythdf2 (p > 0.05, Figure 7C). In comparison to the CON group, the expression of caspase-8 in the liver of juveniles in the MET3 group was significantly downregulated (p < 0.05, Figure 7D). However, the expressions of bcl-2 and foxo4 were upregulated (p < 0.05, Figure 7E,I), and the expressions of sirt1, beclin1, and atg9a were extremely upregulated (p < 0.01, Figure 7F–H). IGV visualization analysis showed the m6A peak expression patterns of atg9a and foxo4. High methylation occurred in the 3′ UTR region of atg9a and foxo4, resulting in changes in gene expression. The expression of atg9a and foxo4 in the MET3 group was substantially higher than in the CON group (Figure 7J,K).
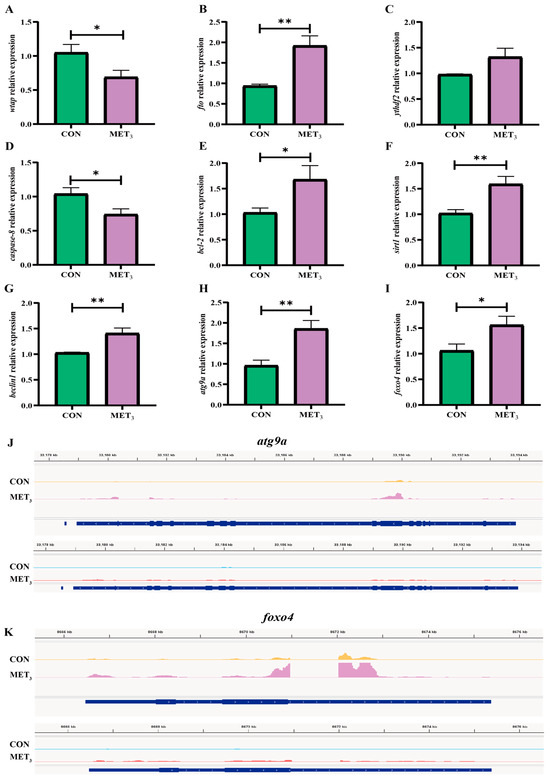
Figure 7.
Expression of regulatory genes related to liver methylation and inflammatory injury. (A) wilms tumor1-associating protein; (B) fat mass and obesity-associated protein; (C) YTH domain family member2; (D) cysteine aspartate-specific protease 8; (E) B-cell lymphoma-2; (F) silent information regulator 1; (G) benzyl chloride 1; (H) autophagy-related protein 9a; (I) forkhead box protein O4; (J,K) peak abundance of m6A (IP, yellow and peak) and expression (Input, blue and red) in atg9a and foxo4 in liver of CON and MET3 groups. * means the significant difference between the two groups (Independent t-test, p < 0.05), and ** means the extremely significant difference between the two groups (Independent t-test, p < 0.01).
4. Discussion
4.1. Effect of Different Met Levels in Plant-Based Diets on Growth Performance and Antioxidant Capacity
Amino acids are essential for protein synthesis and play a critical role in the growth and development of aquatic species. Appropriate dietary methionine (Met) enhances growth in juvenile M. amblycephala under low fishmeal diets, whereas excessive supplementation may inhibit growth [24], a pattern also observed in grouper (Epinephelus coioides) [25], grass carp (Ctenopharyngodon Idella) [26], and black sea bream (Sparus macrocephalus) [27]. Consistent with these findings, Met supplementation in plant-based diets improved growth and reduced feed conversion ratio in this study. Previous studies reported that juvenile M. amblycephala of two sizes groups (3.34 ± 0.03 g and 101.80 ± 1.30 g) require 8.4–8.5 g/kg Met or 7.4–7.6 g/kg in low fishmeal diets [20,21]. Based on secondary regression analysis, the estimated dietary Met requirement for achieving optimal WGR, SGR, and minimum FCR in juvenile M. amblycephala fed all-plant-protein diets was approximately 11 g/kg. These values were higher than typical levels observed in fishmeal-based diets, reflecting the relatively low Met content of plant-derived protein sources. Plasma ALT, AST, and LDH are important indicators of liver health. Higher levels of ALT, AST, and LDH suggest that the liver may be experiencing oxidative stress, leading to functional impairment [23]. Studies have reported that Met can alleviate the increase in ALT and AST levels in the plasma of ricefield eel (Monopterus albus) caused by feeding low-protein diets and improve liver damage induced by low-protein diets [28]. The present study suggested that appropriate Met supplementation (8.6 g/kg and 10.1 g/kg) enhanced hepatic function and improved antioxidant capacity in fish fed plant-based protein diets, as indicated by reduced plasma ALT, AST, and LDH levels.
ROS continuously accumulate in mitochondria under oxidative stress, leading to cell damage [29]. They are primarily generated by mitochondrial complex I and III, with the production sites affected by MMP [30]. MMP plays an essential role in cellular homeostasis as it drives the ATP production in organelles [31]. Aberrant MMP, whether elevated or reduced, has been associated with mitochondrial dysfunction, promoting cellular apoptosis and necrosis [32]. Met restriction has been demonstrated to induce pronounced mitochondrial impairment in human osteosarcoma cells, characterized by a clear reduction in MMP and elevation in ROS generation [33]. In this study, Met supplementation increased the red fluorescence and red-to-green fluorescence ratio in the mitochondrial matrix of juvenile M. amblycephala livers, indicating that MMP became more stable. Similarly, fluorescence detection of ROS in the liver showed that Met supplementation in plant-based diets reduced the liver’s ROS content, especially when the Met level was 10.1 g/kg, which alleviated oxidative stress damage and maintained MMP stability in juvenile M. amblycephala. The findings were consistent with hepatic antioxidant enzyme analysis, indicating that dietary Met supplementation in plant-based formulations enhanced liver antioxidant enzyme activities in juvenile M. amblycephala. Importantly, 10.1 g/kg supplementation levels were associated with elevated CAT activity and T-AOC. Similarly, Met supplementation has been reported to reduce hepatic oxidative stress in large yellow croaker (Larimichthys crocea) subjected to high-fat diets by decreasing MDA concentrations and enhancing T-AOC, thus highlighting hepatic antioxidant defenses [34]. These findings revealed that methionine enhances antioxidant capacity by influencing the SAM/SAH levels and regulating the expressions and activities of antioxidant genes. Simultaneously, elevated methionine promotes the trans-sulfuration pathway, increasing cysteine and glutathione (GSH) levels. Together, these mechanisms link methionine nutrition to epigenetic regulation, mitochondrial performance, and redox homeostasis. Furthermore, this study observed that when the Met content in plant-based diets was high (≥12.5 g/kg), a large amount of MDA was generated in the liver. This phenomenon has been reported in both mammals and aquatic animals, where excessive Met causes damage to rats, increasing ROS content in liver mitochondria and damaging mitochondrial DNA [35]; excessive Met in yellow catfish (Pelteobagrus fulvidraco) diets also induces cell apoptosis [36].
4.2. Effects of Different Met Levels in Plant-Based Protein Diets on Muscle Nutrient Composition and Blood Metabolite Profiles of Juvenile M. amblycephala
Met functions as the initiating amino acid during protein translation and serves as a rate-limiting factor in protein biosynthesis [37]. Adequate Met supplementation in plant-based protein diets has been shown to enhance muscle crude protein content in species such as hybrid crucian carp (Carassius auratus gibelio) and Nile tilapia (Oreochromis niloticus) [5,38]. In this study, it was similarly found that when the Met content in plant-based protein diets ranged from 8.6 g/kg to 14.2 g/kg, the protein content in the muscles of juvenile M. amblycephala substantially increased, suggesting that Met is involved in promoting muscle protein synthesis in juvenile M. amblycephala. Further examination of muscle amino acid composition demonstrated a progressive elevation in Met, taurine, cysteine, and serine concentrations with increasing dietary Met levels. Comparable trends have been reported in other teleost species; for instance, dietary Met supplementation elevated the intramuscular concentrations of free Met, cysteine, and serine in C. idella [26]. In studies of C. auratus gibelio, supplementing Met in low-fishmeal diets improved cysteine deposition in juvenile fish [39]. Furthermore, dietary Met concentration significantly influenced taurine accumulation in C. carpiovar muscle, showing a positive correlation with increased Met levels [11]. This effect may be attributed to the metabolic interconnection among sulfur-containing amino acids, as both taurine and cysteine are involved in the metabolic pathways of Met within the organism. Moreover, Met generates homocysteine through transmethylation, and in the homocysteine metabolic pathway, serine, through remethylation, provides methyl groups for Met synthesis and condenses with homocysteine to form cystathionine [40].
The FAA content in plasma is an important indicator reflecting the protein status of the animal body, as well as amino acid metabolism and consumption [9]. In the present study, elevated dietary Met levels facilitated the accumulation of free taurine in plasma. This observation suggests that the supplemented Met may have undergone metabolic conversion to taurine via the trans-sulfuration pathway in juvenile M. amblycephala. Similarly, supplementing Met in the plant-based protein diet of O. niloticus also increased the plasma taurine content, although the change was not statistically significant [41]. The Met level affects the content of most FAAs in plasma in the diet [42]. In this study, supplementing Met in the plant-based protein diet also caused changes in the plasma levels of histidine, threonine, and other amino acids in juveniles. This may be related to the excess or disproportionate intake of Met, which affects the utilization of other amino acids [43,44]. Moreover, this study found that appropriate Met supplementation could increase the total content of FAA, EAA, and NEAA in the plasma of juvenile M. amblycephala. However, the plasma Met content did not increase with the higher level of Met in the diet. Considering the observed elevation in hydrolyzed Met levels in muscle tissue, it is suggested that Met metabolism varies between blood and muscle. Met is primarily used for protein synthesis within muscle tissue and is metabolized into taurine through the trans-sulfuration pathway in the bloodstream and muscle.
Metabolites are small molecular compounds produced or consumed through metabolic processes in organisms, playing vital roles in energy supply, metabolic regulation, immune regulation, and other functions. 16(R)-HETE is a metabolite of the arachidonic acid metabolic pathway cytochrome P450 (CYP450), involved in blood pressure regulation, lipid synthesis, and inflammatory responses [45]. Studies have found that 16 (R)-HETE can inhibit CYP1A2 activity and reduce cardiac toxicity [46]. Prostaglandin B2, a bioactive lipid mediator derived from arachidonic acid, inhibits the accumulation of cyclic AMP in hepatocytes stimulated by glucagon and has anti-inflammatory effects [47]. Tetrahydrocortisol is a corticosteroid closely related to glucose and lipid metabolism, with anti-inflammatory and immune-regulatory effects [48]. Previous studies have shown that tetrahydrocortisol can alleviate acute skin inflammation in mice [49]. In the present study, plasma concentrations of 16(R)-HETE, prostaglandin B2, and tetrahydrocortisol were substantially elevated in the MET3 group of juvenile M. amblycephala relative to the CON group. These findings suggest that Met supplementation may enhance anti-inflammatory responses and immunological function in juvenile M. amblycephala consuming a plant-based protein diet, thus contributing to improved growth performance. Furthermore, an evident increase in plasma levels of MTA was observed in the MET3 group, along with an evident reduction in LysoPC concentrations. MTA is a metabolite produced through the polyamine pathway from SAM and can regulate cell proliferation, differentiation, and apoptosis processes [50]. MTA is also a protein methyltransferase inhibitor, regulating the transcription and activation of relevant genes by inhibiting H3K4 methylation [51]. LysoPC is a lipid mediator with regulatory functions in epigenetics, including regulating cell apoptosis and signal transduction. Studies have shown that LysoPC can induce cysteine protease-dependent cell death in mouse liver cells and trigger endoplasmic reticulum stress [52]. Therefore, it is predicted that supplementing an appropriate amount of Met in the plant-based protein diet improves resistance to oxidative damage in juvenile M. amblycephala by modulating MTA and LysoPC metabolism and involvement in the methylation pathway.
4.3. Met Regulates Hepatic Autophagy and Apoptosis in Juvenile M. amblycephala by Affecting Liver m6A Methylation Levels
M6A methylation is a key regulatory mechanism in RNA biology, influencing protein synthesis and enabling rapid modulation of dynamic cellular processes [53]. Liver is the primary organ responsible for Met metabolism, and evidence indicates that up to 85% of m6A methylation events and approximately 48% of Met metabolism occur in hepatic tissue [54]. The abundance of m6A reflects the overall methylation status within the examined tissue. SAM, a central metabolite in hepatic Met metabolism, is a crucial methyl donor in the m6A modification pathway [55]. This study found that Met decreased the total m6A levels and SAM content in the liver of juvenile M. amblycephala, which was different from the findings on Salmon alevins. These differences may result from variations in methionine requirements and physiological functions between marine and freshwater fish, or from the different types of methionine supplements (L-Met vs. DL-Met) used in the diets [56,57]. Met mainly participates in four physiological metabolic processes: protein synthesis, methylation, polyamine production, and trans-sulfuration. Combined with the increased muscle protein and plasma taurine content in juvenile M. amblycephala, it is speculated that with appropriate Met supplementation, its primary physiological function may involve protein metabolism and maintaining tissue health homeostasis, decreasing overall liver methylation.
This study further revealed that the m6A peak in the liver of the MET3 group was remarkably reduced in the CDS region and the promoter of the 3′ UTR, suggesting that the demethylation of Met likely occurs in the central region of the gene’s 3′ UTR. This could improve mRNA stability and translation efficiency or alleviate miRNA-mediated suppression of physiological function regulation. Therefore, Met possibly exerts regulatory effects by performing more refined and selective ‘demethylation’ of key genes. Methyltransferases catalyze the methylation activity of m6A modifications, while demethylases catalyze the demethylation of RNA substrates with m6A modifications [18]. Research shows that wtap can promote endoplasmic reticulum stress and apoptosis in cardiomyocytes by downregulating the m6A modification of activating transcription factor4 (atf4) mRNA, causing myocardial damage [58]. In hepatic ischemia–reperfusion injury (IRI), fto expression is significantly downregulated; however, upregulation of fto has been shown to reduce liver IRI by attenuating apoptosis and autophagy [59]. In this study, Met considerably reduced the m6A methylation levels in the liver of juvenile M. amblycephala, along with a significant decrease in wtap and an increase in fto, indicating a synergistic interaction between wtap and fto in the health impairment of juvenile M. amblycephala. Similar studies have also found that [Cu(ttpy-tpp)Br2]Br reduces SAM and S-adenosyl homocysteine levels in liver cells by inhibiting the Met cycle, thus inducing the senescence of cancer cells in the liver [60].
Autophagy represents a highly conserved catabolic mechanism in eukaryotic cells, responsible for the selective degradation and recycling of damaged intracellular components. This process is pivotal in maintaining cellular energy homeostasis and facilitating adaptive responses under conditions of nutritional deprivation [61]. Sirtuins (Sirts), a class of nicotinamide adenine dinucleotide (NAD+)-dependent deacetylases, are crucially involved in the regulation of cell propagation, programmed cell death, and autophagic activity [39]. Sirt1 is the most studied and widely distributed member of the Sirt family and is closely related to autophagy, and the Foxo pathway also involves key physiological processes such as autophagy, differentiation, and oxidative stress. In cancer research, it has been found that foxo4 can inhibit cancer cell proliferation, regulate the cell cycle, and promote autophagy and apoptosis [62]. The Atg ubiquitin-like conjugation system is involved in the autophagy initiation, extension, and maturation stages. Atg9a, an essential integral membrane protein, functions as a central regulatory node in autophagosome membrane biogenesis and is crucially involved in mediating membrane remodeling required for autophagosome closure, thus facilitating the terminal stages of autophagy [63]. Moreover, beclin1 is a specific gene involved in autophagy, which positively regulates the occurrence of autophagy [64]. There is a close relationship between genes regulating autophagy. Sirt1 can upregulate foxo4 expression by regulating the Foxo pathway, thus improving the organism’s ability to resist oxidative stress [65]. Sirt1 induces BCL2 interacting protein 3 (bnip3) expression by deacetylating foxo3, thus triggering autophagy by promoting the dissociation of the anti-apoptotic gene bcl-2 and the beclin1 complex [66]. The Foxo pathway can also upregulate the activation of Atg genes through transcription.
Cellular autophagy and apoptosis are basic regulatory mechanisms by which organisms respond to internal and external stressors. Apoptosis, a tightly controlled form of programmed cell death, is used to preserve cellular homeostasis and eliminate damaged or unwanted cells in a regulated manner. Caspase-8, a member of the cysteine protease family, is considered an apoptosis promoter. Once activated, it can induce cell apoptosis [67]. Evidence indicates that autophagy may be initiated as a cellular adaptive response preceding apoptosis, particularly under growth factor deprivation or exposure to cytotoxic agents, to reduce cellular damage and delay the onset of programmed cell death [68]. Supplementing with Met can reduce the apoptosis signal of aip56 in the head kidney leukocytes of European bass, showing lower cysteine aspartate-specific protease 3 (caspase-3) activity [69]. Curcumin, when used as a methyl donor in cardiomyocytes of diabetic cardiomyopathy mice, has been demonstrated to induce autophagy through activation of the AMPK signaling pathway. This activation facilitates the dissociation of the bcl-2-beclin1 complex, thus attenuating apoptotic processes [70]. In the present study, dietary Met supplementation elicited activation of key autophagy-related sirt1, atg9a, and foxo4 transcription factors in juvenile M. amblycephala maintained on a plant-based diet. This intervention was associated with an elevated expression of the bcl-2 and a reduction in caspase-8 expression. These results indicate that Met may suppress apoptosis by enhancing autophagic mechanisms, thus improving the growth impairment of juveniles caused by feeding a plant-based diet.
5. Conclusions
This study concluded that an optimal dietary Met level of 10.1 g/kg enhances growth rate, improves hematological parameters, and strengthens hepatic antioxidant potential in juvenile M. amblycephala. This supplementation modulates the profiles of muscle hydrolyzed amino acids and plasma free amino acids, elevates plasma metabolites associated with antioxidant, anti-inflammatory, and antibacterial activities, and promotes hepatic autophagy through the wtap/fto demethylation pathway. These effects collectively contribute to reduced hepatocellular apoptosis and improved overall fish health (Figure 8). This study proposes a potential regulatory mechanism linking methionine, m6A methylation, and autophagy/apoptosis. However, functional validation experiments (e.g., gene knockdown or inhibitor treatments) were not conducted to substantiate the causal relationships. Future investigations should incorporate functional assays to validate the roles of key regulatory factors and to further clarify the causal pathways through which methionine modulates m6A methylation and the associated autophagy and apoptosis processes.
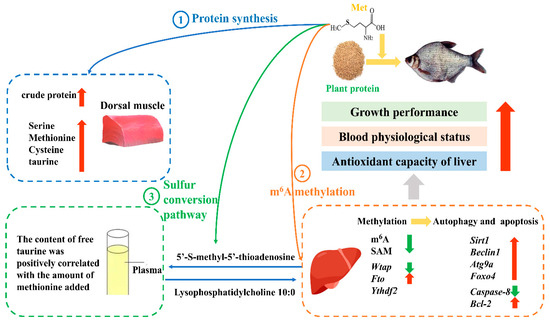
Figure 8.
The epigenetic mechanisms of dietary methionine regulating growth and health in juvenile Megalobrama amblycephala. The red arrows represent the significant increase in indicators, while the green arrows represent the significant decrease in indicators.
Author Contributions
Conceptualization, L.M.; methodology, Q.S., W.J., Y.L. and Z.G.; software, Q.S. and W.J.; validation, Q.S., L.Q., C.X. and Q.R.; formal analysis, Q.S.; investigation, Q.S., L.Q., C.X. and Q.R.; resources, L.M.; data curation, Q.S. and L.M.; writing—original draft preparation, Q.S.; writing—review and editing, S.L., W.J., Y.L., Z.G. and L.M.; visualization, Q.S.; supervision, L.M.; project administration, L.M.; funding acquisition, L.M. All authors have read and agreed to the published version of the manuscript.
Funding
This work was funded by the China Agriculture Research System (CARS-45) and Science and Technology Innovation Team (2023TD63).
Institutional Review Board Statement
The animal study protocol was approved by the Institutional Animal Care and Use Committee of the Freshwater Fisheries Research Center, Chinese Academy of Fishery Sciences (ethical protocol code 2022113015, approved on 1 March 2023). All animal handling and experimental procedures were conducted in accordance with the approved ethical guidelines.
Data Availability Statement
The authors confirm that the data supporting the findings of this study are available within the manuscript and table.
Acknowledgments
We would like to express our sincere gratitude to Zexia Gao for her kind assistance in providing the experimental juvenile fish. We would like to thank the post-graduate students of the Fish Disease and Nutrition Department, Freshwater Fisheries Research Center (FFRC), Chinese Academy of Fishery Sciences (CAFS), China, for their help throughout the research period.
Conflicts of Interest
The authors declare no conflicts of interest.
Abbreviations
The following abbreviations are used in this manuscript:
| 16(R)-HETE | 16(R)-hydroxyeicosatetraenoic acid |
| 8(S),15(S)-DiHETE | 8(S),15(S)-dihydroxyeicosatetraenoic acid |
| Alkbh5 | Alkylation repair homolog 5 |
| ALT | Alanine aminotransferase |
| AST | Aspartate aminotransferase |
| Atf4 | Activating transcription factor4 |
| Atg9a | Autophagy-related protein 9a |
| Bcl-2 | B-cell lymphoma-2 |
| Beclin1 | Benzyl chloride 1 |
| Bnip3 | BCL2interacting protein3 |
| Caspase-3 | Cysteine aspartate-specific protease 3 |
| Caspase-8 | Cysteine aspartate-specific protease 8 |
| CAT | Catalase |
| CDS | Coding sequence |
| CYP | Arachidonic acid metabolic pathway cytochrome P450 |
| DHEA | Dehydroepiandrosterone |
| EAA | Essential amino acid |
| Elavl1 | Embryonic lethal abnormal vision-like protein1 |
| FAA | Free amino acid |
| FBW | Final body weight |
| FCR | Feed conversion ratio |
| Foxo3 | forkhead box protein O 3 |
| Foxo4 | forkhead box protein O 4 |
| Fto | Fat mass and obesity-associated protein |
| GLU | Glucose |
| GSH | Glutathione |
| HAA | Hydrolyzed amino acid |
| HPLC | High-performance liquid chromatography |
| IRI | Ischemia–reperfusion injury |
| LDH | Lactate dehydrogenase |
| LysoPC | Lysophosphatidylcholine |
| m6A | N-methyladenosine |
| MDA | Malondialdehyde |
| Met | Methionine |
| Mettl14 | Methyltransferase like 14 |
| Mettl3 | Methyltransferase like 3 |
| MMP | Mitochondrial membrane potential |
| MTA | 5′-S-methyl-5′-thioadenosine |
| NAD+ | Nicotinamide adenine dinucleotide |
| NEAA | Non-essential amino acids |
| Nrf2 | Nuclear factor erythroid-2-related factor2 |
| PLS-DA | Partial least squares discriminant analysis |
| ROS | Reactive oxygen species |
| SAM | S-adenosylmet |
| SeMet | Selenomethionine |
| SGR | Specific growth rate |
| Sirt1 | Sirtuins silent information regulator 1 |
| T-AOC | Total antioxidant capacity |
| WGR | Weight gain rate |
| Wtap | Wilms tumor1-associating protein |
| Ythdf | YTH domain family member |
Appendix A
Table A1.
Experimental feed formulation and nutritional composition (%, dry basis).
Table A1.
Experimental feed formulation and nutritional composition (%, dry basis).
| Ingredient | CON | MET1 | MET2 | MET3 | MET4 | MET5 |
|---|---|---|---|---|---|---|
| Soybean meal 1 | 20.00 | 20.00 | 20.00 | 20.00 | 20.00 | 20.00 |
| Rapeseed meal 1 | 20.00 | 20.00 | 20.00 | 20.00 | 20.00 | 20.00 |
| Cottonseed meal 1 | 19.00 | 19.00 | 19.00 | 19.00 | 19.00 | 19.00 |
| Cottonseed protein concentrate | 15.00 | 15.00 | 15.00 | 15.00 | 15.00 | 15.00 |
| Wheat flour 1 | 14.00 | 13.75 | 13.50 | 13.25 | 13.00 | 12.75 |
| Rice bran 1 | 1.80 | 1.80 | 1.80 | 1.80 | 1.80 | 1.80 |
| Soybean oil | 6.50 | 6.50 | 6.50 | 6.50 | 6.50 | 6.50 |
| Calcium dihydrogen phosphate | 1.00 | 1.00 | 1.00 | 1.00 | 1.00 | 1.00 |
| Mineral premix 2 | 1.00 | 1.00 | 1.00 | 1.00 | 1.00 | 1.00 |
| Choline chloride | 0.30 | 0.30 | 0.30 | 0.30 | 0.30 | 0.30 |
| Bentonite | 0.20 | 0.20 | 0.20 | 0.20 | 0.20 | 0.20 |
| DMPT | 0.50 | 0.50 | 0.50 | 0.50 | 0.50 | 0.50 |
| lysine | 0.70 | 0.70 | 0.70 | 0.70 | 0.70 | 0.70 |
| Methionine | 0.00 | 0.25 | 0.50 | 0.75 | 1.00 | 1.25 |
| Total | 100.00 | 100.00 | 100.00 | 100.00 | 100.00 | 100.00 |
| Nutritional ingredient | ||||||
| Crude fat | 8.62 | 8.43 | 8.88 | 8.60 | 8.56 | 8.89 |
| Crude protein | 36.43 | 36.36 | 36.95 | 36.36 | 36.39 | 36.92 |
| Gross energy | 17.06 | 17.02 | 16.97 | 16.93 | 16.88 | 16.84 |
Note: 1 Provided by Beijing Dabeinong Technology Group Co., Ltd. (Huaian, China). Soybean meal: crude protein 46.7%, crude fat 4.25%; Rapeseed meal: crude protein 43.9%, crude fat 6.14%; Cottonseed meal: crude protein 55.6%, crude fat 4.49%; Wheat flour: crude protein 17.4%, crude fat 3.95%; Rice bran: crude protein 16.3%, crude fat 21.71%. 2 Provided by Beijing Dabeinong Technology Group Co., Ltd. (Huaian, China). Mineral (g/kg of premix) premix: calcium biphosphate, 20 g; sodium chloride, 2.6 g; potassium chloride, 5 g; magnesium sulfate, 2 g; ferrous sulfate, 0.9 g; zinc sulfate, 0.06 g; cupric sulfate, 0.02 g; manganese sulfate, 0.03 g; sodium selenate, 0.02 g; cobalt chloride, 0.05 g; potassium iodide, 0.004 g.
Table A2.
Primer sequences used for qRT-PCR.
Table A2.
Primer sequences used for qRT-PCR.
| Gene Name | Primer Sequence (5′-3′) | L | E (%) | NCBI Number |
|---|---|---|---|---|
| wtap | F: AGAGCTCAAGAGCAGCCAAG R: GTTCAGAGGCCGTTGAAGGA | 200 | 108.60 | XM_048206845.1 |
| fto | F: GATTCTGCAGCTGGTGGACT R: GTCTGTCTGTGCTGCTGTCT | 181 | 103.50 | XM_048184627.1 |
| alkbh5 | F: GATCGATGAGGTGGTTGCCA R: TACGTGTAGCCCTCTCCGAA | 105 | 109.20 | XM_048197746.1 |
| ythdf2 | F: GGACAAGTGGAAGGGACGTT R: TCCAGTGGAACCTCCTGAGT | 141 | 100.40 | XM_048191909.1 |
| caspase-8 | F: GCAGATGGACAAGGGAACG R: TGGCGAAAGGACTGGTAATG | 137 | 109.80 | XM_048200598.1 |
| bcl-2 | F: CGTCTACCTGGACAACCACA R: GCGTTTCTGTGCAATGAGTG | 190 | 106.50 | XM_048179299.1 |
| sirt1 | F: TCGGTTCATTCAGCAGCACA R: ATGATGATCTGCCACAGCGT | 120 | 102.90 | XM_048203988.1 |
| beclin1 | F: ATGAAAGCACGATGGAGGGTT R: CCCTCGCTGCTATCCAACTG | 187 | 109.40 | XM_048187618.1 |
| foxo4 | F: GCTTCACAGGGATCCACTCC R: AGCTTGGCTGCTGGACATAG | 282 | 109.40 | XM_048175885.1 |
| atg9a | F: TCTACCTGTGCGCTTTCGTT R: CGGTTCCCTCCACGTTTGTA | 156 | 108.80 | XM_048200701.1 |
| β-actin | F: TCGTCCACCGCAAATGCTTCTA R: CCGTCACCTTCACCGTTCCAGT | 152 | 106.60 | AY170122.2 |
Note: F: forward primer; R: reverse primer; L: amplification sequence length; E: amplification efficiency
Appendix B
Appendix B.1. Supplementary Explanation on Water Quality Index of the Feeding Trial
One-third of the tank water was replaced bi-daily to maintain optimal water conditions during the feeding trial. Water quality was monitored weekly, with the following parameters maintained: 26–28 °C temperature, dissolved O2 concentration ≥ 6 mg/L, ammonia nitrogen levels ≤ 0.05 mg/L, pH between 7.0 and 7.5, and a photoperiod simulating the natural light-dark cycle (12 h light:12 h dark).
Appendix B.2. Supplementary Explanation on Sample Collection Procedures
Plasma was separated by centrifugation (3000 rpm, 10 min, 4 °C) and divided into three aliquots (−20 °C for biochemical analysis; −80 °C for free amino acids (FAA) and metabolite analyses). Liver tissues from three randomly selected fish per tank were excised and divided into five portions. One portion was stored at −20 °C for antioxidant capacity analysis, while the remaining four were stored at −80 °C for total m6A level quantification, SAM content measurement, gene expression profiling, and m6A methylome analysis. Dorsal muscle samples were collected post skin removal (both flanks) and stored at −80 °C for amino acid hydrolysis. Moreover, three other fish were selected from each tank for immediate liver dissection, and mitochondrial membrane potential (MMP) and reactive oxygen species (ROS) levels were measured.
Appendix B.3 Supplementary Explanation on Sample Treatment Procedures for Hydrolyzed Amino Acids (HAA) and Free Amino Acids (FAA) Analysis
The amino acid composition and muscle content (including taurine) were quantified after acid hydrolysis. Muscle samples (0.1 g) were treated with 8 mL of 6 M HCl, flushed with N2 gas, and hydrolyzed at 120 °C for 22–24 h. After hydrolysis, 4.8 mL of 10 M NaOH was added for neutralization, followed by dilution to 25 mL with distilled water. The solution was filtered through double-layer filter paper, and the HAA were analysed using an amino acid analyser (Agilent 1100, USA).
High-performance liquid chromatography (HPLC) was used to measure FAA composition and content in plasma. Plasma samples were diluted with an equal volume of 10 g/100 mL trichloroacetic acid (final concentration: 5%) and filtered using double-layer filter paper. Filtrates were analyzed using a Waters 2695 HPLC system (USA). Mobile phase A consisted of 0.0225% (v/v) triethylamine and 0.8% (m/v) sodium acetate, while mobile phase B comprised a mixture of 2% (m/v) sodium acetate buffer (pH 7.2), acetonitrile, and methanol in a 1:2:2 (v/v) ratio.
Appendix B.4. Supplementary Explanation on Plasma Metabolomics Analysis Procedures
Plasma metabolites were analyzed using LC-MS. Plasma samples (100 μL) were mixed with 400 μL of 80% methanol aqueous solution, vortexed, and centrifuged for 20 min at 15,000× g. A portion of the supernatant was then diluted with mass spectrometry-grade water to adjust the methanol concentration to 53%, followed by a second centrifugation at 15,000× g for 20 min. The final supernatant was examined for LC-MS analysis using a Vanquish UHPLC system coupled with a mass spectrometer (Q Exactive™ HF-X, Germany).
Appendix B.5. Supplementary Explanation on Hepatic m6A Level and SAM Content Analysis Procedures
Total RNA was isolated from hepatic tissue via the RNAiso Plus extraction kit (TaKaRa, Dalian, China) as per the manufacturer’s protocol. The concentration and purity of the extracted RNA were evaluated using a NanoDrop ND-1000 UV-Vis spectrophotometer (NanoDrop Technologies, Wilmington, DE, USA). An RNA input of 200 ng was used to quantify N6-methyladenosine (m6A) modifications in hepatic RNA using the EpiQuik™ m6A RNA Methylation Quantification Kit (Colorimetric; Beijing Chunye Technology Co., Ltd.). The assay procedure included sequential steps of RNA immobilization (binding to assay wells), m6A-specific antibody capture, and signal detection based on colorimetric reading for quantitative analysis.
Liver SAM content was quantified using an ELISA-based approach. Liver tissues (0.1 g) were homogenized in 0.9 mL of sterile physiological saline (4 °C) and processed in an ice bath. The homogenate was spun at 3000 rpm for 10 min to obtain a 10% liver homogenate and quantified using a fish SAM ELISA kit (Shanghai ChaoRui Biotechnology Co., Ltd.). Tissue homogenate, standard solutions, and HRP-labeled detection antibodies were sequentially added to SAM antibody-coated wells. After incubation and washing, TMB substrate was added for chromogenic development. Absorbance was recorded at 450 nm using a microplate reader, and SAM concentrations were calculated accordingly.
Appendix B.6. Supplementary Explanation on Hepatic Gene Expression Analysis Procedures
Gene expression levels in liver tissue were determined via qRT-PCR analysis. Total content of RNA was extracted using the RNAiso Plus kit (TaKaRa Biotech Co., Ltd., Dalian, China) as per the manufacturer’s protocol. The concentration and purity of extracted RNA were evaluated using a NanoDrop ND-1000 UV-Vis spectrophotometer (NanoDrop Technologies, Wilmington, DE, USA). First-strand cDNA was synthesized from the purified RNA using the PrimeScript™ RT reagent kit (TaKaRa Biotech Co., Ltd., Dalian, China). Target gene transcripts were quantified using a CFX96 Touch real-time PCR detection system (Bio-Rad, USA). Primers were designed using the NCBI Primer Blast tool (Table A2) and synthesised by Shanghai BioEngineering Co., Ltd. β-actin was selected as the housekeeping gene, and relative transcription levels were analyzed using the 2−ΔΔCT method.
References
- Serra, V.; Pastorelli, G.; Tedesco, D.E.A.; Turin, L.; Guerrini, A. Alternative protein sources in aquafeed: Current scenario and future perspectives. Vet. Anim. Sci. 2024, 25, 100381. [Google Scholar] [CrossRef]
- Daniel, N. A review on replacing fish meal in aqua feeds using plant protein sources. Int. J. Fish. Aquat. Stud. 2018, 6, 164–179. [Google Scholar]
- Terova, G.; Ceccotti, C.; Ascione, C.; Gasco, L.; Rimoldi, S. Effects of partially defatted hermetia illucens meal in rainbow trout diet on hepatic methionine metabolism. Animals 2020, 10, 1059. [Google Scholar] [CrossRef]
- Hussain, S.M.; Bano, A.A.; Ali, S.; Rizwan, M.; Adrees, M.; Zahoor, A.F.; Sarker, P.K.; Hussain, M.; Arsalan, M.Z.-H.; Yong, J.W.H. Substitution of fishmeal: Highlights of potential plant protein sources for aquaculture sustainability. Heliyon 2024, 10, e26573. [Google Scholar] [CrossRef]
- Du, Y.; Lin, X.; Shao, X.; Zhao, J.; Xu, H.; de Cruz, C.R.; Xu, Q. Effects of supplementing coated methionine in a high plant-protein diet on growth, antioxidant capacity, digestive enzymes activity and expression of TOR signaling pathway associated genes in gibel carp, Carassius auratus gibelio. Front. Immunol. 2024, 15, 1319698. [Google Scholar] [CrossRef] [PubMed]
- Shan, L.-L.; Li, X.-Q.; Zheng, X.-M.; Gan, T.; Guo, T.; Leng, X.-J. Effects of feed processing and forms of dietary methionine on growth and IGF-1 expression in Jian carp. Aquac. Res. 2017, 48, 56–67. [Google Scholar] [CrossRef]
- Chen, Z.; Liu, Y.; Li, Y.; Yang, P.; Hu, H.; Yu, G.; Ai, Q.; Xu, W.; Zhang, W.; Zhang, Y. Dietary arginine supplementation mitigates the soybean meal induced enteropathy in juvenile turbot, Scophthalmus maximus L. Aquac. Res. 2018, 49, 1535–1545. [Google Scholar]
- Li, P.; Yin, Y.-L.; Li, D.; Kim, S.W.; Wu, G. Amino acids and immune function. Br. J. Nutr. 2007, 98, 237–252. [Google Scholar] [CrossRef] [PubMed]
- Wu, G. Amino acids: Metabolism, functions, and nutrition. Amino Acids 2009, 37, 1–17. [Google Scholar] [CrossRef] [PubMed]
- Wang, L.; Gao, C.; Wang, B.; Wang, C.; Sagada, G.; Yan, Y. Methionine in fish health and nutrition: Potential mechanisms, affecting factors, and future perspectives. Aquaculture 2023, 568, 739310. [Google Scholar] [CrossRef]
- Zhou, Y.; He, J.; Su, N.; Masagounder, K.; Xu, M.; Chen, L.; Liu, Q.; Ye, H.; Sun, Z.; Ye, C. Effects of DL-methionine and a methionine hydroxy analogue (MHA-Ca) on growth, amino acid profiles and the expression of genes related to taurine and protein synthesis in common carp (Cyprinus carpio). Aquaculture 2021, 532, 735962. [Google Scholar] [CrossRef]
- Feng, Y.; Yang, L.; Zhu, Y.W.; Wang, W.C. Methionine regulates the major physiological functions of animals. Sci. Sin. Vitae 2019, 49, 228–237. [Google Scholar] [CrossRef]
- Martínez, Y.; Li, X.; Liu, G.; Bin, P.; Yan, W.; Más, D.; Valdivié, M.; Hu, C.-A.A.; Ren, W.; Yin, Y. The role of methionine on metabolism, oxidative stress, and diseases. Amino Acids 2017, 49, 2091–2098. [Google Scholar] [CrossRef] [PubMed]
- Pan, Y.; Ma, P.; Liu, Y.; Li, W.; Shu, Y. Multiple functions of m6A RNA methylation in cancer. J. Hematol. Oncol. 2018, 11, 48. [Google Scholar] [CrossRef] [PubMed]
- Chen, X.-Y.; Zhang, J.; Zhu, J.-S. The role of m6A RNA methylation in human cancer. Mol. Cancer 2019, 18, 103. [Google Scholar] [CrossRef]
- Zhang, C.; Fu, J.; Zhou, Y. A review in research progress concerning m6A methylation and immunoregulation. Front. Immunol. 2019, 10, 922. [Google Scholar] [CrossRef]
- Gebeyew, K.; Yang, C.; Mi, H.; Cheng, Y.; Zhang, T.; Hu, F.; Yan, Q.; He, Z.; Tang, S.; Tan, Z. Lipid metabolism and m6A RNA methylation are altered in lambs supplemented rumen-protected methionine and lysine in a low-protein diet. J. Anim. Sci. Biotechnol. 2022, 13, 85. [Google Scholar] [CrossRef]
- Li, S.; Wang, Y.; Xu, A.; Zhao, B.; Xia, Y.; He, Y.; Xue, H.; Li, S. Dietary selenomethionine reduced oxidative stress by resisting METTL3-mediated m6A methylation level of Nrf2 to ameliorate LPS-induced liver necroptosis in laying hens. J. Nutr. Biochem. 2024, 125, 109563. [Google Scholar] [CrossRef]
- Miao, L.-H.; Lin, Y.; Pan, W.-J.; Huang, X.; Ge, X.-P.; Ren, M.-C.; Zhou, Q.-L.; Liu, B. Identification of differentially expressed microRNAs associate with glucose metabolism in different organs of blunt snout bream (Megalobrama amblycephala). Int. J. Mol. Sci. 2017, 18, 1161. [Google Scholar] [CrossRef] [PubMed]
- Liao, Y.J.; Ren, M.C.; Liu, B.; Sun, S.M.; Cui, H.H.; Xie, J.; Zhou, Q.L.; Pan, L.K.; Chen, R.L.; Ge, X.P. Dietary methionine requirement of juvenile blunt snout bream (Megalobrama amblycephala) at a constant dietary cystine level. Aquac. Nutr. 2014, 20, 741–752. [Google Scholar] [CrossRef]
- Liang, H.-L.; Ren, M.-C.; Habte-Tsion, H.-M.; Mi, H.-F.; Ge, X.-P.; Xie, J.; Xi, B.-W.; Zhou, Q.-L.; Miao, L.-H. Dietary methionine requirement of pre-adult blunt snout bream, (Megalobrama amblycephala Yih, 1955). J. Appl. Ichthyol. 2016, 32, 1171–1178. [Google Scholar] [CrossRef]
- Fan, C.; Ma, Y.; Chen, S.; Zhou, Q.; Jiang, H.; Zhang, J.; Wu, F. Comprehensive Analysis of the Transcriptome-Wide m6A Methylation Modification Difference in Liver Fibrosis Mice by High-Throughput m6A Sequencing. Front. Cell Dev. Biol. 2021, 9, 767051. [Google Scholar] [CrossRef]
- Jiang, W.; Lin, Y.; Qian, L.; Lu, S.; Shen, H.; Ge, X.; Miao, L. Mulberry Leaf Polysaccharides Attenuate Oxidative Stress Injury in Peripheral Blood Leukocytes by Regulating Endoplasmic Reticulum Stress. Antioxidants 2024, 13, 136. [Google Scholar] [CrossRef]
- Ji, K.; Liang, H.; Ren, M.; Ge, X.; Pan, L.; Yu, H. Nutrient metabolism in the liver and muscle of juvenile blunt snout bream (Megalobrama amblycephala) in response to dietary methionine levels. Sci. Rep. 2021, 11, 23843. [Google Scholar] [CrossRef]
- Luo, Z.; Liu, Y.; Mai, K.; Tian, L.; Yang, H.; Tan, X.; Liu, D. Dietary L-methionine requirement of juvenile grouper Epinephelus coioides at a constant dietary cystine level. Aquaculture 2005, 249, 409–418. [Google Scholar] [CrossRef]
- Fang, C.-C.; Feng, L.; Jiang, W.-D.; Wu, P.; Liu, Y.; Kuang, S.-Y.; Tang, L.; Liu, X.-A.; Zhou, X.-Q. Effects of dietary methionine on growth performance, muscle nutritive deposition, muscle fibre growth and type I collagen synthesis of on-growing grass carp (Ctenopharyngodon idella). Br. J. Nutr. 2021, 126, 321–336. [Google Scholar] [CrossRef] [PubMed]
- Zhou, F.; Xiao, J.X.; Hua, Y.; Ngandzali, B.O.; Shao, Q.J. Dietary l-methionine requirement of juvenile black sea bream (Sparus macrocephalus) at a constant dietary cystine level. Aquac. Nutr. 2011, 17, 469–481. [Google Scholar] [CrossRef]
- Hu, Y.; Cai, M.; Zhong, H.; Chu, W.; Hu, Y. A study on how methionine restriction decreases the body’s hepatic and lipid deposition in rice field Eel (Monopterus albus). Int. J. Mol. Sci. 2021, 22, 13379. [Google Scholar] [CrossRef] [PubMed]
- Lu, Y.; Wu, Z.; Song, Z.; Xiao, P.; Liu, Y.; Zhang, P.; You, F. Insight into the heat resistance of fish via blood: Effects of heat stress on metabolism, oxidative stress and antioxidant response of olive flounder Paralichthys olivaceus and turbot Scophthalmus maximus. Fish Shellfish Immunol. 2016, 58, 125–135. [Google Scholar] [CrossRef] [PubMed]
- Hernansanz-Agustín, P.; Enríquez, J.A. Generation of reactive oxygen species by mitochondria. Antioxidants 2021, 10, 415. [Google Scholar] [CrossRef]
- Correia-Álvarez, E.; Keating, J.E.; Glish, G.; Tarran, R.; Sassano, M.F. Reactive oxygen species, mitochondrial membrane potential, and cellular membrane potential are predictors of e-liquid induced cellular toxicity. Nicotine Tob. Res. 2020, 22, S4–S13. [Google Scholar] [CrossRef]
- Li, X.; Zhao, Y.; Yin, J.; Lin, W. Organic fluorescent probes for detecting mitochondrial membrane potential. Coord. Chem. Rev. 2020, 420, 213419. [Google Scholar] [CrossRef]
- Zhang, X.; Zhao, Z.; Wang, X.; Zhang, S.; Zhao, Z.; Feng, W.; Xu, L.; Nie, J.; Li, H.; Liu, J. Deprivation of methionine inhibits osteosarcoma growth and metastasis via C1orf112-mediated regulation of mitochondrial functions. Cell Death Dis. 2024, 15, 349. [Google Scholar] [CrossRef]
- Li, J.; Xu, W.; Lai, W.; Kong, A.; Zhang, Z.; Pang, Y.; Wang, Z.; Shentu, J.; Wu, X.; Mai, K. Effect of dietary methionine on growth performance, lipid metabolism and antioxidant capacity of large yellow croaker (Larimichthys crocea) fed with high lipid diets. Aquaculture 2021, 536, 736388. [Google Scholar] [CrossRef]
- Gomez, J.; Caro, P.; Sanchez, I.; Naudi, A.; Jove, M.; Portero-Otin, M.; Lopez-Torres, M.; Pamplona, R.; Barja, G. Effect of methionine dietary supplementation on mitochondrial oxygen radical generation and oxidative DNA damage in rat liver and heart. J. Bioenerg. Biomembr. 2009, 41, 309–321. [Google Scholar] [CrossRef]
- Song, Y.-F.; Gao, Y.; Hogstrand, C.; Li, D.-D.; Pan, Y.-X.; Luo, Z. Upstream Regulators of Apoptosis Mediates Methionine-Induced Changes of Lipid Metabolism. Cellular Signalling 2018, 51, 176–190. [Google Scholar] [CrossRef]
- Yun, Y.; Song, D.; He, Z.; Mi, J.; Wang, L.; Nie, G. Effects of methionine supplementation in plant protein based diet on growth performance and fillet quality of juveniles Yellow River carp (Cyprinus carpio haematopterus). Aquaculture 2022, 549, 737810. [Google Scholar] [CrossRef]
- Teodósio, R.; Engrola, S.; Cabano, M.; Colen, R.; Masagounder, K.; Aragão, C. Metabolic and nutritional responses of Nile tilapia juveniles to dietary methionine sources. Br. J. Nutr. 2022, 127, 202–213. [Google Scholar] [CrossRef] [PubMed]
- Liu, Y.; Qian, R.; Xu, Q.; Zhao, J. Integrative Metabolomic and Transcriptomic Analyses Reveal the Impact of Methionine Supplementation to Gibel Carp (Carassius auratus gibelio). Fishes 2025, 10, 203. [Google Scholar] [CrossRef]
- Sim, W.-C.; Han, I.; Lee, W.; Choi, Y.-J.; Lee, K.-Y.; Kim, D.G.; Jung, S.-H.; Oh, S.-H.; Lee, B.-H. Inhibition of homocysteine-induced endoplasmic reticulum stress and endothelial cell damage by l-serine and glycine. Toxicol. Vitr. 2016, 34, 138–145. [Google Scholar] [CrossRef]
- Michelato, M.; Furuya, W.M.; Gatlin, D.M., III. Metabolic responses of Nile tilapia Oreochromis niloticus to methionine and taurine supplementation. Aquaculture 2018, 485, 66–72. [Google Scholar] [CrossRef]
- Nwanna, L.C.; Lemme, A.; Metwally, A.; Schwarz, F.J. Response of common carp (Cyprinus carpio L.) to supplemental DL-methionine and different feeding strategies. Aquaculture 2012, 356, 365–370. [Google Scholar] [CrossRef]
- Choo, P.-S.; Smith, T.K.; Cho, C.Y.; Ferguson, H.W. Dietary excesses of leucine influence growth and body composition of rainbow trout. J. Nutr. 1991, 121, 1932–1939. [Google Scholar] [CrossRef] [PubMed]
- Coloso, R.M.; Murillo-Gurrea, D.P.; Borlongan, I.G.; Catacutan, M.R. Sulphur amino acid requirement of juvenile Asian sea bass Lates calcarifer. J. Appl. Ichthyol. 1999, 15, 54–58. [Google Scholar] [CrossRef]
- Somani, S.T.; Zeigler, M.; Fay, E.E.; Leahy, M.; Bermudez, B.; Totah, R.A.; Hebert, M.F. Changes in erythrocyte membrane epoxyeicosatrienoic, dihydroxyeicosatrienoic, and hydroxyeicosatetraenoic acids during pregnancy. Life Sci. 2021, 264, 118590. [Google Scholar] [CrossRef]
- Hidayat, R.; El-Ghiaty, M.A.; Shoieb, S.M.; Alqahtani, M.A.; El-Kadi, A.O. The effects of 16-HETE enantiomers on hypertrophic markers in human fetal ventricular cardiomyocytes, RL-14 cells. Eur. J. Drug Metab. Pharmacokinet. 2023, 48, 709–722. [Google Scholar] [CrossRef]
- Krzystek-Korpacka, M.; Fleszar, M.G.; Fortuna, P.; Gostomska-Pampuch, K.; Lewandowski, Ł.; Piasecki, T.; Kosyk, B.; Szeląg, A.; Trocha, M. Modulation of prostanoids profile and counter-regulation of SDF-1α/CXCR4 and VIP/VPAC2 expression by sitagliptin in non-diabetic rat model of hepatic ischemia-reperfusion injury. Int. J. Mol. Sci. 2021, 22, 13155. [Google Scholar] [CrossRef]
- Sherlock, M.; Behan, L.A.; Hannon, M.J.; Alonso, A.A.; Thompson, C.J.; Murray, R.D.; Crabtree, N.; Hughes, B.A.; Arlt, W.; Agha, A. The modulation of corticosteroid metabolism by hydrocortisone therapy in patients with hypopituitarism increases tissue glucocorticoid exposure. Eur. J. Endocrinol. 2015, 173, 583–593. [Google Scholar] [CrossRef]
- Gastaldello, A.; Livingstone, D.E.; Abernethie, A.J.; Tsang, N.; Walker, B.R.; Hadoke, P.W.; Andrew, R. Safer topical treatment for inflammation using 5α-tetrahydrocorticosterone in mouse models. Biochem. Pharmacol. 2017, 129, 73–84. [Google Scholar] [CrossRef]
- Sun, Y.; Wang, X.; Zhou, Y.; Zhang, J.; Cui, W.; Wang, E.; Du, J.; Wei, B.; Xu, X. Protective effect of metformin on BPA-induced liver toxicity in rats through upregulation of cystathionine β synthase and cystathionine γ lyase expression. Sci. Total Environ. 2021, 750, 141685. [Google Scholar] [CrossRef]
- Zhao, S.; Zhong, Y.; Fu, X.; Wang, Y.; Ye, P.; Cai, J.; Liu, Y.; Sun, J.; Mei, Z.; Jiang, Y. H3K4 methylation regulates LPS-induced proinflammatory cytokine expression and release in macrophages. Shock 2019, 51, 401–406. [Google Scholar] [CrossRef] [PubMed]
- Kakisaka, K.; Cazanave, S.C.; Fingas, C.D.; Guicciardi, M.E.; Bronk, S.F.; Werneburg, N.W.; Mott, J.L.; Gores, G.J. Mechanisms of lysophosphatidylcholine-induced hepatocyte lipoapoptosis. Am. J. Physiol.-Gastrointest. Liver Physiol. 2012, 302, G77–G84. [Google Scholar] [CrossRef] [PubMed]
- Kahl, M.; Xu, Z.; Arumugam, S.; Edens, B.M.; Fischietti, M.; Zhu, A.C.; Platanias, L.C.; He, C.; Zhuang, X.; Ma, Y.C. m6A RNA methylation regulates mitochondrial function. Hum. Mol. Genet. 2024, 33, 969–980. [Google Scholar] [CrossRef]
- Li, T.; Tan, Y.-T.; Chen, Y.-X.; Zheng, X.-J.; Wang, W.; Liao, K.; Mo, H.-Y.; Lin, J.; Yang, W.; Piao, H.-L. Methionine deficiency facilitates antitumour immunity by altering m6A methylation of immune checkpoint transcripts. Gut 2023, 72, 501–511. [Google Scholar] [CrossRef]
- Xing, Z.; Tu, B.P. Mechanisms and rationales of SAM homeostasis. Trends Biochem. Sci. 2025, 50, 242–254. [Google Scholar] [CrossRef]
- Kwasek, K.; Terova, G.; Lee, B.-J.; Bossi, E.; Saroglia, M.; Dabrowski, K. Dietary methionine supplementation alters the expression of genes involved in methionine metabolism in salmonids. Aquaculture 2014, 433, 223–228. [Google Scholar] [CrossRef]
- Ceccotti, C.; Biasato, I.; Gasco, L.; Caimi, C.; Bellezza Oddon, S.; Rimoldi, S.; Brambilla, F.; Terova, G. How different dietary methionine sources could modulate the hepatic metabolism in rainbow trout? Curr. Issues Mol. Biol. 2022, 44, 3238–3252. [Google Scholar] [CrossRef]
- Wang, J.; Zhang, J.; Ma, Y.; Zeng, Y.; Lu, C.; Yang, F.; Jiang, N.; Zhang, X.; Wang, Y.; Xu, Y. WTAP promotes myocardial ischemia/reperfusion injury by increasing endoplasmic reticulum stress via regulating m6A modification of ATF4 mRNA. Aging 2021, 13, 11135. [Google Scholar] [CrossRef]
- Wang, P.-X.; Zhu, L.; Xiang, M.; Zhang, R.; Zheng, X.; Zheng, Z.; Li, K. FTO Alleviates Hepatic Ischemia-Reperfusion Injury by Regulating Apoptosis and Autophagy. Gastroenterol. Res. Pract. 2025, 2025, 5587859. [Google Scholar] [CrossRef] [PubMed]
- Jin, C.; Li, Y.; Su, Y.; Guo, Z.; Wang, X.; Wang, S.; Zhang, F.; Zhang, Z.; Shao, J.; Zheng, S. Novel copper complex CTB regulates methionine cycle induced TERT hypomethylation to promote HCC cells senescence via mitochondrial SLC25A26. Cell Death Dis. 2020, 11, 844. [Google Scholar] [CrossRef]
- Chen, L.; Liu, Y.; Zhang, J.; Song, T.; Wu, J.; Ren, Z. AMPK regulates ARF1 localization to membrane contact sites to facilitate fatty acid transfer between lipid droplets and mitochondria. Cell Death Dis. 2025, 16, 623. [Google Scholar] [CrossRef]
- Farhan, M.; Silva, M.; Li, S.; Yan, F.; Fang, J.; Peng, T.; Hu, J.; Tsao, M.-S.; Little, P.; Zheng, W. The role of FOXOs and autophagy in cancer and metastasis—Implications in therapeutic development. Med. Res. Rev. 2020, 40, 2089–2113. [Google Scholar] [CrossRef]
- Javed, R.; Mari, M.; Trosdal, E.; Duque, T.; Paddar, M.A.; Allers, L.; Mudd, M.H.; Claude-Taupin, A.; Akepati, P.R.; Hendrix, E. ATG9A facilitates the closure of mammalian autophagosomes. J. Cell Biol. 2025, 224, e202404047. [Google Scholar] [CrossRef] [PubMed]
- Liu, M.; Chen, Y.; Fan, X.; Gu, J.; Xing, S. Beclin1-mediated vascular autophagy negatively regulates angiogenesis and secondary neural damage in the thalamus following cerebral cortical infarction. IBRO Neurosci. Rep. 2025, 19, 290–299. [Google Scholar] [CrossRef]
- Gupta, S.; Afzal, M.; Agrawal, N.; Almalki, W.H.; Rana, M.; Gangola, S.; Chinni, S.V.; Kumar, K.B.; Ali, H.; Singh, S.K. Harnessing the FOXO-SIRT1 axis: Insights into cellular stress, metabolism, and aging. Biogerontology 2025, 26, 65. [Google Scholar] [CrossRef]
- Kim, J.Y.; Mondaca-Ruff, D.; Singh, S.; Wang, Y. SIRT1 and autophagy: Implications in endocrine disorders. Front. Endocrinol. 2022, 13, 930919. [Google Scholar] [CrossRef]
- Li, X.; Zheng, S.; Ma, X.; Cheng, K.; Wu, G. Use of alternative protein sources for fishmeal replacement in the diet of largemouth bass (Micropterus salmoides). Part I: Effects of poultry by-product meal and soybean meal on growth, feed utilization, and health. Amino Acids 2021, 53, 33–47. [Google Scholar] [CrossRef] [PubMed]
- Wang, M.; Chen, X.; Li, S.; Wang, L.; Tang, H.; Pu, Y.; Zhang, D.; Fang, B.; Bai, X. A crosstalk between autophagy and apoptosis in intracerebral hemorrhage. Front. Cell. Neurosci. 2024, 18, 1445919. [Google Scholar] [CrossRef] [PubMed]
- Machado, M.; Serra, C.R.; Oliva-Teles, A.; Costas, B. Methionine and tryptophan play different modulatory roles in the European seabass (Dicentrarchus labrax) innate immune response and apoptosis signaling—An in vitro study. Front. Immunol. 2021, 12, 660448. [Google Scholar] [CrossRef]
- Yao, Q.; Ke, Z.; Guo, S.; Yang, X.; Zhang, F.; Liu, X.; Chen, X.; Chen, H.; Ke, H.; Liu, C. Curcumin protects against diabetic cardiomyopathy by promoting autophagy and alleviating apoptosis. J. Mol. Cell. Cardiol. 2018, 124, 26–34. [Google Scholar] [CrossRef]


Disclaimer/Publisher’s Note: The statements, opinions and data contained in all publications are solely those of the individual author(s) and contributor(s) and not of MDPI and/or the editor(s). MDPI and/or the editor(s) disclaim responsibility for any injury to people or property resulting from any ideas, methods, instructions or products referred to in the content. |
© 2025 by the authors. Licensee MDPI, Basel, Switzerland. This article is an open access article distributed under the terms and conditions of the Creative Commons Attribution (CC BY) license (https://creativecommons.org/licenses/by/4.0/).