Article

Chestnut Wood Mud as a Source of Ellagic Acid for Dermo-Cosmetic Applications

1
Department of Chemical Sciences, University of Naples “Federico II”, Via Cintia 4, I-80126 Naples, Italy
2
Centro Ricerche per la Chimica Fine Srl for Silvateam Spa, Via Torre 7, I-12080 San Michele Mondovì, Italy
3
Department of Scienze della Vita e dell’Ambiente, Sezione di Scienze del Farmaco, University of Cagliari, Via Ospedale 72, I-09124 Cagliari, Italy
*
Author to whom correspondence should be addressed.
Antioxidants 2022, 11(9), 1681; https://doi.org/10.3390/antiox11091681
Submission received: 22 July 2022 / Revised: 24 August 2022 / Accepted: 25 August 2022 / Published: 28 August 2022
(This article belongs to the Special Issue Dietary Antioxidants and Cosmetics)

Abstract

:
Ellagic acid (EA) has long been recognized as a very active antioxidant, anti-inflammatory, and antimicrobial agent. However, its low bioavailability has often hampered its applications in health-related fields. Here, we report a phospholipid vesicle-based controlled release system for EA, involving the exploitation of chestnut wood mud (CWM), an industrial by-product from chestnut tannin production, as a largely available and low-cost source of this compound. Two kinds of CWM with different particle size distributions, indicated as CWM-A and CWM-B (<100 and 32 µm, respectively), containing 5 ± 1% w/w EA, were incorporated into transfersomes. The latter were small in size (~100 nm), homogeneously dispersed, and negatively charged. 2,2-Diphenyl-1-picrylhydrazyl (DPPH) and ferric reducing/antioxidant power (FRAP) assays indicated up to three-fold improvement in the antioxidant properties of CWM upon incorporation into transfersomes. The kinetics of EA released under simulated physiological conditions were evaluated by UV-Vis spectroscopy and HPLC analysis. The best results were obtained with CWM-B (100% of EA gradually released after 37 days at pH 7.4). A stepwise increase in the antioxidant properties of the released material was also observed. Cell-based experiments confirmed the efficacy of CWM-B transfersomes as antioxidant agents in contrasting photodamage.

1. Introduction

Ellagic acid (EA) is a phenolic compound naturally present in many red fruits and berries. Apart from being the main product of ellagitannin hydrolysis, it is endowed with remarkable biological properties, including antioxidant [1,2,3], anti-inflammatory [4], antimicrobial [5], antidiabetic [6], antiviral [7], antidegenerative [8], and anticancer activities [9]. In addition to systemic uses, topical applications of EA have been widely described [10]. Several studies have reported the potential use of EA for the prevention or treatment of skin disorders. For example, EA was found to be effective against skin tumors [11], contact dermatitis [12], or cutaneous leishmaniasis [13]. It can be used in wound bandaging [14], or as a photoprotective [15] and antiaging agent [16]. Furthermore, EA is considered a useful compound in the treatment of skin pigmentation disorders, such as hyperpigmentation, melasma, and other dyschromia [17].
Despite its remarkable properties, the wide application of EA is limited by its low permeability and low solubility in aqueous solvents. To overcome these drawbacks, several approaches have been proposed, involving modulation of EA solubility properties through encapsulation or chemical derivatization [18,19,20,21,22,23], and different type of formulations based on e.g., pectins [24,25], chitosan [25,26,27], chitin [28], zein [5], cellulose [29], cyclodextrins [30,31,32], poly(lactide-co-glycolide) (PLGA) [33], graphene oxide [34], alginate [35], and microalgae [36] have been designed for the controlled release of this compound.
In this context, liposomes (spherical vesicles composed of one or more bilayers formed by dispersion of phospholipids in aqueous medium) have been largely utilized as a drug delivery vehicle for administration of nutrients and pharmaceutical drugs in biomedical, food, and agricultural industries, and have also been exploited for enhancing the biological effects [37,38,39], improving skin permeation [40], and guaranteeing a sustained release [41] of EA. In particular, over the last few years, liposomes have been the target of reformulating studies aimed at producing vesicles capable of delivering active compounds to the deeper skin layers. A number of additives have been explored in combination with conventional components of liposomes, producing new classes of vesicles, such as transfersomes. Transfersomes are composed of phospholipids and an edge activator, which is a membrane-softening agent (e.g., Tween 80, Span 80, or sodium cholate) that makes the vesicle ultra-deformable and capable of penetrating the skin more efficiently than conventional liposomes [42,43,44,45].
In addition to the development of novel formulations to improve its bioavailability, another primary aim of the recent scientific research on EA is the discovery of sustainable, low cost and easily available sources of this compound, prompted by the global increasing demand for green products and processes. Among these sources, a prominent role is occupied by agri-food by-products such as pomegranate peel [46,47,48,49,50], although other ellagitannin-rich wastes have recently emerged as possible sources of EA. A noticeable example is represented by chestnut shell [51,52,53] as well as chestnut wood fiber, which is the residual exhausted material from chestnut tannin industrial production [54,55].
Within this scenario, we report herein the exploitation of chestnut wood mud (CWM) as an easily available source of EA for dermo-cosmetic applications upon incorporation into transfersomes. CWM is an industrial by-product of the chestnut tannin production, deriving from exhausted chestnut wood subjected to a natural fermentation process. The antioxidant properties of the samples were investigated by chemical assays and the protective effects on UVA-induced oxidative photodamage were evaluated on immortalized human keratinocytes (HaCaT). Finally, the controlled-release profile of EA under simulated physiological conditions was investigated by UV-Vis spectroscopy and HPLC.

2. Materials and Methods

2.1. Materials

CWM was provided by Silvateam (S. Michele Mondovì, Cuneo, Italy). CWM was first dried in an oven at 35 °C for one week, then ground in a common blender and finally passed through sieves to obtain two fractions with particle sizes lower than 100 and 32 µm, indicated as CWM-A and CWM-B, respectively.
Lipoid S75 (S75), a mixture of soybean phospholipids (70% phosphatidylcholine, 9% phosphatidylethanolamine and 3% lysophosphatidylcholine), triglycerides and fatty acids, was purchased from Lipoid GmbH (Ludwigshafen, Germany). Tween 80 (polysorbate 80, polyoxyethylene sorbitan monooleate; non-ionic hydrophilic surfactant, HLB 15) was supplied by Galeno (Carmignano, Prato, Italy).
2,2-Diphenyl-1-picrylhydrazyl (DPPH), iron(III) chloride (97%), phosphate buffer saline (PBS) 10×, 2,4,6-tris(2-pirydyl)-s-triazine (TPTZ) (≥98%), and (±)-6-hydroxy-2,5,7,8-tetramethylchromane-2-carboxylic acid (Trolox) (97%) were obtained from Sigma-Aldrich (Milan, Italy).

2.2. Methods

UV–Vis spectra were recorded on a Jasco (Lecco, Italy) V-730 Spectrophotometer.
HPLC analysis was performed with an Agilent (Cernusco sul Naviglio, Milan, Italy) instrument equipped with a UV-Vis detector; a Phenomenex (Castel Maggiore, Bologna, Italy) Sphereclone ODS column (250 × 4.60 mm, 5 µm) was used at a flow rate of 1.0 mL/min. A gradient elution using 0.1% formic acid in water (solvent A) and methanol (solvent B) was performed as follows: 5% B, 0–10 min; from 5 to 80% B, 10–57.5 min. The detection wavelength was set at 254 nm.

2.3. Preparation and Characterization of Transfersomes

CWM (A or B) was weighed in a glass vial along with S75; thereafter, Tween 80 and water were added (Table 1). To obtain the transfersomes, the dispersion was sonicated (5 s on and 2 s off, 10 cycles; 13 microns of probe amplitude) with an ultrasonic disintegrator (Soniprep 150 plus; MSE Crowley, London, UK).
For comparative purposes, empty transfersomes (i.e., those without CWM) were also prepared under the same conditions as CWM transfersomes (Table 1).
The mean diameter, polydispersity index, and zeta potential of the transfersomes were determined by dynamic and electrophoretic light scattering using a Zetasizer nano-ZS (Malvern Panalytical, Worcestershire, UK). Samples (n > 10) were diluted with water (1:100) and analyzed at 25 °C.
The above three parameters were monitored for 90 days to assess the long-term stability of the formulations.

2.4. Antioxidant Properties of CWM Samples

2.4.1. DPPH Assay

CWM or CWM transfersomes (0.02–0.15 mg/mL final dose) (concentrations are referred to as CWM content in the formulations) were added to 3 mL of a 0.2 mM ethanolic solution of DPPH [56], and after 10 min under stirring at room temperature, the absorbance at 515 nm was measured. Experiments were run in triplicate.

2.4.2. Ferric Reducing/Antioxidant Power (FRAP) Assay

CWM and CWM transfersomes were added (0.001–0.1 mg/mL final dose) (concentrations are referred to as CWM content in the formulations) to 3 mL of 0.3 M acetate buffer (pH 3.6) containing 1.7 mM FeCl3 and 0.83 mM TPTZ [57], and after 10 min of stirring at room temperature, the absorbance of the solutions at 593 nm was measured. Results were expressed as Trolox equivalents (eqs). Experiments were run in triplicate.

2.5. Release Experiments from CWM Transfersomes

Each CWM transfersome formulation (3 g) was placed in a dialysis membrane (MWCO 100–500 Da) and dialyzed against 30 mL of PBS 1×. The samples were kept at 37 °C in a water bath. Next, 0.5 mL of release medium was periodically withdrawn and replaced with an equal volume of corresponding fresh medium and analyzed using UV-Vis spectroscopy or HPLC. Each experiment was run in triplicate.

2.6. Antioxidant Properties of Released Fractions from CWM Transfersomes

Aliquots (150 µL) of the released fractions from CWM transfersomes were added to 2 mL of FRAP reagent prepared as described in Section 2.4.2. After 10 min under stirring, the mixtures were centrifuged (3 min at 5000 rpm) and the absorbance of the supernatants at 593 nm was measured.

2.7. Analysis of Cell Viability

Immortalized human keratinocytes (HaCaT, Innoprot, Derio, Spain) were cultured in 10% fetal bovine serum in Dulbecco’s Modified Eagle’s Medium, in the presence of 1% antibiotics and 2 mM l-glutamine, in a 5% CO2 humidified atmosphere at 37 °C. To verify the biocompatibility of each sample, cells were seeded in 96-well plates at a density of 2 × 10³/cm2 and 24 h after seeding. Cells were incubated in the presence of increasing concentration of EA (up to 10 µM) or transfersome samples (up to 25 µL/mL) for 24 and 48 h. At the end of incubation, cell viability was assessed by the 3-(4,5-dimethylthiazol-2-yl)-2,5-diphenyltetrazoliumbromide (MTT) assay. Cell survival was expressed as the percentage of viable cells in the presence of each sample and compared with control cells (represented by the average obtained between untreated cells and cells supplemented with the highest concentration of buffer). Each sample was tested in three independent analyses, each carried out in triplicate.

2.8. UVA Irradiation and Dichlorofluorescein Diacetate (DCFDA) Assay

The protective effect of each sample was measured by determining the intracellular reactive oxygen species (ROS) levels. A previously reported protocol [58] was followed, with some modifications. Briefly, HaCaT cells were preliminarily exposed for 2, 6, and 16 h to 10 µM EA to define the proper incubation time. After that, cells were incubated with the samples (10 µM EA or 25 µL/mL transfersomes, providing a 10 µM EA concentration) for 6 h in the absence or presence of 10 min UVA irradiation (100 J/cm2). At the end of the irradiation, H2-DCFDA was added to measure intracellular ROS level. Fluorescence intensity of the probe was measured at an emission wavelength of 525 nm and an excitation wavelength of 488 nm using a Perkin-Elmer (Milan, Italy) LS50 spectrofluorometer. Emission spectra were acquired at a scanning speed of 300 nm/min, with 5 slit widths for both excitation and emission. ROS production was expressed as percentage of DCF fluorescence intensity of the sample under test, compared to the untreated sample. Results are presented as mean of results obtained after three independent experiments (mean ± SD) and compared by one-way ANOVA according to Bonferroni’s method (post hoc) using Graphpad Prism for Windows, version 6.01.

3. Results and Discussion

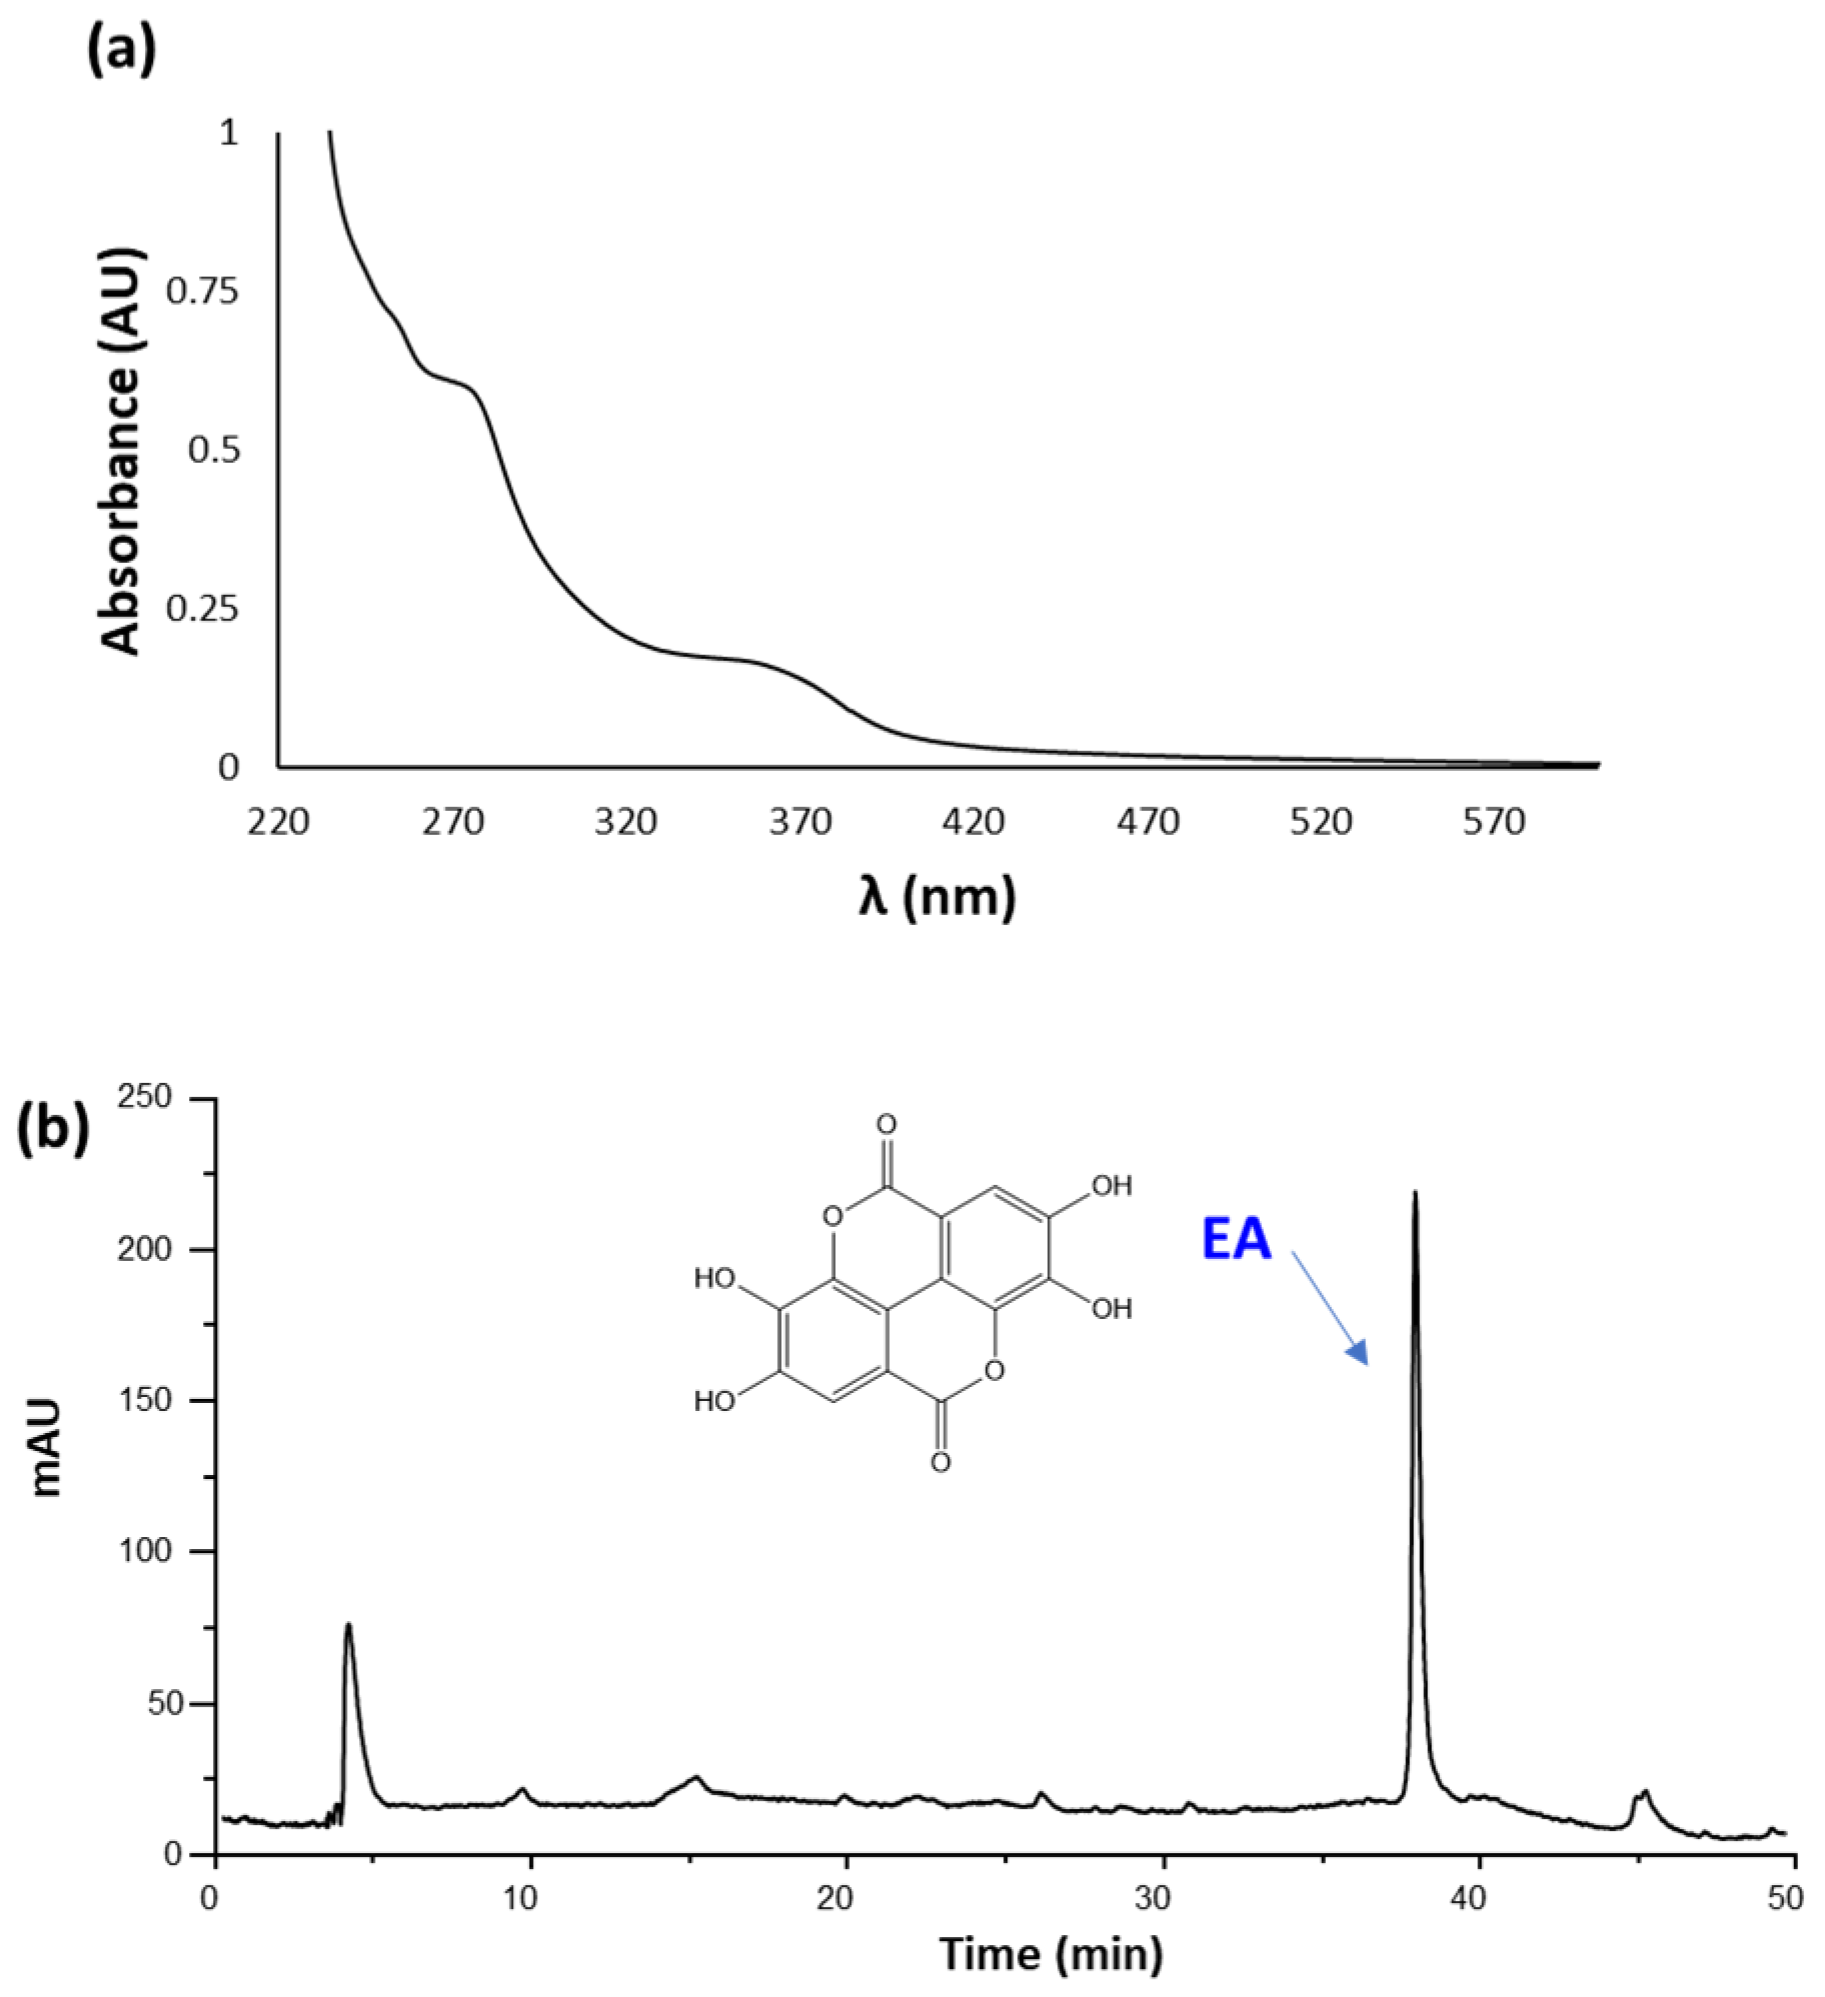
3.1. Determination of the EA Content in CWM Samples

To gain information about the amount of EA contained in the two CWM samples, DMSO solutions of CWM-A and CWM-B were prepared and then analyzed using UV-Vis spectroscopy and HPLC after proper dilution in methanol. DMSO was chosen as the solvent based on its ability to dissolve a wide range of most polar and non-polar natural phenolic compounds, including EA [50,54,59].
As an example, the UV-Vis spectrum and elutographic profile of CWM-A are reported in Figure 1. The UV-Vis spectrum was characterized by absorption maxima at around 280 and 360 nm, as expected based on the presence of EA [60]. In agreement with this observation, HPLC analysis showed the presence of a single chromatographable compound eluted at ca. 38 min, identified as EA by comparison with an authentic standard. Quantitative analysis indicated content of EA of 5 ± 1% w/w for both CWM-A and CWM-B.

3.2. Incorporation of CWM Samples into Transfersomes

Transfersomes—that is, phospholipid vesicles modified with Tween 80 to promote skin penetration—containing CWM were produced and characterized in terms of size, homogeneity, and surface charge. To evaluate the CWM effect on the vesicles, the CWM transfersomes were compared with the empty transfersomes.
The light scattering results, as reported in Table 2, showed that the empty transfersomes had a mean diameter of 106 nm, and were homogeneously dispersed (polydispersity index 0.27) and highly negatively charged (−71 mV). CMW-A incorporation significantly increased the mean diameter of the vesicles, although they remained small (around 120 nm); the polydispersity index was unaltered, and the zeta potential value became less negative (Table 2), but it was still high enough to allow particle repulsion and prevent aggregation. On the other hand, CMW-B incorporation did not affect the vesicle size, nor the homogeneity of the dispersion, but produced less negative surface charge, as much as CMW-A.
The stability of the transfersome formulations was evaluated by monitoring the mean diameter, the polydispersity index, and the zeta potential during a 90-day storage period at 4 °C. No significant alterations (<10%) were detected.
The physicochemical characteristics of the herein described transfersomes are in line with those reported in literature for other EA-incorporating nanosystems [20]. As an example, Tween 80-coated chitosan-based nanoformulations exhibited an average hydrodynamic diameter of 155 nm and a PI of 0.37, although a lower ZP (−9.7 mV) compared to CWM transfersomes was determined. These nanoformulations led to a sustained release of EA (47% after 24 h) at pH 7.4 and exhibited more efficient anticancer effects in tumor-bearing mice compared to EA alone [27]. EA-loaded schizophyllan and chitin nanoparticles showed size distributions of 217.8 and 39.82 nm, and ZP of +27 and −9.14 mV, respectively. The chitin nanoparticles in particular led to a rapid release of EA (ca. 50%) after 8 h at pH 7.4, followed by a gradual release (up to 63%) that continued up to 50 h. MTT assay indicated that both nanoformulations effectively inhibited the growth of breast cancer cell lines, with IC50 values of 60 and 115 μg/mL, respectively [28]. Zein nanoparticles containing EA showed a mean size between 260 and 370 nm and a PI lower than 0.3. These formulations were found to be positively charged, with ZP ranging from +24 to + 37 mV, and showed inhibitory and bactericide activity against S. aureus and P. aeruginosa (MIC <72 μg/mL) [5]. Finally, poly(ε-caprolactone)-based EA nanoparticles formulated by applying various stabilizing agents exhibited average diameters ranging from 193 to 1252 nm, PI of 0.36–0.98 and ZP of −25–+62 mV. A fast release followed by a linear release period with a slower rate was observed at pH 7.4, with a cumulative release ranging from 25% to 48% after 8 days. These nanoparticles enhanced the cytotoxicity of EA up to 6.9-fold against colon adenocarcinoma cells, as well as the absorption extent of orally taken EA in rabbits [61].

3.3. Antioxidant Properties of CWM Transfersomes

The antioxidant properties of the CWM transfersomes were initially investigated with respect to the starting CWM samples by widely used chemical assays; that is, the DPPH and FRAP assays. Standard EA was also tested for comparison. The results are shown in Table 3. Both CWM-A and CWM-B exhibited antioxidant properties in line with what was expected based on a 5% w/w EA content. Notably, incorporation into transfersomes induced an about 2.5-fold decrease in the EC50 values determined in the DPPH assay for the CWM samples, and an even higher improvement in the reducing properties was observed in the FRAP assay. Since empty transfersomes were not found to exhibit significant antioxidant properties, these results clearly suggest a larger availability of the antioxidant compound EA following incorporation into the vesicles.

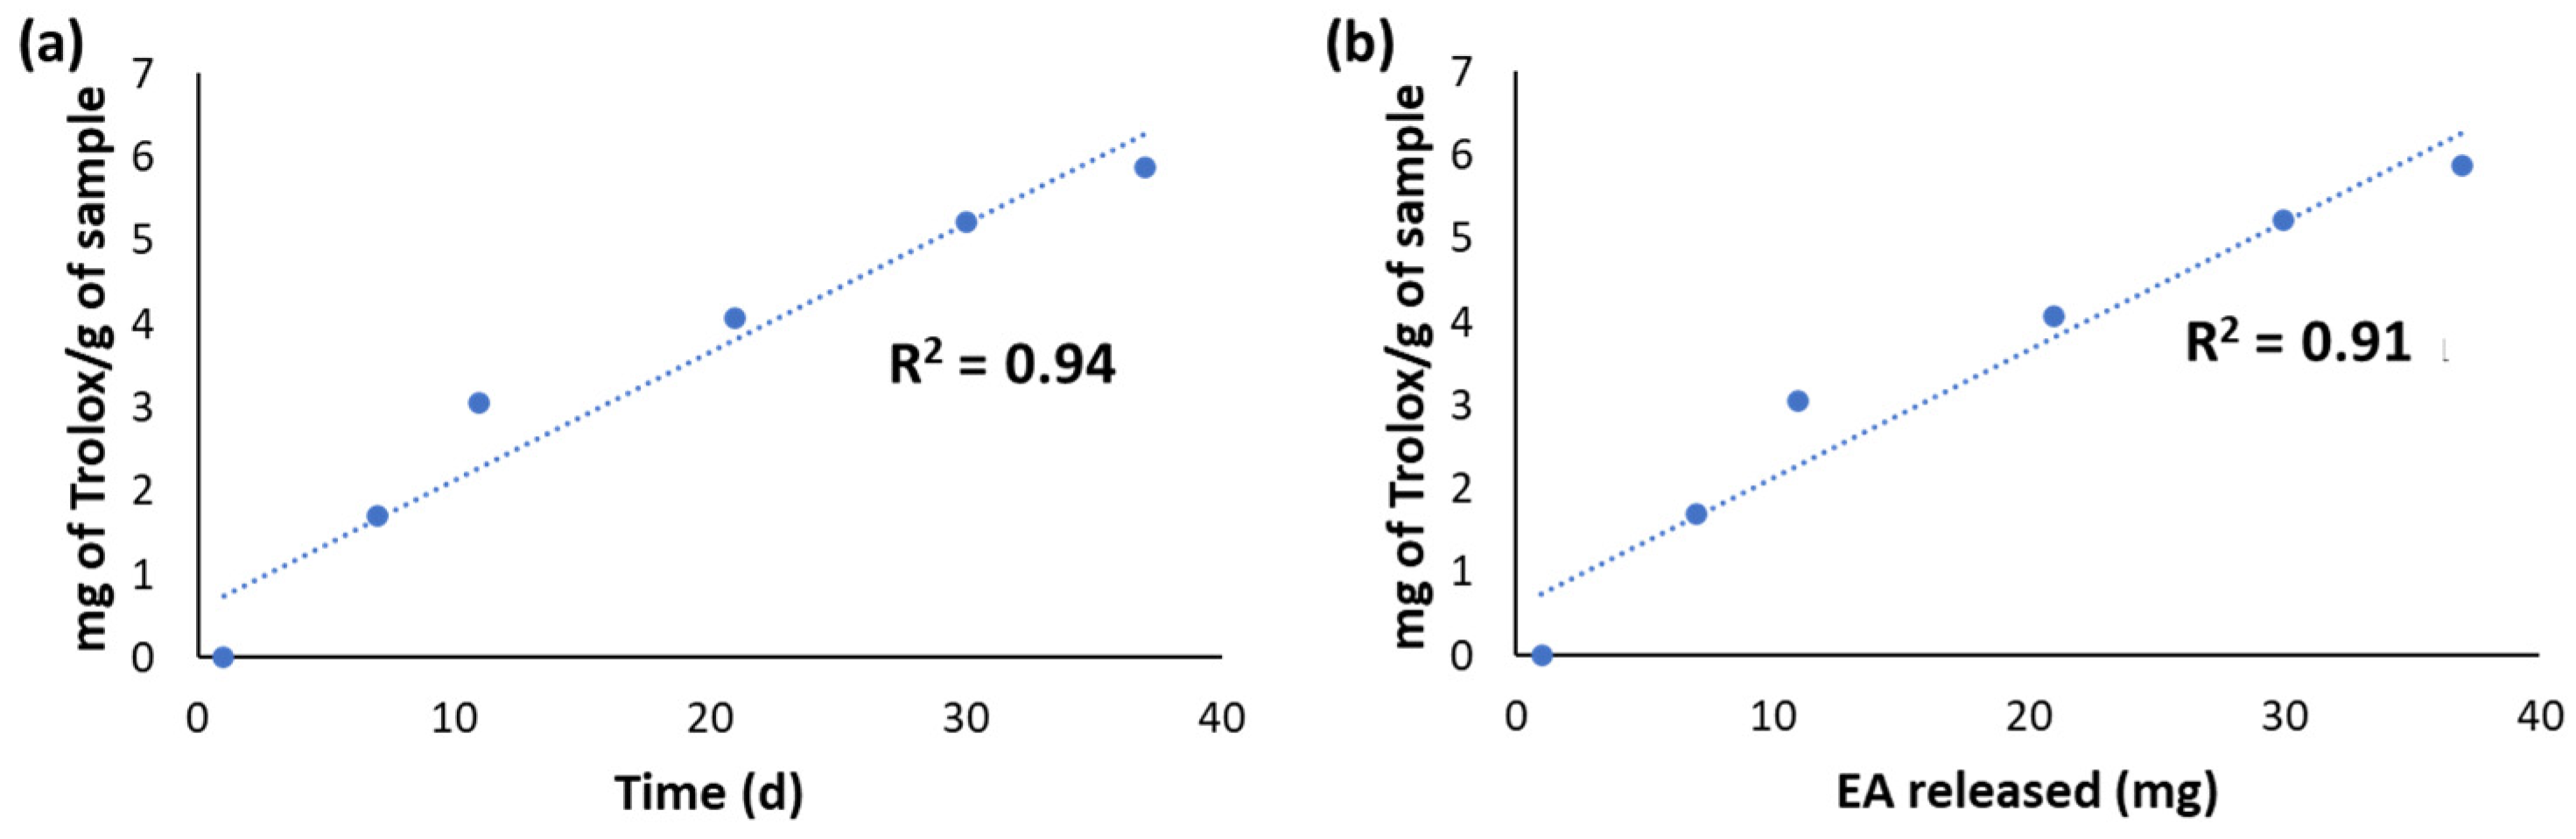
3.4. Release of EA from CWM Transfersomes and Antioxidant Properties of the Released Fractions under Simulated Physiological Conditions

The release of EA from the CWM transfersomes in PBS at 37 °C was followed by UV-Vis spectroscopy and HPLC over 5 weeks. No significant release of EA was observed in the case of CWM-A, probably as a result of the higher particle size of the sample, whereas very promising results were obtained with the CWM-B transfersomes. Indeed, the UV-Vis spectra of the released fractions from the latter exhibited absorption maxima at ca. 280 and 360 nm, which linearly increased over time (Figure 2a). HPLC analysis confirmed a controlled release of EA, which was complete after 30 days, reaching a concentration of ca. 56 µM (Figure 2b).
The released fractions from CWM-B transfersomes were also evaluated for their antioxidant properties by chemical assays. Actually, it was not possible to perform the DPPH assay due to interference of the released material with the assay medium. On the other hand, the reducing properties evaluated by the FRAP assay (Figure 3a) linearly increased over time on account of the progressive release of EA from the transfersomes. A good linear correlation (R2 = 0.91) of the antioxidant properties with the amount of total released EA was indeed observed (Figure 3b).

3.5. Cell Viability of CWM Transfersomes

Based on the encouraging results of the release experiments, and with the aim of further probing the potential of CWM transfersomes for dermo-cosmetic applications, in subsequent experiments the sample biocompatibility was evaluated on HaCaT, since these cells are normally present in the outermost layer of the skin. EA was also tested for comparison in a range of concentrations corresponding to those provided by the CWM transfersome samples. MTT assay (not shown) showed that both EA (up to 10 µM) and the transfersomes (up to 25 µL/mL) were biocompatible under all the experimental conditions.

3.6. Protective Effect of CWM Transfersomes on Photoinduced Oxidative Stress

The antioxidant cytoprotective properties of CWM-A and CWM-B transfersomes were evaluated on UVA-irradiated HaCaT. Preliminary experiments (data not shown) were performed to define the optimal time (2, 6, or 16 h) for cell preincubation with 10 μM EA (corresponding to a non-cytotoxic concentration of 25 µL/mL CWM transfersomes), and 6 h incubation was chosen for further experiments. As shown in Figure 4, UVA irradiation induced a significant increase in intracellular ROS levels (150–200%) with respect to untreated cells. When cells were pretreated with 10 μM EA (Figure 4a, gray bars) prior to UVA exposure, a significant lowering of intracellular ROS levels was observed. As expected, empty transfersomes did not exert any protective effect against oxidative stress. Interestingly, when cells were treated with 25 µL/mL CWM-B transfersomes (providing an EA concentration of 10 µM) (Figure 4b, gray bars) prior to UVA exposure, a significant reduction (p ≤ 0.05) in intracellular ROS levels, compared to untreated UVA-exposed cells, was observed. On the other hand, CWM-A transfersomes (Figure 4b, white bars) were unable to protect cells from UVA-induced oxidative stress injury. Thus, these results, combined with those from the release experiments, suggest that the particle size of the CWM incorporated into transfersomes is fundamental to allow EA to be active as an antioxidant in cellular models.

4. Conclusions

In conclusion, the present work reports the efficacy of transfersomes as carriers for the controlled release of the biologically active compound EA from CWM, an industrial by-product deriving from tannin extraction. The incorporation into the transfersomes induced a significant improvement of the antioxidant properties of CWM, likely as a result of the larger availability of EA. Moreover, the transfersomal CWM-B was found to be able to decrease ROS production in UVA-irradiated keratinocytes and to provide a complete and controlled release of EA in pseudophysiological conditions at pH 7.4, a result of interest in dermo-cosmetic applications. For example, open wounds are characterized by a neutral or alkaline pH ranging from 6.5 to 8.5, whereas chronic wounds exhibit a pH in the range of 7.5–8.5 [62,63]. All together, these results highlight nanoformulated CWM of proper particle size as an easily accessible and biocompatible material that could warrant a sustained release of the water-insoluble bioactive EA under physiologically relevant conditions; for example for the treatment and protection of damaged skin.

Author Contributions

Conceptualization, C.C., D.M.M. and L.P.; Data curation, F.M., D.L., C.C., D.M.M. and L.P.; Investigation, F.M., D.L. and C.C.; Methodology, F.M., D.L., C.C., D.M.M. and L.P.; Resources, S.G.; Supervision, D.M.M., L.P. and A.N.; Validation, C.C., D.M.M., L.P. and A.N.; Writing—original draft, F.M., C.C. and D.M.M.; Writing—review and editing, L.P. and A.N. All authors have read and agreed to the published version of the manuscript.

Funding

This research received no external funding.

Data Availability Statement

The data are contained within the article.

Acknowledgments

The authors wish to thank the European Union (FSE, PON Ricerca e Innovazione 2014–2020, Azione I.1 “Dottorati Innovativi con caratterizzazione Industriale”) for funding a PhD grant to Federica Moccia. Financial support to Lucia Panzella by Italian MIUR, PRIN 2017 2017YJMPZN is acknowledged.

Conflicts of Interest

The authors declare no conflict of interest.

References

  1. Tošović, J.; Bren, U. Antioxidative action of ellagic acid—A kinetic DFT study. Antioxidants 2020, 9, 587. [Google Scholar] [CrossRef]
  2. Xiao, Y.; Huang, R.; Wang, N.; Deng, Y.; Tan, B.; Yin, Y.; Qi, M.; Wang, J. Ellagic acid alleviates oxidative stress by mediating Nrf2 signaling pathways and protects against paraquat-induced intestinal injury in piglets. Antioxidants 2022, 11, 252. [Google Scholar] [CrossRef]
  3. Kim, D.H.; Sim, Y.; Hwang, J.H.; Kwun, I.S.; Lim, J.H.; Kim, J.; Kim, J.I.; Baek, M.C.; Akbar, M.; Seo, W.; et al. Ellagic acid prevents binge alcohol-induced leaky gut and liver injury through inhibiting gut dysbiosis and oxidative stress. Antioxidants 2021, 10, 1386. [Google Scholar] [CrossRef]
  4. Romeo, I.; Vallarino, G.; Turrini, F.; Roggeri, A.; Olivero, G.; Boggia, R.; Alcaro, S.; Costa, G.; Pittaluga, A. Presynaptic release-regulating alpha2 autoreceptors: Potential molecular target for ellagic acid nutraceutical properties. Antioxidants 2021, 10, 1759. [Google Scholar] [CrossRef]
  5. de Souza Tavares, W.; Pena, G.R.; Martin-Pastor, M.; de Sousa, F.F.O. Design and characterization of ellagic acid-loaded zein nanoparticles and their effect on the antioxidant and antibacterial activities. J. Mol. Liq. 2021, 341, 116915. [Google Scholar] [CrossRef]
  6. Amor, A.J.; Gómez-Guerrero, C.; Ortega, E.; Sala-Vila, A.; Lázaro, I. Ellagic acid as a tool to limit the diabetes burden: Updated evidence. Antioxidants 2020, 9, 1226. [Google Scholar] [CrossRef]
  7. Umar, A.K.; Zothantluanga, J.H.; Aswin, K.; Maulana, S.; Sulaiman Zubair, M.; Lalhlenmawia, H.; Rudrapal, M.; Chetia, D. Antiviral phytocompounds “ellagic acid” and “(+)-sesamin” of Bridelia retusa identified as potential inhibitors of SARS-CoV-2 3CL pro using extensive molecular docking, molecular dynamics simulation studies, binding free energy calculations, and bioactivity prediction. Struct. Chem. 2022, 10, 1–21. [Google Scholar] [CrossRef]
  8. Javaid, N.; Shah, M.A.; Rasul, A.; Chauhdary, Z.; Saleem, U.; Khan, H.; Ahmed, N.; Uddin, M.S.; Mathew, B.; Behl, T.; et al. Neuroprotective effects of ellagic acid in Alzheimer’s disease: Focus on underlying molecular mechanisms of therapeutic potential. Curr. Pharm. Des. 2021, 27, 3591–3601. [Google Scholar] [CrossRef]
  9. Mohammadinejad, A.; Mohajeri, T.; Aleyaghoob, G.; Heidarian, F.; Oskuee, R.K. Ellagic acid as a potent anticancer drug: A comprehensive review on in vitro, in vivo, in silico, and drug delivery studies. Biotechnol. Appl. Biochem. 2021; in press. [Google Scholar] [CrossRef]
  10. Ríos, J.L.; Giner, R.M.; Marín, M.; Recio, M.C. A pharmacological update of ellagic acid. Planta Med. 2018, 84, 1068–1093. [Google Scholar] [CrossRef] [Green Version]
  11. Korkina, L.G.; Pastore, S.; Dellambra, E.; De Luca, C. New molecular and cellular targets for chemoprevention and treatment of skin tumors by plant polyphenols: A critical review. Curr. Med. Chem. 2013, 20, 852–868. [Google Scholar] [CrossRef]
  12. Mo, J.; Panichayupakaranant, P.; Kaewnopparat, N.; Songkro, S.; Reanmongkol, W. Topical anti-inflammatory potential of standardized pomegranate rind extract and ellagic acid in contact dermatitis. Phyther. Res. 2014, 28, 629–632. [Google Scholar] [CrossRef]
  13. De Moraes Alves, M.M.; Arcanjo, D.D.R.; Figueiredo, K.A.; De Sousa Macêdo Oliveira, J.S.; Viana, F.J.C.; De Sousa Coelho, E.; Lopes, G.L.N.; Gonçalves, J.C.R.; Carvalho, A.L.M.; Dos Santos Rizzo, M.; et al. Gallic and ellagic acids are promising adjuvants to conventional amphotericin B for the treatment of cutaneous leishmaniasis. Antimicrob. Agents Chemother. 2020, 64, e00807–e00820. [Google Scholar] [CrossRef]
  14. Tavares, W.S.; Tavares-Júnior, A.G.; Otero-Espinar, F.J.; Martín-Pastor, M.; Sousa, F.F.O. Design of ellagic acid-loaded chitosan/zein films for wound bandaging. J. Drug Deliv. Sci. Technol. 2020, 59, 101903. [Google Scholar] [CrossRef]
  15. Lembo, S.; Balato, A.; Di Caprio, R.; Cirillo, T.; Giannini, V.; Gasparri, F.; Monfrecola, G. The modulatory effect of ellagic acid and rosmarinic acid on ultraviolet-B-induced cytokine/chemokine gene expression in skin keratinocyte (HaCaT) cells. Biomed Res. Int. 2014, 2014, 346793. [Google Scholar] [CrossRef] [PubMed]
  16. Moon, N.R.; Kang, S.; Park, S. Consumption of ellagic acid and dihydromyricetin synergistically protects against UV-B induced photoaging, possibly by activating both TGF-β1 and wnt signaling pathways. J. Photochem. Photobiol. B Biol. 2018, 178, 92–100. [Google Scholar] [CrossRef]
  17. Panzella, L.; Napolitano, A. Natural and bioinspired phenolic compounds as tyrosinase inhibitors for the treatment of skin hyperpigmentation: Recent advances. Cosmetics 2019, 6, 57. [Google Scholar] [CrossRef]
  18. Muráth, S.; Szerlauth, A.; Sebok, D.; Szilágyi, I. Layered double hydroxide nanoparticles to overcome the hydrophobicity of ellagic acid: An antioxidant hybrid material. Antioxidants 2020, 9, 153. [Google Scholar] [CrossRef]
  19. Li, Y.; Mei, L.; Guan, X.; Hu, Y. Ellagic acid solid dispersion: Characterization and bioactivity in the hydroxyl radical oxidation system. Food Res. Int. 2021, 142, 110184. [Google Scholar] [CrossRef]
  20. Ceci, C.; Graziani, G.; Faraoni, I.; Cacciotti, I. Strategies to improve ellagic acid bioavailability: From natural or semisynthetic derivatives to nanotechnological approaches based on innovative carriers. Nanotechnology 2020, 31, 382001. [Google Scholar] [CrossRef]
  21. Nyamba, I.; Lechanteur, A.; Semdé, R.; Evrard, B. Physical formulation approaches for improving aqueous solubility and bioavailability of ellagic acid: A review. Eur. J. Pharm. Biopharm. 2021, 159, 198–210. [Google Scholar] [CrossRef]
  22. Elbehairi, S.E.I.; Alfaifi, M.Y.; Shati, A.A.; Fahmy, U.A.; Gorain, B.; Md, S. Encapsulation of ellagic acid in di-block copolymeric micelle for non-small cell lung cancer therapy. Sci. Adv. Mater. 2021, 13, 66–72. [Google Scholar] [CrossRef]
  23. Villalgordo, J.M.; Trulli, L.; García-Villalba, R.; García, V.; Althobaiti, Y.; Tomás-Barberán, F.A. Novel regioselective synthesis of urolithin glucuronides─human gut microbiota cometabolites of ellagitannins and ellagic acid. J. Agric. Food Chem. 2022, 70, 5819–5828. [Google Scholar] [CrossRef] [PubMed]
  24. Ortenzi, M.A.; Antenucci, S.; Marzorati, S.; Panzella, L.; Molino, S.; Rufián-Henares, J.Á.; Napolitano, A.; Verotta, L. Pectin-based formulations for controlled release of an ellagic acid salt with high solubility profile in physiological media. Molecules 2021, 26, 433. [Google Scholar] [CrossRef]
  25. Karakas, C.Y.; Ordu, H.R.; Bozkurt, F.; Karadag, A. Electrosprayed chitosan-coated alginate–pectin beads as potential system for colon-targeted delivery of ellagic acid. J. Sci. Food Agric. 2022, 102, 965–975. [Google Scholar] [CrossRef] [PubMed]
  26. Ahlawat, J.; Neupane, R.; Deemer, E.; Sreenivasan, S.T.; Narayan, M. Chitosan-ellagic acid nanohybrid for mitigating rotenone-induced oxidative stress. ACS Appl. Mater. Interfaces 2020, 12, 18964–18977. [Google Scholar] [CrossRef]
  27. Kaur, H.; Ghosh, S.; Kumar, P.; Basu, B.; Nagpal, K. Ellagic acid-loaded, tween 80-coated, chitosan nanoparticles as a promising therapeutic approach against breast cancer: In-vitro and in-vivo study. Life Sci. 2021, 284, 119927. [Google Scholar] [CrossRef]
  28. Pirzadeh-Naeeni, S.; Mozdianfard, M.R.; Shojaosadati, S.A.; Khorasani, A.C.; Saleh, T. A comparative study on schizophyllan and chitin nanoparticles for ellagic acid delivery in treating breast cancer. Int. J. Biol. Macromol. 2020, 144, 380–388. [Google Scholar] [CrossRef]
  29. Li, B.; Harich, K.; Wegiel, L.; Taylor, L.S.; Edgar, K.J. Stability and solubility enhancement of ellagic acid in cellulose ester solid dispersions. Carbohydr. Polym. 2013, 92, 1443–1450. [Google Scholar] [CrossRef]
  30. Savic, I.M.; Jocic, E.; Nikolic, V.D.; Popsavin, M.M.; Rakic, S.J.; Savic-Gajic, I.M. The effect of complexation with cyclodextrins on the antioxidant and antimicrobial activity of ellagic acid. Pharm. Dev. Technol. 2019, 24, 410–418. [Google Scholar] [CrossRef]
  31. Sharma, K.; Kadian, V.; Kumar, A.; Mahant, S.; Rao, R. Evaluation of solubility, photostability and antioxidant activity of ellagic acid cyclodextrin nanosponges fabricated by melt method and microwave-assisted synthesis. J. Food Sci. Technol. 2022, 59, 898–908. [Google Scholar] [CrossRef]
  32. Gontijo, A.V.L.; G Sampaio, A.D.; Koga-Ito, C.Y.; Salvador, M.J. Biopharmaceutical and antifungal properties of ellagic acid-cyclodextrin using an in vitro model of invasive candidiasis. Future Microbiol. 2019, 14, 957–967. [Google Scholar] [CrossRef] [PubMed]
  33. Das, J.; Debbarma, A.; Lalhlenmawia, H. Formulation and in vitro evaluation of poly-(D,L-lactide-co-glycolide) (PLGA) nanoparticles of ellagic acid and its effect on human breast cancer, MCF-7 cell line. Int. J. Curr. Pharm. Res. 2021, 13, 56–62. [Google Scholar] [CrossRef]
  34. Kakran, M.; Sahoo, N.G.; Bao, H.; Pan, Y.; Li, L. Functionalized graphene oxide as nanocarrier for loading and delivery of ellagic acid. Curr. Med. Chem. 2011, 18, 4503–4512. [Google Scholar] [CrossRef] [PubMed]
  35. Ichiura, H.; Konishi, T.; Morikawa, M. Alginate film prepared on polyethylene nonwoven sheet and its function for ellagic acid release in response to sodium ions. J. Mater. Sci. 2009, 44, 992–997. [Google Scholar] [CrossRef]
  36. Yağmur, N.; Şahin, S.; Korkmaz, E. Microencapsulation of ellagic acid extracted from pomegranate peel onto Spirulina: Characterization, loading, and storage stability properties. J. Food Process. Preserv. 2021, 45, e15086. [Google Scholar] [CrossRef]
  37. Wei, Y.; Wang, Y.; Xia, D.; Guo, S.; Wang, F.; Zhang, X.; Gan, Y. Thermosensitive liposomal codelivery of HSA-paclitaxel and HSA-ellagic acid complexes for enhanced drug perfusion and efficacy against pancreatic cancer. ACS Appl. Mater. Interfaces 2017, 9, 25138–25151. [Google Scholar] [CrossRef]
  38. Najafi, A.; Taheri, R.A.; Mehdipour, M.; Martinez-Pastor, F.; Rouhollahi, A.A.; Nourani, M.R. Improvement of post-thawed sperm quality in broiler breeder roosters by ellagic acid-loaded liposomes. Poult. Sci. 2019, 98, 440–446. [Google Scholar] [CrossRef]
  39. Stojiljković, N.; Ilić, S.; Stojanović, N.; Janković-Veličković, L.; Stojnev, S.; Kocić, G.; Radenković, G.; Arsić, I.; Stojanović, M.; Petković, M. Nanoliposome-encapsulated ellagic acid prevents cyclophosphamide-induced rat liver damage. Mol. Cell. Biochem. 2019, 458, 185–195. [Google Scholar] [CrossRef]
  40. Gonçalves, M.M.; Carneiro, J.; Döll-Boscardin, P.M.; Justus, B.; Budel, J.M.; Farago, P.V.; de Paula, J.P. Preparation of ellagic acid-loaded vesicles and method validation to quantify encapsulation efficiency. Lat. Am. J. Pharm. 2018, 37, 1000–1004. [Google Scholar]
  41. Madrigal-Carballo, S.; Lim, S.; Rodriguez, G.; Vila, A.O.; Krueger, C.G.; Gunasekaran, S.; Reed, J.D. Biopolymer coating of soybean lecithin liposomes via layer-by-layer self-assembly as novel delivery system for ellagic acid. J. Funct. Foods 2010, 2, 99–106. [Google Scholar] [CrossRef]
  42. Rai, S.; Pandey, V.; Rai, G. Transfersomes as versatile and flexible nano-vesicular carriers in skin cancer therapy: The state of the art. Nano Rev. Exp. 2017, 8, 1325708. [Google Scholar] [CrossRef] [PubMed]
  43. Cevc, G. Material transport across permeability barriers by means of lipid vesicles. In Handbook of Biological Physics; Lipowsky, R., Sackmann, E., Eds.; Elsevier B.V.: Amsterdam, The Netherlands, 1995; pp. 465–490. [Google Scholar]
  44. Sguizzato, M.; Ferrara, F.; Hallan, S.S.; Baldisserotto, A.; Drechsler, M.; Malatesta, M.; Costanzo, M.; Cortesi, R.; Puglia, C.; Valacchi, G.; et al. Ethosomes and transethosomes for mangiferin transdermal delivery. Antioxidants 2021, 10, 768. [Google Scholar] [CrossRef] [PubMed]
  45. Kocbek, P.; Baumgartner, S.; Kristl, J. Preparation and evaluation of nanosuspensions for enhancing the dissolution of poorly soluble drugs. Int. J. Pharm. 2006, 312, 179–186. [Google Scholar] [CrossRef]
  46. Magangana, T.P.; Makunga, N.P.; Fawole, O.A.; Opara, U.L. Processing factors affecting the phytochemical and nutritional properties of pomegranate (Punica granatum L.) peel waste: A review. Molecules 2020, 25, 4690. [Google Scholar] [CrossRef] [PubMed]
  47. Verotta, L.; Panzella, L.; Antenucci, S.; Calvenzani, V.; Tomay, F.; Petroni, K.; Caneva, E.; Napolitano, A. Fermented pomegranate wastes as sustainable source of ellagic acid: Antioxidant properties, anti-inflammatory action, and controlled release under simulated digestion conditions. Food Chem. 2018, 246, 129–136. [Google Scholar] [CrossRef]
  48. Panzella, L.; Moccia, F.; Nasti, R.; Marzorati, S.; Verotta, L.; Napolitano, A. Bioactive phenolic compounds from agri-food wastes: An update on green and sustainable extraction methodologies. Front. Nutr. 2020, 7, 60. [Google Scholar] [CrossRef] [PubMed]
  49. Moccia, F.; Flores-Gallegos, A.C.; Chávez-González, M.L.; Sepúlveda, L.; Marzorati, S.; Verotta, L.; Panzella, L.; Ascacio-Valdes, J.A.; Aguilar, C.N.; Napolitano, A. Ellagic acid recovery by solid state fermentation of pomegranate wastes by Aspergillus Niger and Saccharomyces cerevisiae: A comparison. Molecules 2019, 24, 3689. [Google Scholar] [CrossRef]
  50. Moccia, F.; Agustin-Salazar, S.; Verotta, L.; Caneva, E.; Giovando, S.; D’Errico, G.; Panzella, L.; d’Ischia, M.; Napolitano, A. Antioxidant properties of agri-food byproducts and specific boosting effects of hydrolytic treatments. Antioxidants 2020, 9, 438. [Google Scholar] [CrossRef]
  51. An, J.Y.; Wang, L.T.; Lv, M.J.; Wang, J.D.; Cai, Z.H.; Wang, Y.Q.; Zhang, S.; Yang, Q.; Fu, Y.J. An efficiency strategy for extraction and recovery of ellagic acid from waste chestnut shell and its biological activity evaluation. Microchem. J. 2021, 160, 105616. [Google Scholar] [CrossRef]
  52. Husanu, E.; Mero, A.; Rivera, J.G.; Mezzetta, A.; Ruiz, J.C.; D’Andrea, F.; Pomelli, C.S.; Guazzelli, L. Exploiting deep eutectic solvents and ionic liquids for the valorization of chestnut shell waste. ACS Sustain. Chem. Eng. 2020, 8, 18386–18399. [Google Scholar] [CrossRef]
  53. Lameirão, F.; Pinto, D.; Vieira, E.F.; Peixoto, A.F.; Freire, C.; Sut, S.; Dall’Acqua, S.; Costa, P.; Delerue-Matos, C.; Rodrigues, F. Green-sustainable recovery of phenolic and antioxidant compounds from industrial chestnut shells using ultrasound-assisted extraction: Optimization and evaluation of biological activities in vitro. Antioxidants 2020, 9, 267. [Google Scholar] [CrossRef] [PubMed]
  54. Moccia, F.; Gallucci, N.; Giovando, S.; Zuorro, A.; Lavecchia, R.; D’Errico, G.; Panzella, L.; Napolitano, A. A tunable deep eutectic solvent-based processing for valorization of chestnut wood fiber as a source of ellagic acid and lignin. J. Environ. Chem. Eng. 2022, 10, 107773. [Google Scholar] [CrossRef]
  55. Panzella, L.; Moccia, F.; Toscanesi, M.; Trifuoggi, M.; Giovando, S.; Napolitano, A. Exhausted woods from tannin extraction as an unexplored waste biomass: Evaluation of the antioxidant and pollutant adsorption properties and activating effects of hydrolytic treatments. Antioxidants 2019, 8, 84. [Google Scholar] [CrossRef] [PubMed]
  56. Goupy, P.; Dufour, C.; Loonis, M.; Dangles, O. Quantitative kinetic analysis of hydrogen transfer reactions from dietary polyphenols to the DPPH radical. J. Agric. Food Chem. 2003, 51, 615–622. [Google Scholar] [CrossRef] [PubMed]
  57. Benzie, I.F.F.; Strain, J.J. The ferric reducing ability of plasma (FRAP) as a measure of ‘“antioxidant power”’: The FRAP assay. Anal. Biochem. 1996, 239, 70–76. [Google Scholar] [CrossRef] [PubMed]
  58. Imbimbo, P.; Romanucci, V.; Pollio, A.; Fontanarosa, C.; Amoresano, A.; Zarrelli, A.; Olivieri, G.; Monti, D.M. A cascade extraction of active phycocyanin and fatty acids from Galdieria phlegrea. Appl. Microbiol. Biotechnol. 2019, 103, 9455–9464. [Google Scholar] [CrossRef]
  59. Garcia-Villalba, R.; Espín, J.C.; Kroon, P.A.; Alasalvar, C.; Heinonen, M.; Voorspoels, S.; Tomas-Barberan, F. A validated method for the characterization and quantification of extractable and non-extractable ellagitannins after acid hydrolysis in pomegranate fruits, juices, and extracts. J. Agric. Food Chem. 2015, 63, 6555–6566. [Google Scholar] [CrossRef]
  60. Tokutomi, H.; Takeda, T.; Hoshino, N.; Akutagawa, T. Molecular structure of the photo-oxidation product of ellagic acid in solution. ACS Omega 2018, 3, 11179–11183. [Google Scholar] [CrossRef]
  61. Mady, F.M.; Shaker, M.A. Enhanced anticancer activity and oral bioavailability of ellagic acid through encapsulation in biodegradable polymeric nanoparticles. Int. J. Nanomed. 2017, 12, 7405–7417. [Google Scholar] [CrossRef]
  62. Dissemond, J.; Witthoff, M.; Brauns, T.C.; Haberer, D.; Goos, M. pH values in chronic wounds. Evaluation during modern wound therapy. Der Hautarzt 2003, 54, 959–965. [Google Scholar] [CrossRef]
  63. Jones, E.M.; Cochrane, C.A.; Percival, S.L. The effect of pH on the extracellular matrix and biofilms. Adv. Wound Care 2015, 4, 431–439. [Google Scholar] [CrossRef] [Green Version]
Figure 1. (a) UV-Vis spectrum (recorded at 0.02 mg/mL) and (b) HPLC profile (recorded at 1 mg/mL) of CWM-A.
Antioxidants 11 01681 g001
Figure 2. (a) UV-Vis spectra of fractions released over time from CWM-B transfersomes in PBS at 37 °C. (b) Kinetics of release of EA, determined by HPLC analysis. Reported are the mean values of at least three experiments (SD ≤ 10%).
Antioxidants 11 01681 g002
Figure 3. (a) Results of the FRAP assay on the fractions released over time from CWM-B transfersomes in PBS at 37 °C. (b) Correlation between the Fe3+-reducing properties of the released fractions and the amount of released EA.
Antioxidants 11 01681 g003
Figure 4. Protective effects of EA and transfersome samples on UVA-stressed HaCaT cells. Intracellular ROS levels were determined by DCFDA assay. Cells were preincubated with (a) 10 μM EA (gray bars) or 25 µL/mL empty transfersomes (white bars), or (b) 25 µL/mL of CWM-A (white bars) or CWM-B (gray bars) transfersomes (both providing a 10 µM EA concentration). Black bars refer to untreated cells in the absence (-) or in the presence (+) of UVA stress. Values are expressed as percentage with respect to untreated cells. Data shown are means ± SD of three independent experiment. *, # indicate p < 0.05; ** indicates p < 0.01; ****, #### indicate p < 0.001 with respect to control cells and UVA treated cells, respectively.
Antioxidants 11 01681 g004
Table 1. Composition of the transfersome formulations.
FormulationS75CWMTween 80H2O
Empty transfersomes120 mg-0.05 mL0.95 mL
CWM-A transfersomes120 mg2 mg0.05 mL0.95 mL
CWM-B transfersomes120 mg2 mg0.05 mL0.95 mL
Table 2. Characteristics of empty and CWM transfersomes: mean diameter (MD), polydispersity index (PI), and zeta potential (ZP). Each value represents the mean ± SD (n > 10). * values statistically different (p < 0.05) with respect to empty transfersomes.
FormulationMD
(nm)
PIZP
(mV)
Empty transfersomes106 ± 3.10.27 ± 0.01−71 ± 5.8
CWM-A transfersomes* 121 ± 7.80.27 ± 0.01* −56 ± 5.7
CWM-B transfersomes105 ± 2.90.27 ± 0.03* −58 ± 9.4
Table 3. Antioxidant properties of CWM samples. Reported are the mean ± SD values of at least three experiments. Data for CWM transfersomes have been normalized based on the CWM content in the formulation.
DPPH Assay
EC50 (mg/mL)
FRAP Assay
(mg of Trolox/mg of Sample)
CWM-A transfersomes0.0389 ± 0.00050.36 ± 0.06
CWM-B transfersomes0.0375 ± 0.00040.39 ± 0.04
Empty transfersomes-0.00015 ± 0.00002
CWM-A0.103 ± 0.0010.047 ± 0.002
CWM-B0.106 ± 0.0010.050 ± 0.001
EA0.0051 ± 0.00041.04 ± 0.02
Publisher’s Note: MDPI stays neutral with regard to jurisdictional claims in published maps and institutional affiliations.

