Featured Application
This study aims to propose an analytical model which can be used by structural engineers to check and design reinforced concrete flanged beams.
Abstract
Recently, an analytical model called the generalized softened variable angle truss-model (GSVATM) aimed to predict the full behavior of reinforced concrete (RC) rectangular beams under torsion. In this article, such a model is used to compute the full torsional behavior of RC flanged beams, namely T- and L-shaped beams. The calculation procedure to include the influence of the flanges is described. A comparative analysis between the predictions from the GSVATM and some experimental results, related with RC flanged beams under torsion and found in the literature, is also presented. From this comparative analysis and for high loading levels, the GSVTM is reliable. Yet, for low loading levels, the theoretical model still needs to be refined.
1. Introduction
The space truss analogy (STA) constitutes a comprehensive theoretical model which allows to understand and model the torsional behavior of reinforced concrete (RC) beams. It is used by several researchers and actually constitutes the base model for most of the current codes of practice. In its early versions, proposed in the first years of the 20th century, the STA was only able to compute the resistance of RC beams to torsion. Since then, and mainly in the last three decades, the STA has been further developed by several researchers. Nowadays, the model is able to predict the full response of RC beams under torsion, including low loading levels. This is important because some requirements from codes of practice include design rules for service loads. Among the developments of the STA that are proposed in the literature, the generalized softened variable angle truss-model (GSVATM) is one of the most recent.
The GSVATM was firstly proposed by Bernardo et al. in 2015 [1] for RC rectangular plain beams. The derivation of this model was based on the generalization of a previous one, the variable angle truss model (VATM) from Hsu and Mo in 1985 [2,3]. This model aimed to unify RC and prestressed concrete (PC) rectangular beams with small or large cross sections. The VATM was able to model correctly the torsional behavior of RC beams only for the ultimate stage because the concrete tensile strength was neglected. However, this concrete property is an important one because it governs in the early loading stages. By correcting this drawback, and by incorporating adequate smeared constitutive relationships for the materials [4], the GSVATM correctly predicted the full torque ()–twist () curve of RC beams. In the last years, the GSVATM has been continuously refined to cover RC rectangular hollow beams under torsion [5], PC rectangular beams [6] and RC rectangular beams under torsion with external axial forces [7]; and the work is ongoing. In general, the theoretical predictions from the GSVATM compare well with the experimental results of RC and PC rectangular beams under torsion, including the cracking and ultimate torques.
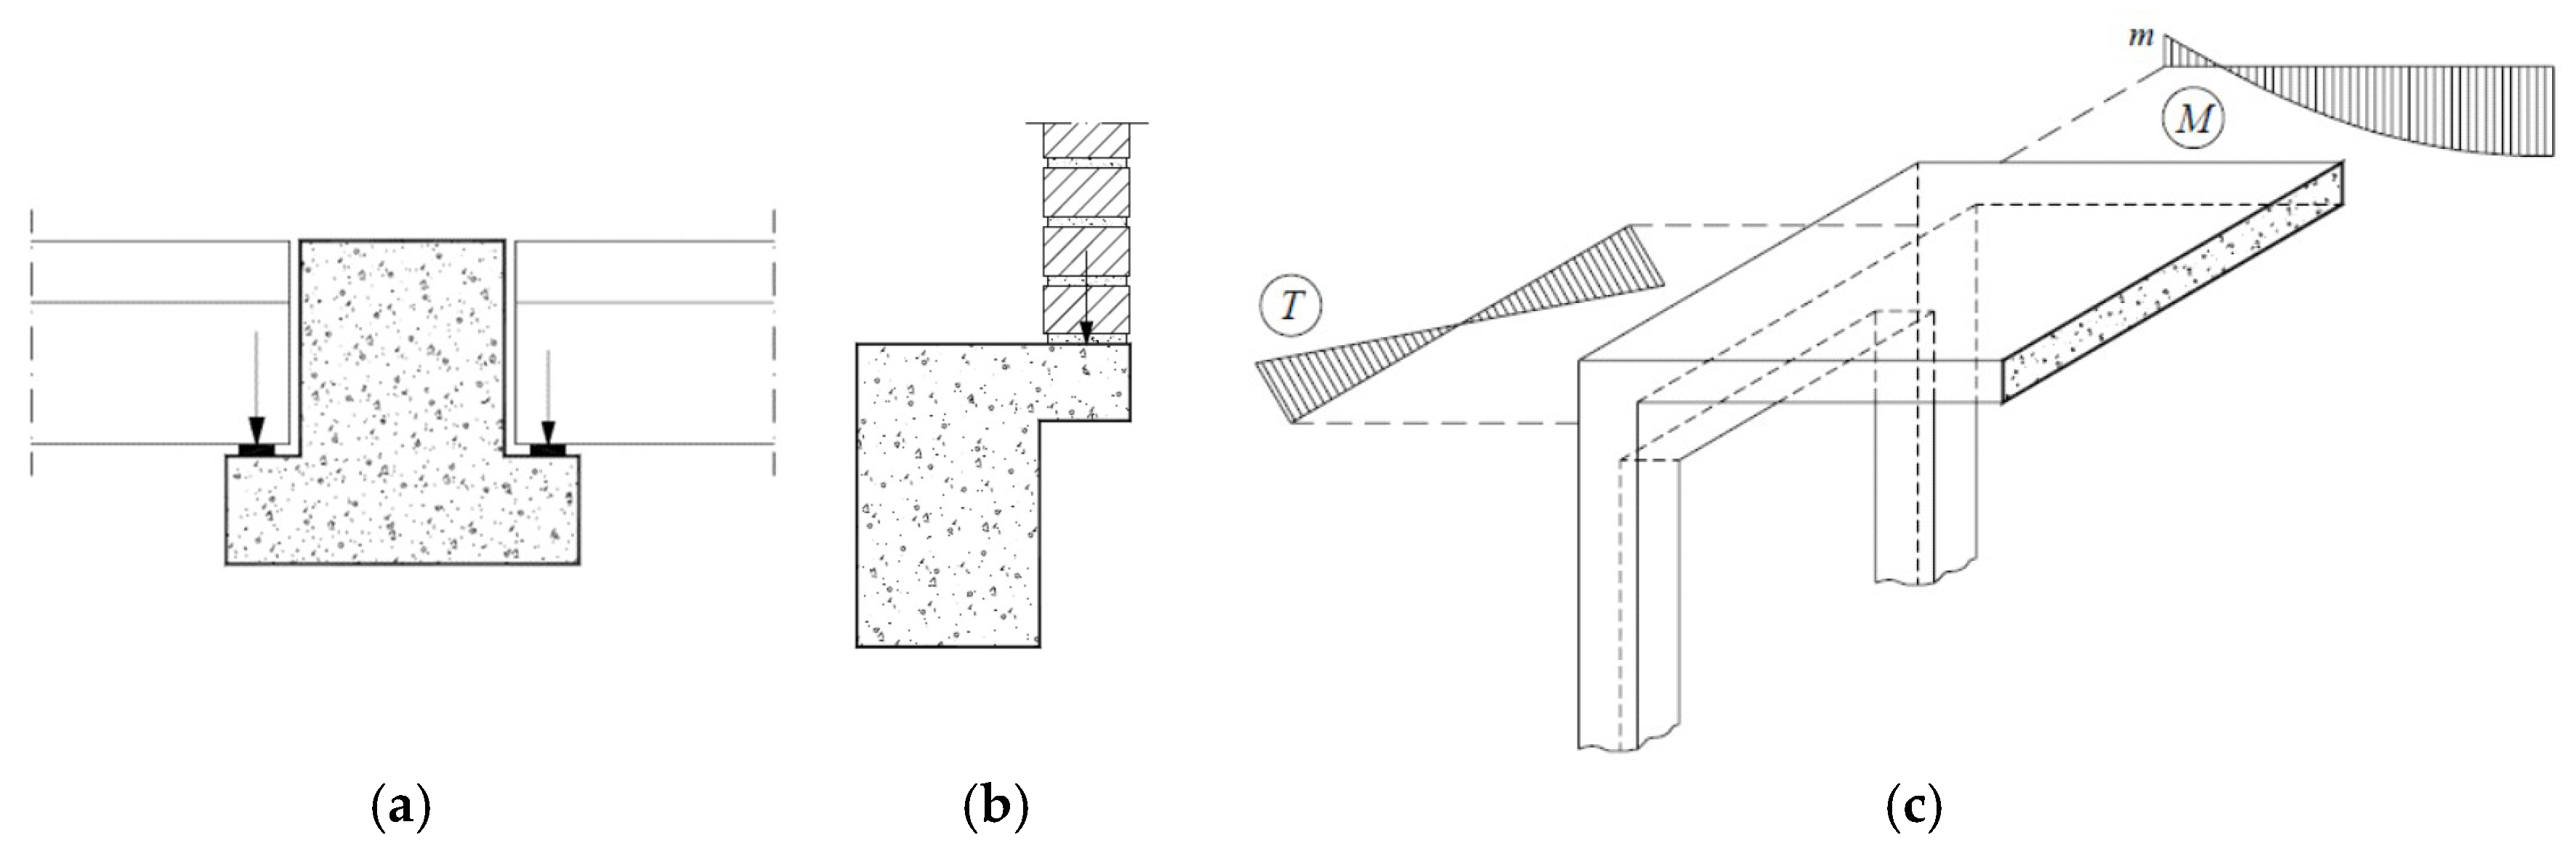
Beams with flanged cross sections are used in many structural systems, such as buildings and bridges. T- and L-shaped beams are widely used to support precast members (slabs and beams, (Figure 1a)) or walls (Figure 1b). In current RC pavements of buildings (Figure 1c), part of the slabs can be considered as a component of the cross section of the spandrel beams located at the perimeter. Such end beams with slab on only one side are designed as flanged cross sections, namely as L-shaped beams. Due to asymmetric or eccentric loading (Figure 1b,c) and due to the torsional stiffness of the end beam (Figure 1c), such beams may have to withstand high torsional moments, among other internal forces.
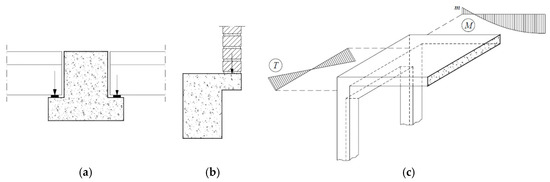
Figure 1.
T- and L-shaped beams with torsional moments: (a) supporting beam, (b) eccentric wall, (c) end beam.
Thick flanges, in addition to the web, are favorable for the torsional strength of RC beams. This is because the torsional moment is distributed between the web and the flanges (without warping of the cross section if the components are thick), while the web and its transverse reinforcement carry most of the shear force. However, the behavior of flanged beams under torsion is more complicated when compared with rectangular beams and highly depends on the cross section shape, on the relative dimensions of the components of the cross section and also on the detailing of the reinforcement (both longitudinal and transverse) [8,9,10,11]. For the case of L-shaped beams, the non-symmetric shape induces an additional complex behavior under torsion which needs to be assessed [12]. This explains the small number of articles on the theoretical behavior of RC flanged beams under torsion. In fact, previous studies mainly deal with the torsional behavior of rectangular beams (for instance [13,14,15,16,17]). Despite this, some previous studies in the literature focus on the experimental torsional behavior of RC flanged beams, and some of them also propose analytical models to assess mainly the torsional strength of such beams (for instance [9,18,19,20,21,22,23,24,25,26,27]). However, to assess and calibrate theoretical models which aim to predict the full torsional behavior of the beams, full experimental data are needed. As will be discussed later, only a few studies were found in the literature that related to the experimental behavior of RC flanged beams under torsion and which provided all the experimental data that were needed to properly assess and calibrate theoretical models.
It should also be mentioned that current codes of practice still do not incorporate specific and detailed rules for the design of RC flanged cross sections under torsion, despite attempts made in earlier versions of some codes, such as the American and European codes [28,29]. As a result, engineers still need to rely on personal judgement to design RC flanged beams under torsion.
From the above, it is clear that the modeling of RC flanged beams under torsion is still an open issue and needs further research [8,30].
In this article, the GSVATM is proposed for RC flanged beams under torsion, namely for T- and L-shaped beams. The calculation procedure to include the influence of the flanges is presented, as well as the solution procedure used to calculate the full torsional response of such beams. The predictions computed from the GSVATM are also compared with some experimental results of RC flanged beams under torsion which were found in the literature.
2. The GSVATM
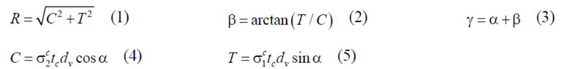
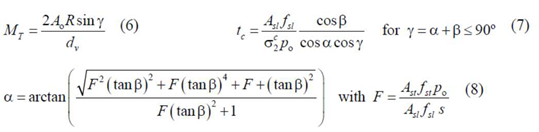
For the sake of this article, this section summarizes the GSVATM model for RC rectangular beams. The main equations, as well as the solution procedure, are also presented here. Additional information about the model can be found in [1]. The first equations (Equations (1–5), see Table 1) are derived based on a plain truss used to model a RC thin beam element under a shear force (Figure 2a). This loading induces a shear flow in the cross section of the thin beam. This beam element is used to model the walls of the equivalent RC box beam element under torsion illustrated in (Figure 2b), and from which Equations (6)–(11) are derived (see Table 1). When compared to the VATM [2,3], the GSVATM incorporates an additional feature which is a concrete tie with a tensile force in the perpendicular direction to the concrete strut (see Figure 2a). This last one carries a compressive force and makes an angle to the longitudinal axis of the beam. This angle is equal to the angle of cracks (see Figure 2a). The concrete tie aims to simulate the tensile concrete in the referred direction. In Figure 2a, is the resulting force (Equation (1)) with an angle (Equation (2)) to the force and with an angle (Equation (3)) to the longitudinal axis of the beam. Forces (Equation (4)) and (Equation (5)) are, respectively, the resultants of the compressive and tensile stress fields in concrete ( and , respectively). Parameter is the distance between the centers of longitudinal bars and parameter is the width of the thin cross section (see Figure 2a). This latter is equal to the width of the concrete strut and tie.

Table 1.
Equations for GSVATM (reinforced concrete (RC) beams).
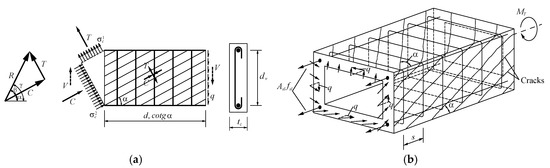
Figure 2.
Beam elements to derive the equations for the generalized softened variable angle truss-model (GSVATM): (a) thin beam, (b) box beam.
In the box beam element, the torsional moment and the shear flow are related by using the classical Bredt′s thin tube theory for thin tubes. Three equilibrium equations (Equations (6)–(8)) are derived to calculate the following: the torsional moment , the effective thickness and the angle . If , Equation (7) is multiplied by the factor (−1). In the previous equations, the other parameters are the following: and are, respectively, the area enclosed and the perimeter of the center line of the shear flow which is assumed to coincide with the center line of the walls (, with and the minimum and maximum outer dimensions of the cross section, and ); is the area of the longitudinal steel reinforcement; is the area of one bar of the transverse steel reinforcement (closed stirrups); is the spacing of the stirrups in the longitudinal direction; and are the stresses in the longitudinal and transverse steel reinforcement, respectively.
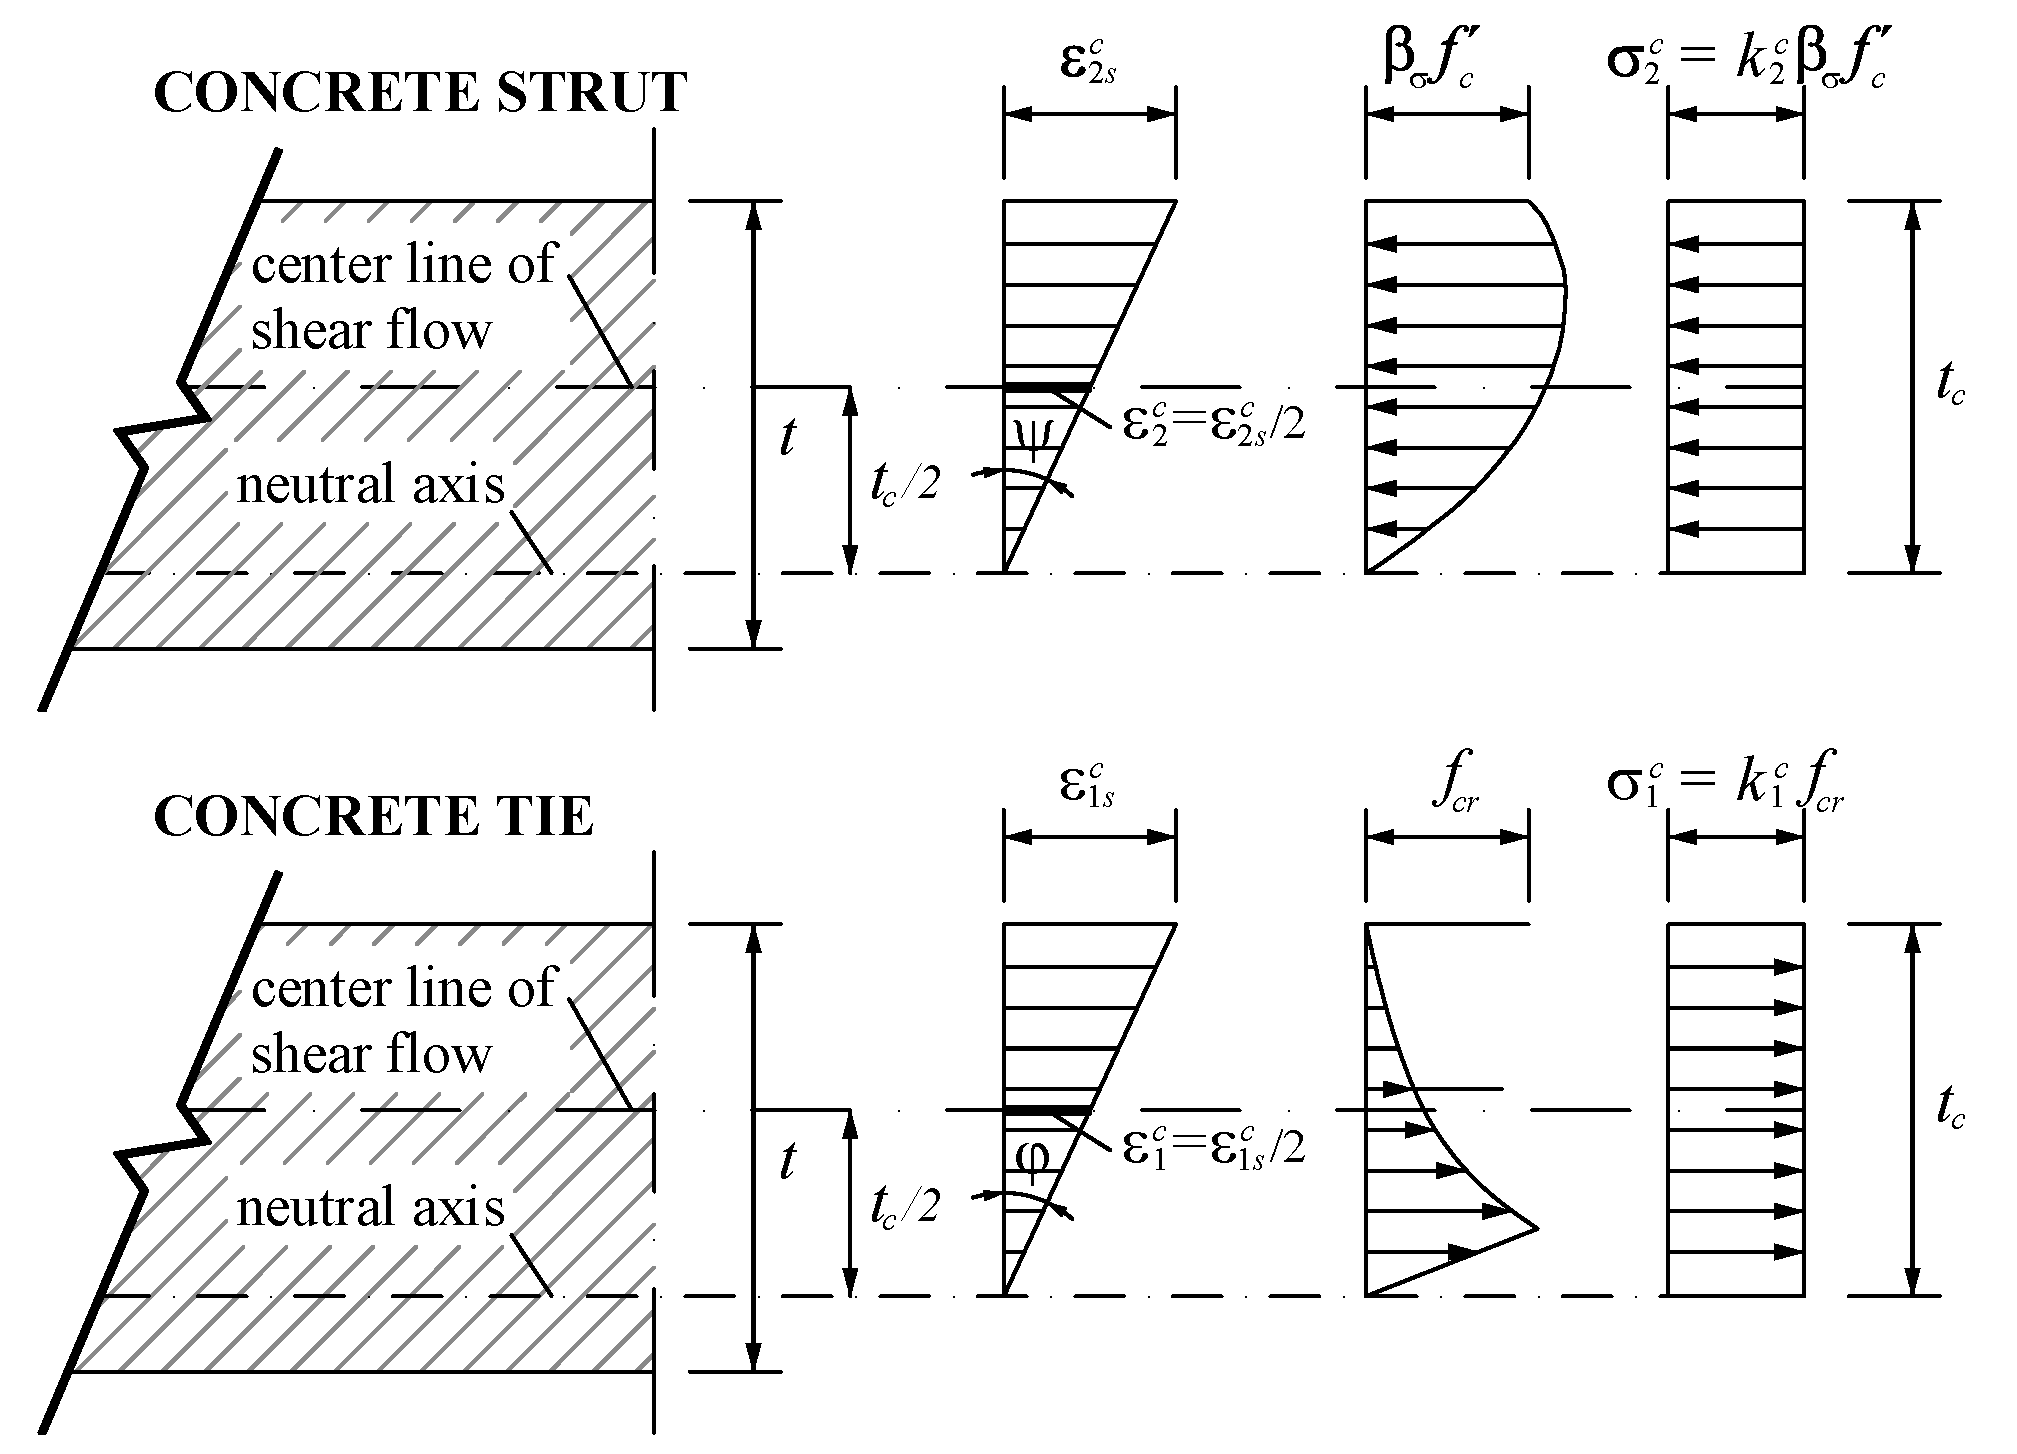
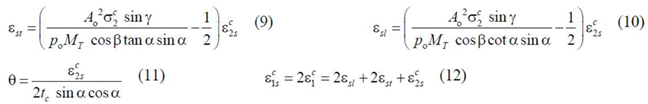
For the box beam element, three compatibility equations (Equations (9–11)) are also derived to calculate the following: the strains in the transverse and longitudinal steel reinforcement, and respectively, and the angular deformation per unit length (twist) . Equation (12) relates the strains. In the previous equations, the other parameters are: is the maximum compressive strain which occurs at the outer fiber of the concrete strut; and are the average strains in the concrete strut and tie, respectively. The distribution of the strains among the thickness of the struts and ties accounts for the bending of the walls which induces a strain gradient (Figure 3).
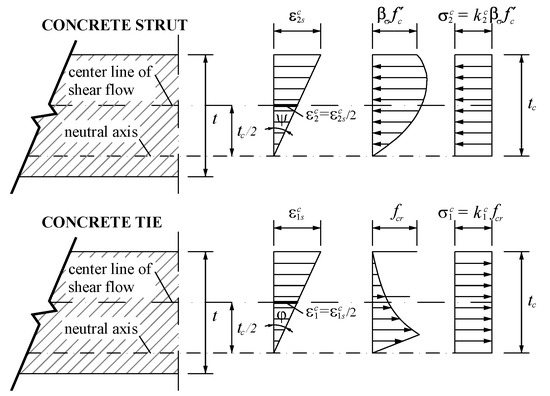
Figure 3.
Stress and strain gradients.
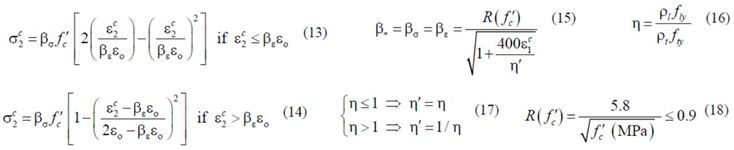
A smeared and softened stress ()–strain () relationship is used for the compressive concrete in the strut. As justified in [4], for the concrete in compression, the relationship proposed by Belarbi and Hsu [31] (Equations (13) and (14) in Table 2) with softening factor for both the peak stress and corresponding strain proposed by Zhang and Hsu in 1998 [32] (Equations (15–18) in Table 2) is used.
Table 2.
Stress–strain () relationship for the materials.
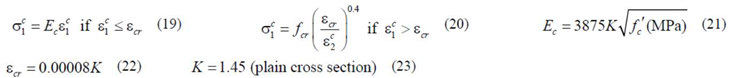
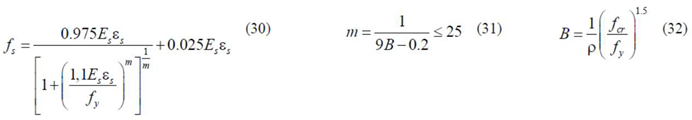
Additionally, a smeared and stiffened relationship is used for the tensile concrete in the tie and also for the tensile steel bars. For the tensile concrete, the relationship from Belarbi and Hsu in 1994 [33] and modified by Jeng and Hsu in 2009 [34] (Equations (19–23) in Table 2) is used. For the steel bars in tension, as justified in [4], the relationship from Belarbi and Hsu in 1994 [33] (Equations (30–32) in Table 2) is used.
In the previous equations, the meaning of the parameters are as follows: is the average compressive strength of concrete and is the corresponding strain; is the longitudinal reinforcement ratio (, with ); is the transverse reinforcement ratio ( , with ); and are the stresses corresponding to the yielding of the longitudinal and transverse reinforcement, respectively; is the Young´s modulus for concrete; is the tensile concrete strength and is the corresponding strain; and are the stress and strain in the steel reinforcement, respectively; is the Young´s modulus for steel; is the stress corresponding to the yielding of the steel reinforcement; and is the reinforcement ratio.
The stress represents the average stress in the concrete strut (Equation (24) in Table 2) and accounts for the strain gradient (Figure 3). The stress represents the average stress in the concrete tie (Equation (27) in Table 2) and also accounts for the strain gradient (Figure 3). Parameters (Equations (25) and (26)) and (Equations (28) and (29)) represent the average compressive and tensile stresses, respectively. These parameters are computed from integration of Equations (13), (14) and (19), (20), respectively.
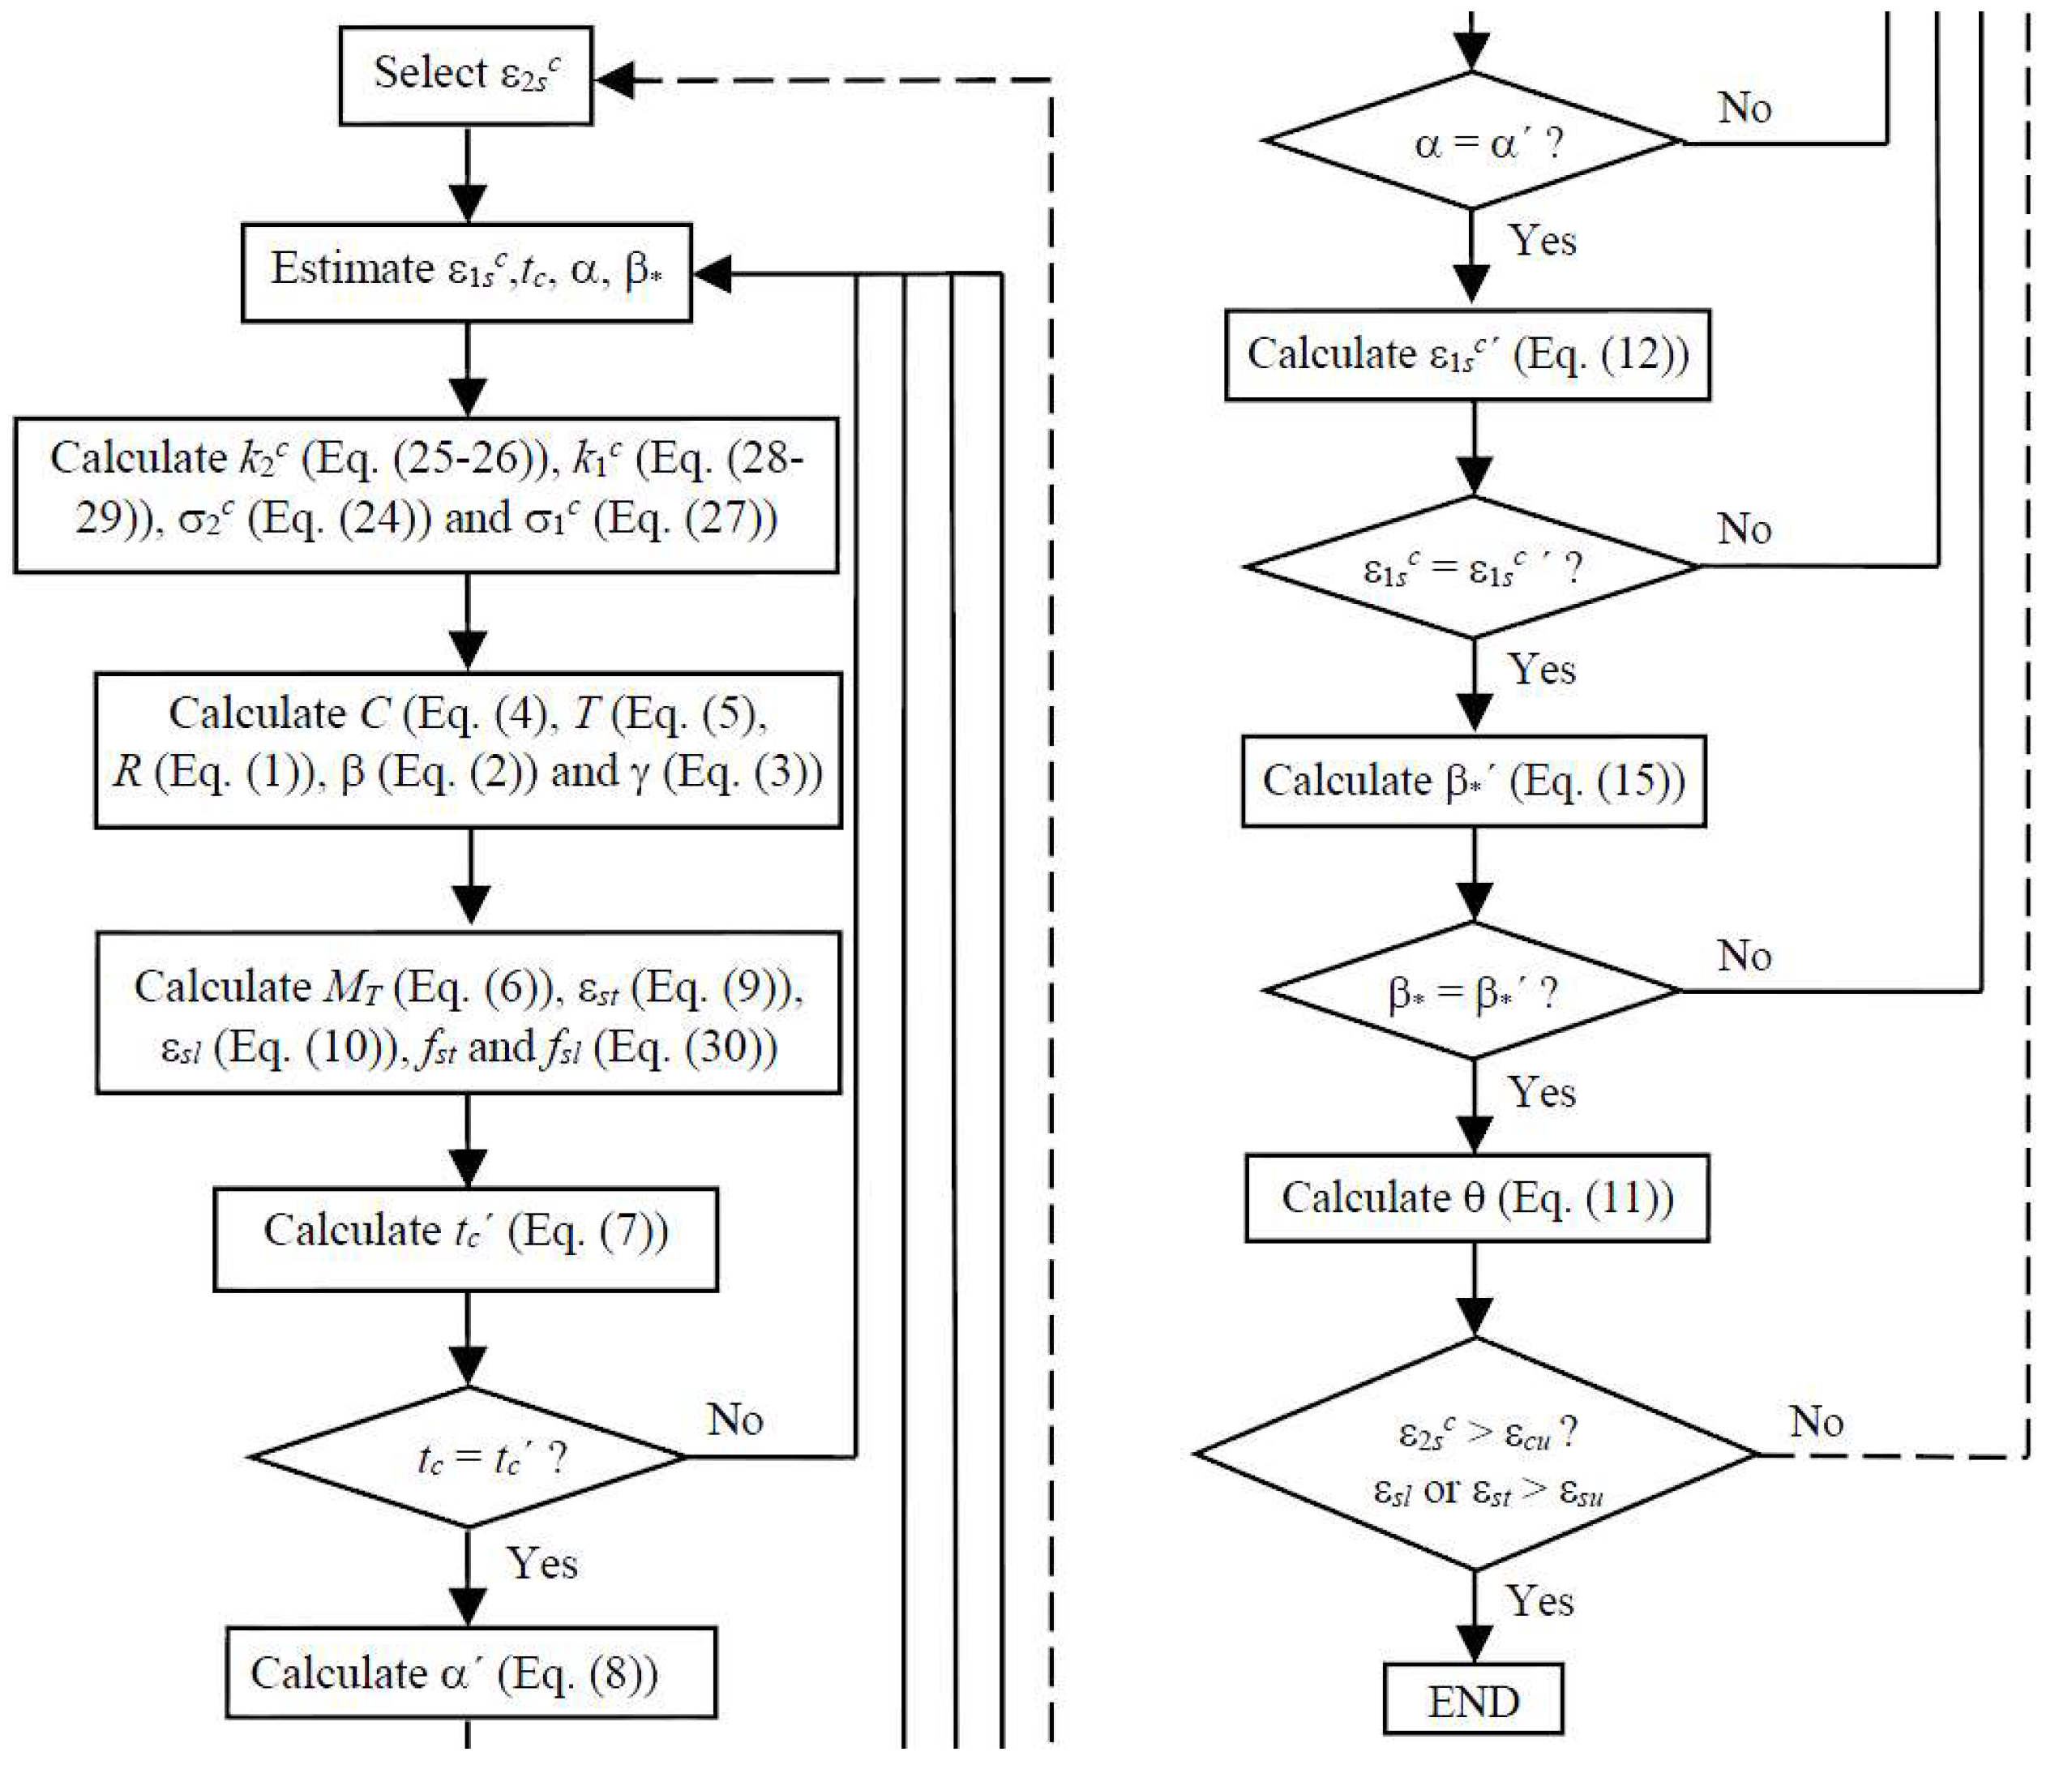
The solution procedure of the GSVATM to calculate the curve accounts for the nonlinearity of the equations and is based on an iterative trial-and-error technique. To start the calculation, some variables must be assumed or estimated and checked latter. Figure 4 illustrates the calculation algorithm. The first input value is the strain (see Figure 3). In each cycle this value is incremented and a point to draw the curve is calculated. In [1] the solution procedure for the GSVATM was computationally implemented with language Delphi. The resulting computing tool was also used in this study to calculate the curve for some reference RC flanged beams (Section 4).
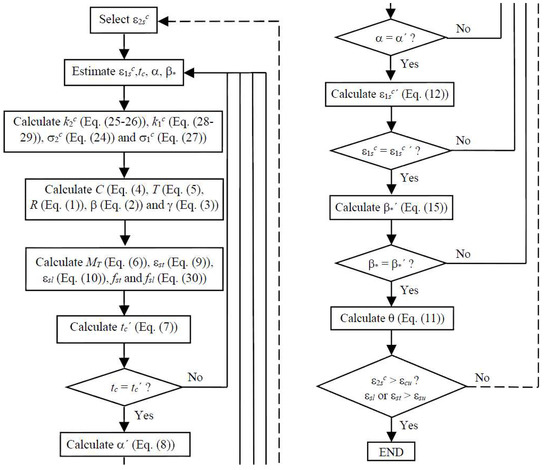
Figure 4.
Flowchart for the GSVATM.
The solution procedure of the GSVATM ends when one of the materials (concrete or steel) reaches its assumed conventional ultimate (failure) strain ( for compressive concrete and for tensile steel reinforcement). In [1], such values were defined from the European code of practice, Eurocode 2 [35], and were also adopted here.
3. Calculation Procedure for RC Flanged Beams
This section aims to present the adopted calculation procedure to model RC flanged beams under torsion, namely T- and L-shaped beams, and which is implemented using the GSVATM. A similar calculation procedure as the one proposed by Deifalla in 2015 [36] to model RC T- and L-shaped beams was adopted, which constitutes a generalization of the one proposed by Deifalla and Ghobarah in 2010 [37] for RC rectangular beams under torsion wrapped with fiber reinforced polymers (FRP). The proposed calculation procedure divides the equivalent box cross section into rectangular sub-elements which are independently analyzed under torsion by using a theoretical model for RC rectangular beams. In the end, the superposition principle is used to compute the response of the original cross section.
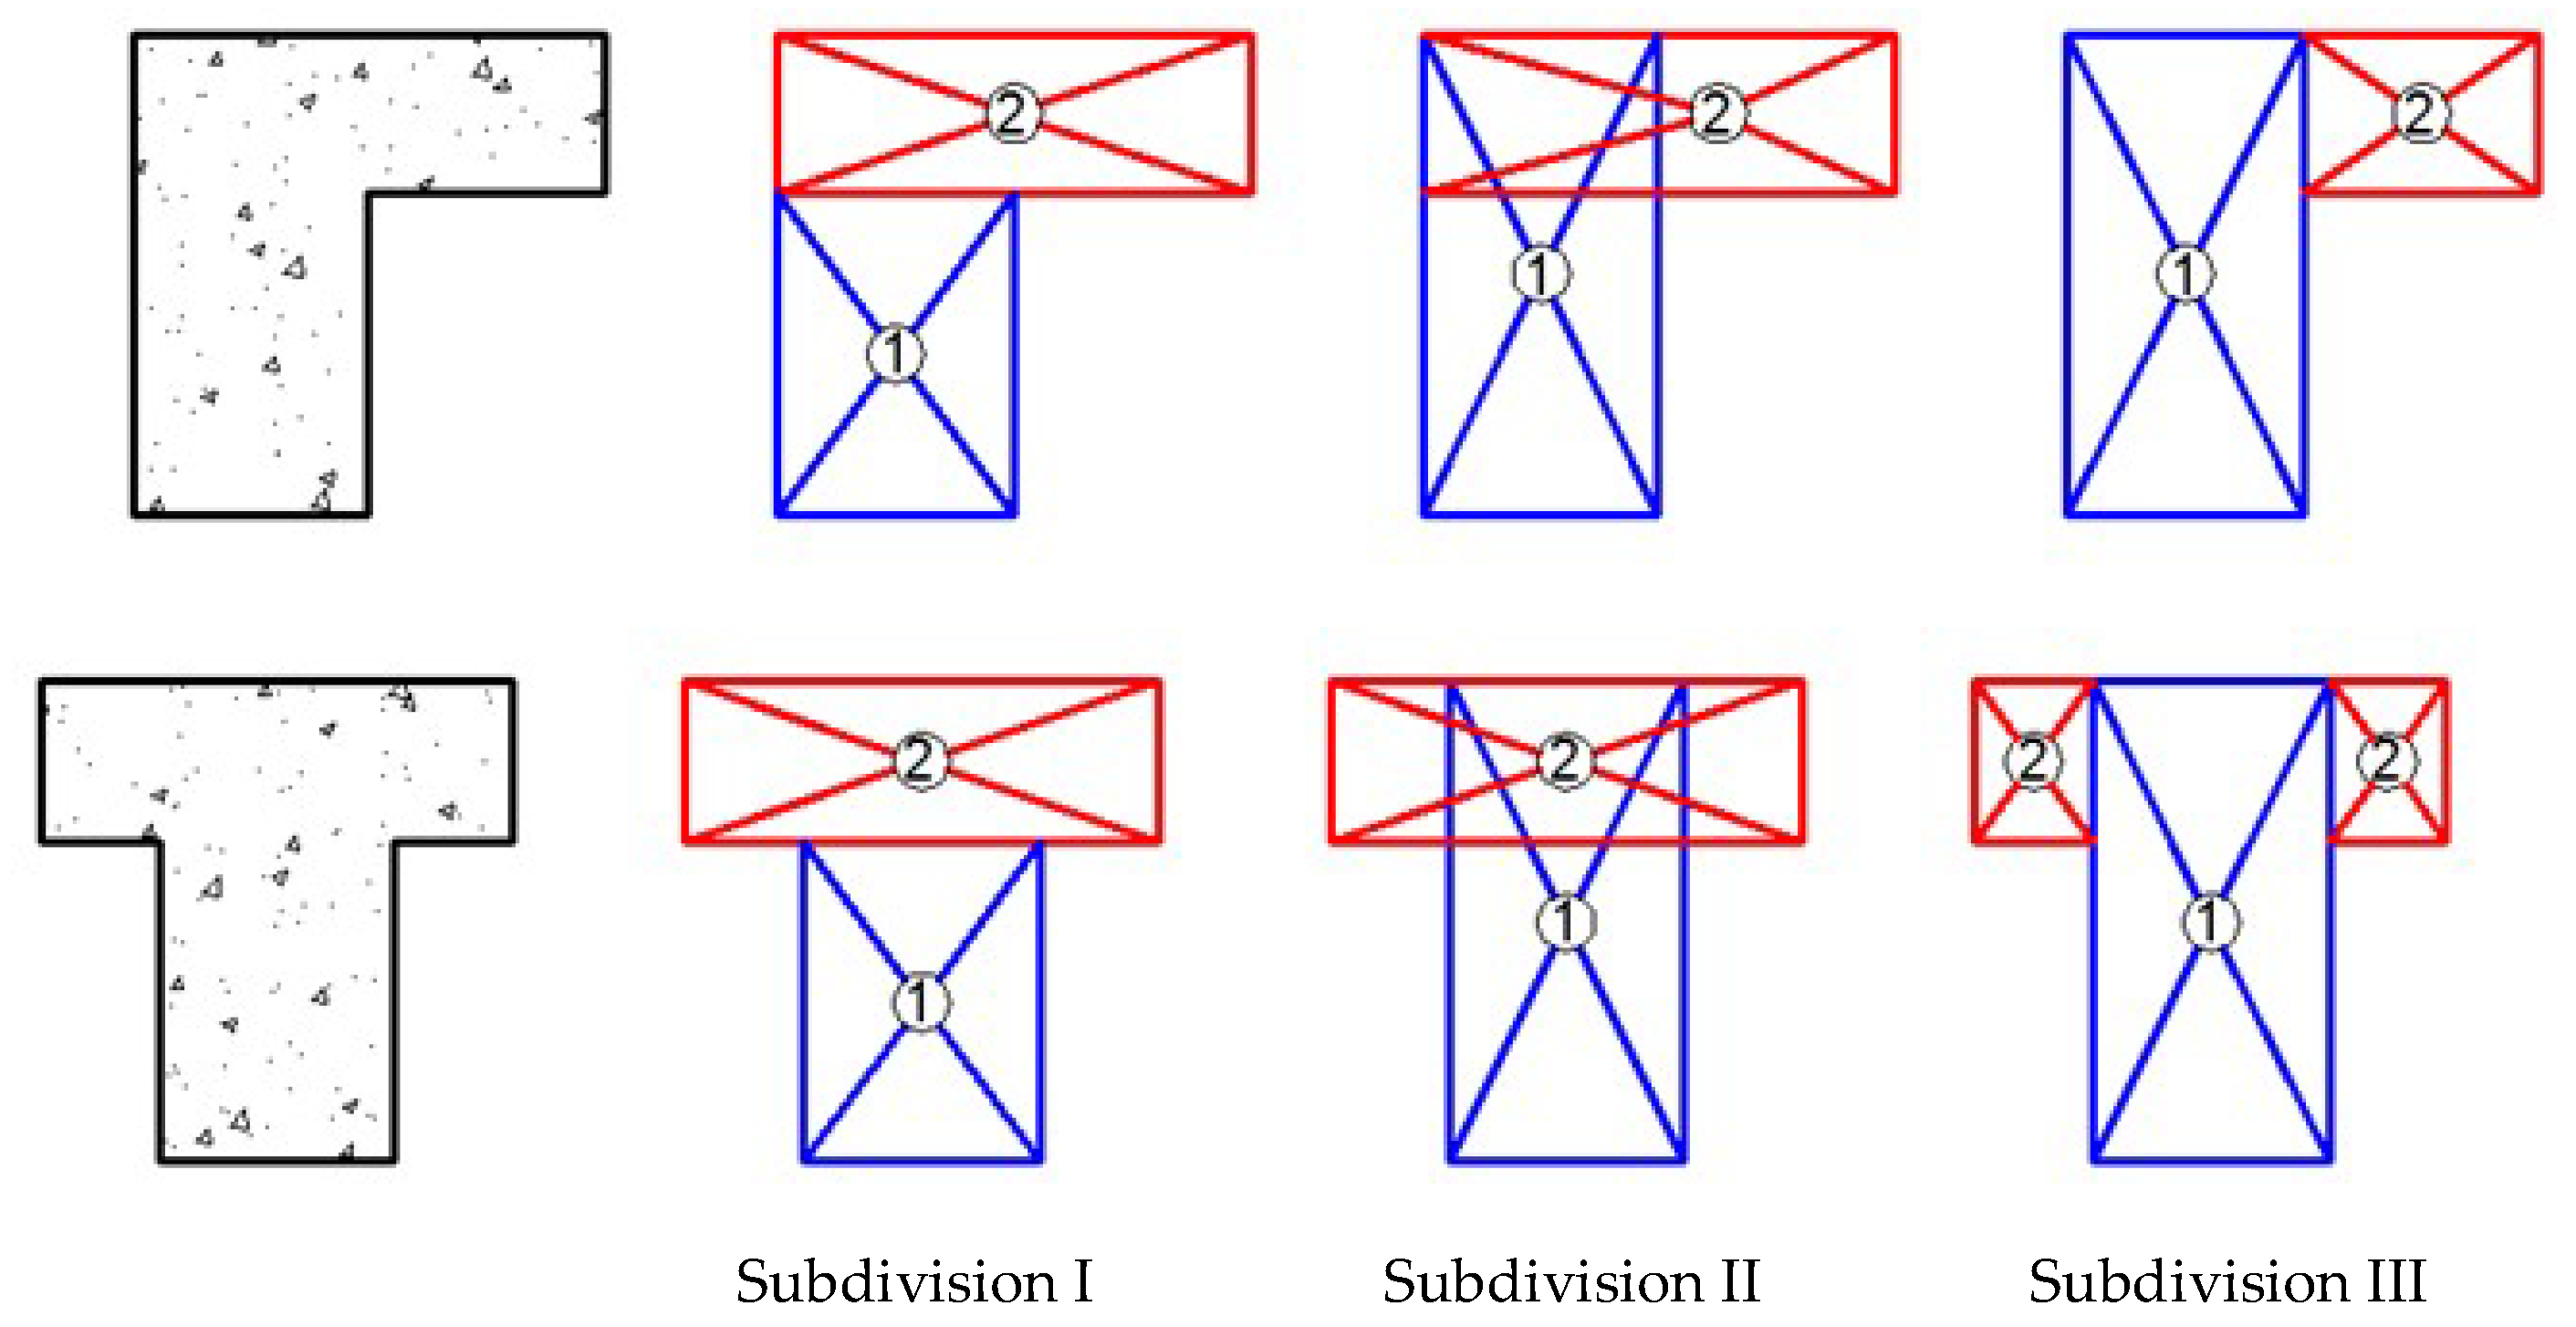
To apply this calculation procedure to RC T- and L-shaped beams, Deifalla [36] proposed subdividing the cross section into three different ways, as shown in Figure 5 (subdivisions I, II and III), and test each of them. The idea to divide the cross section into rectangular components comes from the classical Bach´s theory for thin walled cross sections under torsion. For thick walled cross sections, the connection area between the web and the flange is not negligible when compared to the area of the entire cross section. This raises doubts about how to perform the division into rectangular components. To solve this issue, Deifalla [36] proposed dividing the cross section into different ways and test each of them to find which was the best.
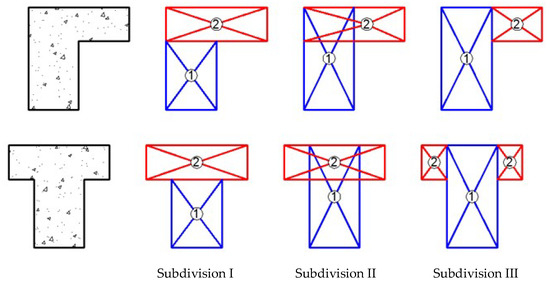
Figure 5.
Subdivisions (I, II and III) of T- and L-shaped beams into rectangular sub-elements.
For each subdivision, each rectangular sub-element was analyzed as an independent RC rectangular beam under torsion by using the GSVATM to compute its full response. After this, the superposition principle was applied in order to calculate the theoretical curve for the original flanged beam. For this, by using deformation compatibility, it is assumed that the twist must be the same, either for the original cross section or for each rectangular sub-element. The torque of the original cross section is given by Equation (33), where is the torque of each rectangular sub-element which imposes the same twist . Parameter represents the number of rectangular components.
Based on the previously described calculation procedure, the main equations and solution procedure of the GSVATM do not need to be changed since each sub-element of the flanged cross section is a rectangle. The followed calculation procedure is summarized as follows:
- 1st step: the original flanged cross section is subdivided (subdivisions I, II and II);
- 2nd step: the GSVATM is used to calculate independently the full curve for each rectangular sub-element and for each subdivision;
- 3rd step: for a given subdivision (I, II or III), and from the list of point solutions for each rectangular sub-element , the torque in the original cross section is computed according to Equation (33) and by using deformation compatibility;
- 4th step: the curve for each subdivision (I, II and III) is obtained. The curves can be compared with experimental results in order to assess which subdivision gives the best result.
As explained in the next section, flanged beams under torsion partially or fully reinforced with glass fiber reinforced polymer (GFRP) bars were also incorporated in this study as reference beams to assess the predictions from the calculation procedure previously explained. For this reason, a new relationship for GFRP must be incorporated in the GSVATM to model the tensile behavior of GFRP bars, either for longitudinal or transverse reinforcement. The following elastic and linear law adopted by Deifalla in 2015 [36] is also used here:
where and are the tensile stress and strain in the fiber direction of the GFRP bar, respectively, and is Young´s modulus.
The conventional ultimate (failure) strain of the GFRP bar was assumed to be the one prescribed by ACI 440.1R-06 [38]:
where is the tensile failure strain, which can be computed from Hooke´s law, with being the tensile failure stress of the GRFP bar:
4. Reference Beams
To assess the calculation procedure explained in the previous section, experimental data related with RC flanged beams under pure torsion were searched in the literature [39]. As referred in the introduction section, few experimental studies were found in the literature for which full data were given. Some studies do not give all the properties of the beams (mechanical and geometrical) that are needed to calculate the curve using the GSVATM. For instance, the full detailing of the reinforcement, the concrete cover or the full mechanical properties of the materials are not given. Other studies do not present the full experimental curve, which is needed to compare with the theoretical one from the GSVATM. Finally, some studies include beams with atypical detailing for the reinforcement (for instance, flanges with insufficient or without transverse reinforcement) which led to atypical failure of the beams. All these reported cases were disregarded for the present study.
As a result, only three RC L-shaped beams and one RC T-shaped beam were found and for which all the data are given. The beams are as follows: beam LB1 (L-shaped) and beam TB1 (T-shaped) from Deifalla et al. in 2013 and 2014 [10,40]; beams BL1 (L-shaped) from El-Kateb et al. in 2013 [41]; and beam BK-T (L-shaped) from Kaminski and Pawlak in 2011 [30].
Due to the aforementioned, the literature review was expanded in order to incorporate additional reference flanged beams. Some recent studies were found which deal with flanged beams under pure torsion partially or fully reinforced with GFRP bars. From those studies, some beams (for which all data were given) were also incorporated in this study as reference beams. These are as follows ones: beams LB2, LB3, LB4 and LB5 (L-shaped) from Deifalla et al. in 2014 [10].
Table 3, Table 4 and Table 5 summarize the properties of the chosen reference beams. Figure 6 defines the geometrical parameters for the T- and L-shaped cross sections presented in Table 3.
Table 3.
Reference beams: geometrical properties.
Table 4.
Reference beams: steel and glass fiber reinforced polymer (GFRP) reinforcement quantities.
Table 5.
Reference beams: material properties.

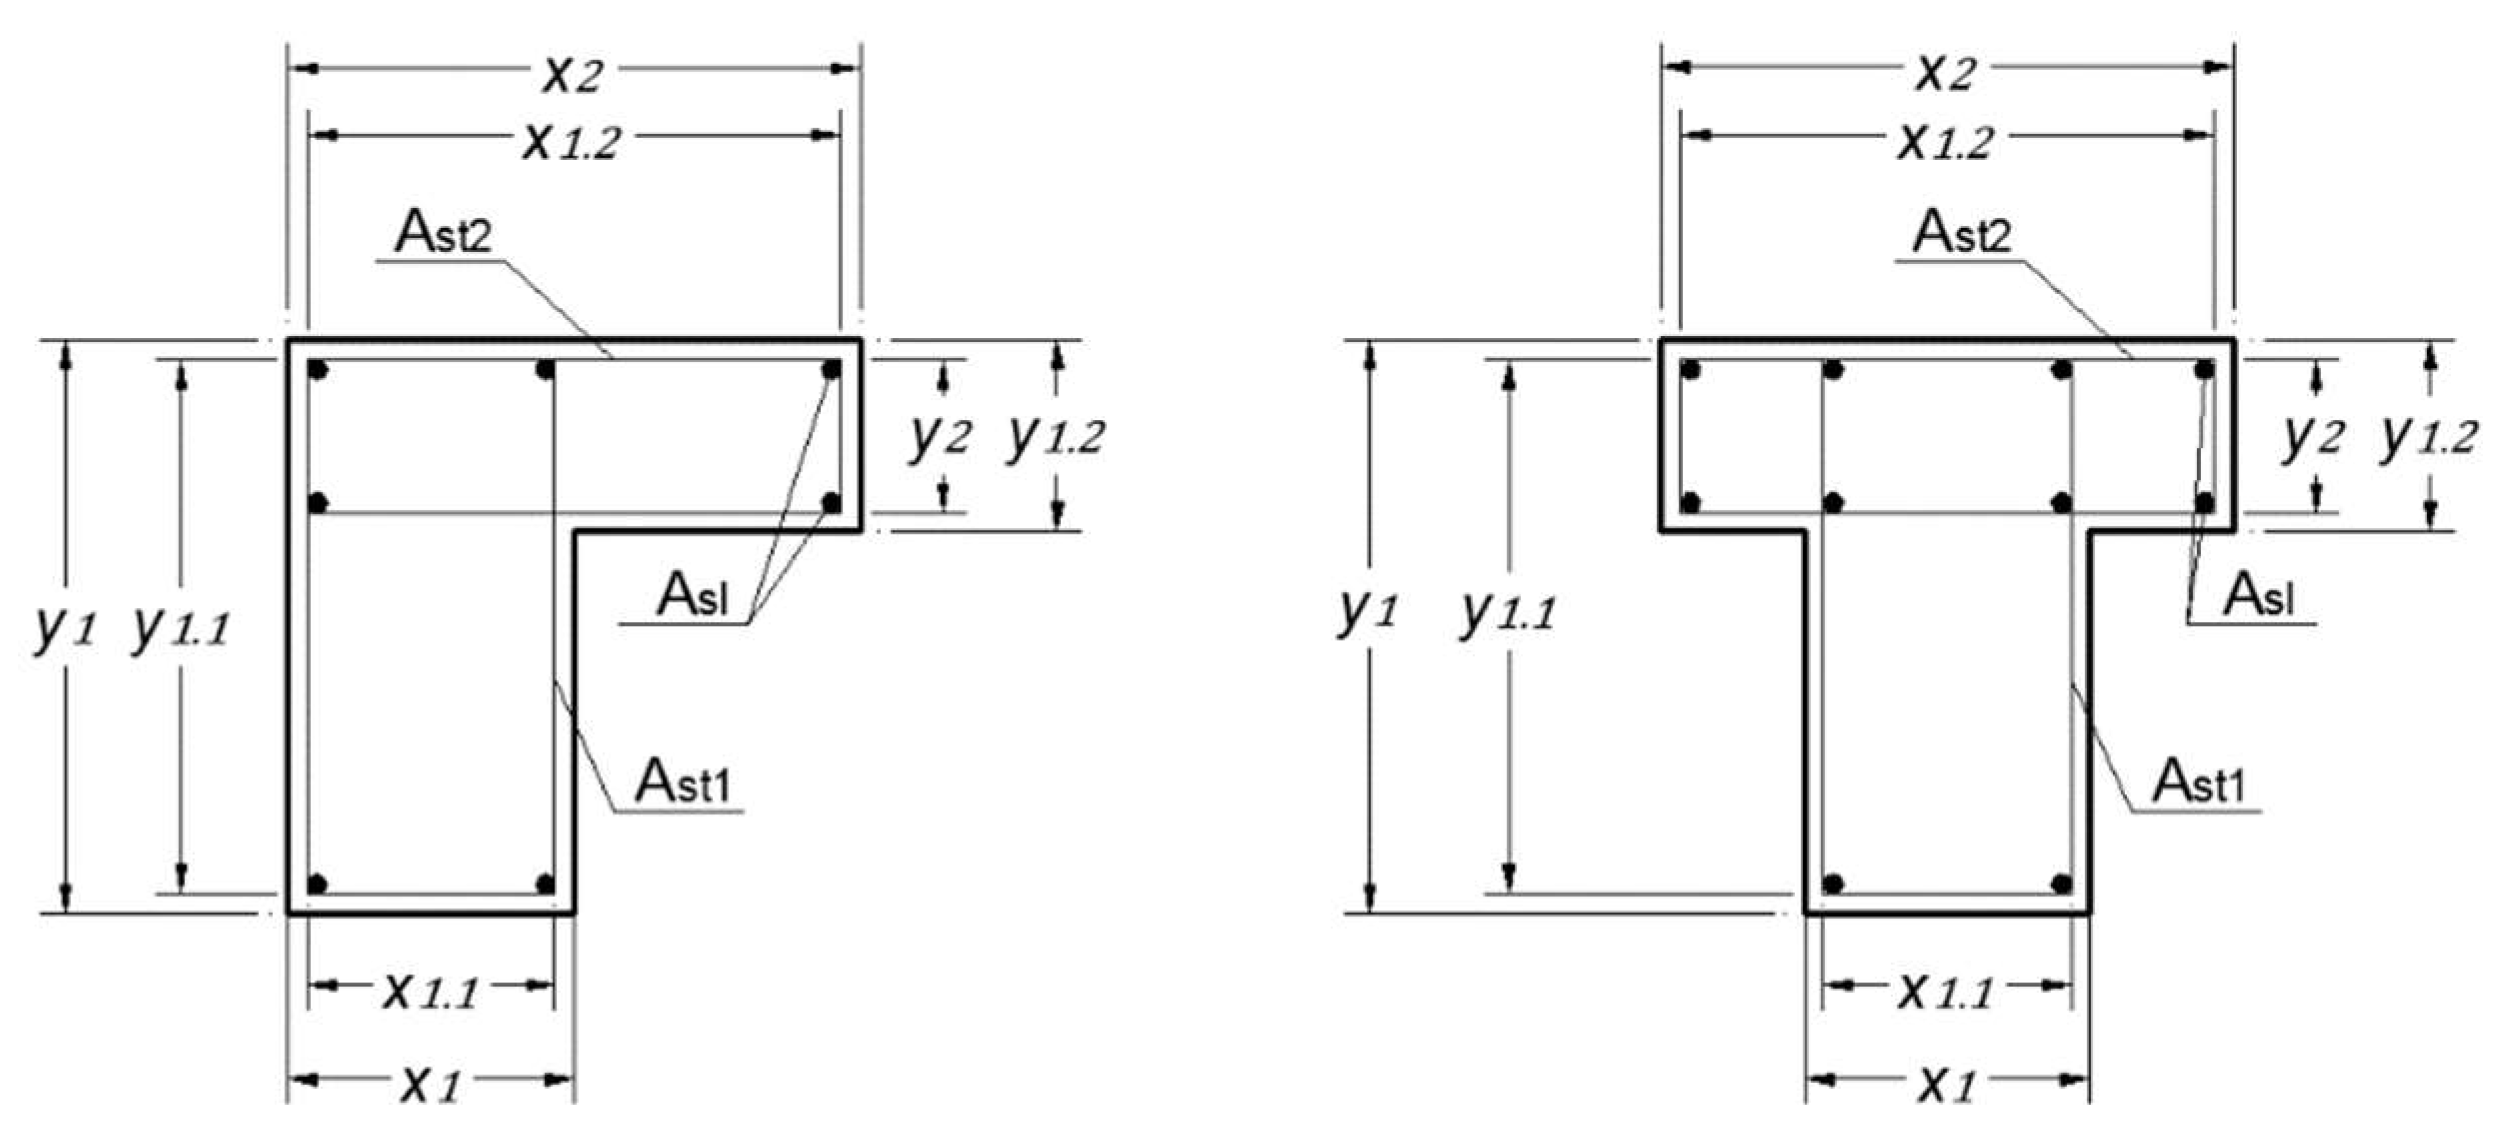
Figure 6.
Geometrical parameters presented in Table 3.
In Table 3 and Table 4 the meaning of the parameters are: and are the width and the height, respectively, of the rectangular component (see Figure 6); and are the width and the height, respectively, of the internal stirrup for the rectangular component (see Figure 6); is the area of the longitudinal steel reinforcement; is the area of one bar constituting the transverse steel reinforcement (closed stirrup) in the rectangular component ; is the spacing of the closed stirrup in the longitudinal direction; is the area of the longitudinal GFRP reinforcement; and is the area of one bar constituting the transverse GFRP reinforcement (closed stirrup) in the rectangular component .
In Table 5, the meaning of the parameters are: is the strength of concrete in compression; is the strength of concrete in tension; and are, respectively, the stresses corresponding to the yielding of the longitudinal and transverse steel reinforcement; and are, respectively, the stresses corresponding to the failure of the longitudinal and transverse GFRP reinforcement; is Young´s modulus of concrete; and are, respectively, Young´s modulus for the longitudinal and transverse steel reinforcement; and are, respectively, Young´s modulus for the longitudinal and transverse GFRP reinforcement; and are, respectively, the strain corresponding to the peak stress and the conventional ultimate strain for the concrete in compression; and are, respectively, the conventional ultimate strains for the longitudinal and transverse steel reinforcement; and are, respectively, the conventional ultimate strains for the longitudinal and transverse GFRP reinforcement.
5. Comparative Analyses
This section discusses the comparative analyses performed between the theoretical results obtained from the calculation procedure presented in Section 2 and Section 3, by using the GSVATM, with the experimental results for the reference RC flanged beams presented in Section 4. Such comparative analyses include the curves and the torsional strength.
It must be referred that subdivisions I, II and III for T- and L-shaped beams, as shown in Figure 5, only show how the concrete cross section is divided into concrete rectangular components. In [36] it is not clearly explained how the reinforcement is divided for each concrete rectangle component. For this study the following criteria are assumed:
- for the transverse reinforcement, since two independent closed stirrups exist (one for the web and another one for the flange, see Figure 6), it is assumed that the closed stirrup of the web constitutes the transverse reinforcement of sub-element 1 and that the closed stirrup of the flange constitutes the transverse reinforcement of sub-element 2 (see Figure 5);
- for the longitudinal reinforcement, it is assumed that the total area of reinforcement is divided among the concrete rectangular components 1 and 2 (see Figure 5) as a function of their area with respect to the total area of concrete in the cross section.
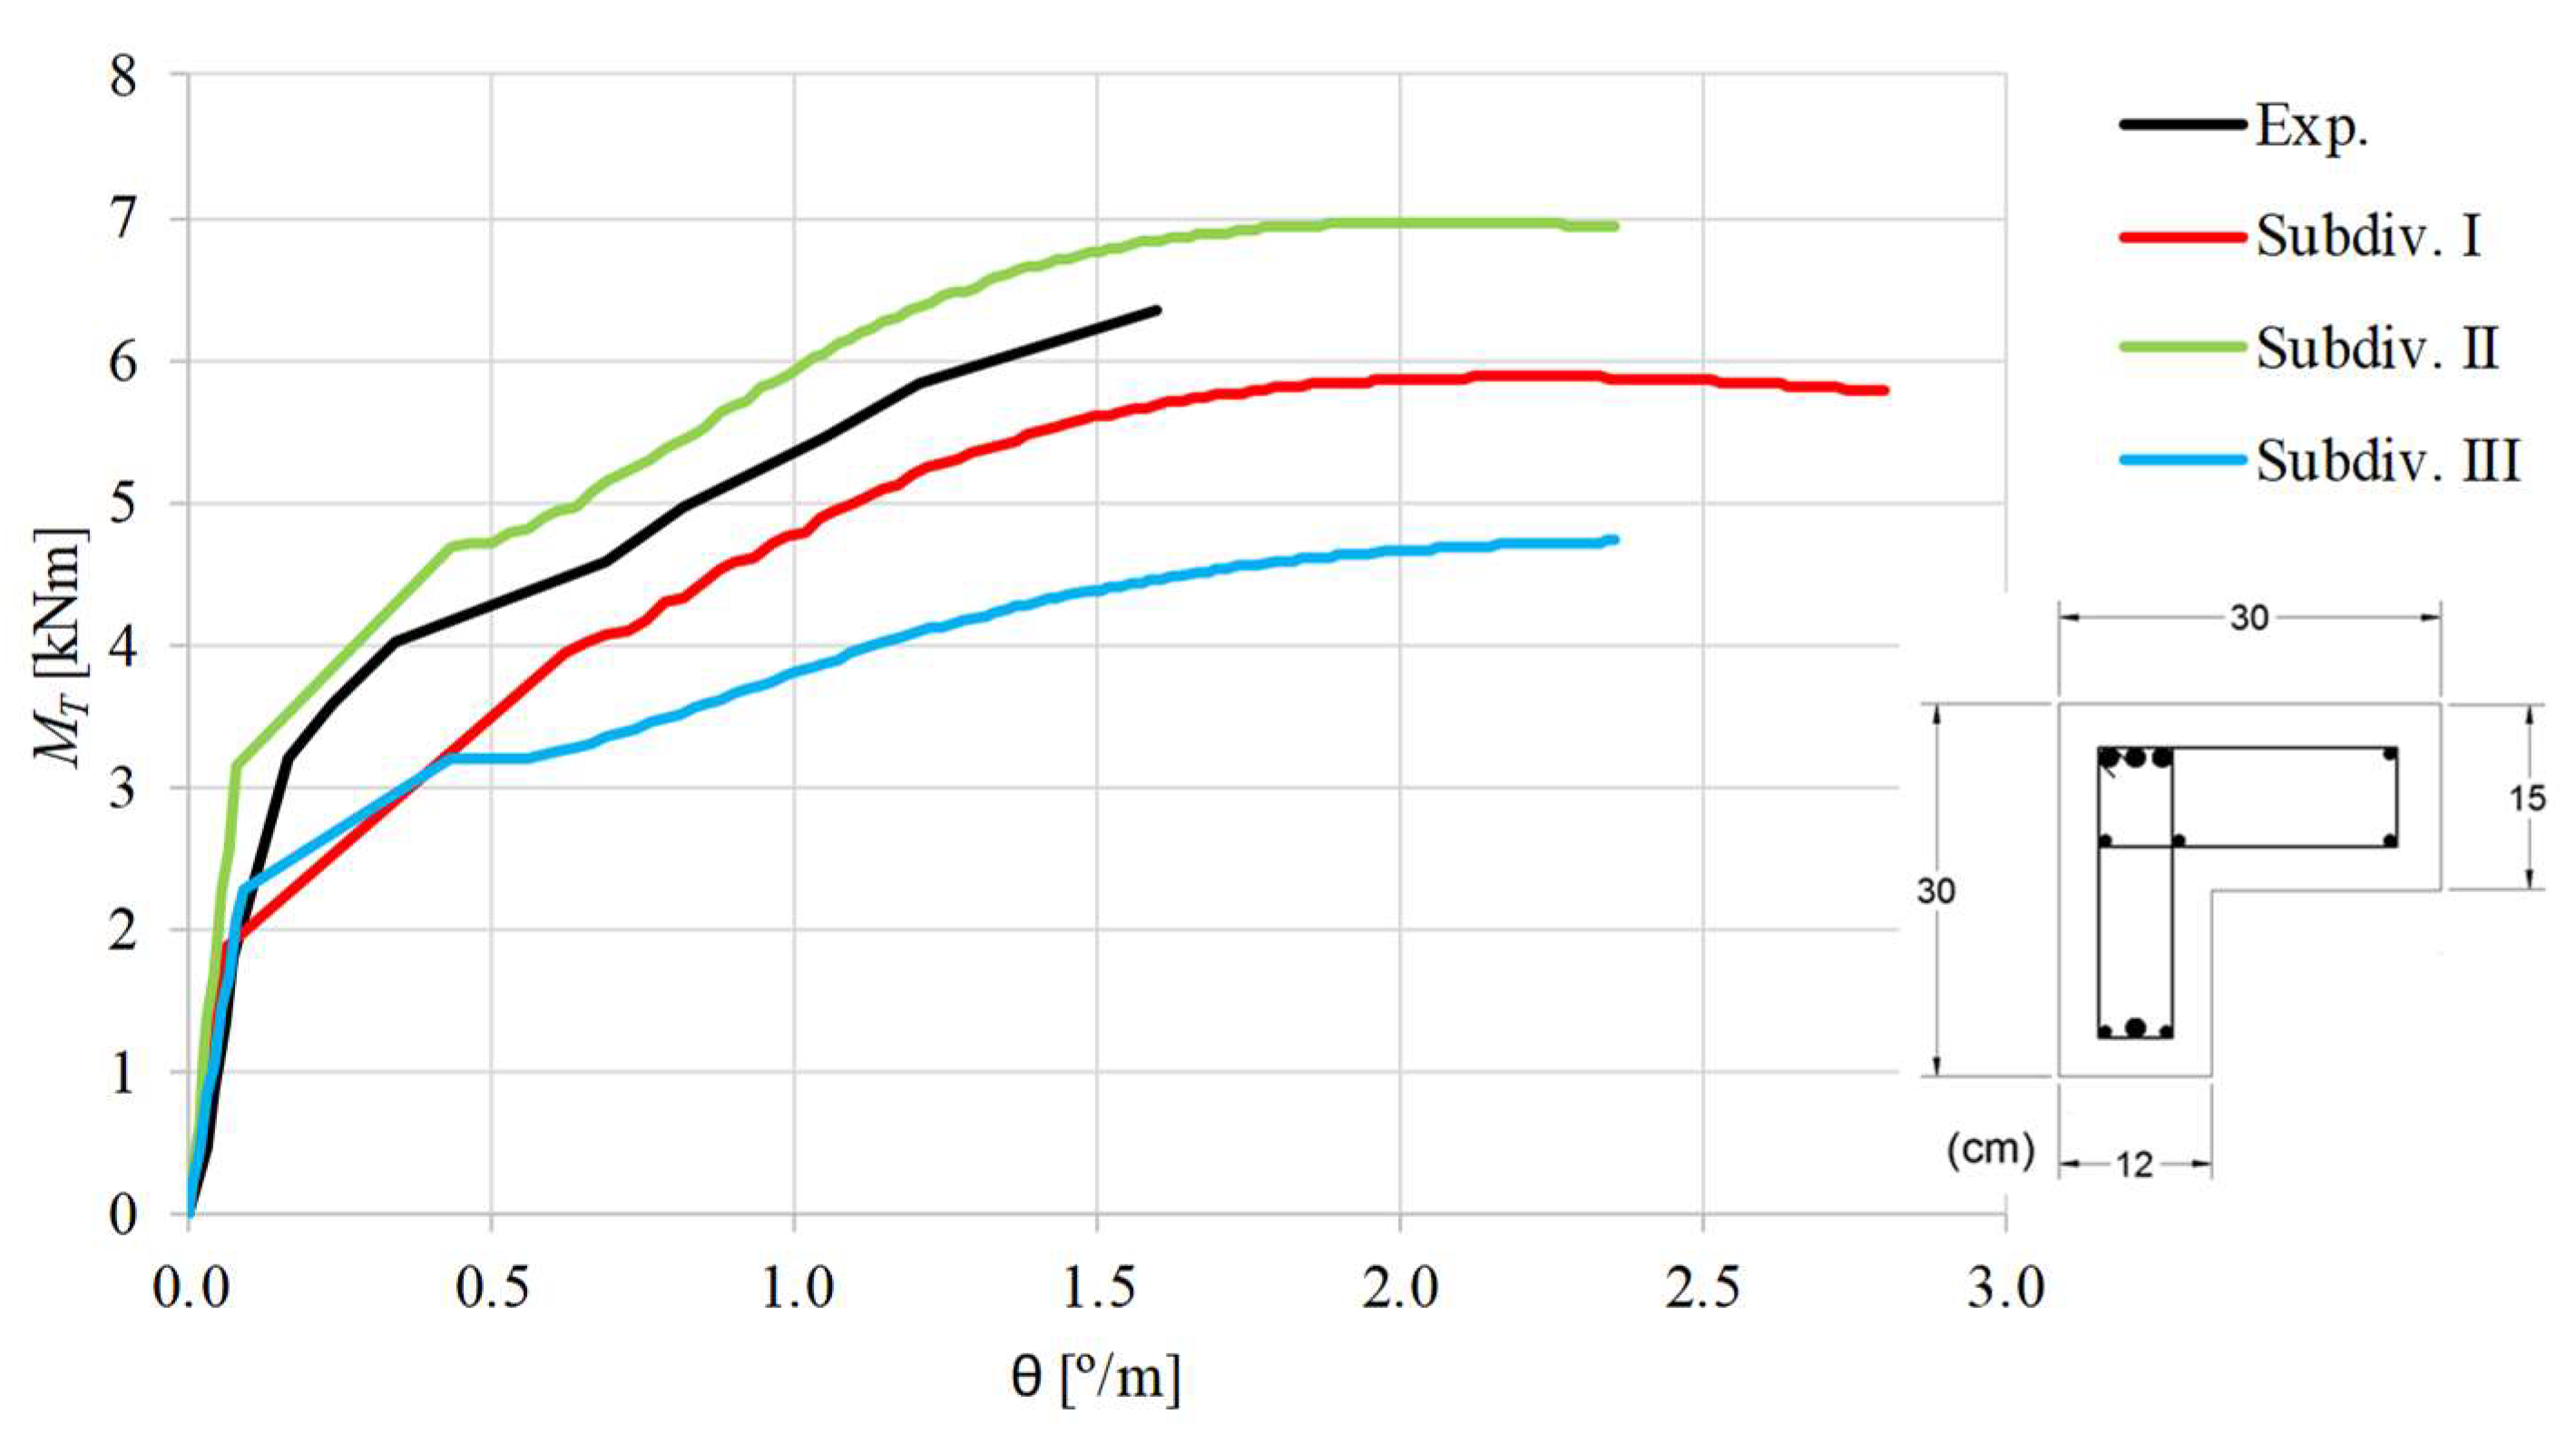
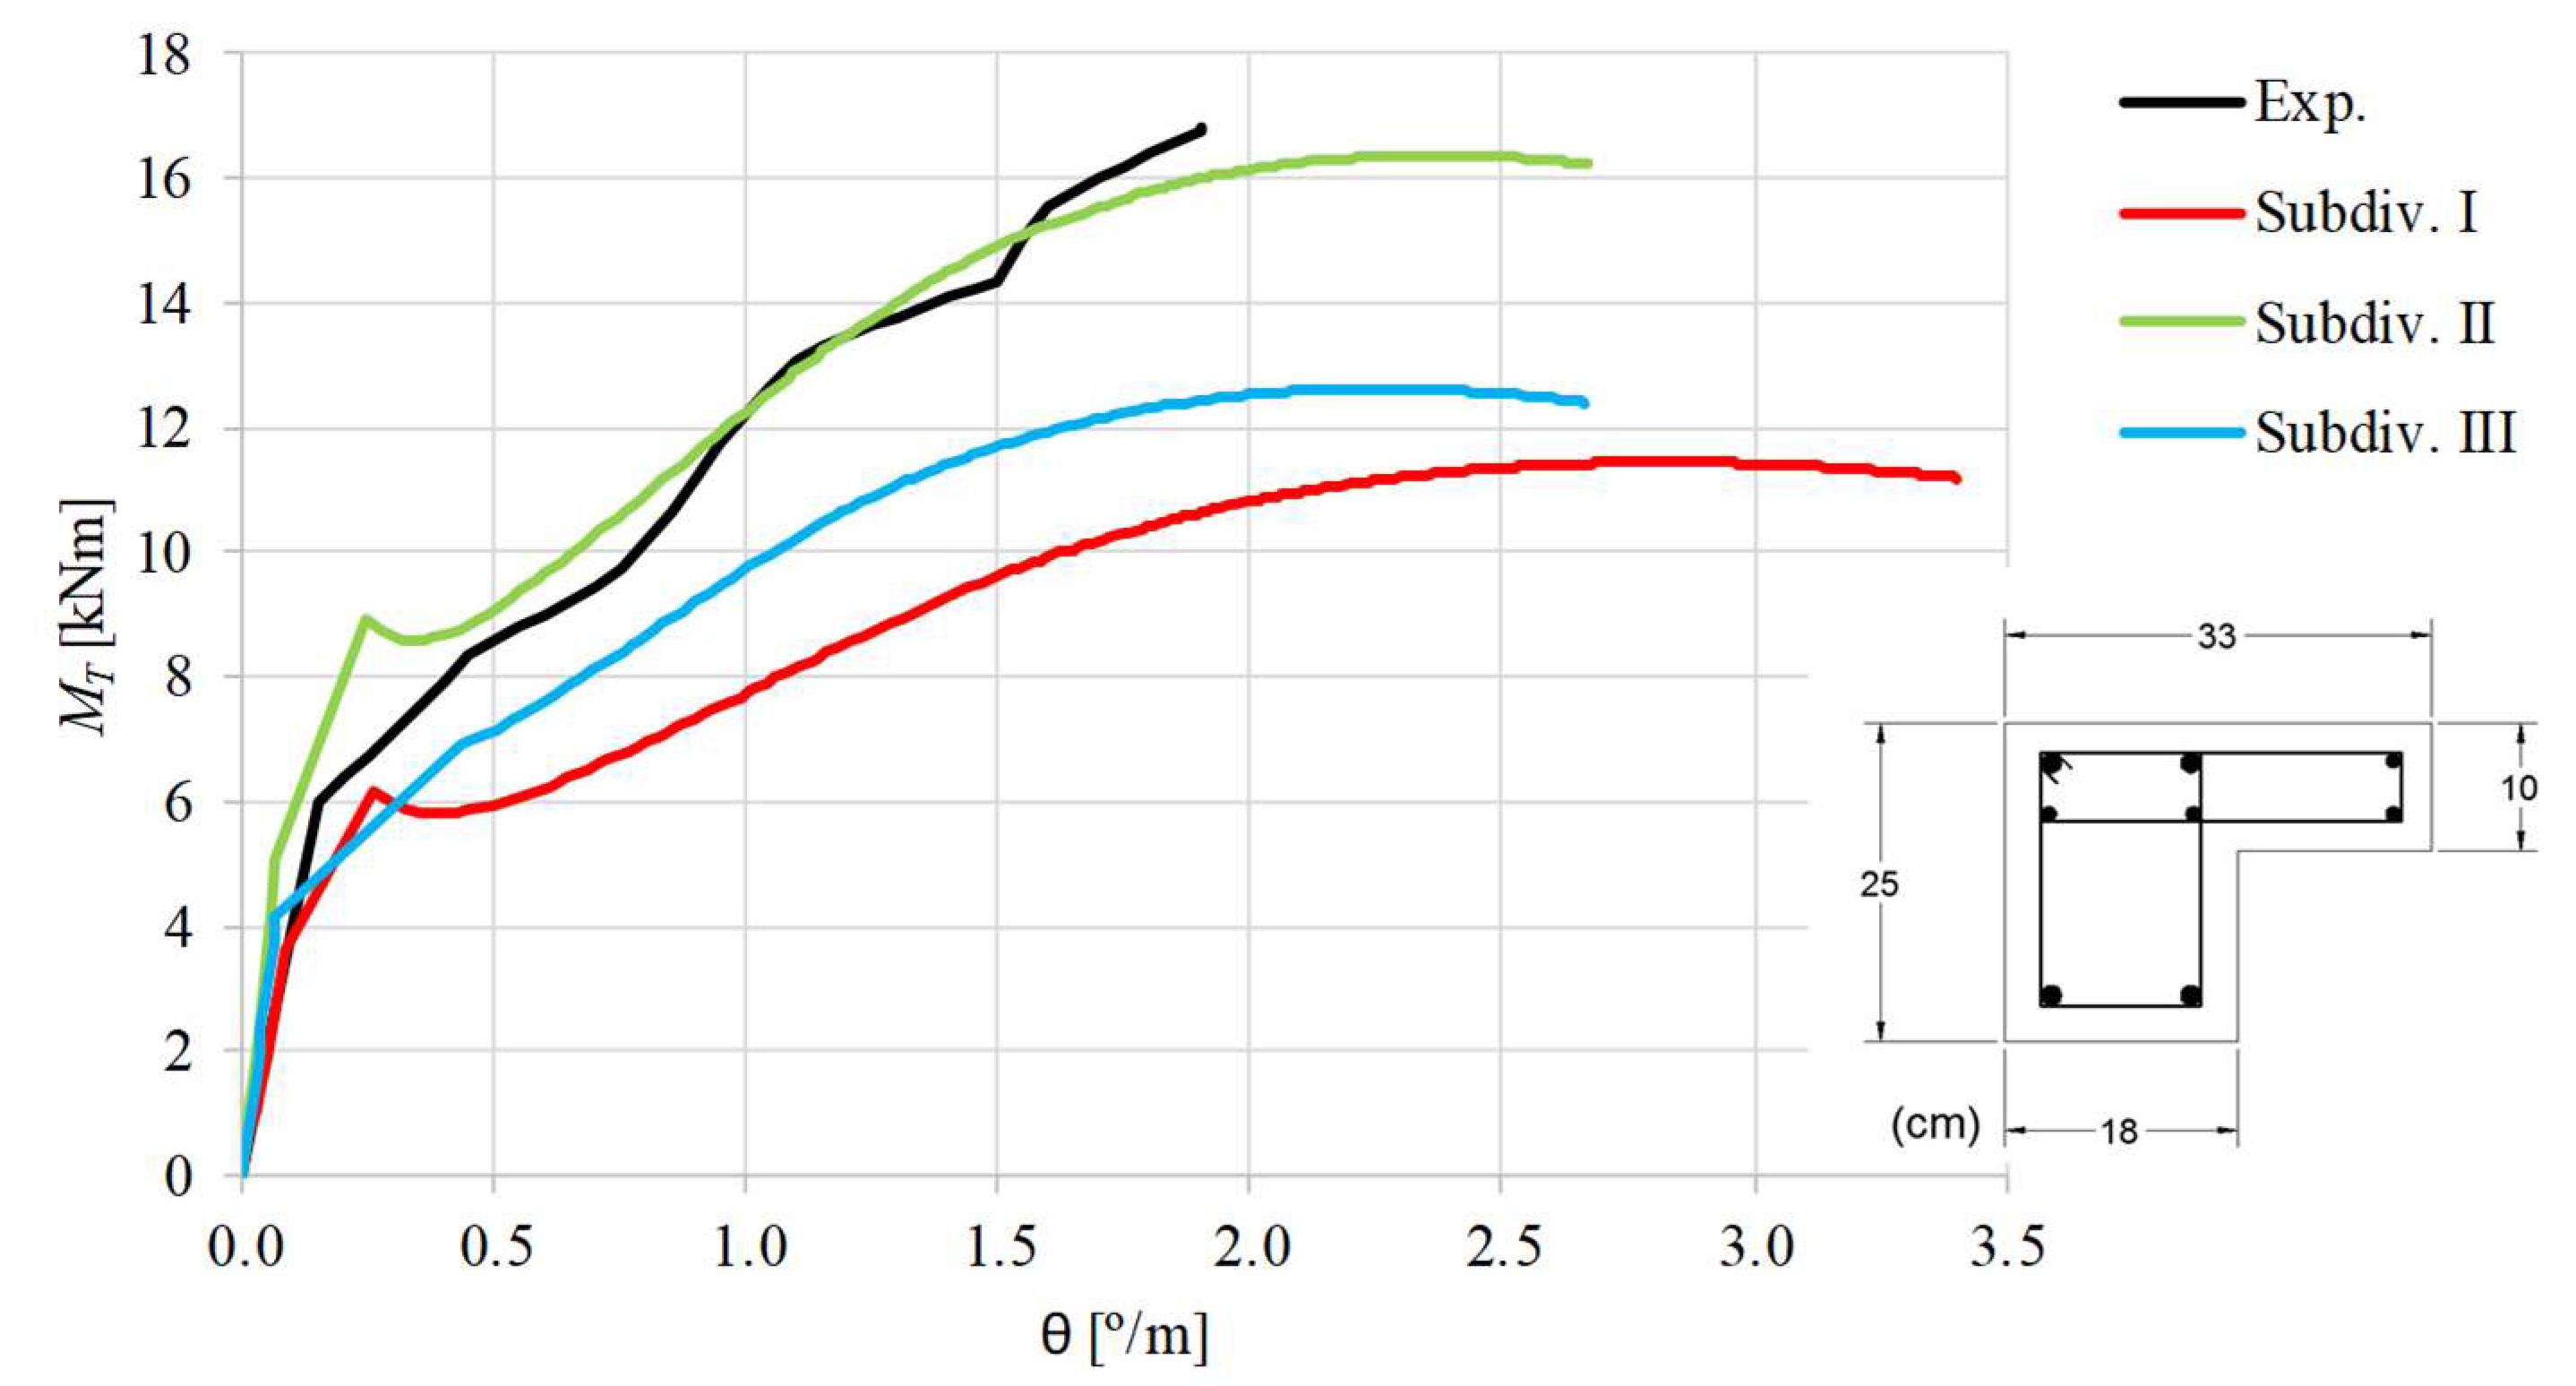
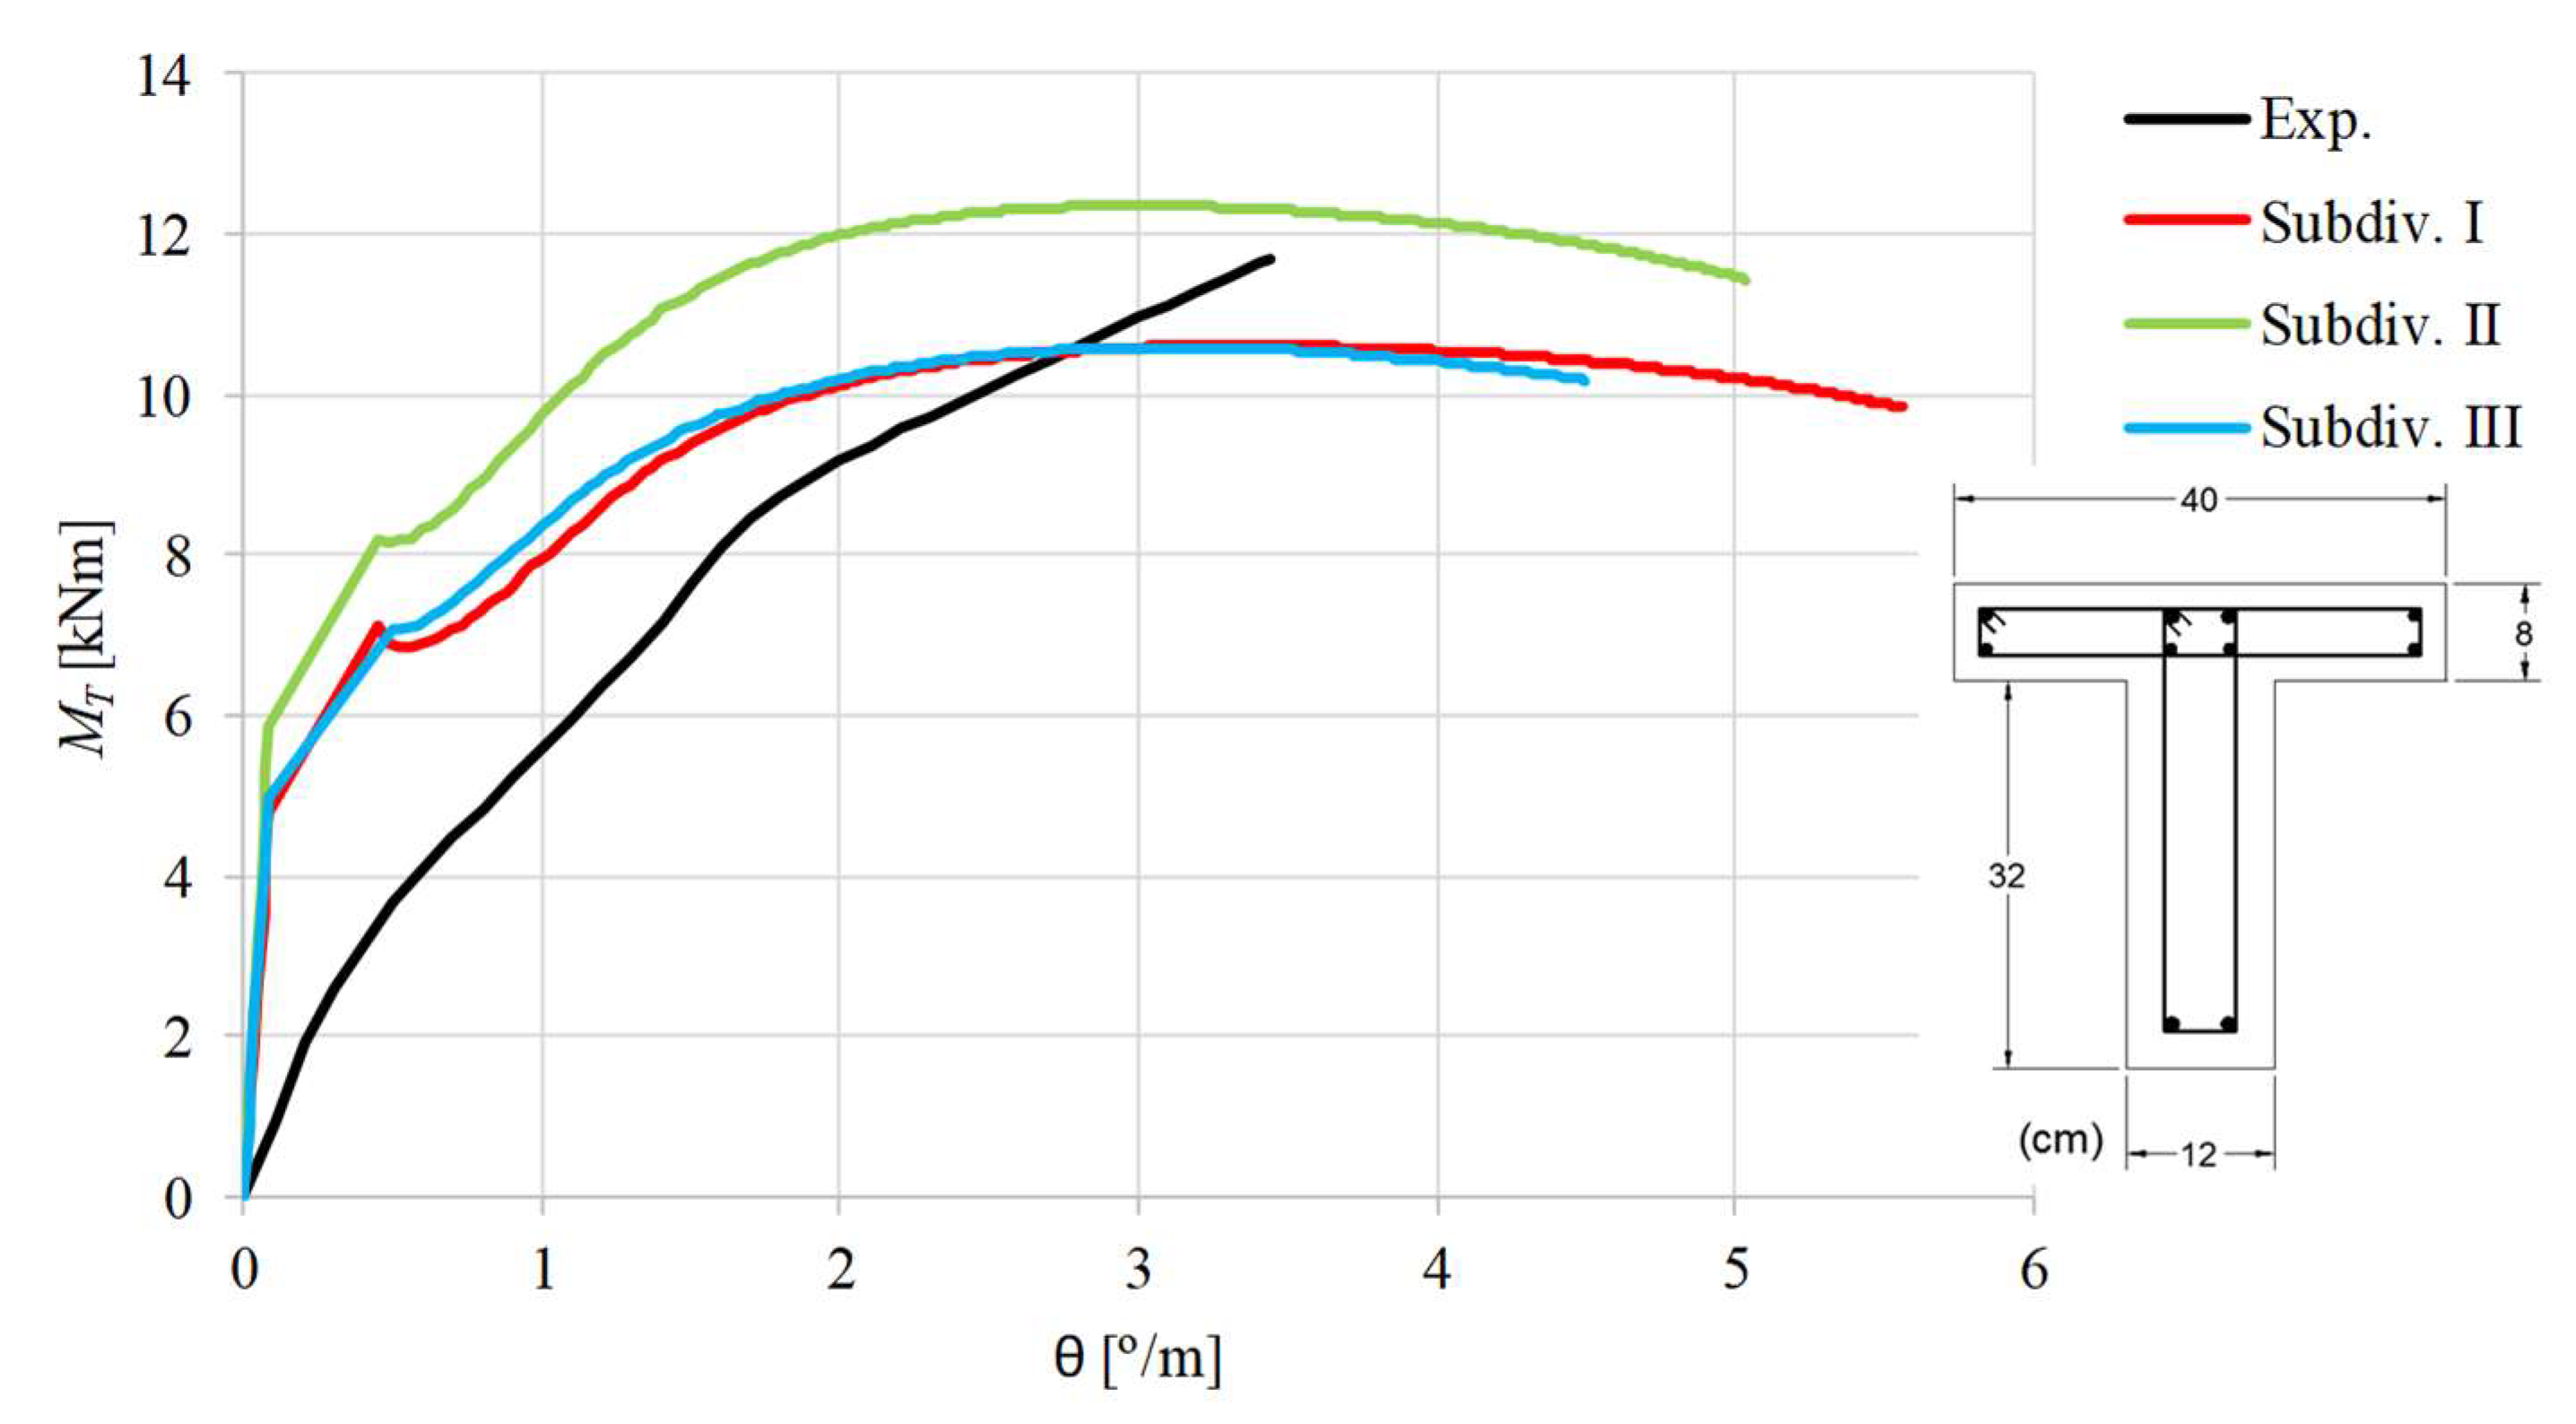
Figure 7, Figure 8, Figure 9, Figure 10, Figure 11, Figure 12, Figure 13 and Figure 14 present, for each reference beams, the curves. Each graph includes the experimental curve and three theoretical curves, one for each subdivision.
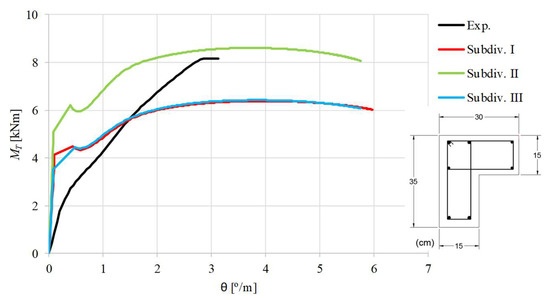
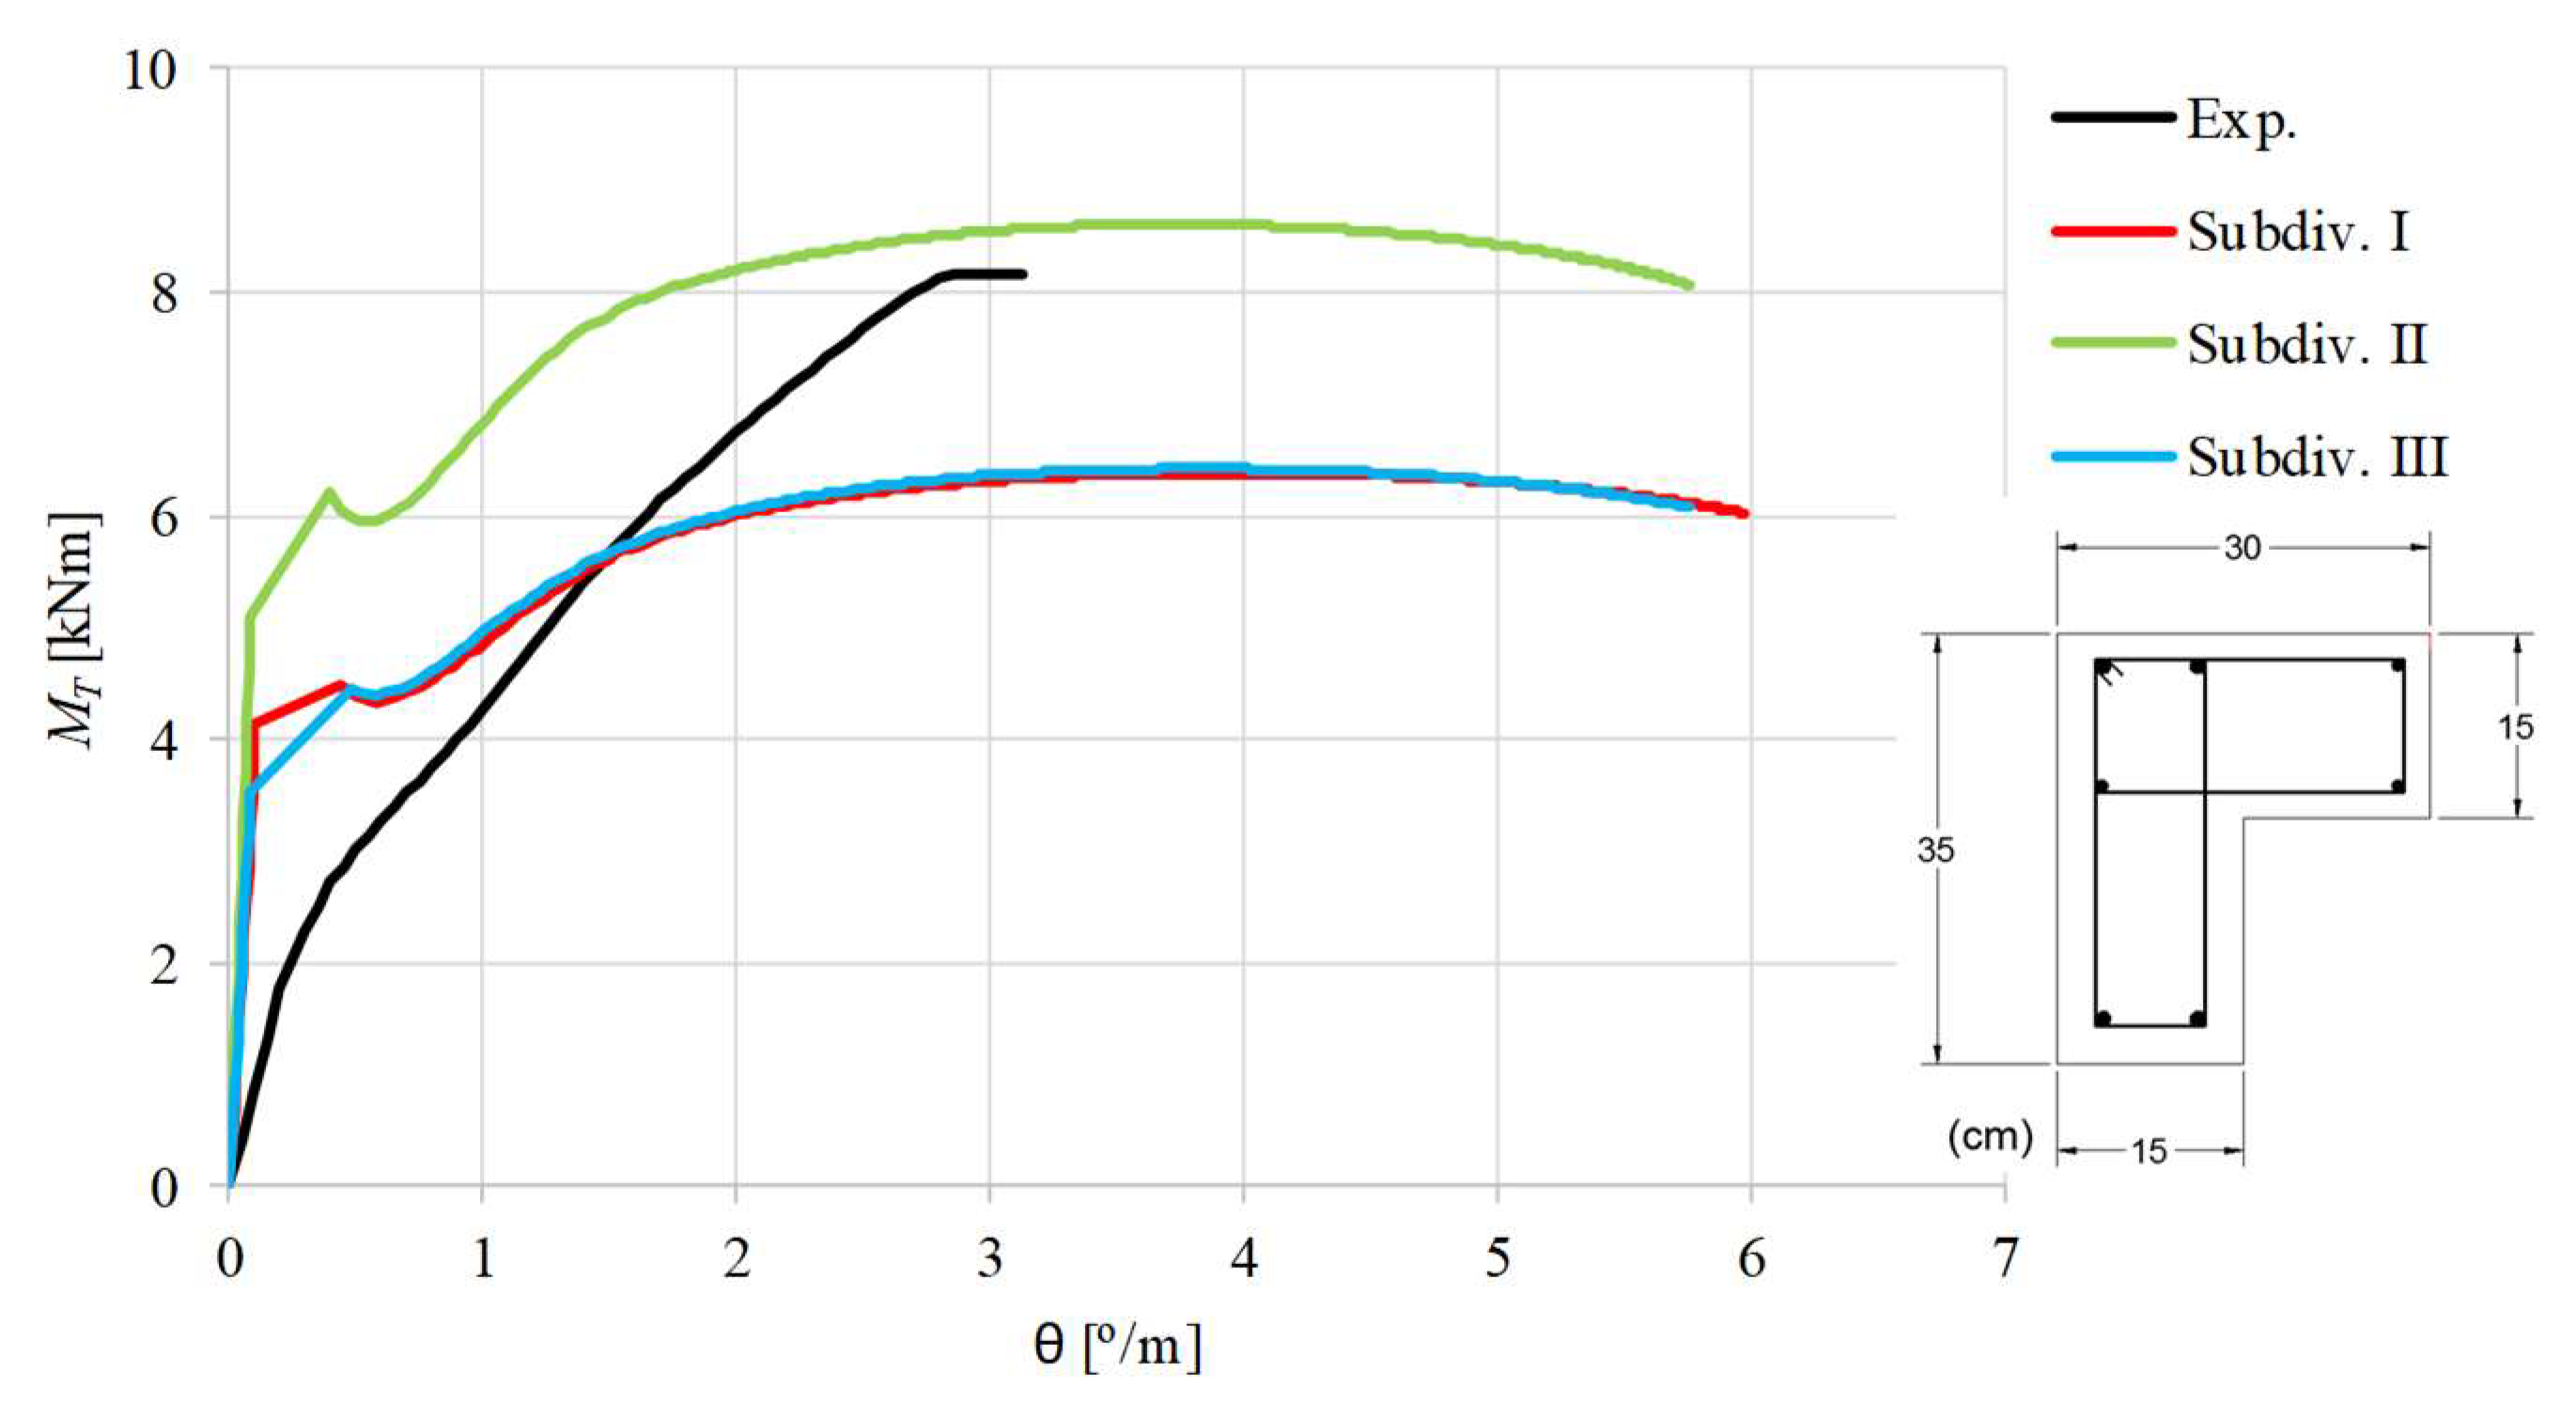
Figure 7.
curves for beam LB1.
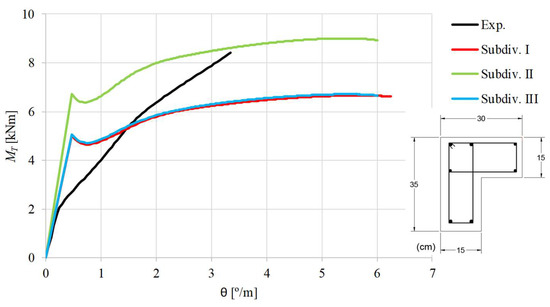
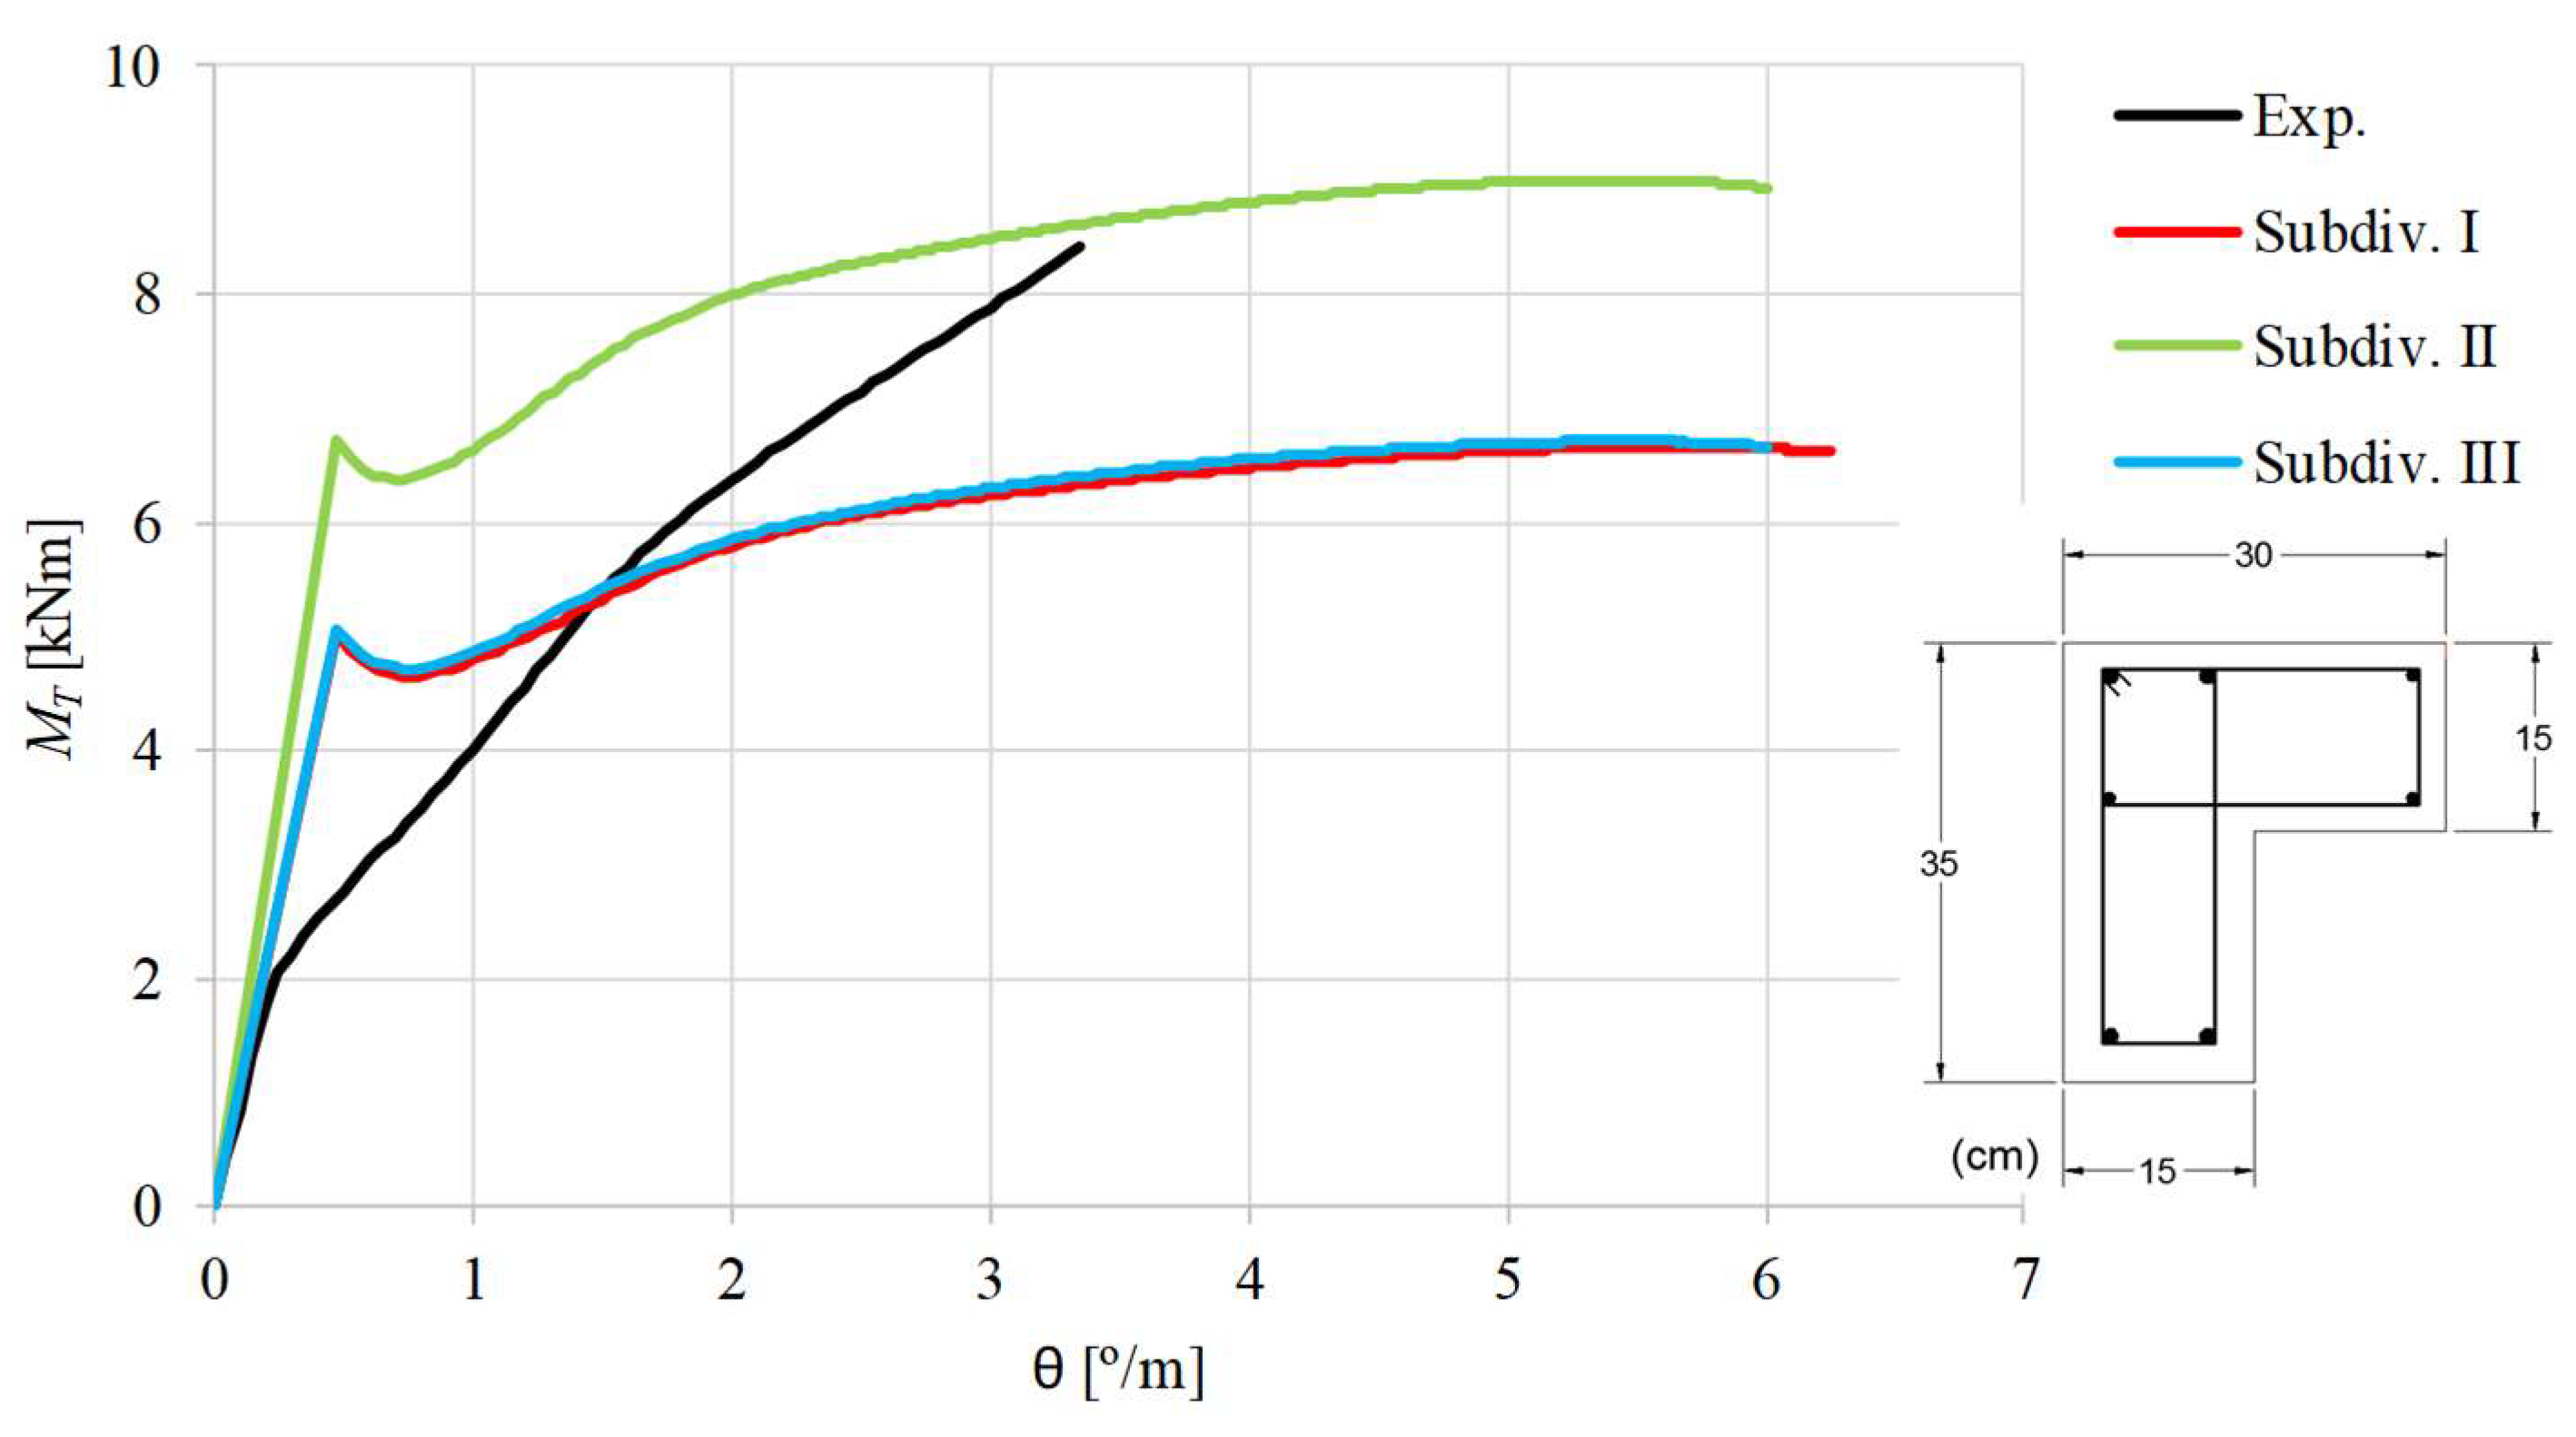
Figure 8.
curves for beam LB2.

Figure 9.
curves for beam LB3.
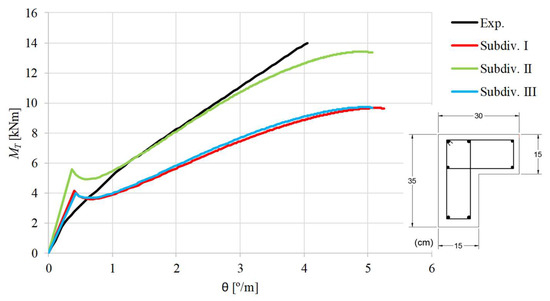
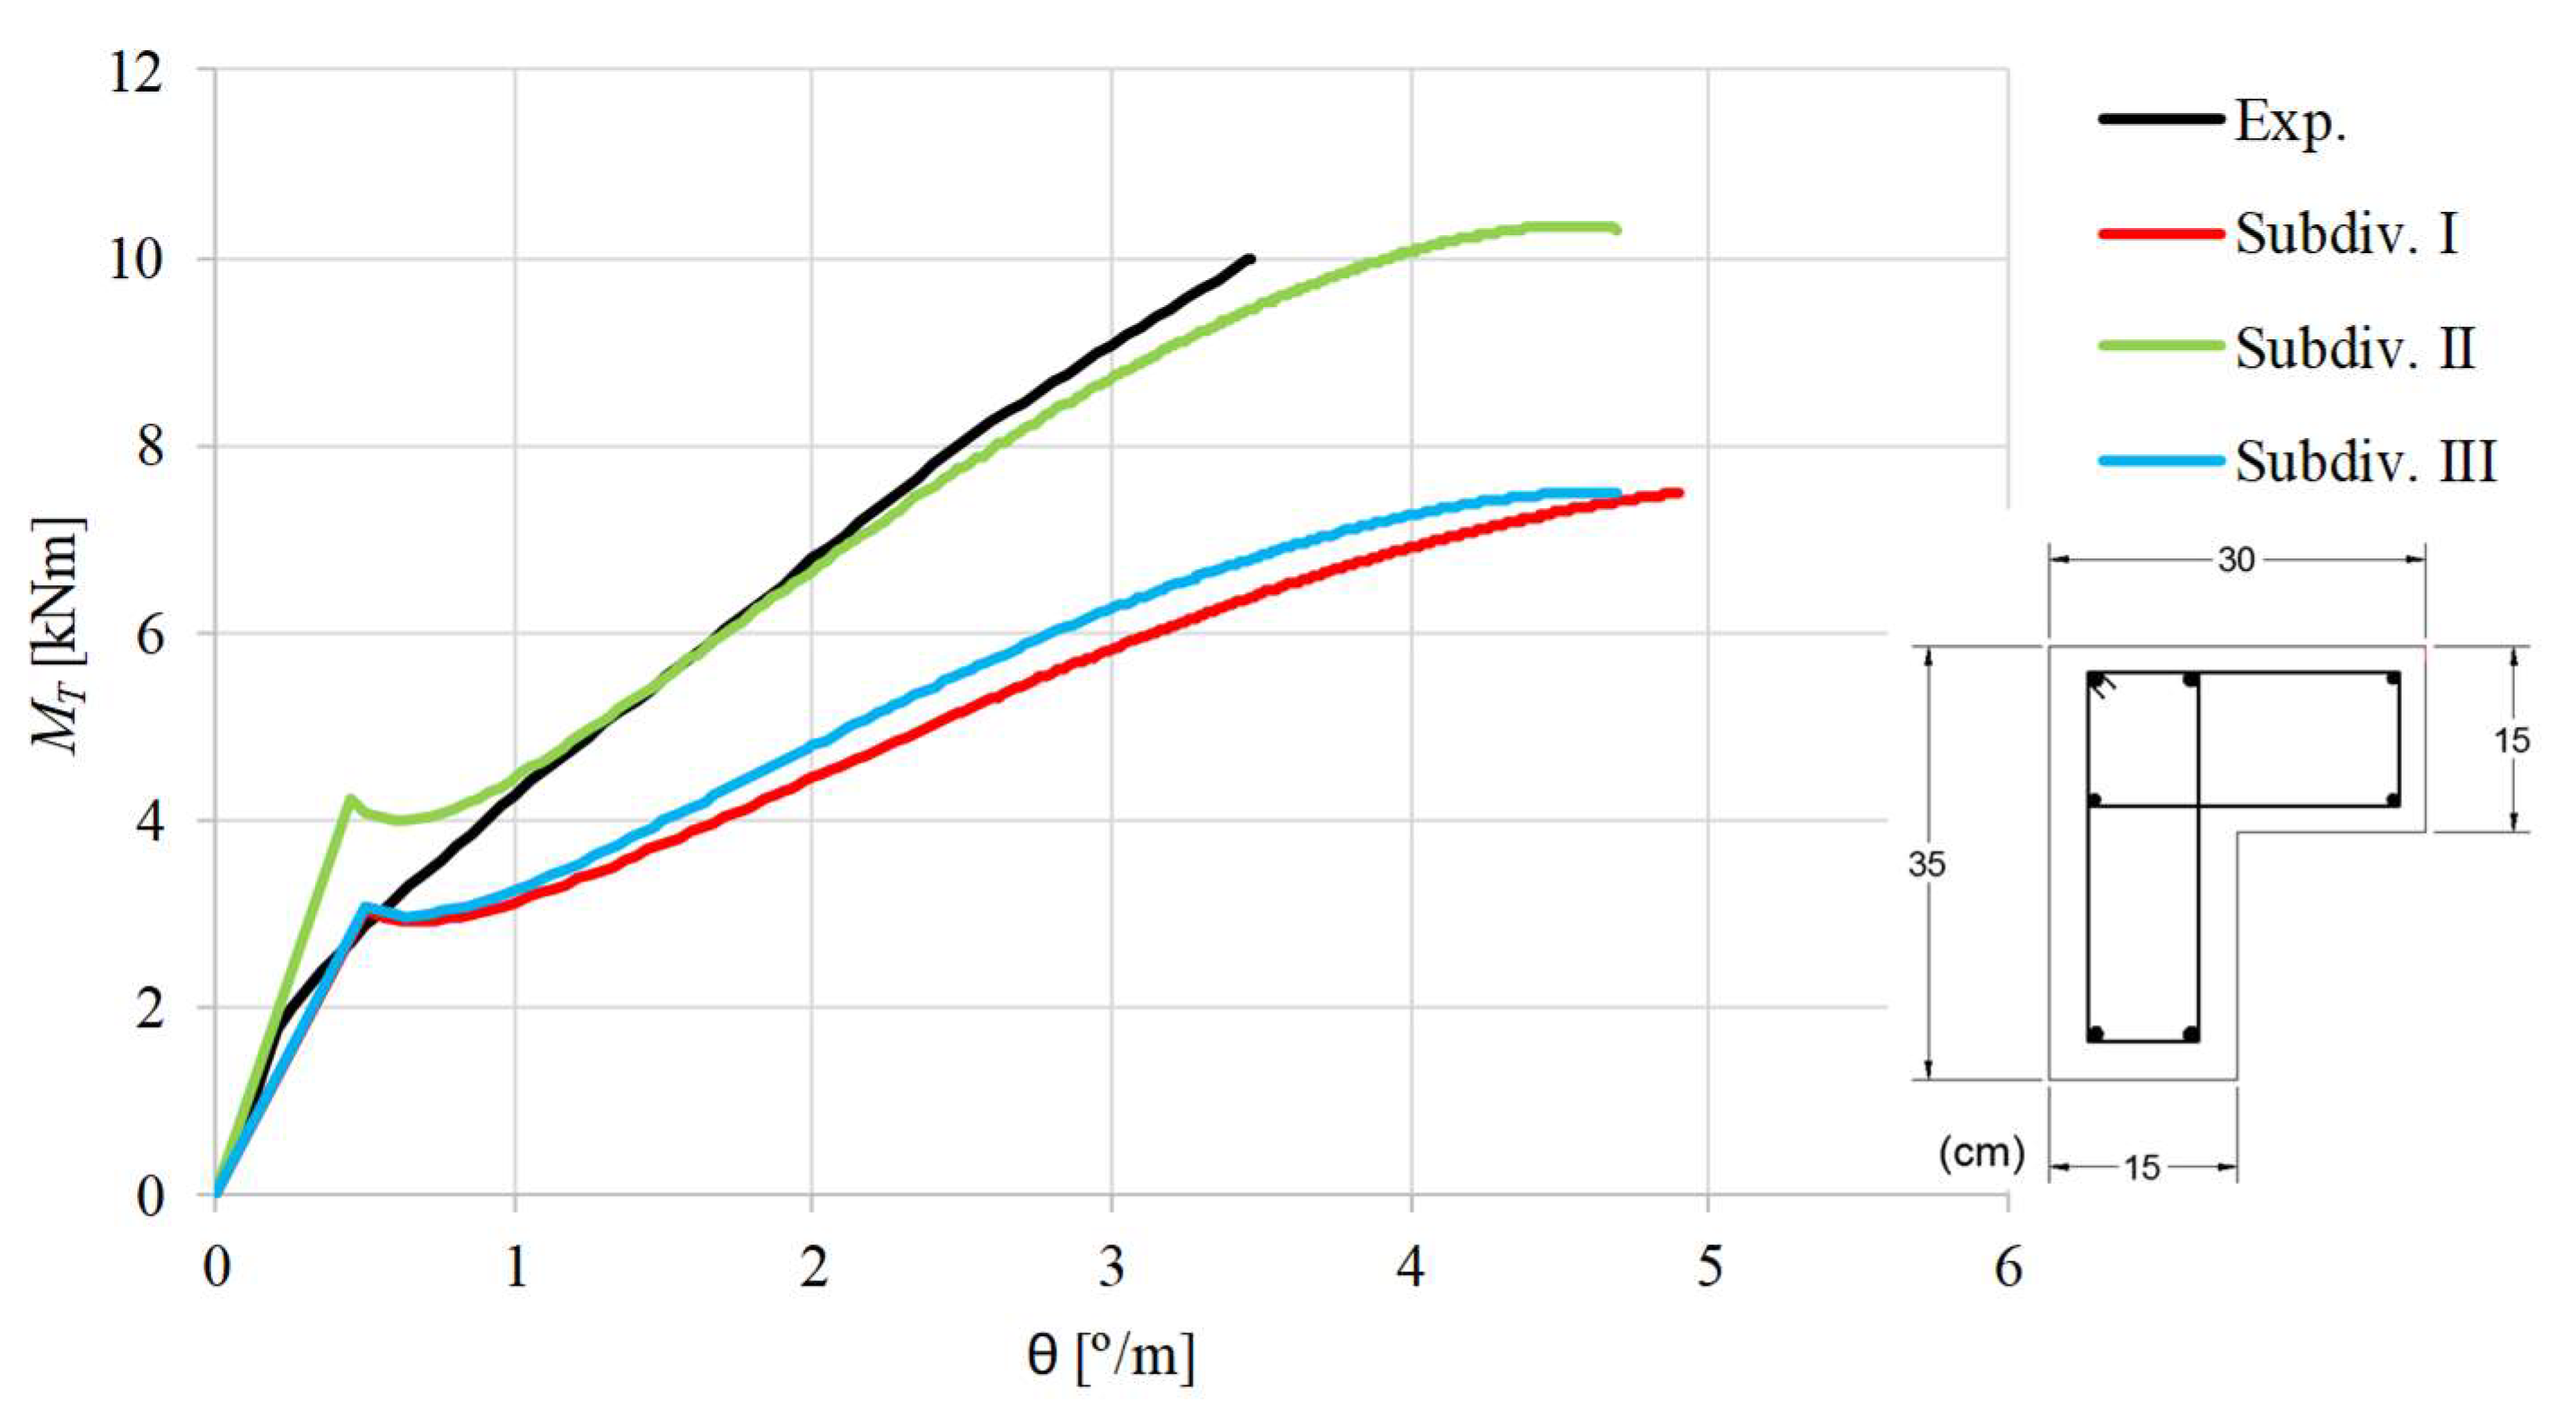
Figure 10.
curves for beam LB4.
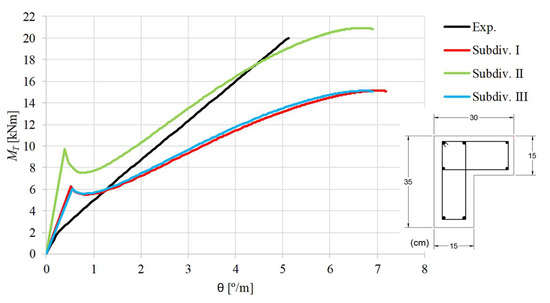
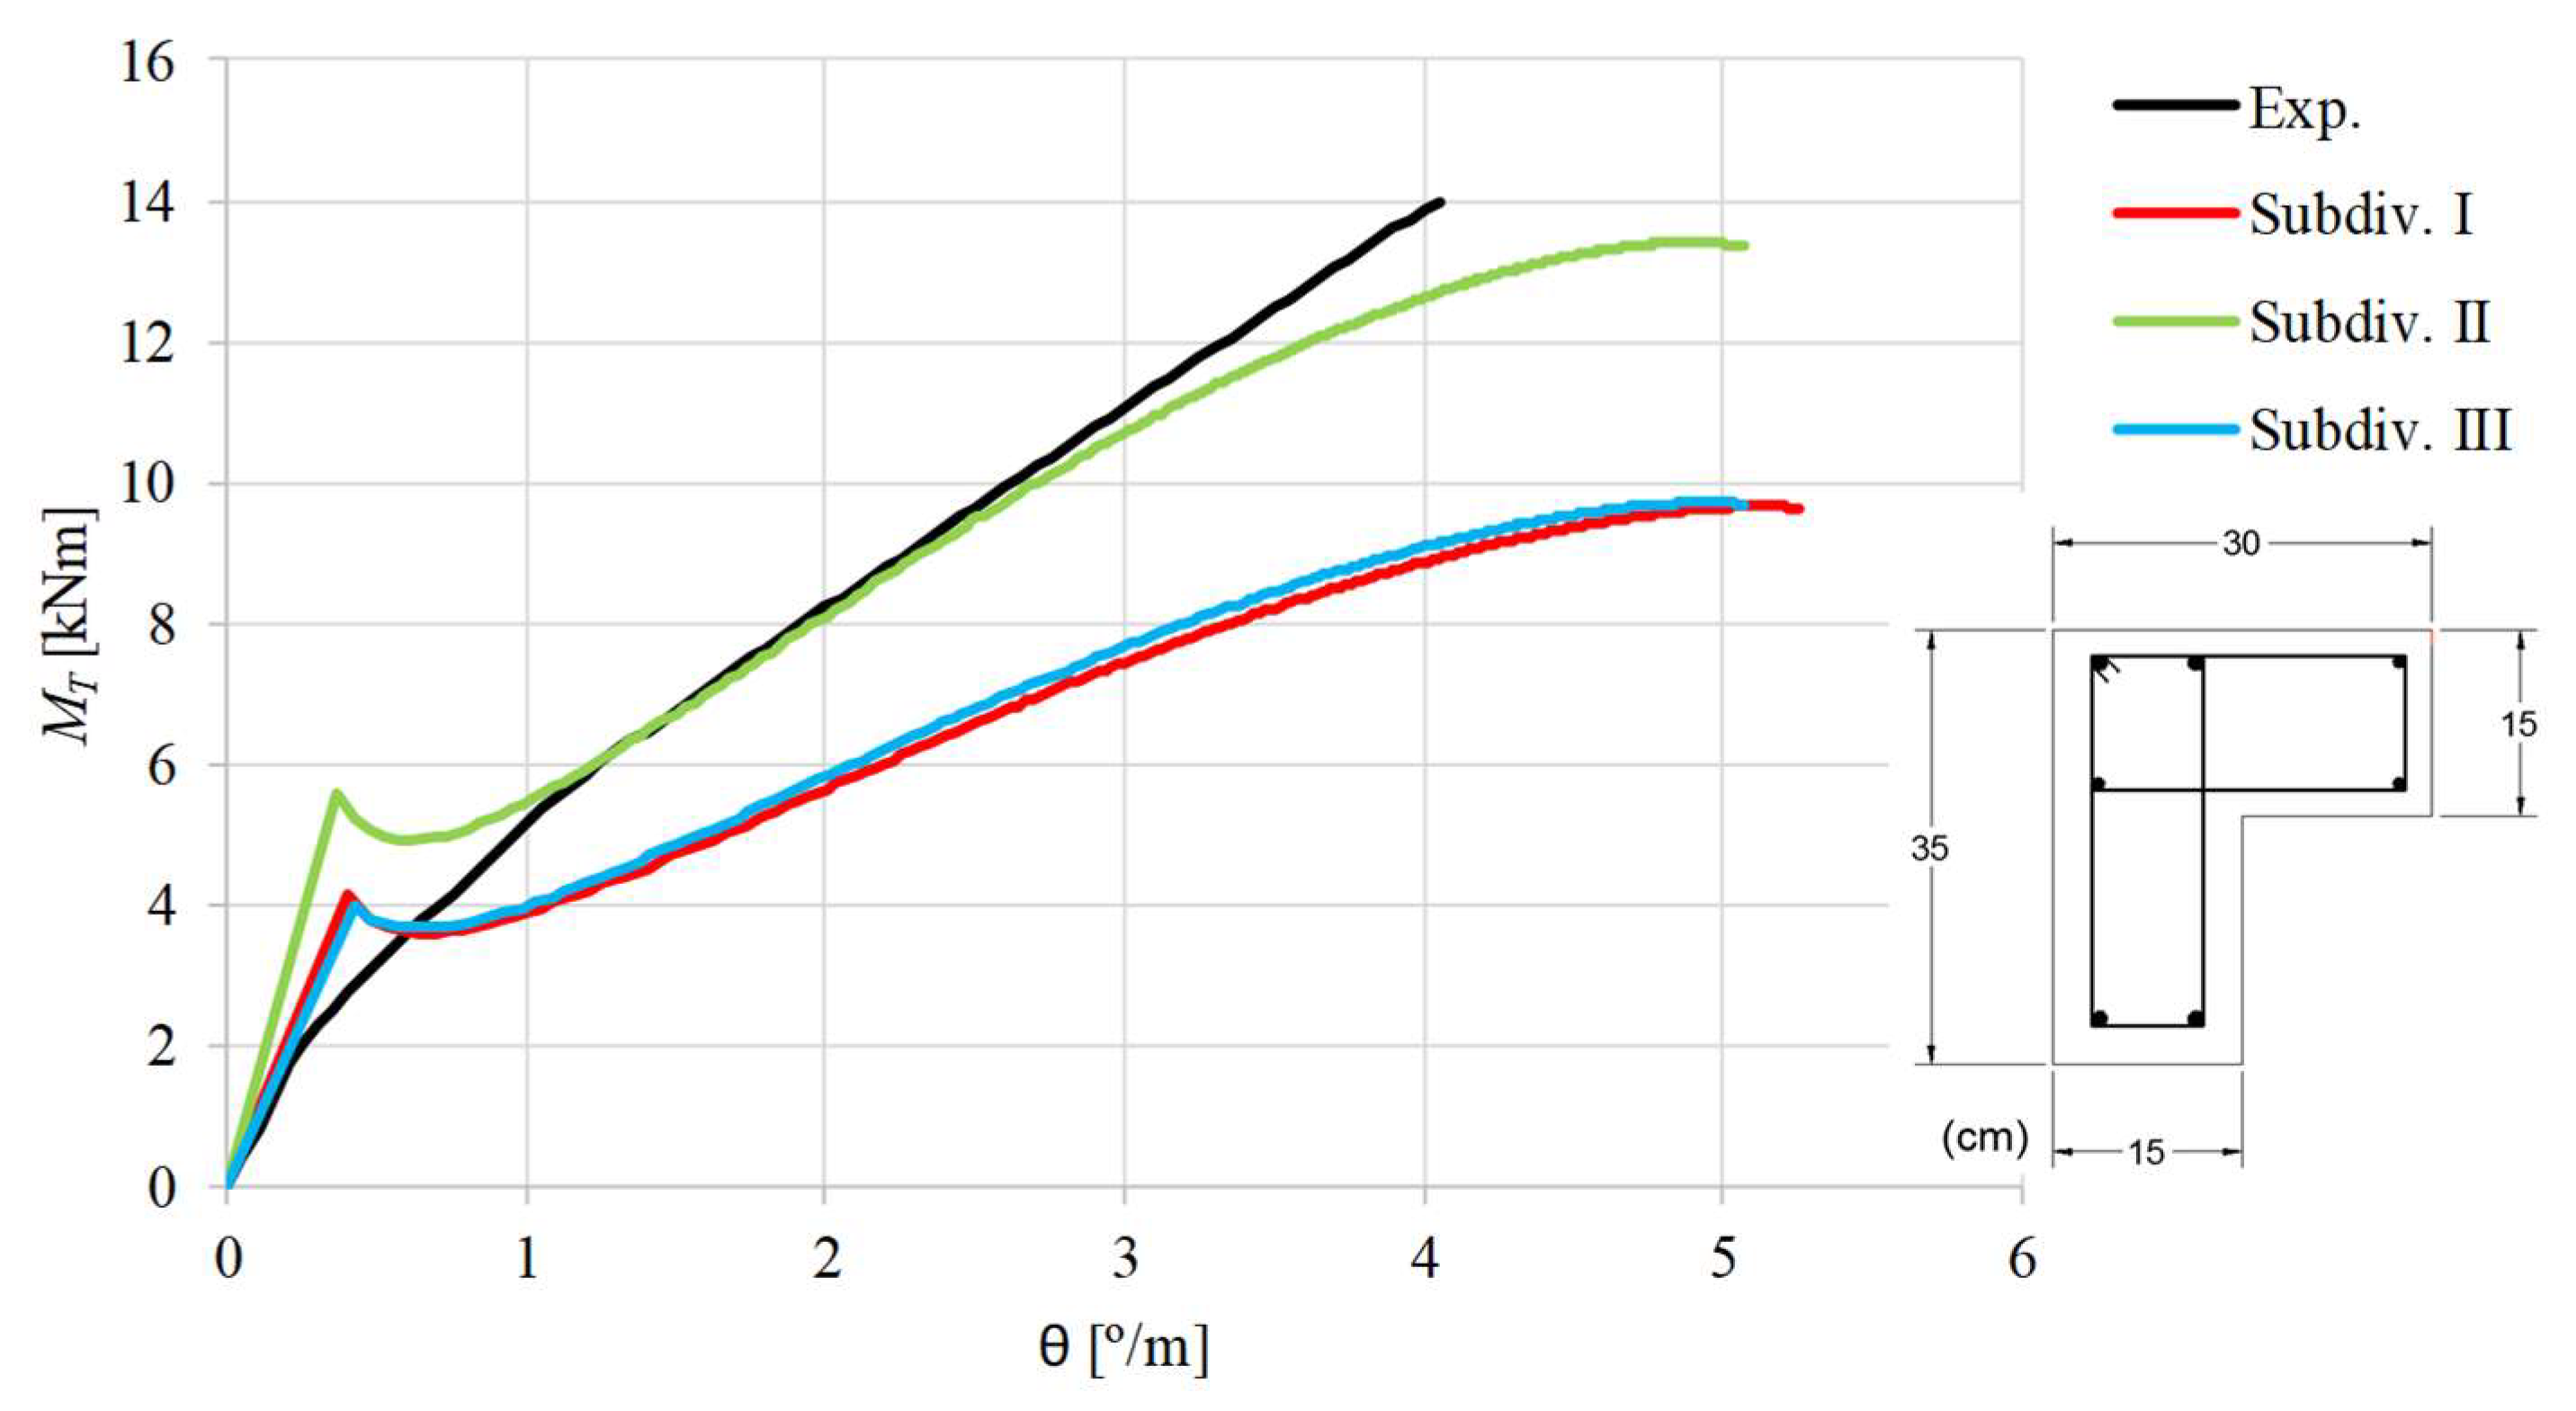
Figure 11.
curves for beam LB5.

Figure 12.
curves for beam BL1.
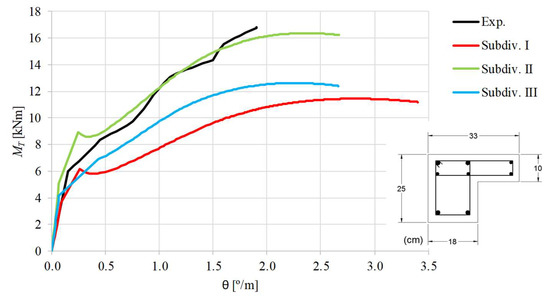
Figure 13.
curves for beam BK-T.
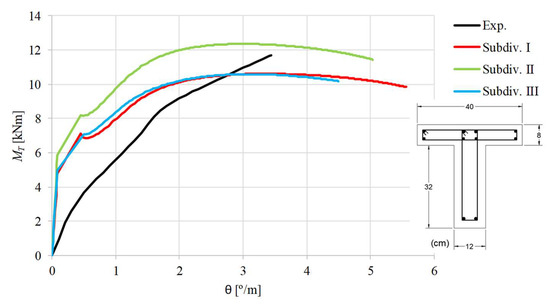
Figure 14.
curves for beam TB1.
Figure 7, Figure 8, Figure 9, Figure 10, Figure 11, Figure 12, Figure 13 and Figure 14 show high variability between the theoretical curves computed with subdivision II and those computed with subdivisions I and III. These latter are quite similar for most of the beams.
When the experimental curves are compared with the theoretical ones, it can be stated that, as far as the ultimate state is concerned, the theoretical curves computed with subdivision II are in general better than the other ones. In fact, when subdivision II is used good results are observed for the maximum torque, although the corresponding twist is overestimated for most of the beams. In general, the curves computed with subdivision I and III highly underestimate the maximum torque. The overestimation of the ultimate twists can be explained because the deformations in the ultimate state are more difficult to capture correctly with analytical models. This drawback is also observed for RC rectangular beams and is due to the complexity to correctly model the effect of the damages in the torsional stiffness for the ultimate state [1]. However, since the ultimate deformations are not very important for the design, this drawback turns out to be less important.
For the ultimate state, the results agree with those observed by Deifalla in 2015 [36], which also observed that subdivision II shows better results.
Figure 7, Figure 8, Figure 9, Figure 10, Figure 11, Figure 12, Figure 13 and Figure 14 also show that, for most of the beams, the theoretical curves from the model with subdivision II do not follow well with the experimental ones in the transition zone from the uncracked state to the cracked state. Except for beams BL1 and BK-T, the cracking torque is highly overestimated. For beams LB1 and TB1, the torsional stiffness for the uncracked state is also highly overestimated.
The previous observations show that the theoretical model does not predict well the response of most the reference beams for low loading levels. This shows that the used procedure to subdivide the cross section, as explained in Section 3, is not entirely valid for low loadings and should be studied in the future in order to be refined.
Despite the issues related with the overestimation of the cracking torque and ultimate twist, for almost all beams (except for beams LB1, LB2 and TB1) the GSVATM with subdivision II captured all the behavioral states of the beams, from the beginning of the loading until failure.
Figure 7, Figure 8, Figure 9, Figure 10, Figure 11, Figure 12, Figure 13 and Figure 14 also show that the theoretical curves show a drop in the torsional moment right after the concrete cracking. This behavior reflects the drop of the stress in the used smeared relationship for tensile concrete (Equations (19) and (20)) right after the peak stress. This behavior was also observed in previous studies from the author [1,6] and in other studies using a different base model, for instance [34]. A detailed discussion about this observation can be found in [1].
Since the torsional strength constitutes an important property to be estimated for the design, Table 6 presents the theoretical and experimental values for the torsional strengths ( and , respectively) for all reference beams. Only the theoretical values from the GSVATM with subdivision II are presented, since from Figure 7, Figure 8, Figure 9, Figure 10, Figure 11, Figure 12, Figure 13 and Figure 14 it was clear that this subdivision provided the best results for the ultimate stage. Table 6 also presents the ratio between the experimental to the theoretical values () and the corresponding values for the average (), standard deviation () and correlation coefficient ().
Table 6.
Comparative analysis for the torsional strength.
The results from Table 6 confirm that the GSVATM with subdivision II provides very good predictions for the torsional strength (), with a low dispersion of the results ().
6. Conclusions
A theoretical model based on the GSVATM for RC rectangular beams was proposed to predict the full behavior of RC flanged beams under torsion, namely T- and L-shaped beams. The calculation procedure to consider the influence of the flanges was presented. The predictions from the theoretical model were compared with the experimental results of some reference RC flanged beams. From the obtained results, the following conclusions can be stated:
- it was found that the GSVATM with subdivision II best predicts the full behavior of the reference RC flanged beams under torsion, mainly for the ultimate state. This observation confirms the results from previous studies;
- very good predictions were observed for the torsional strength, although the corresponding twist was overestimated for most of the reference beams;
- the proposed theoretical model does not predict well the response of most of the reference beams for low loading levels, namely the transition zone from the uncracked to the cracked state. It was observed that the cracking torque is, in general, highly overestimated;
- the previous observation shows that the used procedure to subdivide the cross section is not fully appropriate for low loading levels and must be refined.
Author Contributions
Luís Bernardo worked the theoretical model, developed the solution algorithm, calculated the reference beams, analyzed the data, wrote and reviewed the paper.
Funding
This work was financed by Portuguese national funds through FCT—Foundation for Science and Technology, IP, within the research unit C-MADE, Centre of Materials and Building Technologies (CIVE-Central Covilhã-4082), University of Beira Interior, Portugal.
Acknowledgments
The author would like to thank Eric J. S. Abrunhosa for his support in this study.
Conflicts of Interest
The author declares no conflict of interest.
References
- Bernardo, L.F.A.; Andrade, J.M.A.; Nunes, N.C.G. Generalized softened variable angle truss-model for reinforcement concrete beams under torsion. Mater. Struct. 2015, 48, 2169–2193. [Google Scholar] [CrossRef]
- Hsu, T.T.C.; Mo, Y.L. Softening of Concrete in Torsional Members–Theory and Tests. J. Am. Concr. Inst. 1985, 82, 290–303. [Google Scholar]
- Hsu, T.T.C.; Mo, Y.L. Softening of Concrete in Torsional Members–Prestressed Concrete. J. Am. Concr. Inst. 1985, 82, 603–615. [Google Scholar]
- Bernardo, L.F.A.; Andrade, J.M.A.; Lopes, S.M.R. Softened Truss Model for Reinforced NSC and HSC Beams under Torsion: A Comparative Study. Eng. Struct. 2012, 42, 278–296. [Google Scholar] [CrossRef]
- Bernardo, L.F.A. Generalized Softened Variable Angle Truss Model for RC Hollow Beams under Torsion. Materials. in review.
- Bernardo, L.F.A.; Taborda, C.S.B.; Andrade, J.M.A. Generalized Softened Variable Angle Truss Model for PC Beams Under Torsion. Int. J. Concr. Struct. Mater. 2018, 12, 15. [Google Scholar] [CrossRef]
- Taborda, C.S.B.; Bernardo, L.F.A. GSVATM for RC Beams Under Torsion Combined with External Axial Forces. Comput. Concr 2019. in review. [Google Scholar]
- Deifalla, A.; Ghobarah, A. Behavior and analysis of inverted T-shaped RC beams under shear and torsion. Eng. Struct. 2014, 68, 57–70. [Google Scholar] [CrossRef]
- Karayannis, C.G. Torsional analysis of flanged concrete elements with tension softening. Comput. Struct. 1995, 54, 97–110. [Google Scholar] [CrossRef]
- Deifalla, A.; Hamed, M.; Saleh, A.; Ali, T. Exploring GFRP bars as reinforcement for rectangular and L-shaped beams subjected to significant torsion: An experimental study. Eng. Struct. 2014, 59, 776–786. [Google Scholar] [CrossRef]
- Chariolis, C.E.; Karayannis, C.G. Effectiveness of the use of steel fibres on the torsional behavior of flanged concrete beams. Cem. Concr. Compos. 2009, 31, 331–341. [Google Scholar]
- Ibraheem, O.F.; Bakar, B.H.A.; Johari, I. Behavior and crack development of fiber-reinforced concrete spandrel beams under combined loading: An experimental study. Struct. Eng. Mech. 2015, 54, 1–17. [Google Scholar] [CrossRef]
- Hsu, T.T.C. Torsion of Structural Concrete–Behaviour of Reinforced Concrete Rectangular Members. Torsion of Structural Concrete, SP-18. Am. Concr. Inst. 1968, 18, 261–306. [Google Scholar]
- Lampert, P.; Thurlimann, B. Torsionsversuche An Stahlbetonbalken (Torsion Tests of Reinforced Concrete Beams); Bericht, Nr. 6506-2; Institut fur Baustatik: ETH, Zurich, 1969; 101p. (In German) [Google Scholar]
- Leonhardt, F.; Schelling, G. Torsionsversuche An Stahlbetonbalken (Torsion Tests of Reinforced Concrete Beams); Deutcher Ausschuss fur Stahlbeton: Berlin, Germany, 1974; Vol. Bulletin No. 239; p. 122. [Google Scholar]
- Fang, I.K.; Shiau, J.K. Torsional Behavior of Normal- and High-Strength Concrete Beams. ACI Struct. J. 2004, 101, 304–313. [Google Scholar]
- Bernardo, L.F.A.; Lopes, S.M.R. Torsion in HSC Hollow Beams: Strength and Ductility Analysis. ACI Struct. J. 2009, 106, 39–48. [Google Scholar]
- Mirza, S.A.; Furlong, R.W. Serviceability Behavior and Failure Mechanisms of Concrete Inverted T-shaped beam Bridge Bentcaps. ACI J. 1983, 294–304. [Google Scholar]
- Hassan, T.; Lucier, G.; Rizkalla, S.; Zia, P. Modeling of L-Shaped, Precast, Prestressed Concrete Spandrels. PCI J. 2007, 78–92. [Google Scholar] [CrossRef]
- Hsu, T.T.C. Torsion of Reinforced Concrete; Van Nostrand Reinhold Company: New York, NY, USA, 1984; 516p. [Google Scholar]
- Erosy, U.; Ferguson, P.M. Behavior and Strength of Concrete L-beams Under Combined Torsion and shear. ACI Struct. J. 1967, 64, 767–776. [Google Scholar]
- Farmer, L.E.; Ferguson, P.M. T-shaped beams Under Combined Bending, Shear and Torsion. ACI Struct. J. 1967, 64, 757–766. [Google Scholar]
- Lash, S.D.; Kirk, D.W. Concrete Tee-beams Subjected to Torsion and Combined Bending and Torsion; Report RR160; Department of Highways Ontario Canada; p. 19.
- Victor, D.J.; Aravindan, P.K. Prestressed and Reinforced Concrete T-shaped beams under Combined Bending and Torsion. ACI J. 1978, 75, 526–532. [Google Scholar]
- Razaqpur, A.G.; Ghali, A. Design of Transverse Reinforcement in Flange of T-shaped beams. ACI J. 1986, 680–689. [Google Scholar]
- Zararis, P.D.; Penelis, G. Reinforced Concrete T-shaped beams in torsion and Bending. ACI J. 1986, 526–532. [Google Scholar]
- Logan, D.R. L-Spandrels: Can Torsional Distress Be Induced by Eccentric Vertical Loading. PCI J. 2007, 46–61. [Google Scholar] [CrossRef]
- ACI Committee 318. Building Code Requirements for Reinforced Concrete, (ACI 318–89) and Commentary (ACI 318R-89); American Concrete Institute: Detroit, MI, USA, 1989. [Google Scholar]
- CEB-FIP. Model Code for Concrete Structures. CEB-FIP Inernational Recommendations; Comité Euro-International du Béton: Paris, France, 1978; p. 348. [Google Scholar]
- Kaminski, M.; Pawlak, W. Load capacity and stiffness of angular cross section reinforced concrete beams under torsion. Arch. Civ. Mech. Eng. 2011, XI, 885–903. [Google Scholar] [CrossRef]
- Belarbi, A.; Hsu, T.T.C. Constitutive Laws of Softened Concrete in Biaxial Tension-Compression. Struct. J. Am. Concr. Inst. 1995, 92, 562–573. [Google Scholar]
- Zhang, L.X.; Hsu, T.C. Behaviour and Analysis of 100 MPa Concrete Membrane Elements. J. Struct. Eng. 1998, 124, 24–34. [Google Scholar] [CrossRef]
- Belarbi, A.; Hsu, T.C. Constitutive Laws of Concrete in Tension and Reinforcing Bars Stiffened by Concrete. Struct. J. Am. Concr. Inst. 1994, 91, 465–474. [Google Scholar]
- Jeng, C.H.; Hsu, T.C. A Softened Membrane Model for Torsion in Reinforced Concrete Members. Eng. Struct. 2009, 31, 1944–1954. [Google Scholar] [CrossRef]
- NP EN 1992–1-1. Eurocode 2: Design of Concrete Structures—Part 1: General Rules and Rules for Buildings; European Committee for Standardization – CEN: Brussels, Belgium, 2010. [Google Scholar]
- Deifalla, A. Torsional Behavior of Rectangular and Flanged Concrete Beams with FRP Reinforcements. J. Struct. Eng. 2015, 141, 04015068. [Google Scholar] [CrossRef]
- Deifalla, A.; Ghobarah, A. Full torsional behavior of RC beams wrapped with FRP: Analytical model. J. Compos. Constr. 2010, 14, 289–300. [Google Scholar] [CrossRef]
- ACI 440.1R-06. Guide for the Design and Construction of 290 Structural Concrete Reinforced with GFRP Bars; ACI Committee 440; American Concrete Institute: Farmington Hills, MI, USA, 2006; p. 300. [Google Scholar]
- Abrunhosa, E.J.S. Theoretical Analysis of Reinforced Concrete Beams under Torsion with L and T Cross Sections. Master’s Thesis, Department of Civil Engineering and Architecture, Faculty of Engineering of University of Beira Interior, Covilhã, Portugal, 2015. (In Portuguese). [Google Scholar]
- Deifalla, A.; Awad, A.; Elgarhy, M. Effectiveness of externally bonded CFRP strips for strengthening flanged under torsion: An experimental study. Eng. Struct. 2013, 56, 2065–2075. [Google Scholar] [CrossRef]
- El-Kateb, M.; Abdel Rahman, A.; Hassan, T. Torsional strengthening of reinforced concrete beams using CFRP Sheets. Civ. Eng. Res. Mag. 2013, 35, 1–14. [Google Scholar]


© 2019 by the author. Licensee MDPI, Basel, Switzerland. This article is an open access article distributed under the terms and conditions of the Creative Commons Attribution (CC BY) license (http://creativecommons.org/licenses/by/4.0/).