Article

Imaging the Vocal Folds: A Feasibility Study on Strain Imaging and Elastography of Porcine Vocal Folds

by
Raphael Lamprecht
1,*,
Mohammadali Maghzinajafabadi
1,
Marion Semmler
2 and
Alexander Sutor
1
1
Institute of Measurement and Sensor Technology, UMIT—Private University for Health Sciences, Medical Informatics and Technology, 6060 Hall in Tirol, Austria
2
Department of Otorhinolaryngology, Division of Phoniatrics and Pediatric Audiology, University Hospital Erlangen, Friedrich-Alexander-University Erlangen-Nürnberg, 91054 Erlangen, Germany
*
Author to whom correspondence should be addressed.
Appl. Sci. 2019, 9(13), 2729; https://doi.org/10.3390/app9132729
Submission received: 28 May 2019 / Revised: 26 June 2019 / Accepted: 2 July 2019 / Published: 5 July 2019
(This article belongs to the Special Issue Computational Methods and Engineering Solutions to Voice)

Abstract

:
Vocal folds are an essential part of human voice production. The biomechanical properties are a good indicator for pathological changes. In particular, as an oscillation system, changes in the biomechanical properties have an impact on the vibration behavior. Subsequently, those changes could lead to voice-related disturbances. However, no existing examination combines biomechanical properties and spatial imaging. Therefore, we propose an image registration-based approach, using ultrasound in order to gain this information synchronously. We used a quasi-static load to compress the tissue and measured the displacement by image registration. The strain distribution was directly calculated from the displacement field, whereas the elastic properties were estimated by a finite element model. In order to show the feasibility and reliability of the algorithm, we tested it on gelatin phantoms. Further, by examining ex vivo porcine vocal folds, we were able to show the practicability of the approach. We displayed the strain distribution in the tissue and the elastic properties of the vocal folds. The results were superimposed on the corresponding ultrasound images. The findings are promising and show the feasibility of the suggested approach. Possible applications are in improved diagnosis of voice disorders, by measuring the biomechanical properties of the vocal folds with ultrasound. The transducer will be placed on the vocal folds of the anesthetized patient, and the elastic properties will be measured. Further, the understanding of the vocal folds’ biomechanics and the voice forming process could benefit from it.

1. Introduction

Our voice is the primary way of interpersonal communication. Not only for professional speakers or singers, many everyday routines rely on a functioning voice and sound production. The major part of the voice production takes place in the upper airway, beginning at the larynx. The vocal folds (VFs), located in the larynx, produce the primary sound. The air flow passes by and stimulates their oscillation [1]. The vocal tract finally forms the audible human voice.
The voice forming process as a whole is still being researched and not fully understood yet. The biomechanical properties of the VFs play a crucial role in the whole phonation process [2]. In this oscillating system, the eigenfrequencies are not only set by the spatial dimensions, but also by the mechanical properties. Changes in the elasticity are a good marker for benign and malignant changes. In addition, the diagnosis of voice disorders profits from new methods, which are able to examine the biomechanical properties of the VFs [3,4]. Therefore, information about the biomechanics of the VFs is not only beneficiary for research, but also for clinical assessments.
Consequently, the biomechanical characterization of the VFs is a broad research field. Different methods have been developed to test the VFs. Roughly divided, mechanical approaches [1,5] (e.g., traction testing, rheometry, indentation testing), optical approaches [6] (e.g., videostroboscopy, videoendoscopy), and medical imaging techniques [7] (e.g., synchrotron X-ray microtomography [8], optical coherence tomography (OCT) [9], ultrasound (US)) are used to examine the biomechanics of the VFs.
US is already being used to examine the vocal folds, like B-mode- [10], Doppler- [11], Nakagami-imaging [12], and elastography [13,14,15]. These imaging techniques, except B-mode-imaging, display the elastic characteristics of the vocal folds directly or indirectly [16]. Elastography is an examination method where the biomechanical properties are displayed on medical images. Ultrasound elastography (USE) is widely used to assess changes in different organ systems, like the liver, breast, or prostate [17]. The transcutaneous US was used to examine the vocal folds and has shown usable results with elastography [13,14,15] or with digital image correlation [18].
In this work, we want to show an image registration-based approach to examine the mechanical properties of the VFs. Especially, Young’s modulus and the strains under compression in the VFs should be measured. The newly-implemented algorithm was tested on gelatin phantoms and showed promising results. To demonstrate the feasibility on VFs, we used a porcine ex vivo larynx and studied its biomechanical properties. We could depict strain images and estimations of the elastic properties. These findings could show a new promising approach to examine the VFs, in order to reach a better understanding of the voice forming process and open up new diagnostic methods.

2. Materials and Methods

The discussion of the materials and methods is divided into sections. At first, the anatomical properties of the human and porcine VFs are described. Based on this, the preparation of the porcine larynx and the gelatin phantoms is depicted. Further, the experimental setup for the mechanical testing of the gelatin phantoms is discussed. Finally, we will go into the image acquisition, image registration, and the following computation of the elastic properties.

2.1. Anatomical Structure of the Vocal Folds

The VFs, located in the larynx, are primarily responsible for the phonation process. Their geometrical measurements are 3–10 mm in the cranial-caudal, 10–20 mm in anterior-posterior, and 8–12 mm in medial-lateral direction [1]. They oscillate self-sustained with a high frequency and small amplitude. A study on ten individuals showed that the average fundamental frequency for males is around 174 Hz and for females around 278 Hz, and the lateral amplitudes are around 0.93 mm and 0.80 mm [19].
Histologically, three different main layers (Figure 1b) of the human VF can be separated: epithelium, lamina propria, and musculus (M.) vocalis, whereas the lamina is formed by sublayers (superficial, intermediate, and deep lamina propria) [20]. The epithelium is 0.05 mm thick, and the lamina propria is 1 mm thick [21]. The epithelium maintains the shape of the VF and protects the underlying tissue. The lamina propria mainly influences the elastic properties of the VFs. The M. vocalis acts actively as a muscle and passively as a stiff rubber band [22]. Primarily, the outer layers consist of extracellular matrix, whereas the inner layers consist of cells [1].
Different models were developed to describe the biomechanical properties and the oscillation of the VFs [23]. As a result of their complex structure, the elastic behavior of the VFs is nonlinear [1]. In the body-cover-model, the VFs are simulated by a two-layer continuum model, in which the body layer represents the M. vocalis and the deep lamina. Further, the cover is represented by the outer layers. The laryngeal muscles control the tension of the VFs: the body-tension is set by the contraction of the M. vocalis and M. cricothyroid, whereas the cover-layer has no contractile properties on its own [4]. Increasing the body tension leads to a decrease of the oscillation amplitude of it and concentrates the vibration on the cover-layer. Depending on the body-cover stiffness ratios, the phonation onset frequency is effectively controlled by either the body stiffness for small ratios or the cover stiffness for large ratios [4]. The contraction of M. vocalis may lead to an increase or decrease of the phonation frequency, whereas a contraction of M. cricothyroid always leads to an increase [1].
In this study, we used porcine VFs, which are quite similar to human VFs [24]. However, the porcine VFs lacks one layer of the lamina propria, and it is more challenging to distinguish the single layers. The thicknesses of the individual layers are comparable to the human VFs [21].

2.2. Preparation of Gelatin Phantoms and Porcine Larynx

To validate and test the algorithm, we used gelatin phantoms with known elastic properties. We used mechanical testing to measure the Young’s modulus E and Poisson’s ratio ν . Further, the results were used as initial values for the optimization of the finite element model (FEM).
Preparation of the gelatin phantoms: Gelatin is a widely-used material to substitute tissue for US testing [25]. The body of the phantom was made of 0.2 g/mL gelatin (Peter Pharma GmbH, Gelantine Rind) diluted with 0.01 g/mL of flour. The flour increased the acoustic reflection and the stiffness of the phantom [26]. The cuboid phantom had a base of 30 × 60 mm and a height of 30 mm. In the center of the phantom, we placed a cylindrical inclusion (diameter of 8 mm) with 0.5 g/mL of gelatin and 0.1 g/mL of flour. In that way, we had a phantom that had a stiffer core compared to the surrounding body. The elastic properties were considered homogeneous in these two regions. For both mixtures, pure phantoms with the same dimensions and elastic properties were produced. These pure phantoms were used in the following mechanical testing. The phantoms were stored at 4 C and examined at room temperature.
Preparation of the larynx: We used porcine VFs (Figure 1a) for the ex vivo examination. The larynx was extracted from a pig at the local slaughterhouse (Erlangen). The surrounding tissue and the vestibular folds were removed. The remaining larynx was vacuumed and packed in plastic bags, shock frozen at 140 C and stored at 80 C . It was sent to Hall in Tirol by postal service in a thermally-insulated transport box. The larynx arrived frozen and was stored at 24 C . One day before the examination, the larynx was thawed over night at a temperature of 5 C . The larynx was examined in the holder shown in Figure 1a. The holder was specially designed and 3D-printed with PLA (polylactic acid). The larynx was fixed in it by two adjusting screws, pressing in the dorsal direction on the thyroid cartilage with flexible contact plates. On the posterior side of the larynx, a big contact plate ensured a tight grip. In the holder, we made sure the external forces on the larynx were minimized.

2.3. Mechanical Measurements of Gelatin Phantoms

To estimate the mechanical properties of the phantom, we used a compression test (Figure 2a). The compression test complied better with our examination method than the usual tensile testing. The phantom was compressed by a 3D-printed US transducer replica (not shown in the figure) fixed on a linear unit. The replica was used, because the cable of the US transducer would tamper with the force measurement. The linear unit was driven by a stepper motor. The steps of the motor gave information about the displacement of the transducer. Simultaneously, a load cell (HT Sensor TAL221 500 g, Data acquisition: SparkFun OpenScale) recorded the force on the surface of the phantom. The whole measurement process was controlled by MATLAB (MATLAB 2018b, The MathWorks, Inc., Natick, MA, USA).
The engineering strain is given by:
ε = Δ l l 0 ,
whereas Δ l is the measured change in length and l 0 the original length. The uniaxial normal stress σ was calculated by dividing the normal force F by the area A: σ = M M F / A . Young’s modulus is the ratio of stress to strain:
E = σ ε = F l 0 A Δ l
in the axial direction [27] (pp. 8–9). To estimate Young’s modulus E over a set of measurements, we used a linear regression on the stress-strain-curve (Figure 2b). Deming regression was used, because it is useful for erroneous measurement results [28]. Young’s modulus is the slope of the regression in the stress-strain-curve. In our case, the uniaxial Young’s modulus of the body was E = 50 ( ± 1 ) kPa and of the inclusion E = 93 ( ± 2 ) kPa. The measured values were in the expected range of 40–110 kPa for gelatin [29,30].
Furthermore, Poisson’s ratio ν of the body material was measured with the same setup. Additionally, an industrial camera (Lumenera LM135M) was placed in front of the phantom to estimate the height and the width. The images were processed by a Sobel edge detection, which identified the borders of the phantom [31] (p. 36ff.). The vertical ε y y and horizontal strain ε x x were calculated by Equation (1). Subsequently, Poisson’s ratio:
ν = ε x x ε y y
was estimated by a linear fit between the strains [32] (p. 88). The estimated Poisson’s ratio for the body material was ν B o d y = 0.49 , which fits the literature [33,34]. In the FEM of the phantom with the inclusion, Poisson’s ratio of the body material was used, because it had a bigger impact on the overall Poisson’s ratio.

2.4. Evaluation of the Image Data

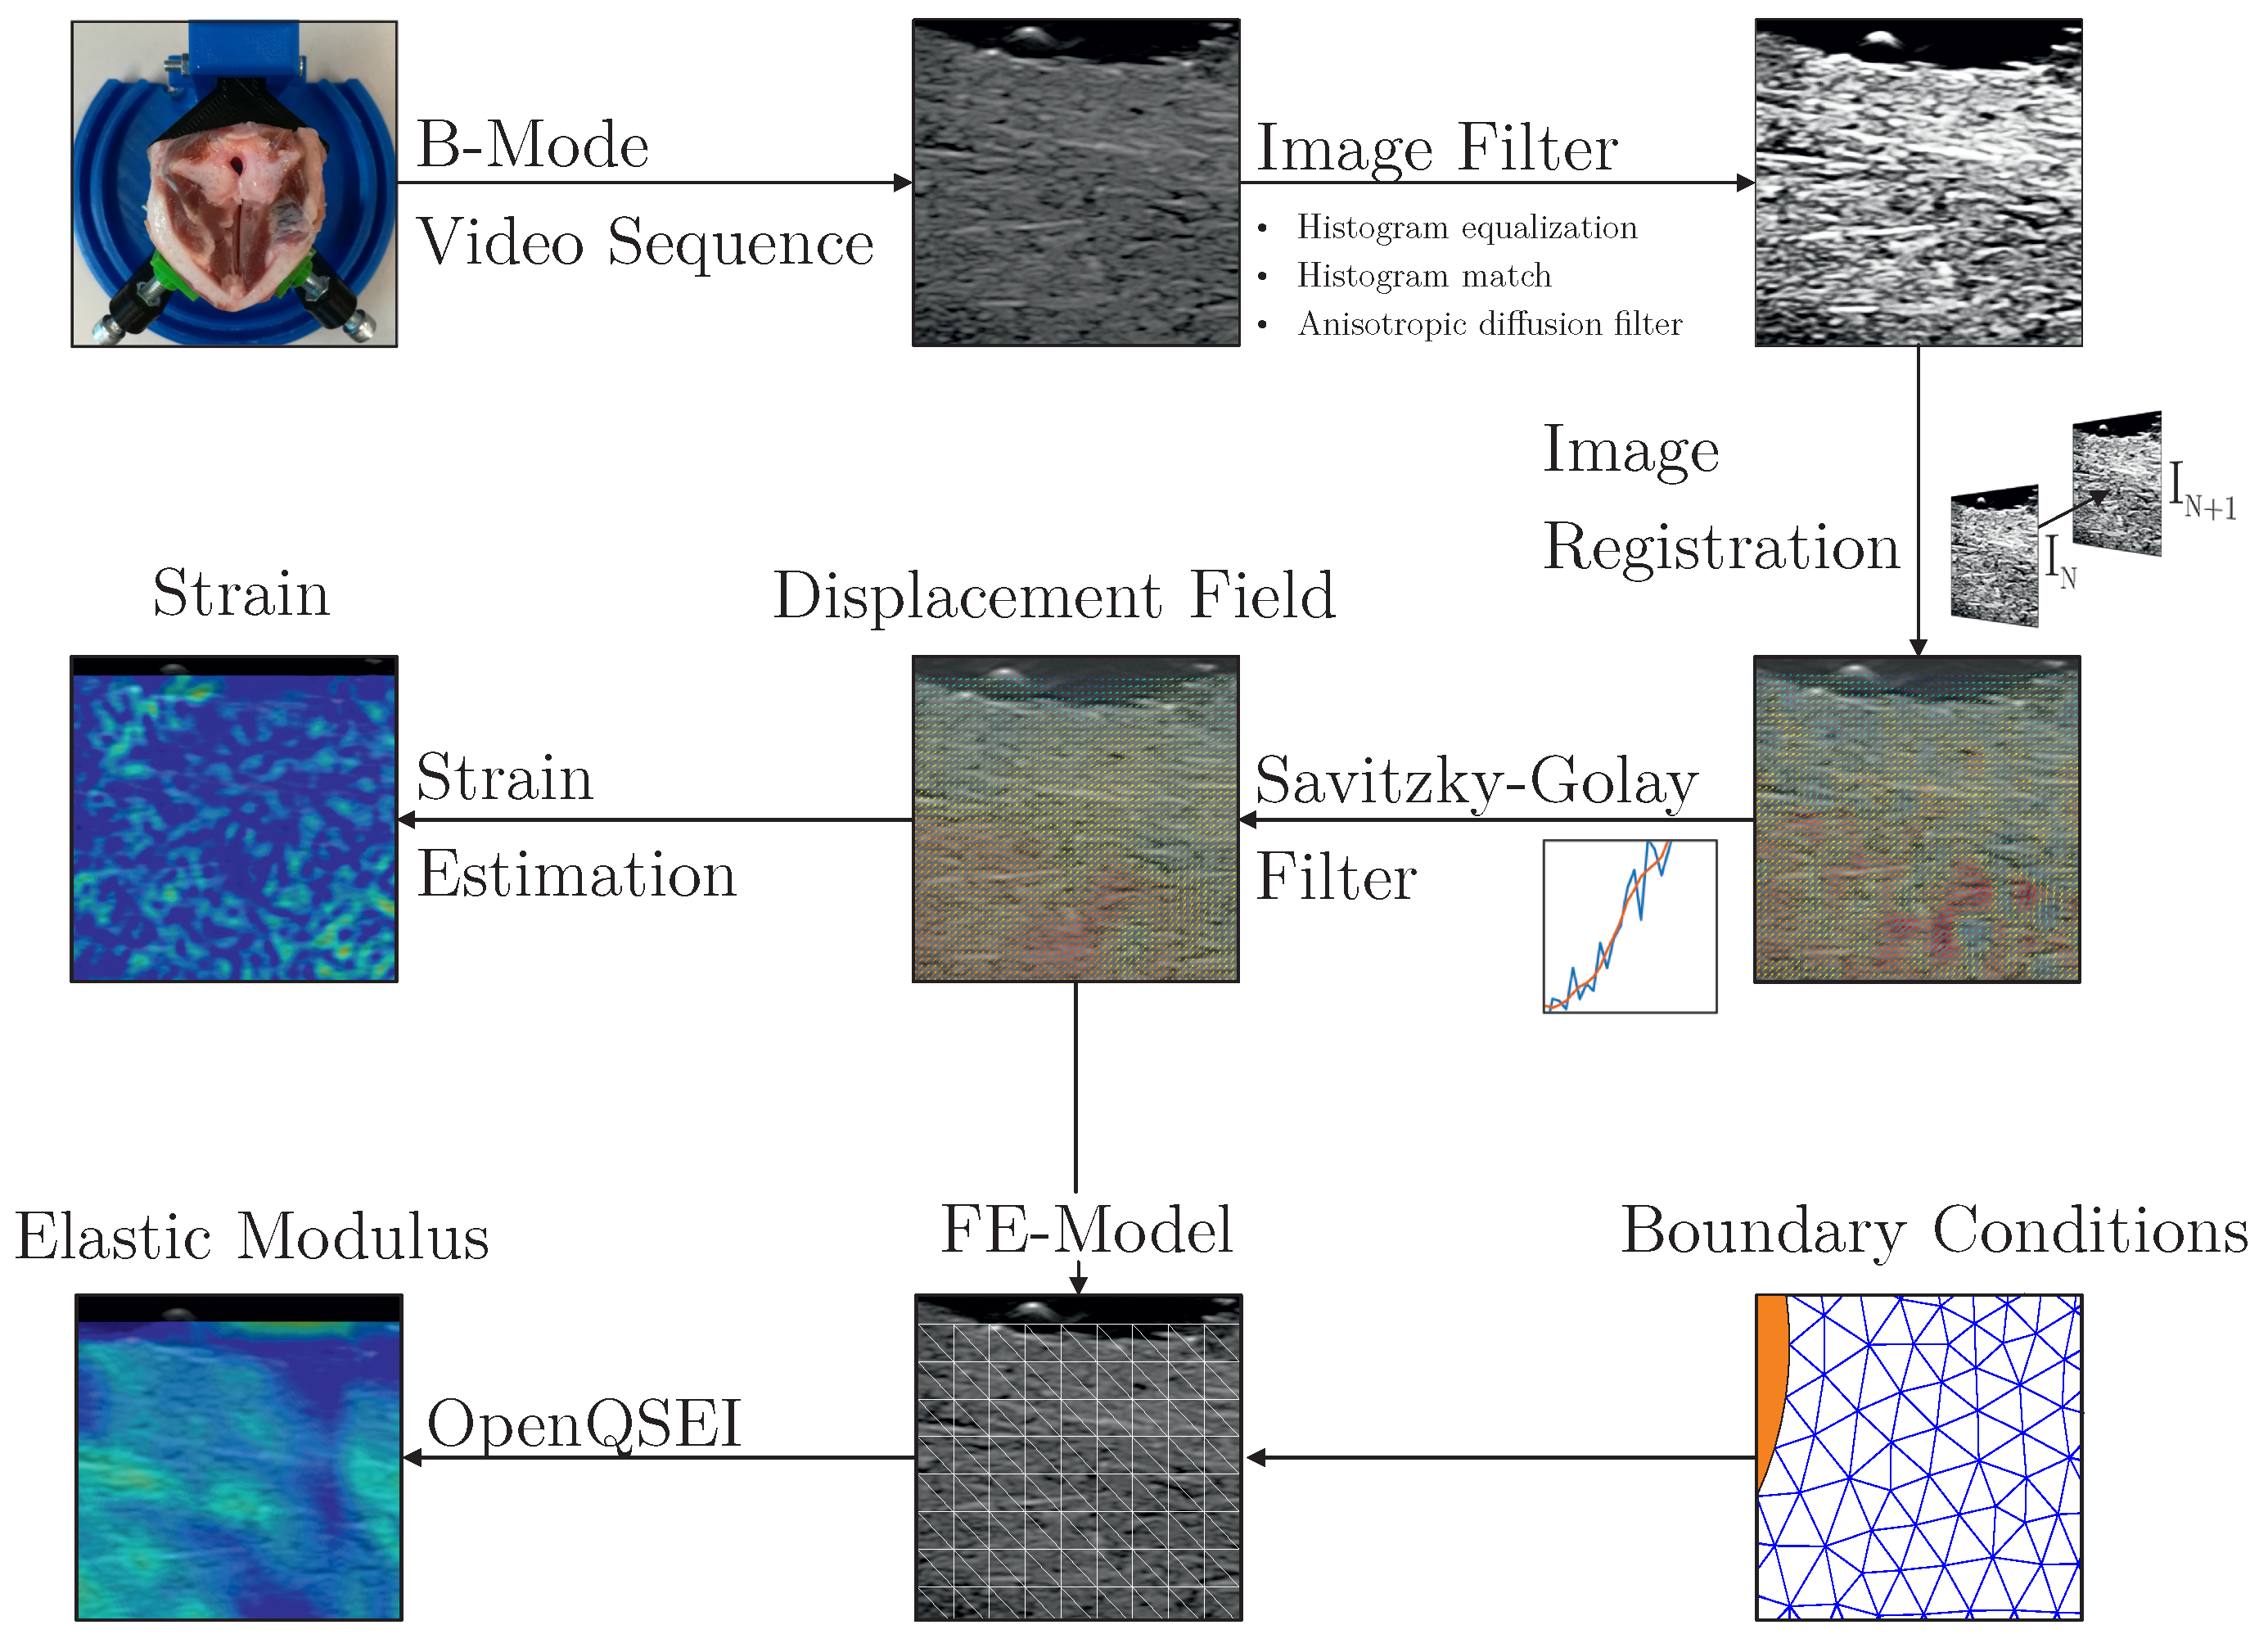
The aim of the data evaluation process was to estimate the strain in the tissue and the elastic modulus of it. Several steps were necessary: (1) data acquisition (B-mode video sequence), (2) image filter, (3) image registration, (4) filtering of the displacement field (Savitzky–Golay filter), and (5) estimation of the strain distribution, respectively the elastic modulus (Figure 3).

2.4.1. Image Acquisition and Preprocessing

The VFs and the phantoms were examined with the Alpinion E-Cube 15 EX, using the IO8-17 Transducer with a frequency range of 8–17 MHz. The examination of the phantoms was done in the setup shown in Figure 2a. The phantom with the inclusion was compressed 1 mm by the transducer. Examining the VFs, the transducer was directly placed on the surface in the position shown in Figure 1a. The examiner took care that the gap between the transducer and VF was completely filled with US gel. The tissue was compressed manually, and the examiner loaded the tissue in the caudal direction. Both compression processes were recorded as a B-mode video sequence.
The video sequence was saved in DICOM (Digital Imaging and Communications in Medicine) format and imported to MATLAB. The user manually chose a region of interest (ROI). We applied the following filters to prepare the frames for the image registration process: At first, the contrast was enhanced by a histogram equalization. Furthermore, the histograms of the images were matched to the first frame to avoid brightness differences. The metric of the image registration allowed only affine brightness differences [35]. To denoise the images, without loosing sharp edges, we used a non-linear anisotropic diffusion filter [36]. Then, the images were given to elastix for the registration process.

2.4.2. Image Registration

elastix [35,37] is an open-source image toolbox for intensity-based image registration. The main task of image registration is to map one image to another and gain information about the spatial relationship between them. The main applications are aligning different image modalities, comparing images of different recording times, or preparing for segmentation and classification [35].
In our case, the challenge was to find the temporal relationship between frame I N ( x ) and the following frame I N + 1 ( x ) ; whereas, x = [ x , y ] T is the position occupied by a material point [38]. The relation between I N ( x ) and I N + 1 ( x ) is expressed by the transformation T ( x ) . The optimal transformation perfectly aligns the two frames. To find this transformation, a cost function:
S ( T , I N , I N + 1 )
was defined and minimized. To find the minimum, an iterative process was used [39]. In many cases, T is not well defined, because it is not necessarily possible to map every pixel in the first frame to a corresponding pixel in the following frame. For more details on the registration process itself, we refer to Klein et al. [35].
We used a non-rigid b-spline registration with a multiresolution approach [40]. We applied a normalized correlation coefficient (NCC) metric. The NCC metric had no spatial boundaries; therefore, regularization was necessary to avoid non-physical displacements (e.g., folding). We regularized the registration in two ways: First, we adjusted the maximum step size of the optimizer to the expected displacements. In that way, we avoided too large displacements. Secondly, we added a bending energy penalty P ( T ) to the cost function S ( T , I N , I N + 1 ) in Equation (4), resulting in a regularized cost function:
C ( T , I N , I N + 1 ) = γ 1 S ( T , I N , I N + 1 ) + γ 2 P ( T )
The bending energy penalty smoothed the displacement field according to the bending of a thin metal plate [41,42]. The values of γ 1 and γ 2 weighted the influence of the two metrics on the registration process. The estimation of the values was an empiric and iterative process. In our registration, we used relative weighting, in which both metrics were weighted the same.

2.4.3. Displacement Field and Strain

The results of the registration were given back to MATLAB where the transformation T ( x ) was converted to the displacement field. The displacement field gave information about the spatial relationship of every material point between two frames. It consisted of the displacement vectors for all material points.
The displacement vector u ( x , t ) gave the relation between every voxel in the first frame to the same voxel in the following frame, which was estimated by the image registration.
u ( x , t ) = [ u x , u y ] T
Furthermore, strain was calculated. It was the change of length per unit length, which could be also expressed as the gradient of the displacement field [38].
The estimated displacement field was contaminated with noise. If the strain was directly calculated from the noisy displacement field, the noise was amplified. We used a Savitzky–Golay filter to reduce the noise, without losing local information [43]. The filter was applied in two ways: temporal and spatial. The temporal filter smoothed the displacement over a range of frames at the same location. The underlying assumption was that the displacement had no sudden changes over a minor time range. Secondly, the spatial filter smoothed the displacement field in one frame. Again, the assumption was that in adjacent regions, no sudden changes occurred, whereas continuous changes were mapped by the filter.
The strain in the tissue was calculated according to Lai et al. [44]. The displacement gradient for a two-dimensional displacement field is:
u ( x , t ) = δ u x δ x δ u x δ y δ u y δ x δ u y δ y
Further, the deformation gradient F was calculated:
F ( x , t ) = ( I u ( x , t ) ) 1
I denotes the identity matrix. Subsequently, the 3D Eulerian strain tensor ϵ was determined by:
ϵ ( x , t ) = 1 2 [ I ( F 1 ( x , t ) ) T F 1 ( x , t ) ] .

2.4.4. Elastic Properties

It is not possible to determine the elastic modulus E ( x ) directly from the displacement field or the strain image, so additional information is necessary to get quantitative results. The three-dimensional deformation of the tissue was measured in a two-dimensional plane. Therefore, we also reduced the model to a two-dimensional problem by making assumptions. We used the plane-stress approximation, which assumes that all out of plane stresses are zero [45]. The reconstruction of E ( x ) from a displacement field is an inverse problem. In our algorithm, we discretized the input to linear triangular elements. The linearity was only valid for small strains. Burks et al. [46] showed on ex vivo porcine VFs that the transition point from linearity to non-linearity was approximately at a strain value of 0.122 . Consequently, we only evaluated measurements with lower strain values.
The quality of the estimation depends on the magnitude of the displacement field, due to the smaller signal-to-noise ratio [47]. To obtain greater displacements in the registration process, every hundredth frame was used. We solved this by using OpenQSEI, which is an open source FEM solver of elastic problems based on MATLAB [48].
The computation of E ( x ) is an inverse problem in the form of:
u ( x , t ) = U ( E ( x ) ) + e
in which U ( E ( x ) ) is the forward solution, e the assumed noise, and u ( x , t ) the measured displacement field. The assumed noise e was considered Gaussian-distributed and summed up all noise that occurred in the measurement process so far. The solution of Equation (10) can be found by solving:
l = arg min E L E E U { ( L e ( u ( x , t ) ) U ( E ( x ) ) ) 2 + p E ( E ) }
The observation noise covariance matrix is expressed by L e T L e = C e 1 ; furthermore, E L and E U define the lower and upper limit of E. The solution can be plagued by modeling errors, noise, and outlier data [47,49,50]. Therefore and because the inverse problem can be ill-posed, the computation needs a regularization term p E ( E ) . The choice of p E ( E ) has a major impact on the result. We decided to use a Tikhonov uninformative regularization, because we expected no sharp features and a non-homogeneous background [47]. The Tikhonov regularization parameter α was chosen according to the noise level. If α was large, the regularization tampered with the solution. Consequently, if α was too small, the noise would destroy the solution. The right choice of α needs to account for those influences [51] (p. 123).
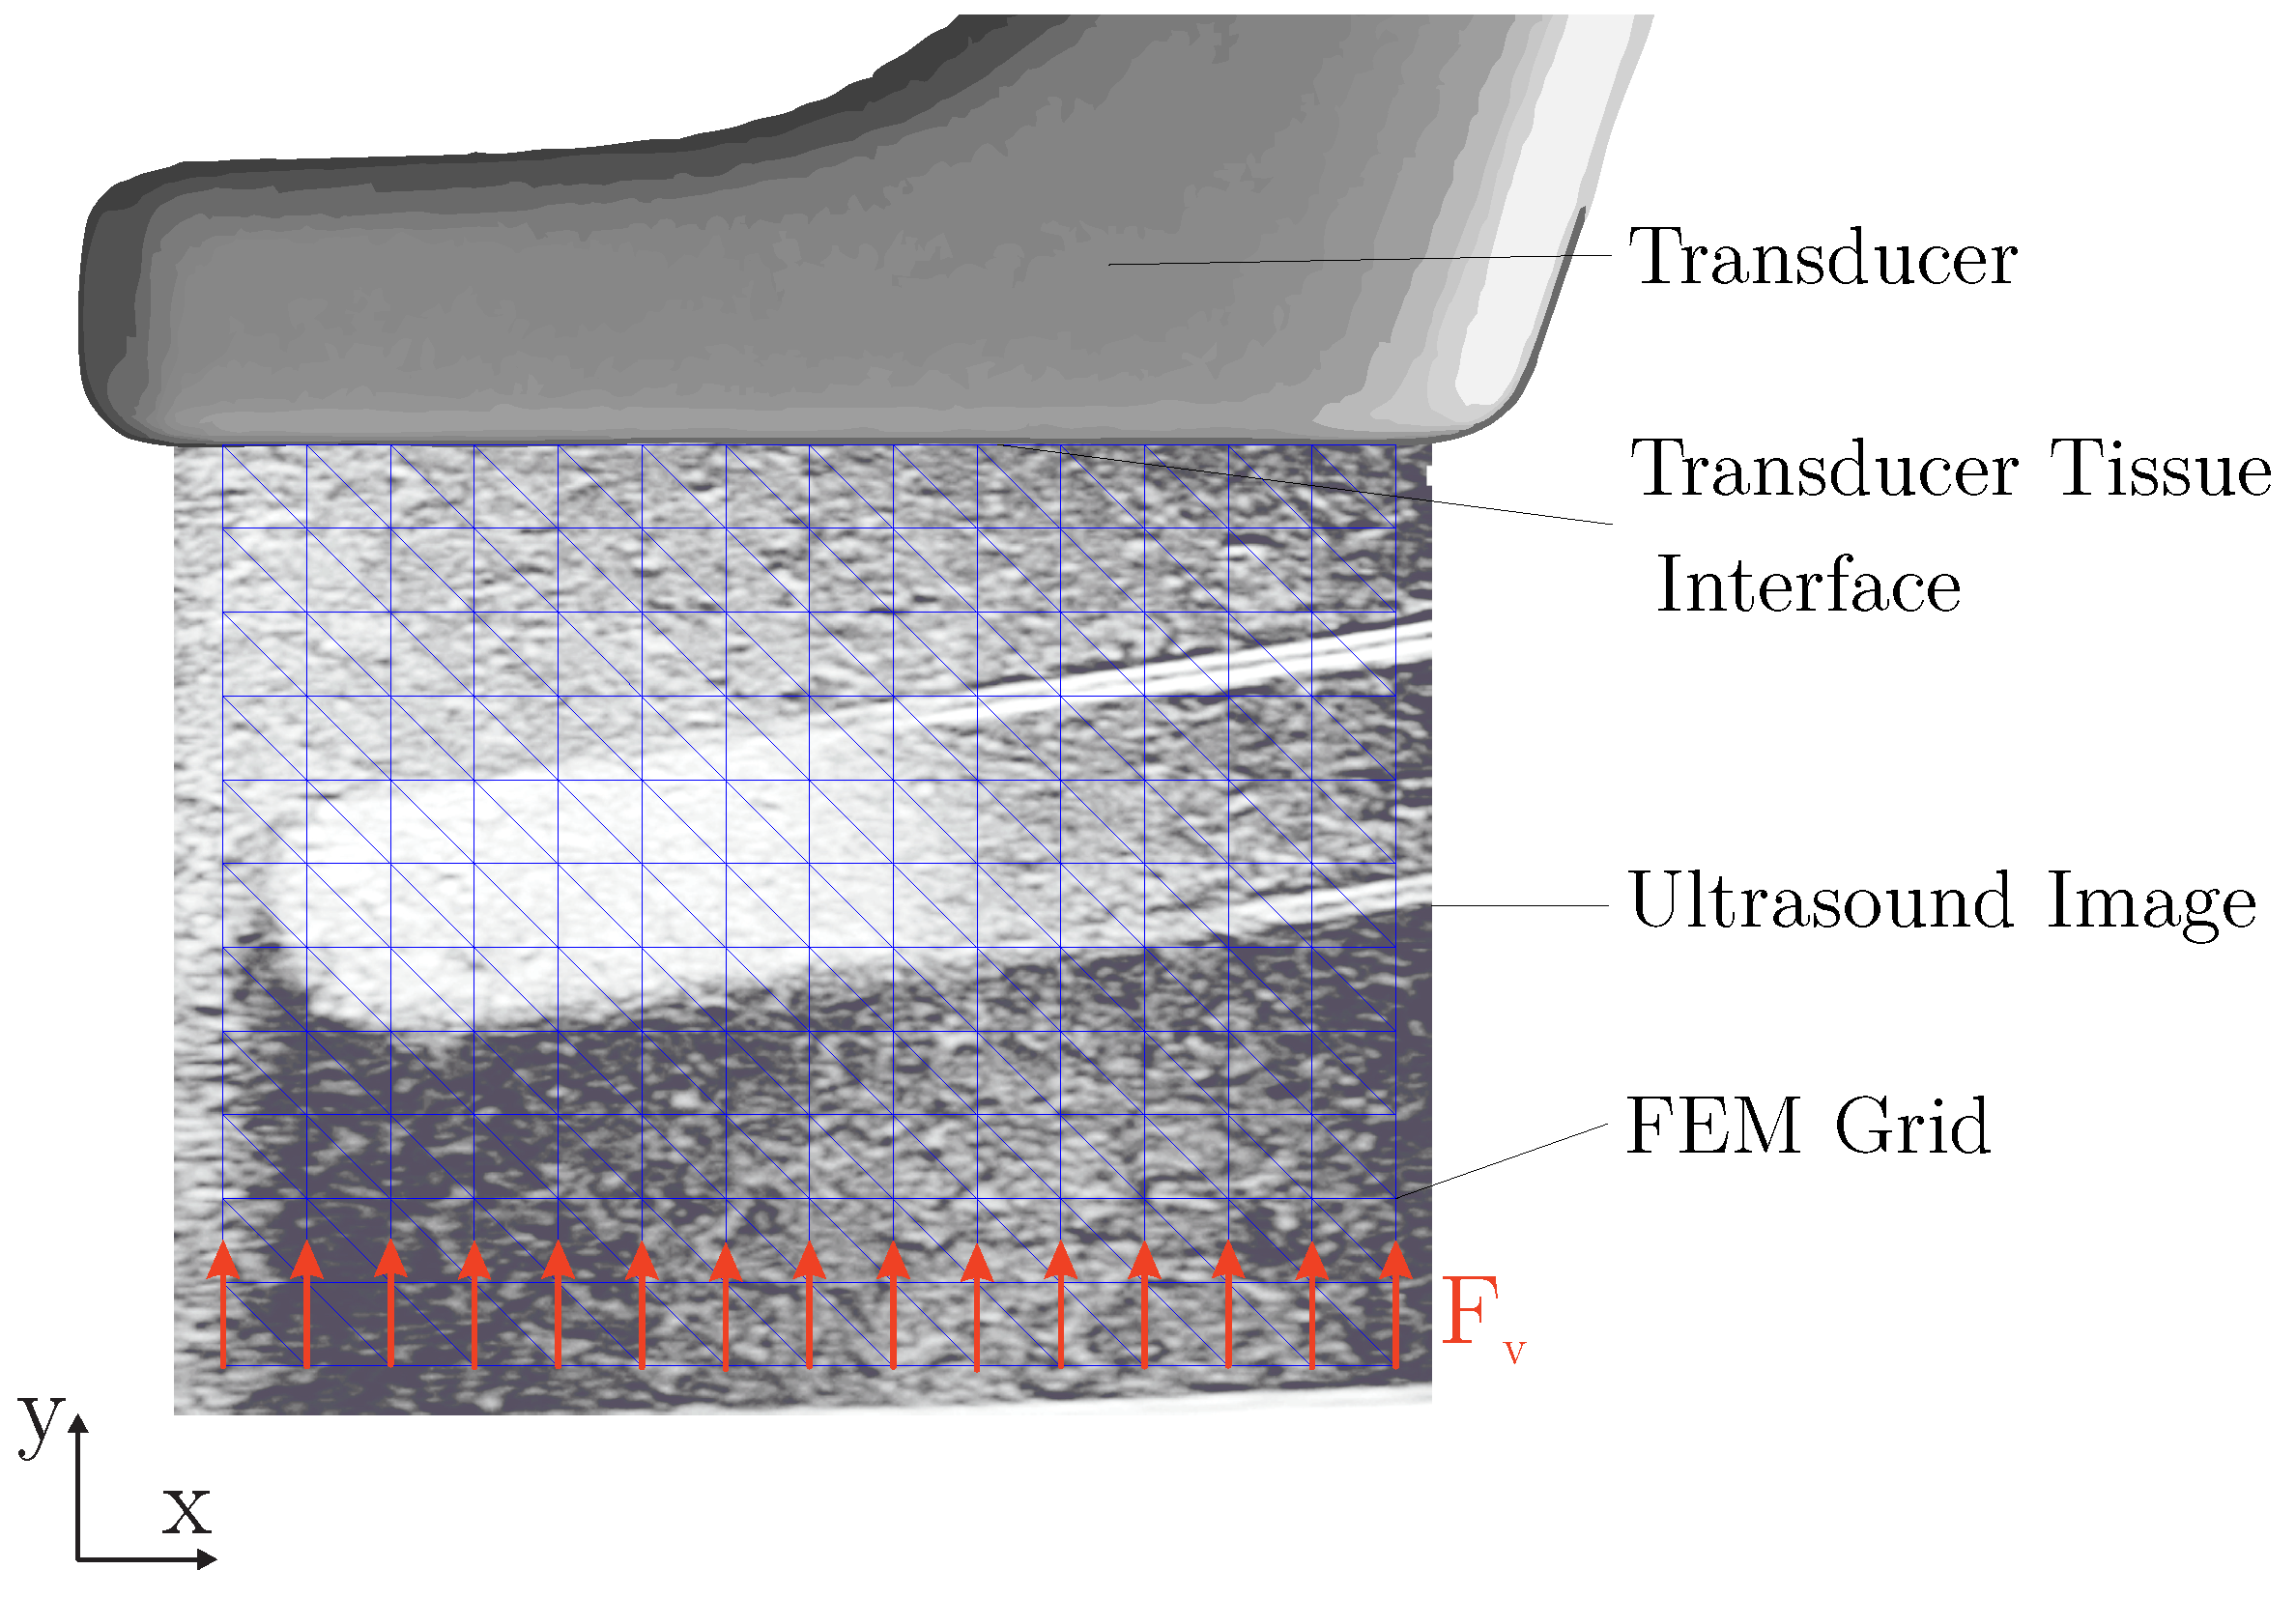
The choice of the boundary conditions is another crucial part of the FEM, and it has to be oriented on the physical settings (Figure 1a). In our case, the displacements at the tissue–transducer interface were close to zero (Figure 4). In the FEM, all displacements at this boundary were considered to be zero. The second boundary condition, which was used in the model, was a virtual force F v compressing the tissue (Figure 4). The force was seen as virtual, because in the reference system of the transducer, and consequently of the image, the tissue was compressed towards the transducer (in the positive y-direction). The real force, applied by the transducer, was compressing the tissue in the negative y-direction. Using those two boundary conditions, OpenQSEI solved the inverse problem (Equation (11)) with an iterative constrained Gauss–Newton optimization algorithm [48].

3. Results

3.1. Measurements in Gelatin Phantoms

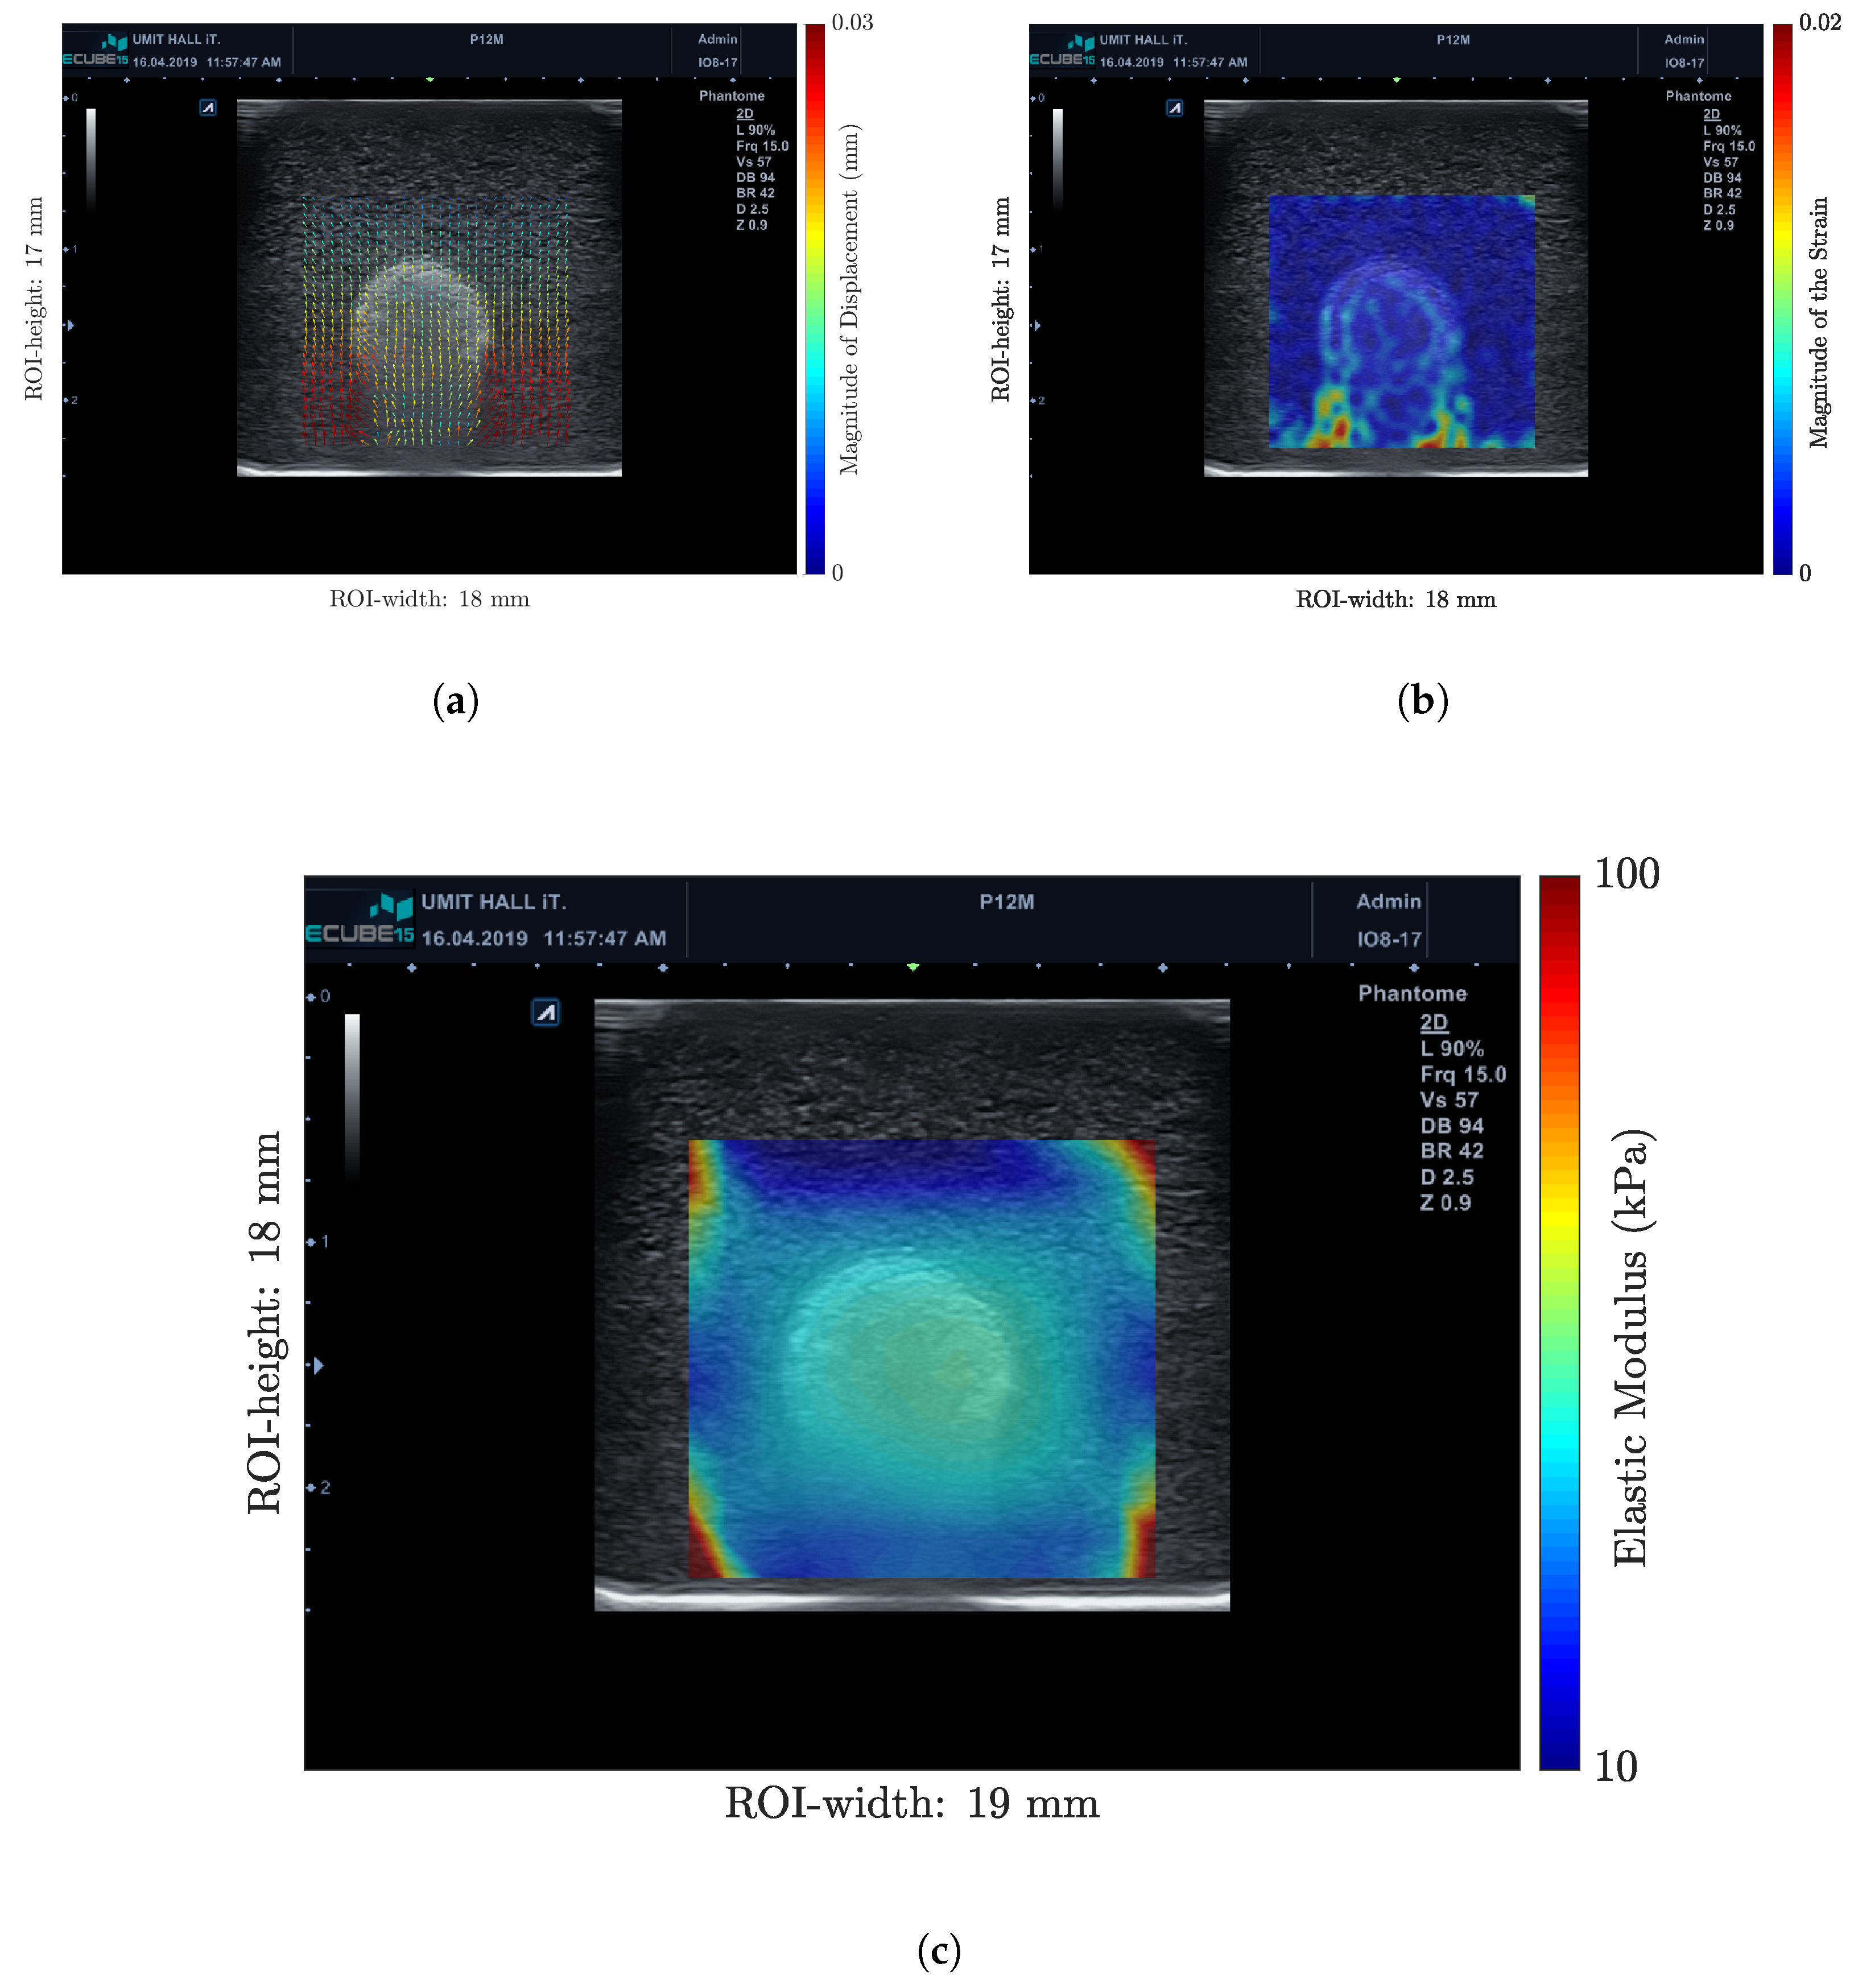
The gelatin phantoms were compressed by the linear unit, shown in Figure 2a. The resulting images were evaluated by the presented algorithm. Figure 5a shows the displacement field in the phantom. The strain image (Figure 5b) made the differences in the elasticity visible. It is easy to see that the region of the inclusion shared the same strain. The algorithm showed this applicability to B-mode images and its capability to estimate strain distribution.
The estimated elastic modulus E was projected on the US image (Figure 5c). The parameters for QSEI were adopted for the special requirements. In that case, we used the virtual force F v = 1.5 N, which was the force compressing the phantom. The start value for the optimization of the elastic modulus was E = 100 kPa. The Tikhonov regularization parameter was α = 10 3 . Figure 5c shows that the measured elastic modulus was in the same range as the mechanically-measured one. The inclusion is clearly visible.

3.2. Ex Vivo Measurements on Porcine Vocal Folds

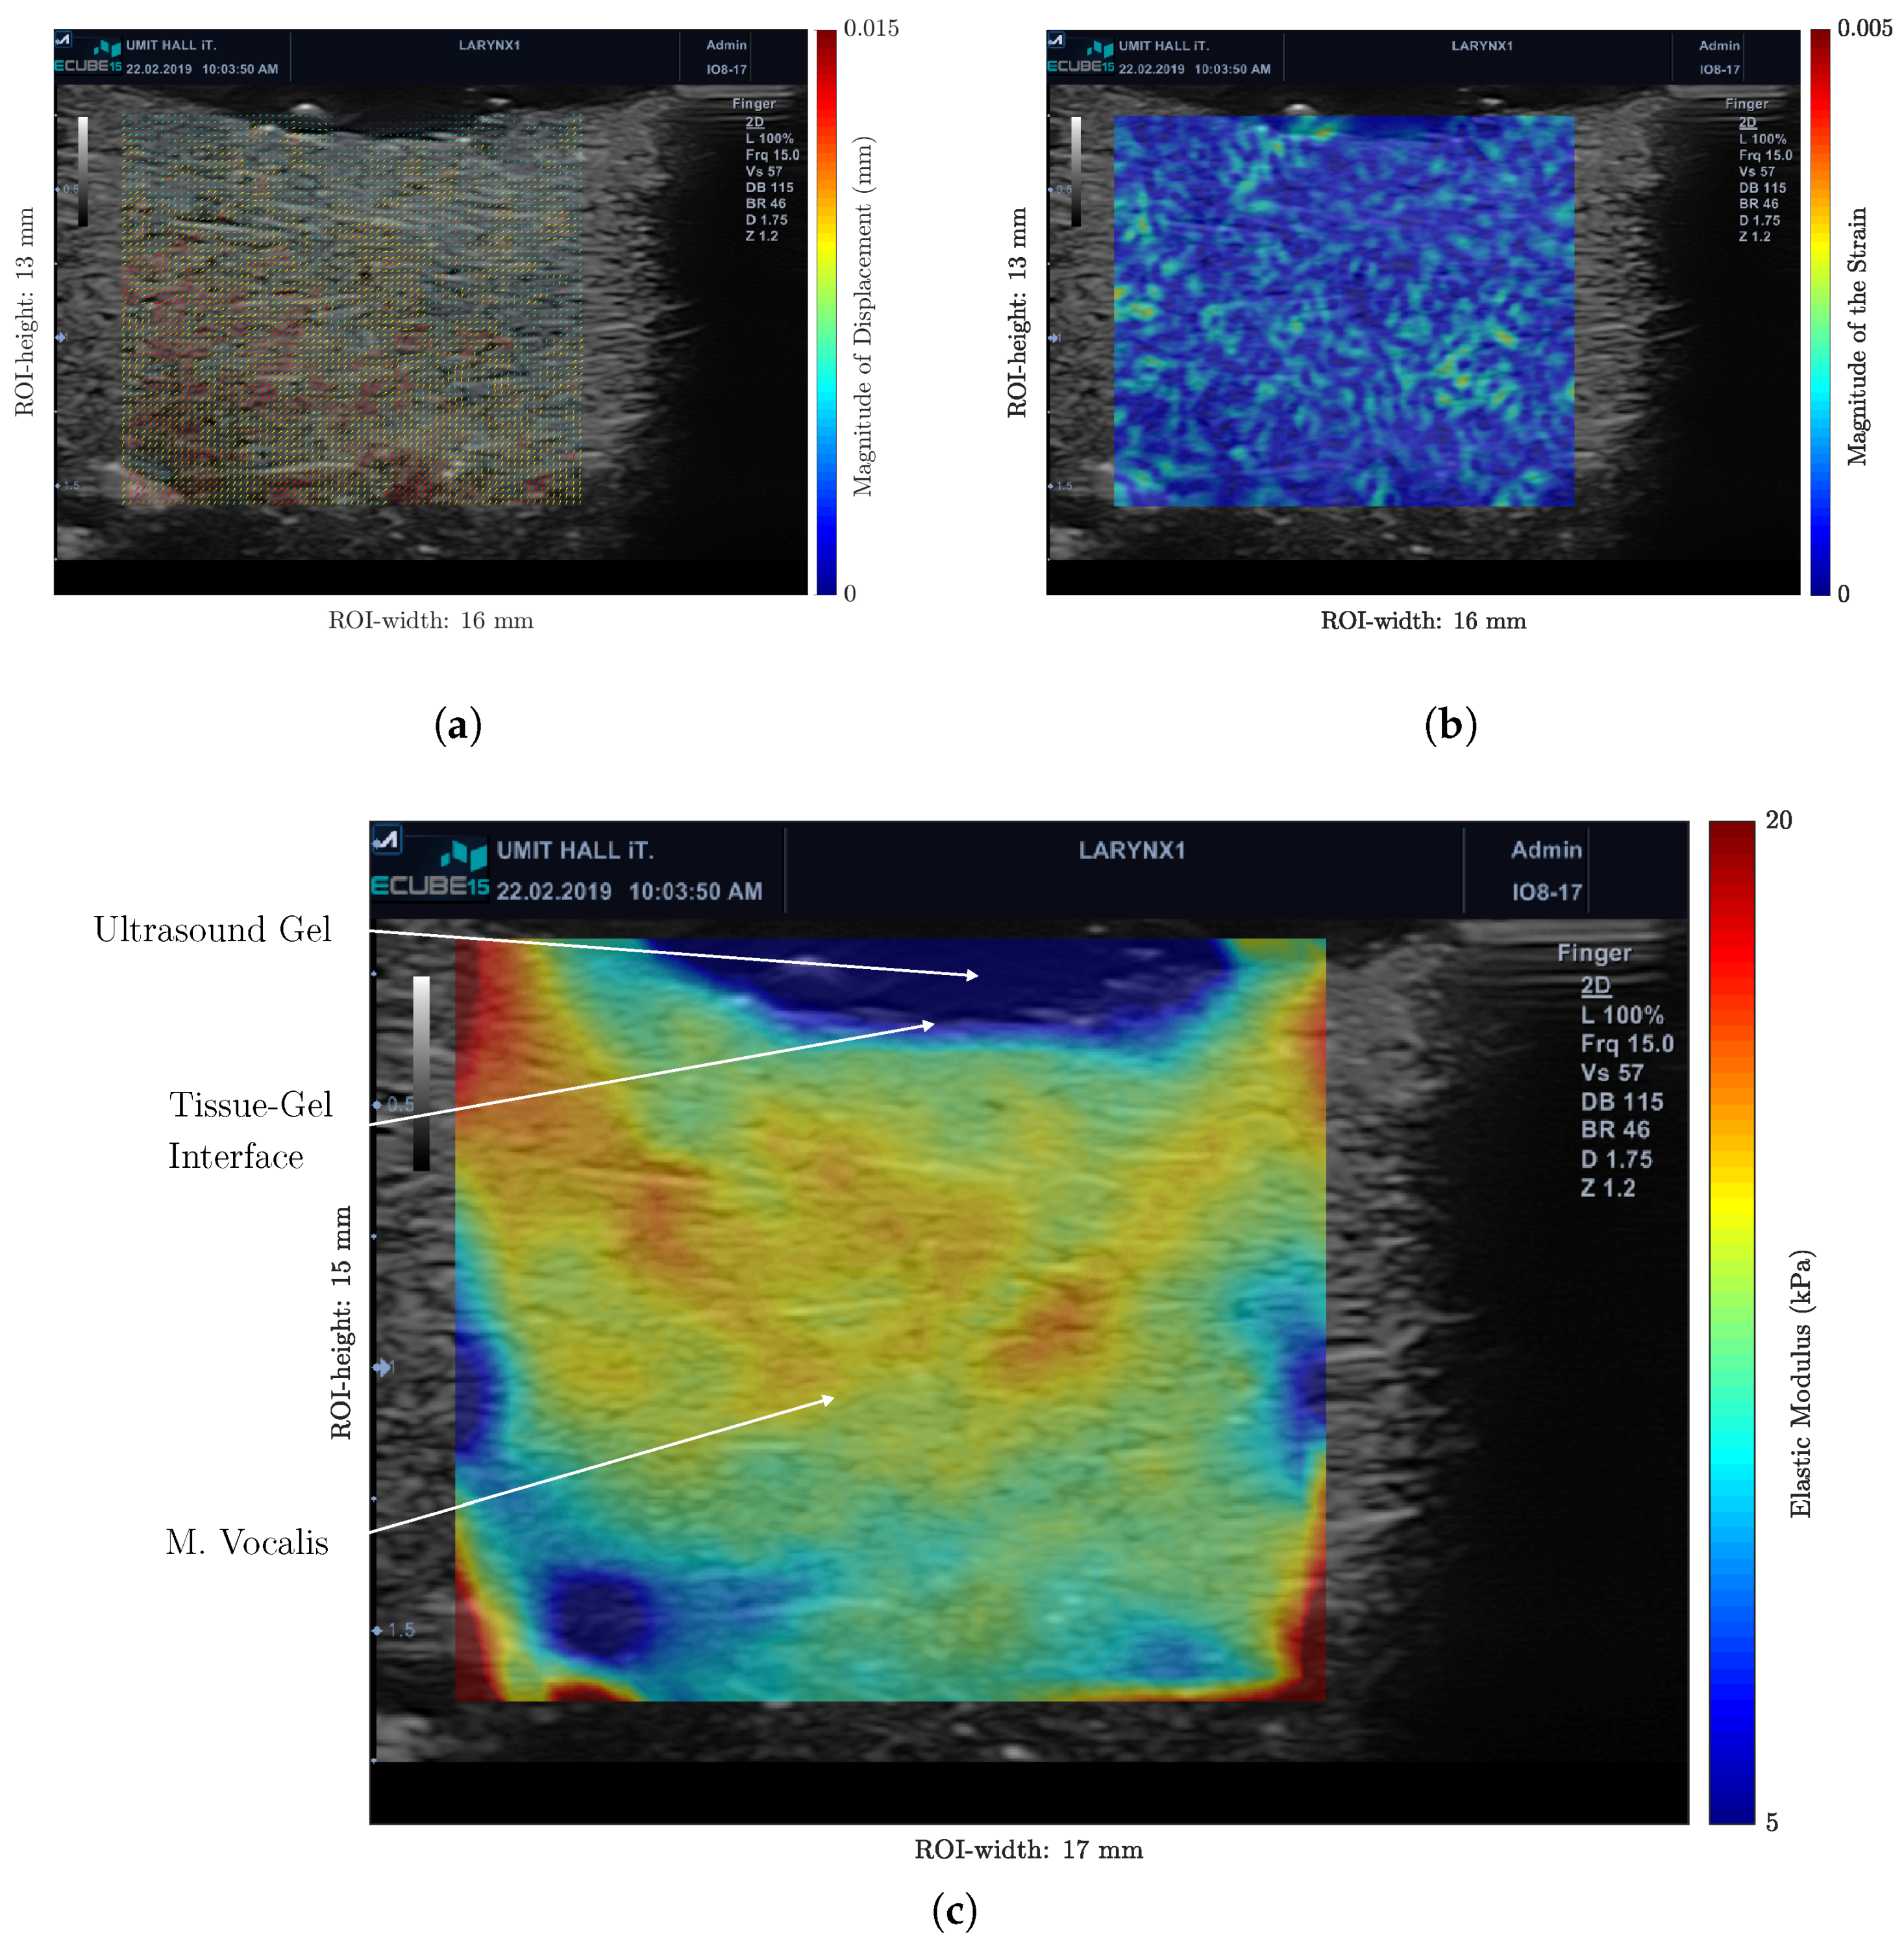
The images of the porcine VFs were analyzed with the same algorithm. The estimated displacement field (Figure 6a) and the strain field (Figure 6b) were mapped on the US images. The FEM solution (Figure 6c) was found with F v = 1 N and the start value for E = 10 kPa. The Tikhonov regularization parameter was chosen α = 10 5 .

4. Discussion

The goal of this work was to show a new approach to measure the elastic properties of the VFs. At first, we showed the applicability of our algorithm on gelatin phantoms and compared the results with mechanical measurements. Later, we used the same algorithm on porcine VFs, and it showed feasible results. The discussion of the results is separated into three sections: (1) the discussion of the measurement method and the algorithm, (2) the discussion of the measurement on VFs, and (3) potential applications and outlook.

4.1. Examination Method and Algorithm

The examination method and the algorithm itself consisted of several steps and interfaces between different software tools (Figure 3). Every step was optimizable and potentially erroneous, so we will discuss the individual steps. First of all, the image acquisition on the VFs was user dependent, because the VFs were compressed manually. The manual compression, therefore the strain field, was difficult to reproduce [16]. The shear-wave elastography could reduce the user dependency, bringing up other technical challenges [52]. For example, the choice of the different imaging and stimulation frequency was challenging.
Due to the measurement on ex vivo VFs, the elastic modulus was measured on relaxed muscles. For this reason, the presented results were only valid for muscles free from tension. Our approach makes anesthesia of the patient mandatory, which leads to relaxation of the muscles. Therefore, the measurement on muscles under tension is not possible. The transcutaneous approach was able to display the VFs under movement [53,54].
The measurement method and the algorithm were validated on rectangular gelatin phantoms with a central inclusion. In this case, the proposed method showed good results. The geometrical and elastic properties of these phantoms are different from the ones of the VFs. Therefore, the validation could be refined in two ways. On the one hand, the validation could be done on artificial VFs, or on the other hand on a series of measurements of porcine VFs. Our future goal was to validate it in both suggested ways.
The image registration of the video sequence was very time consuming. Every frame took around 10–15 min to register. An optimization of the calculation time was sought. The calculation could be reduced by reducing the iteration number of the optimizer, which possibly reduced the registration precision. Further investigations on the minimum number of iterations could be beneficial. Additionally, the registration could be done on a GPU [37].
The filter parameters, specifically the filter window and order of the polynomial, for the Savitzky–Golay filter of the displacement field are empirical values. The exact choice needs to be validated and optimized. Furthermore, the parameters (e.g., boundary conditions and Tikhonov regularization parameter) of the FEM solver were chosen manually. The boundary conditions of the FEM were an approximation of the real ones, and the measurement of the forces in the tissue was not done. To use this approach in non-lab settings, further research on the FEM estimation would be necessary. Especially, an exact integration of the displacement at the borders would be desirable. As a result of the approximated boundary conditions, the corners of the measured elastic modulus of the phantom (Figure 5c) appeared to be very high.
As a result, the algorithm will be enhanced. Especially, the automatic choice of the mentioned parameters and a shorter calculation time would be required for clinical applications.

4.2. Measurements on the VFs

The described measurement on the VFs was a new method and to our knowledge the first of its kind. That makes a direct comparison difficult. We compared our approach with alternative methods: with other medical imaging techniques, with different placements of the US transducer, and with mechanical measurements on porcine VFs.
First, we will compare our results to other medical imaging techniques, like OCT and magnetic resonance imaging (MRI) [55]. The optical methods (e.g., videostroboscopy, videokymography, and videoendoscopy) measure the movements and strains on the VF’s surface [56]; whereas in our study, quasi-static loads on the VFs were evaluated. Due to the different nature of these methods, a reasonable comparison of the two approaches is not possible. Consequently, we will only discuss medical imaging techniques, which are able to image tissue in depth, notably US, OCT, and MRI.
The OCT examination of the VFs is a promising approach, due to the high-resolution of the images [57,58,59,60,61,62]. Imaging the different layers of the VFs, the OCT surpassed the US imaging [59,62]. However, the penetration depth in the mentioned studies was a maximal of 2.6 mm, whereas the penetration depth of the US was much higher, in our case 20 mm [59]. As a consequence, deeper layers can be displayed. Therefore, the M. vocalis was clearly visible on our images (Figure 6c). The resolution loss through US can be compensated by using higher frequencies. Up to 50 MHz, with a penetration depth of 5 mm, have been used to examine the VF tissue [63].
The MRI images of the phonation process measured the anatomical structures of the VFs. Measurements of the elastic properties with MRI have been shown in other organ systems [64]. Furthermore, the vocal tract [65,66] and artificial VFs [67] have been examined with MRI. The tissue needs to be excited by an internal or external source [64]. This would be one of the challenges of using magnetic resonance elastography to examine the VFs.
Ultimately, it was not clear that there was a superior method. All methods had their advantages and disadvantages. The US had a deeper penetration depth, whereas the OCT had a good resolution, and MRI was able to show the VFs during phonation. Further research in the elastic imaging of the VFs is necessary, in order to choose the best method [9]. Our USE approach had the advantages of being minimally invasive, not exposing the patient to radiation, using a standard US machine, and being well studied.
In addition, we will compare different transducer placements. In our study, we placed the transducer directly on the VFs, the so-called direct approach. However, other researchers placed the transducer on the skin of the patient, which is called the transcutaneous approach [10,11,13,14,15,54,68,69,70]. In the direct approach, it was easy to identify the VFs, whereas in transcutaneous approaches, the visualization rate was only 36.7 % for the true VFs [71]. Those difficulties were based on two main factors: the VFs’s anatomical position posterior of the thyroid cartilage and the physical limits of the US method itself. The penetration depth of the US decreased with the frequency, while the resolution increased [13]. Consequently, it was difficult to gain high-resolution images of the VFs in a transcutaneous approach. In the direct approach, we overcame both limitations: this allowed us to exactly place the transducer on the VFs, and we could use higher frequencies for good spatiotemporal resolution. Adversely, the spatial conditions in the human larynx are quite small, so a specially-designed transducer for in vivo measurements would be necessary. Additionally, in clinical use, the patient would have to be anesthetized, which makes the examination more invasive than the transcutaneous approaches.
Furthermore, we compared our results to mechanical measurements of the VF’s elastic properties. Various measurement protocols (e.g., traction testing, shear rheometry, linear skin rheometry, indentation testing) have been used to estimate the elastic modulus of porcine VFs [1]. Using the traction testing approach on six porcine VFs, an elastic modulus of 16.3 ( ± 2.9 ) kPa was found [72]. Besides, Burks et al. [46] measured an elastic modulus of 17.86 ( ± 7.91 ) kPa in the low strain region using a traction testing approach based on digital image correlation (DIC). Both methods are also static methods, which measure the properties ex vivo, so the results were comparable with ours. In Figure 6c, we see that the estimated elastic modulus in the present study was in the same range.
On the other hand, a similar DIC-approach found a elastic modulus of 40.5 ( ± 15.7 ) kPa [73]. Miri et al. [73] explained the inconsistency with the different measurement methods, which led to an underestimation of the elastic modulus in mechanical measurements. The indentation testing method reported lower values between 1.6 and 5.7 kPa [1]. Those values were below the estimated values in our work. This could be a consequence of the highly different measurement methods.
Therefore, no conclusion can be drawn about the frequency dependency of the elastic modulus. Therefore, further research with vibration VFs would be necessary.

4.3. Potential Applications and Outlook

The measurement of the elastic properties of the VFs could be beneficial for diagnostic methods of voice disorders, but further research is necessary [3,4]. Moreover, the results of our study can be used in refining models of the VFs. The knowledge of the spatial distribution of the displacement, the strain, and the elastic modulus can be computerized and used for models of the VFs. We showed that it was possible to gain strain images and the spatial distribution of the elastic modulus of the true vocal folds ex vivo by an image registration approach. We will improve our algorithm, automate the parameter estimation for the image registration and the FEM, and test the whole measurement on a series of porcine larynges.

Author Contributions

Conceptualization, A.S. and R.L.; methodology, A.S. and R.L.; preparation of larynges, M.S.; software, R.L.; validation, A.S. and R.L.; investigation, R.L.; resources, A.S. and R.L.; writing, original draft preparation, R.L.; writing, review and editing, M.M., M.S., A.S., and R.L.; visualization, R.L.; supervision, A.S.; project administration, A.S.; funding acquisition, A.S.

Funding

This work was supported by the Austrian Science Fund Grant No. I 3806-B28 and by the German research foundation (DFG) No. DO1247/9-1.

Conflicts of Interest

The authors declare no conflict of interest. The funders had no role in the design of the study; in the collection, analyses, or interpretation of the data; in the writing of the manuscript; nor in the decision to publish the results.

References

  1. Miri, A.K. Mechanical Characterization of Vocal Fold Tissue: A Review Study. J. Voice 2014, 28, 657–667. [Google Scholar] [CrossRef] [PubMed]
  2. Titze, I.R. The physics of small–amplitude oscillation of the vocal folds. J. Acoust. Soc. Am. 1988, 83, 1536–1552. [Google Scholar] [CrossRef] [PubMed]
  3. Gómez-Vilda, P.; Fernández-Baillo, R.; Nieto, A.; Díaz, F.; Fernández-Camacho, F.J.; Rodellar, V.; Alvarez, A.; Martínez, R. Evaluation of voice pathology based on the estimation of vocal fold biomechanical parameters. J. Voice 2007, 21, 450–476. [Google Scholar] [CrossRef] [PubMed]
  4. Zhang, Z. Characteristics of phonation onset in a two-layer vocal fold model. J. Acoust. Soc. Am. 2009, 125, 1091–1102. [Google Scholar] [CrossRef] [PubMed]
  5. Dion, G.R.; Jeswani, S.; Roof, S.; Fritz, M.; Coelho, P.G.; Sobieraj, M.; Amin, M.R.; Branski, R.C. Functional assessment of the ex vivo vocal folds through biomechanical testing: A review. Mater. Sci. Eng. C Mater. Biol. Appl. 2016, 64, 444–453. [Google Scholar] [CrossRef] [PubMed] [Green Version]
  6. Goodyer, E.; Jiang, J.J.; Devine, E.; Sutor, A.; Rupitsch, S.; Zorner, S.; Stingl, M.; Schmidt, B. Devices and Methods on Analysis of Biomechanical Properties of Laryngeal Tissue and Substitute Materials. Curr. Bioinform. 2011, 6, 344–361. [Google Scholar] [CrossRef]
  7. Ruffing, S.; Struffert, T.; Grgic, A.; Reith, W. Bildgebende Diagnostik von Pharynx und Larynx. Der Radiol. 2005, 45, 828–837. [Google Scholar] [CrossRef]
  8. Bailly, L.; Cochereau, T.; Orgéas, L.; Bernardoni, N.H.; Du Roscoat, S.R.; McLeer-Florin, A.; Robert, Y.; Laval, X.; Laurencin, T.; Chaffanjon, P.; et al. 3D multiscale imaging of human vocal folds using synchrotron X-ray microtomography in phase retrieval mode. Sci. Rep. 2018, 8, 14003:1–14003:20. [Google Scholar] [CrossRef]
  9. Hawkshaw, M.J.; Sataloff, J.B.; Sataloff, R.T. New concepts in vocal fold imaging: A review. J. Voice 2013, 27, 738–743. [Google Scholar] [CrossRef]
  10. Hu, Q.; Zhu, S.Y.; Luo, F.; Gao, Y.; Yang, X.Y. High-Frequency Sonographic Measurements of True and False Vocal Cords. J. Ultrasound Med. 2010, 29, 1023–1030. [Google Scholar] [CrossRef]
  11. Hsiao, T.Y.; Wang, C.L.; Chen, C.N.; Hsieh, F.J.; Shau, Y.W. Elasticity of human vocal folds measured in vivo using color Doppler imaging. Ultrasound Med. Biol. 2002, 28, 1145–1152. [Google Scholar] [CrossRef]
  12. Tsui, P.H.; Wan, Y.L.; Chen, C.K. Ultrasound imaging of the larynx and vocal folds: Recent applications and developments. Curr. Opin. Otolaryngol. Head Neck Surg. 2012, 20, 437–442. [Google Scholar] [CrossRef] [PubMed]
  13. Gao, J.; Zhu, Q.; Xia, C.X.; Shin, J.; Shih, G.; Min, R. Shear Wave Elastography to Assess False Vocal Folds in Healthy Adults: A Feasibility Study. J. Ultrasound Med. 2018, 37, 2537–2544. [Google Scholar] [CrossRef] [PubMed] [Green Version]
  14. Gao, J.; Xia, C.X.; Zhu, Q.; Hamilton, J.; Min, R. Ultrasound strain imaging in assessment of false vocal folds in adults: A feasibility study. Clin. Imaging 2018, 51, 292–299. [Google Scholar] [CrossRef] [PubMed]
  15. Chen, H.; Tridandapani, S.; Yoshida, E.; Moore, C.; Beitler, J.; Jani, A.; Liu, T. TU–E–201C–01: Ultrasound Elasticity Evaluation of Vocal Cord Function. Med. Phys. 2010, 37, 3404. [Google Scholar] [CrossRef]
  16. Sigrist, R.M.; Liau, J.; Kaffas, A.E.; Chammas, M.C.; Willmann, J.K. Ultrasound Elastography: Review of Techniques and Clinical Applications. Theranostics 2017, 7, 1303–1329. [Google Scholar] [CrossRef] [PubMed]
  17. DeWall, R.J. Ultrasound Elastography: Principles, Techniques, and Clinical Applications. Crit. Rev. Biomed. Eng. 2013, 41, 1–19. [Google Scholar] [CrossRef] [PubMed]
  18. Tsai, C.G.; Chen, J.H.; Shau, Y.W.; Hsiao, T.Y. Dynamic B-mode ultrasound imaging of vocal fold vibration during phonation. Ultrasound Med. Biol. 2009, 35, 1812–1818. [Google Scholar] [CrossRef] [PubMed]
  19. Semmler, M.; Döllinger, M.; Patel, R.R.; Ziethe, A.; Schützenberger, A. Clinical relevance of endoscopic three-dimensional imaging for quantitative assessment of phonation. Laryngoscope 2018, 128, 2367–2374. [Google Scholar] [CrossRef]
  20. Noordzij, J.P.; Ossoff, R.H. Anatomy and Physiology of the Larynx. Otolaryngol. Clin. N. Am. 2006, 39, 1–10. [Google Scholar] [CrossRef]
  21. Garrett, C.G.; Coleman, J.R.; Reinisch, L. Comparative Histology and Vibration of the Vocal Folds: Implications for Experimental Studies in Microlaryngeal Surgery. Laryngoscope 2000, 110, 814–824. [Google Scholar] [CrossRef] [PubMed]
  22. Hirano, M.; Kakita, Y.; Ohmaru, K.; Kurita, S. Structure and Mechanical Properties of the Vocal Fold. Speech Lang. 1982, 7, 271–297. [Google Scholar] [CrossRef]
  23. Cook, D.D.; Nauman, E.; Mongeau, L. Ranking vocal fold model parameters by their influence on modal frequencies. J. Acoust. Soc. Am. 2009, 126, 2002–2010. [Google Scholar] [CrossRef] [PubMed]
  24. Kazuto, N. A comparative Study of the Layer Structure of the Vocal Fold: A morphological investigation of 11 mammalian species. Otol. Fukuoka 1982, 28, 699–738. [Google Scholar]
  25. Culjat, M.O.; Goldenberg, D.; Tewari, P.; Singh, R.S. A Review of Tissue Substitutes for Ultrasound Imaging. Ultrasound Med. Biol. 2010, 36, 861–873. [Google Scholar] [CrossRef] [PubMed]
  26. Bude, R.O.; Adler, R.S. An easily made, low-cost, tissue-like ultrasound phantom material. J. Clin. Ultrasound 1995, 23, 271–273. [Google Scholar] [CrossRef] [Green Version]
  27. Cardarelli, F. Properties of Materials. In Materials Handbook; Cardarelli, F., Ed.; Springer: Cham, Switzerland, 2018; pp. 1–99. [Google Scholar]
  28. Cornbleet, P.J.; Gochman, N. Incorrect least-squares regression coefficients in method-comparison analysis. Clin. Chem. 1979, 25, 432–438. [Google Scholar]
  29. Hall, T.J.; Bilgen, M.; Insana, M.F.; Krouskop, T.A. Phantom materials for elastography. IEEE Trans. Ultrason. Ferroelectr. Freq. Control 1997, 44, 1355–1365. [Google Scholar] [CrossRef]
  30. Markidou, A.; Shih, W.Y.; Shih, W.H. Soft-materials elastic and shear moduli measurement using piezoelectric cantilevers. Rev. Sci. Instrum. 2005, 76, 064302. [Google Scholar] [CrossRef] [Green Version]
  31. Parker, J.R. Algorithms for Image Processing and Computer Vision, 2nd ed.; Wiley: Indianapolis, IN, USA, 2011. [Google Scholar]
  32. Ugural, A.C.; Fenster, S.K. Advanced Mechanics of Materials and Applied Elasticity, 5th ed.; Prentice Hall: Upper Saddle River, NJ, USA, 2012. [Google Scholar]
  33. Kavanagh, J.L.; Menand, T.; Daniels, K.A. Gelatine as a crustal analogue: Determining elastic properties for modeling magmatic intrusions. Tectonophysics 2013, 582, 101–111. [Google Scholar] [CrossRef]
  34. Chaudhry, A. Estimation of effective Poissons ratio in non-homogeneous porous media using two ultrasound transducers: A feasibility study. Imaging Med. 2016, 8, 105–111. [Google Scholar] [CrossRef]
  35. Klein, S.; Staring, M.; Murphy, K.; Viergever, M.A.; Pluim, J.P.W. elastix: A toolbox for intensity-based medical image registration. IEEE Trans. Med Imaging 2010, 29, 196–205. [Google Scholar] [CrossRef] [PubMed]
  36. Perona, P.; Malik, J. Scale-space and edge detection using anisotropic diffusion. IEEE Trans. Pattern Anal. Mach. Intell. 1990, 12, 629–639. [Google Scholar] [CrossRef] [Green Version]
  37. Shamonin, D.P.; Bron, E.E.; Lelieveldt, B.P.F.; Smits, M.; Klein, S.; Staring, M. Fast parallel image registration on CPU and GPU for diagnostic classification of Alzheimer’s disease. Front. Neuroinform. 2013, 7, 50:1–50:15. [Google Scholar] [CrossRef] [PubMed]
  38. Abd-Elmoniem, K.Z.; Stuber, M.; Prince, J.L. Direct three-dimensional myocardial strain tensor quantification and tracking using zHARP. Med. Image Anal. 2008, 12, 778–786. [Google Scholar] [CrossRef] [PubMed] [Green Version]
  39. Klein, S.; Pluim, J.P.W.; Staring, M.; Viergever, M.A. Adaptive Stochastic Gradient Descent Optimisation for Image Registration. Int. J. Comput. Vis. 2008, 81, 227. [Google Scholar] [CrossRef]
  40. Metz, C.T.; Klein, S.; Schaap, M.; van Walsum, T.; Niessen, W.J. Nonrigid registration of dynamic medical imaging data using nD + t B-splines and a groupwise optimization approach. Med. Image Anal. 2011, 15, 238–249. [Google Scholar] [CrossRef] [PubMed]
  41. Staring, M.; Klein, S. Itk: Transforms Supporting Spatial Derivatives. Insight J. 2010. Available online: http://hdl.handle.net/10380/3215 (accessed on 2 July 2019).
  42. Rueckert, D.; Sonoda, L.I.; Hayes, C.; Hill, D.L.; Leach, M.O.; Hawkes, D.J. Nonrigid registration using free-form deformations: Application to breast MR images. IEEE Trans. Med. Imaging 1999, 18, 712–721. [Google Scholar] [CrossRef]
  43. Pan, B. Full-field strain measurement using a two-dimensional Savitzky-Golay digital differentiator in digital image correlation. Opt. Eng. 2007, 46, 033601:1–033601:10. [Google Scholar] [CrossRef]
  44. Lai, W.M.; Rubin, D.; Krempl, E. Introduction to Continuum Mechanics, 3rd ed.; Pergamon Press: Oxford, NY, USA, 1993. [Google Scholar]
  45. Barbone, P.E.; Bamber, J.C. Quantitative elasticity imaging: What can and cannot be inferred from strain images. Phys. Med. Biol. 2002, 47, 2147–2164. [Google Scholar] [CrossRef] [PubMed]
  46. Burks, G.; de Vita, R.; Leonessa, A. Characterization of the Continuous Elastic Parameters of Porcine Vocal Folds. J. Voice Off. J. Voice Found. 2018. [Google Scholar] [CrossRef] [PubMed]
  47. Smyl, D.; Antin, K.N.; Liu, D.; Bossuyt, S. Coupled digital image correlation and quasi-static elasticity imaging of inhomogeneous orthotropic composite structures. Inverse Probl. 2018, 34, 124005. [Google Scholar] [CrossRef] [Green Version]
  48. Smyl, D.; Bossuyt, S.; Liu, D. OpenQSEI: A MATLAB package for quasi static elasticity imaging. SoftwareX 2019, 9, 73–76. [Google Scholar] [CrossRef]
  49. Richards, M.S.; Barbone, P.E.; Oberai, A.A. Quantitative three-dimensional elasticity imaging from quasi-static deformation: A phantom study. Phys. Med. Biol. 2009, 54, 757–779. [Google Scholar] [CrossRef] [PubMed]
  50. Mueller, J.L.; Siltanen, S. Linear and Nonlinear Inverse Problems with Practical Applications, 1st ed.; Society for Industrial and Applied Mathematics: Philadelphia, PA, USA, 2012. [Google Scholar]
  51. Aster, R.C.; Borchers, B.; Thurber, C.H. Parameter Estimation and Inverse Problems, 3rd ed.; Elsevier Science: Amsterdam, The Netherlands, 2018. [Google Scholar]
  52. Cosgrove, D.O.; Berg, W.A.; Doré, C.J.; Skyba, D.M.; Henry, J.P.; Gay, J.; Cohen-Bacrie, C. Shear wave elastography for breast masses is highly reproducible. Eur. Radiol. 2012, 22, 1023–1032. [Google Scholar] [CrossRef] [PubMed]
  53. Ruan, Z.; Ren, R.; Dong, W.; Ma, J.; Xu, Z.; Mao, Y.; Jiang, L. Assessment of vocal cord movement by ultrasound in the ICU. Intensive Care Med. 2018, 44, 2145–2152. [Google Scholar] [CrossRef]
  54. Fukuhara, T.; Donishi, R.; Matsuda, E.; Koyama, S.; Fujiwara, K.; Takeuchi, H. A Novel Lateral Approach to the Assessment of Vocal Cord Movement by Ultrasonography. World J. Surg. 2018, 42, 130–136. [Google Scholar] [CrossRef]
  55. Deliyski, D.D.; Hillman, R.E. State of the Art Laryngeal Imaging: Research and Clinical Implications. Curr. Opin. Otolaryngol. Head Neck Surg. 2010, 18, 147–152. [Google Scholar] [CrossRef]
  56. Bakhshaee, H.; Young, J.; Yang, J.C.W.; Mongeau, L.; Miri, A.K. Determination of strain field on the superior surface of excised larynx vocal folds using DIC. J. Voice 2013, 27, 659–667. [Google Scholar] [CrossRef]
  57. Wong, B.J.F.; Jackson, R.P.; Guo, S.; Ridgway, J.M.; Mahmood, U.; Su, J.; Shibuya, T.Y.; Crumley, R.L.; Gu, M.; Armstrong, W.B.; et al. In Vivo Optical Coherence Tomography of the Human Larynx: Normative and Benign Pathology in 82 Patients. Laryngoscope 2005, 115, 1904–1911. [Google Scholar] [CrossRef] [PubMed] [Green Version]
  58. Burns, J.A.; Zeitels, S.M.; Anderson, R.R.; Kobler, J.B.; Pierce, M.C.; de Boer, J.F. Imaging the mucosa of the human vocal fold with optical coherence tomography. Ann. Otol. Rhinol. Laryngol. 2005, 114, 671–676. [Google Scholar] [CrossRef] [PubMed]
  59. Yu, L.; Liu, G.; Rubinstein, M.; Saidi, A.; Wong, B.J.; Chen, Z. Office-based dynamic imaging of vocal cords in awake patients with swept-source optical coherence tomography. J. Biomed. Opt. 2009, 14, 064020:1–064020:4. [Google Scholar] [CrossRef] [PubMed]
  60. Burns, J.A.; Kim, K.H.; Kobler, J.B.; deBoer, J.F.; Lopez-Guerra, G.; Zeitels, S.M. Real-time tracking of vocal fold injections with optical coherence tomography. Laryngoscope 2009, 119, 2182–2186. [Google Scholar] [CrossRef] [PubMed]
  61. Benboujja, F.; Garcia, J.A.; Beaudette, K.; Strupler, M.; Hartnick, C.J.; Boudoux, C. Intraoperative imaging of pediatric vocal fold lesions using optical coherence tomography. J. Biomed. Opt. 2016, 21, 016007:1–016007:10. [Google Scholar] [CrossRef] [PubMed]
  62. Englhard, A.S.; Betz, T.; Volgger, V.; Lankenau, E.; Ledderose, G.J.; Stepp, H.; Homann, C.; Betz, C.S. Intraoperative assessment of laryngeal pathologies with optical coherence tomography integrated into a surgical microscope. Lasers Surg. Med. 2017, 49, 490–497. [Google Scholar] [CrossRef] [PubMed]
  63. Huang, C.C.; Sun, L.; Dailey, S.H.; Wang, S.H.; Shung, K.K. High frequency ultrasonic characterization of human vocal fold tissue. J. Acoust. Soc. Am. 2007, 122, 1827–1832. [Google Scholar] [CrossRef]
  64. Mariappan, Y.K.; Glaser, K.J.; Ehman, R.L. Magnetic resonance elastography: A review. Clin. Anat. 2010, 23, 497–511. [Google Scholar] [CrossRef] [Green Version]
  65. Zourmand, A.; Mirhassani, S.M.; Ting, H.N.; Bux, S.I.; Ng, K.H.; Bilgen, M.; Jalaludin, M.A. A magnetic resonance imaging study on the articulatory and acoustic speech parameters of Malay vowels. Biomed. Eng. Online 2014, 13, 103:1–103:20. [Google Scholar] [CrossRef]
  66. Echternach, M.; Birkholz, P.; Traser, L.; Flügge, T.V.; Kamberger, R.; Burk, F.; Burdumy, M.; Richter, B. Articulation and vocal tract acoustics at soprano subject’s high fundamental frequencies. J. Acoust. Soc. Am. 2015, 137, 2586–2595. [Google Scholar] [CrossRef]
  67. Taylor, C.J.; Tarbox, G.J.; Bolster, B.D., Jr.; Bangerter, N.K.; Thomson, S.L. Magnetic resonance imaging-based measurement of internal deformation of vibrating vocal fold models. J. Acoust. Soc. Am. 2019, 145, 989–997. [Google Scholar] [CrossRef] [PubMed]
  68. Shaath, G.A.; Jijeh, A.; Alkurdi, A.; Ismail, S.; Elbarbary, M.; Kabbani, M.S. Ultrasonography assessment of vocal cords mobility in children after cardiac surgery. J. Saudi Heart Assoc. 2012, 24, 187–190. [Google Scholar] [CrossRef] [PubMed] [Green Version]
  69. Linares, J.P.A. Use of ultrasound in the evaluation of the vocal folds following thyroidectomy. Colomb. J. Anesthesiol. 2014, 42, 238–242. [Google Scholar] [CrossRef]
  70. Kandil, E.; Deniwar, A.; Noureldine, S.I.; Hammad, A.Y.; Mohamed, H.; Al-Qurayshi, Z.; Tufano, R.P. Assessment of Vocal Fold Function Using Transcutaneous Laryngeal Ultrasonography and Flexible Laryngoscopy. JAMA Otolaryngol. Head Neck Surg. 2016, 142, 74–78. [Google Scholar] [CrossRef] [PubMed] [Green Version]
  71. Wong, K.P.; Woo, J.W.; Youn, Y.K.; Chow, F.C.L.; Lee, K.E.; Lang, B.H.H. The importance of sonographic landmarks by transcutaneous laryngeal ultrasonography in post-thyroidectomy vocal cord assessment. Surgery 2014, 156, 1590–1596. [Google Scholar] [CrossRef] [Green Version]
  72. Alipour, F.; Jaiswal, S.; Vigmostad, S. Vocal Fold Elasticity in the Pig, Sheep, and Cow Larynges. J. Voice 2011, 25, 130–136. [Google Scholar] [CrossRef] [PubMed] [Green Version]
  73. Miri, A.K.; Barthelat, F.; Mongeau, L. Effects of Dehydration on the Viscoelastic Properties of Vocal Folds in Large Deformations. J. Voice 2012, 26, 688–697. [Google Scholar] [CrossRef] [Green Version]
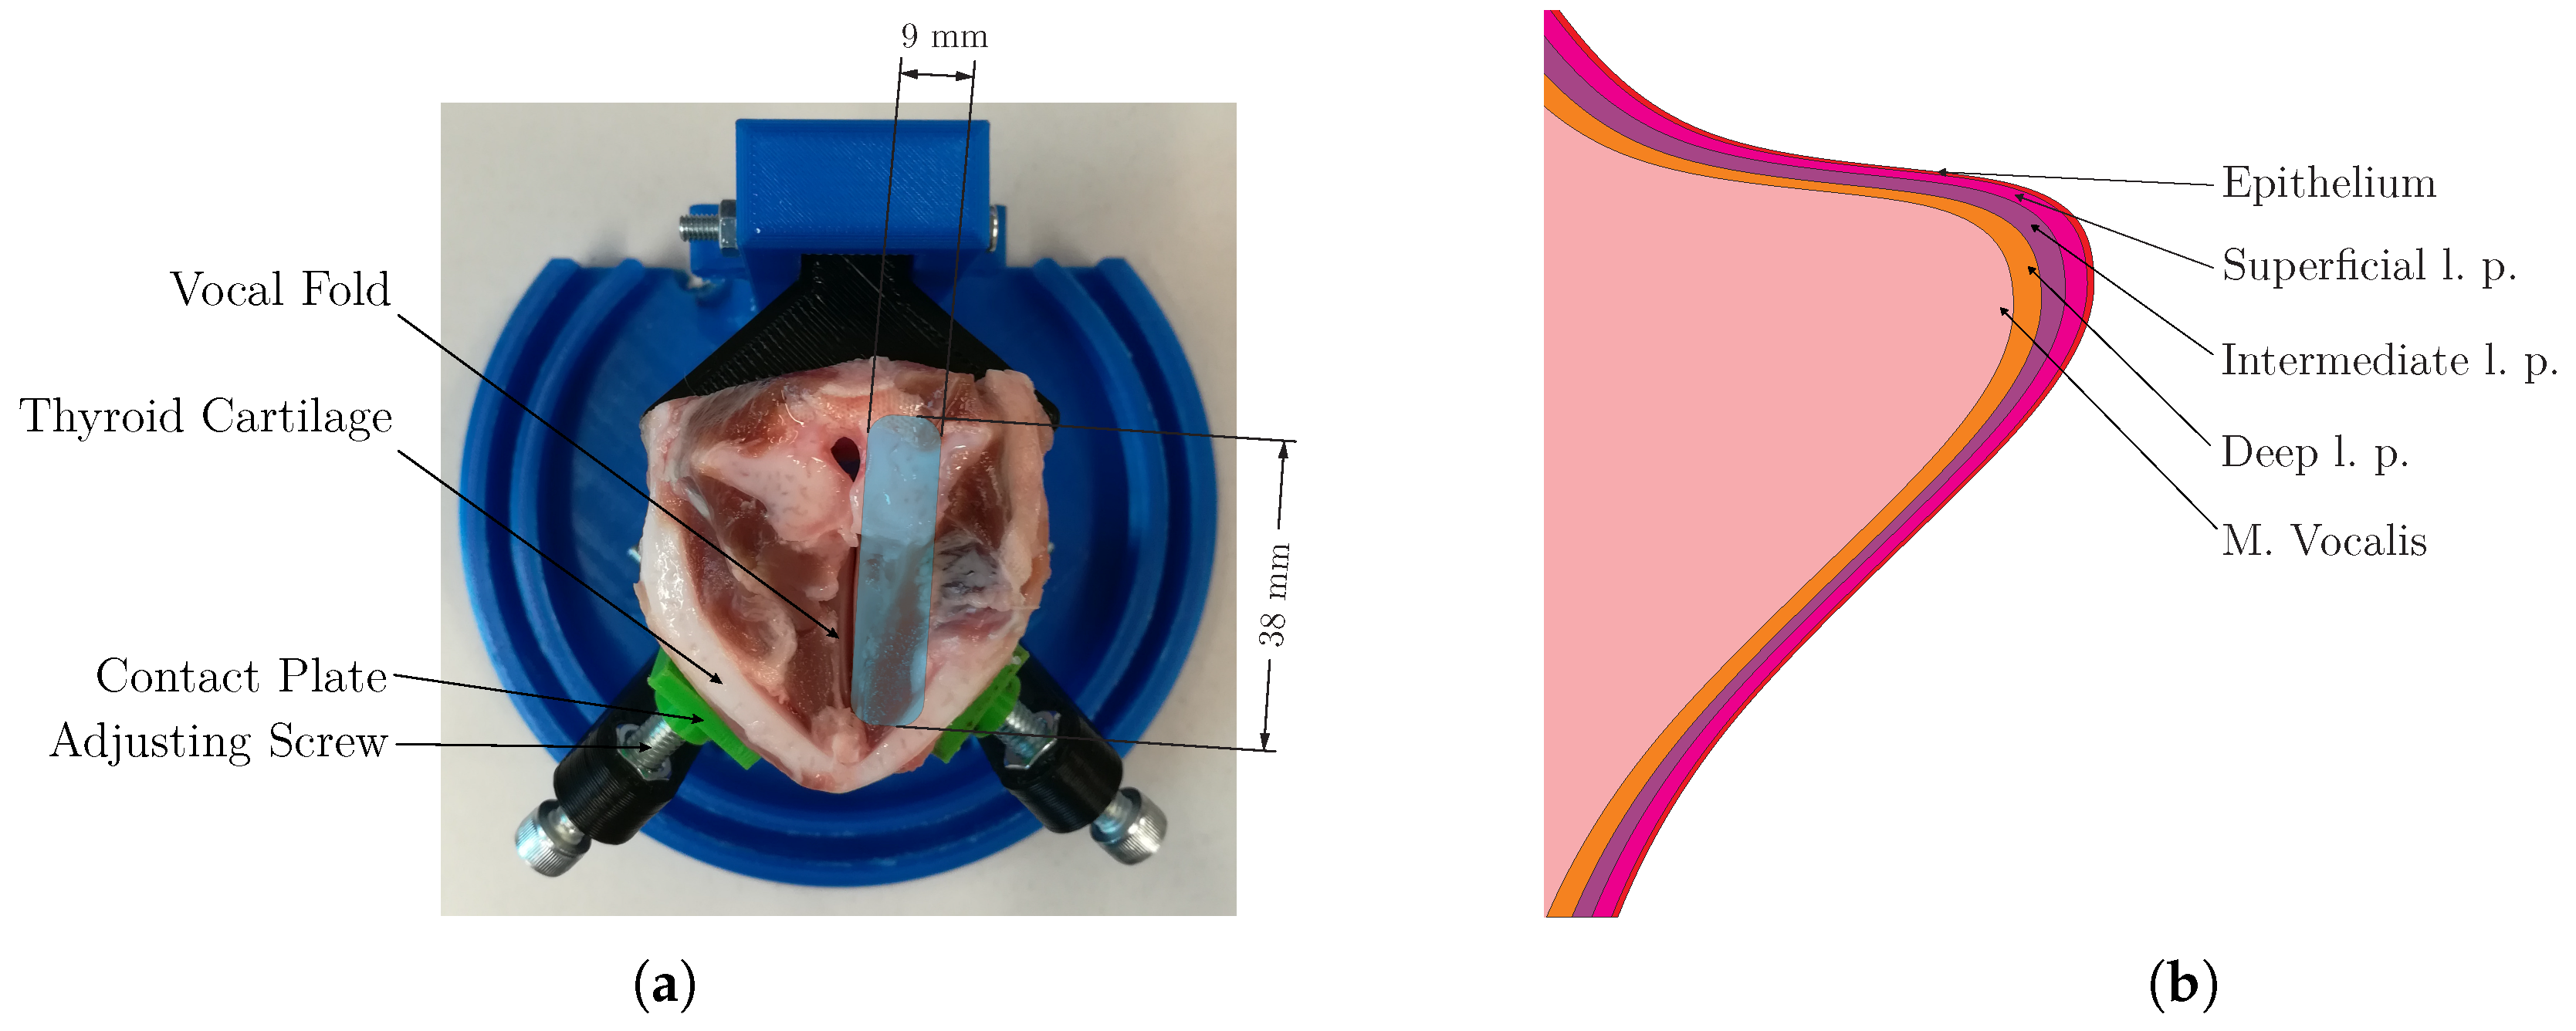
Figure 1. Anatomical and histological properties of the vocal folds (VFs). (a) Porcine vocal folds fixed in the holder. The blue area indicates the transducer position. (b) Layers of the human VF: epithelium, lamina propria (l.p.) and musculus (M.) vocalis [1].
Applsci 09 02729 g001
Figure 2. Mechanical measurements of the gelatin phantom. (a) Setup for the measurements on the gelatin phantom. (b) Stress-strain-curve of the gelatin phantoms.
Applsci 09 02729 g002
Figure 3. The data evaluation workflow.
Applsci 09 02729 g003
Figure 4. Generated mesh mapped on the US frame. The virtual force F v is indicated.
Applsci 09 02729 g004
Figure 5. Measurements in the gelatin phantom. The measurement data are superimposed on the US frame; whereas, the displacement between the shown and the previous frame is displayed. (a) Displacement field. The color of the vectors indicates the magnitude of the displacement. (b) Absolute value of the strain components calculated by Equation (9). (c) The elastic modulus estimated by OpenQSEI.
Applsci 09 02729 g005
Figure 6. Measurements of the VFs. The VFs were fixed in the measurement setup and examined with the Alpinion IO8-17 transducer placed on the shown position (Figure 1a). The resulting images were evaluated with the presented algorithm: starting with the estimation of the displacement field (a), calculating the strain (b), and finally, the elastic modulus (c). (a) Displacement field in the tissue. (b) Strain in the tissue. (c) The elastic modulus of the VF.
Applsci 09 02729 g006