Abstract
This study aimed to establish the concurrent validity and agreement of the K-power (KINVENT Biomecanique, Montpellier, France) hybrid sensor system that combines Ultra-Wideband and Inertial Measurement Unit measures against criterion timing gates for recording 20-m sprint performance in adolescent athletes. Fifteen trained adolescent track and field sprinters (age: 15.2 ± 2.4 years) performed two maximal 20-m sprints. Sprint times were simultaneously recorded using timing gates and the K-power sensor. Validity and agreement were assessed using paired-samples t-tests, Intraclass Correlation Coefficients (ICCs), Coefficient of Variation (CV), and Bland–Altman analysis. Sensitivity was determined by comparing the Typical Error (TE) to the Smallest Worthwhile Change (SWC). No significant systematic bias was observed between the devices (p > 0.05). The K-power sensor demonstrated excellent absolute agreement (ICC = 0.96, [95% CI = 0.94–0.98) and a low relative error (CV = 1.07%). The device displayed high sensitivity, with a TE (0.034 s) smaller than SWC (0.040 s). In conclusion, the K-power sensor is a valid and reliable instrument for measuring 20-m sprint times, being a practical alternative to timing gates. While the system is sensitive (TE < SWC), the Minimal Detectable Change of 0.094 s likely reflects the inherent biological variability of adolescent mechanics; thus, coaches should view changes exceeding 0.09 s as meaningful for individual athletes.
1. Introduction
Sprint performance is a fundamental determinant of success in a wide range of athletic disciplines, ranging from track and field to team sports such as soccer, rugby, and basketball. Consequently, the accurate monitoring of sprint, acceleration, and maximal velocity capabilities is a primary concern for strength and conditioning coaches and sports scientists [1]. Reliable data is essential not only for profiling athletes and monitoring training adaptations but also for quantifying return-to-play readiness following injury [2].
In laboratory settings, optoelectronic systems or densely spaced photocell arrays serve as the absolute reference methods for kinematic velocity profiling. However, in applied field settings where such equipment is logistically impractical, practitioners typically rely on electronic timing gates and radar or laser guns as the practical criterion standard [3]. While these field-based methods are widely accepted, they possess inherent limitations; for instance, handheld radar and laser devices are subject to potential measurement errors related to the cosine effect (angle dependency), signal filtering, and proprietary manufacturer algorithms. However, it is important to note that these field-based methods detect ‘kinematic’ onset (visible displacement) rather than the ‘kinetic’ onset (force application) measured in laboratories [4]. This constitutes a distinct measurement onset difference between variables (reaction time vs. movement time) rather than a measurement error, yet it complicates comparisons between field and laboratory data. While electronic timing gates and radar systems provide high validity and reliability, they present distinct logistical limitations. Timing gates are often expensive, time-consuming to set up, and limited to measuring average velocity between specific fixed points rather than continuous motion. Similarly, radar and laser devices require strict line-of-sight protocols and typically allow for the assessment of only one athlete at a time, reducing the efficiency of testing large squads [5].
To address these constraints, practitioners have increasingly turned to wearable technologies, such as Global Navigation Satellite Systems (GPS) and microsensors [6,7]. While modern 10–18 Hz GPS units combined with accelerometers have shown acceptable validity for linear sprints beyond 15 m, they may still face challenges in capturing the rapid, micro-changes in velocity that occur during the initial start phases of short sprints compared to higher-frequency local positioning or inertial systems [8,9].
The assessment of sprint time over short distances is particularly critical for adolescent populations, since sprinting velocity is developed differently compared to adults [10]. Research indicates that the duration of the acceleration phase in youth is highly variable and influenced by factors such as biological age, sex, growth rate, and training status [11,12,13,14]. While some studies suggest that prepubescent athletes may achieve a velocity plateau over shorter distances, trained adolescents often continue to accelerate beyond 30 or 40 m [10]. Consequently, the assessment of sprint time over 20 m specifically targets the initial acceleration capabilities, acknowledging that this distance may not capture the maximal velocity phase in adolescent trained sprinters [15,16]. However, simply recording the total sprint duration is insufficient for profiling young athletes. Keskinis et al. recently demonstrated that children can achieve identical total sprint times (e.g., over 15 m) while exhibiting significantly different temporal strategies—some reaching maximum velocity early, while others are still accelerating [17].
To eventually detect these subtle temporal differences, coaches and practitioners require valid instrumentation capable of capturing high-resolution data. However, before the internal temporal strategies (e.g., phase transitions) of a new device can be trusted, its fundamental ability to record the total duration of the effort against a criterion must be established. Therefore, the purpose of this study was to determine the concurrent validity and agreement of the K-power hybrid sensor system compared to timing gates for measuring the total 20-m sprint time, serving as a primary validation step for its use in adolescent track and field athletes.
2. Materials and Methods
2.1. Design of the Study
To establish the comparative validity and agreement of 20 m sprint times and peak velocity derived from the K-power sensor, a group of trained young athletes was recruited. The K-power sensor was compared against gold-standard criterion measures (infrared timing gates) during a single testing session. Participants completed two 20 m sprints, separated by 5 min of rest. Ethical approval was granted by the Institutional Research Ethics Committee (Approval Number: 268/2025).
2.2. Participants
Fifteen adolescent track and field athletes (age: 15.15 ± 2.40 years; height: 165.49 ± 10.37 cm; body mass: 65.13 ± 6.67 kg) provided written parental consent before participation. Inclusion criteria were: (1) aged 14–18 years; (2) trained athletes currently performing three or more training sessions per week that included resistance exercise and sprint-specific exercises; and (3) the absence of injury for at least three months prior to testing. The athletes were instructed not to perform any strenuous lower-body activity for a 72-h period before the tests. Any non-lower-body exercise completed within this period was recorded in an activity diary and replicated before any subsequent sessions.
2.3. Experimental Procedures
Participants attended two sessions: (1) a familiarization session to practice the sprint protocol and determine preferred starting stance, and (2) the experimental testing session. All testing was performed outdoors on a track and field stadium. Before the sprint tests, the participants executed a standardized warm-up comprising dynamic stretching and progressively faster runs (1 × 70% and 2 × 90% of maximal effort, separated by 2–3 min) according to their usual practice.
All sprints were completed wearing spikes. Sprint performance was recorded using timing gates (WITTY System, Microgate, Bolzano, Italy) as the criterion system. The gates were positioned at approximately hip height (~100 cm from the surface of the track) and were adjusted at the height of the participants’ pelvis [18] at the starting line (0 m) and the 20 m mark.
Simultaneously, data were collected using the K-power system (KINVENT Biomecanique, Montpellier, France). The K-Power system is a wearable wireless motion-tracking device designed for sports performance and rehabilitation assessment. It combines Ultra-Wideband (UWB) ranging and nine-degree-of-freedom inertial sensing (9-DoF inertial measurement unit—IMU) to provide high-precision kinematic measurements of distance, velocity, acceleration, angular velocity, and orientation during dynamic tasks such as squats, jumps, sprints, shuttle runs, and gait analysis. K-Power operates within a hybrid sensing framework in which the IMU delivers high-frequency motion information, while the UWB subsystem provides absolute distance references relative to one or more fixed anchors. The system communicates with several UWB anchors in real time and continuously evaluates the ranging quality to automatically select the most stable measurement path. A dedicated signal-processing pipeline filters raw UWB data, removes transient outliers, and rejects multipath or interference-affected readings to ensure consistent ranging accuracy even under fast motion or indoor reflections. All motion data are transmitted via low-energy Bluetooth to the KINVENT v.2.22.0 (KINVENT Biomecanique, Montpellier, France) mobile application. The software utilizes a proprietary sensor fusion algorithm with an output frequency of 200 Hz. This algorithm integrates the high-frequency inertial data (IMU) to fill the temporal gaps between the lower-frequency UWB position updates, providing a reconstructed velocity profile. This algorithm integrates the short-term dynamic resolution of the IMU with the long-term spatial stability of UWB ranging through an adaptive fusion framework, maintaining both responsiveness and drift-free position estimation. The K-Power device can operate both indoors and outdoors.
The system set-up consists of 2 sensors, one fixed on the athlete’s lower back and an anchor sensor placed on a stable tripod (90 cm high) 3 m behind the start line. The K-power sensor was fixated on the lumbar area using a specialized belt that provided a snug fit on the body. Participants assumed their preferred 2-point (split-stance) crouch 50 cm behind the 0-m timing gate. After sensor confirmation, participants self-initiated each maximal trial. Two maximal trials were performed, with an interval of 3 min. The data acquired for the analysis were:
- Criterion Time: Timing for the 0–20 m sprint was initiated by the athlete’s torso breaking the first timing gate (0 m) and concluded upon breaking the second gate (20 m);
- K-power Time: The K-power sensor recorded the full sprint, and the corresponding 0–20 m split time was extracted from the raw data from its software for a direct comparison. The start criterion for the K-power system was set at a velocity threshold of 0.2 m/s and a covered distance of 0.5 m. This threshold was selected to filter low-frequency signal noise and pre-start sway inherent to IMU data, ensuring that the recording triggered only upon the initiation of distinct forward locomotion.
2.4. Statistical Analysis
The validity and agreement of the K-power sensor were compared against the gold-standard criterion measures (timing gates) using RStudio (v4.3.1), with an a level of 0.05.
At first, the mean absolute error (MAE) was calculated as the absolute difference between the Criterion Time and the K-power Time. Then, the systematic bias was assessed using a paired-samples t-test to determine the mean difference between devices. Relative agreement was quantified using a two-way mixed-effects Intraclass Correlation Coefficient (ICC) for absolute agreement, with values interpreted as: >0.90 (excellent), 0.75–0.90 (good), 0.50–0.74 (moderate), and <0.50 (poor) [19]. The linear relationship was assessed using Pearson’s correlation coefficient (r), while overall concordance was measured with the Concordance Correlation Coefficient (CCC). Absolute agreement was visualized using Bland–Altman plots to establish the 95% Limits of Agreement (LoA).
Proportional bias was tested by regressing the absolute differences against the means of the paired measurements. Error quantification was performed using several metrics. The Typical Error (TE) was calculated (TE = SDdiff/√2) to quantify the standard error between the two devices. The Standard Error of Measurement (SEM) was calculated from the criterion measure to assess precision. From the SEM, the Minimal Detectable Change at the 95% confidence level (MDC95) was also calculated (MDC95 = SEM × 1.96 × √2) to determine the smallest change required to be 95% confident that the change is real and not due to random error. Relative absolute error was quantified using the Coefficient of Variation (CV), calculated as the TE expressed as a percentage of the criterion group mean [CV = (TE/mean of timing-gates) × 100]. The CV was interpreted as: <5% (good), 5–10% (moderate), and >10% (poor). For practical context, the Smallest Worthwhile Change (SWC) was calculated as 0.2× the between-subject standard deviation of the criterion measure. In the absence of a specific physiological performance anchor for this cohort, this distribution-based method was selected to represent the smallest standardized effect size (Cohen’s d = 0.2) that would imply a shift in an athlete’s rank relative to the group population [20]. To quantify the magnitude of differences between the measurement systems, Effect Sizes (Cohen’s d) were calculated for the paired comparisons. These were interpreted in accordance with specific guidelines for rehabilitation and sports research as: trivial (<0.2), small (0.2–0.6), moderate (0.6–1.2), large (1.2–2.0), and very large (>2.0) [21]. Additionally, 95% Confidence Intervals (95% CI) were reported for all point estimates to provide a measure of the precision of the statistical findings [22].
3. Results
Agreement thresholds for 20 m sprint time were set at CV ≤ 10% and ICC ≥ 0.85. No significant systematic bias was observed between the two devices (t(29) = 1.127, p > 0.05). The magnitude of the difference was considered small (Cohen’s d = 0.21; 95% CI [−0.0081, 0.027]). Absolute agreement was excellent, with an ICC of 0.96 (95% CI: 0.94, 0.98) and a CV of 1.07% (Figure 1).
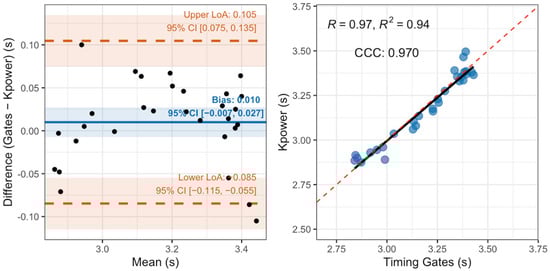
Figure 1.
Bland–Altman with limits of agreement (left panel) and the line for smallest worthwhile change (SWC) and correlation for 20-m sprint times (right panel); LoA: limits of agreement; CCC: concordance correlation coefficient (ntrials = 30).
The MAE metrics were all small (MAE = 0.038 s; TE = 0.034 s; SEM = 0.034 s). The instrument demonstrated excellent sensitivity, as TE (0.034 s) was smaller than the SWC (=0.0402 s). However, MDC95 was found to be 0.094 s. This indicates that while the instrument’s TE is low enough to detect meaningful changes, a change of at least 0.094 s would be required to be 95% confident that a change observed in a single athlete is real.
4. Discussion
The primary aim of this study was to assess the concurrent validity and agreement of the K-power hybrid sensor system against gold-standard timing gates during short-distance sprinting (20-m dash) in adolescent athletes. The main finding of this investigation is that the K-power sensor demonstrates excellent agreement and negligible systematic bias for measuring sprint duration. Consequently, it can be considered a valid practical alternative to electronic timing gates for field-based monitoring of linear speed.
The analysis of the 20-m sprint times revealed a very high level of relative agreement between the K-power sensor and the criterion timing gates. The ICC was found to be 0.96, that indicates strong rank-order consistency. Evidence for absolute validity is instead provided by the Bland–Altman analysis and the small effect size of the bias. Furthermore, the CV of 1.07% indicates a low relative error magnitude, falling well within the strict threshold of <5% often cited as a benchmark for acceptable precision in sports performance technology [20]. While CV is primarily a reliability metric, in this context it confirms that the random error between the systems is proportionally small relative to the sprint duration.
Crucially, the paired samples t-test was used specifically to screen for systematic fixed bias between the devices. The analysis indicated no significant mean difference (p > 0.05). While this lack of statistical significance does not confirm method equivalence on its own, when viewed alongside the narrow Bland–Altman Limits of Agreement (Figure 1), it suggests that the K-power system does not introduce a substantial fixed error relative to the timing gates. This is a significant finding, as wearable devices (particularly GPS) often display systematic errors during high-intensity accelerations due to sampling rates that are insufficient for capturing rapid changes in velocity [9,23]. The absence of bias suggests that the hybrid UWB/IMU technology used in the K-power system successfully mitigates these sampling limitations over short distances, providing data that is essentially interchangeable with timing gates for group mean comparisons [24,25]. However, it is important to note that this agreement in total time (average velocity) does not inherently validate the continuous velocity profile or the system’s ability to resolve intra-sprint sampling issues. Verifying the quality of the velocity reconstruction requires future validation against continuous reference methods (e.g., laser or optoelectronic systems).
When assessing the utility of a device for performance monitoring, it is vital to distinguish between the device’s typical error and its ability to detect meaningful changes in performance [26]. The TE observed in this study was 0.034 s. This value is lower than the calculated SWC of 0.040 s. This relationship found between them (TE < SWC) indicates that the K-power system possesses “good” sensitivity. In a practical setting, this means that the K-power sensor is sufficiently precise to detect performance improvements that would be considered practically meaningful for this cohort of athletes. However, it is acknowledged that this SWC threshold is statistical in nature; whether a 0.04 s improvement translates to a specific physiological adaptation or competitive advantage requires further context-specific validation.
The sensitivity of the K-power system (TE = 0.034 s) must be interpreted against the specific temporal demands of youth sprinting. Keskinis et al. utilized a time difference threshold of just 0.01 s between 5-m splits to distinguish between sprint phases [17]. While this threshold specifically applies to split granularity, it serves as a rigorous benchmark for the precision required in sprint diagnostics. The fact that the K-power system demonstrated a TE of only 0.034 s for the entire 20-m duration suggests that the accumulated measurement error is minimal. Although this total error is naturally higher than the single-split threshold, its proximity in magnitude indicates that the system possesses the stability required for effective field-based monitoring, even if it does not yet claim the millisecond-level resolution of laboratory photocells for phase transitions. As noted by Keskinis et al. [17], traditional photocells are limited in their ability to pinpoint the exact temporal transition between sprint phases, and wearable devices like the one validated here—or similar novel systems integrating optical gates with IMUs [27]— theoretically may offer a more practical solution for monitoring these specific velocity progression patterns in real-time [24]. Furthermore, recent advances in IMU data analysis provide reliable gait event detection information that can support athletes monitoring [28], not only for velocity profiling, but also for the progression of the step kinematic parameters. Nevertheless, it is important to distinguish that, while the current study confirms the system’s validity for total sprint duration, its potential for identifying continuous phase transitions represents an inherent advantage of the technology type rather than a variable validated in this specific protocol.
Furthermore, existing literature indicates that sprint performance in adolescents is mechanistically characterized by prolonged contact times and braking phases compared to adults [29]. Given this unique biomechanical profile, establishing the validity of the total sprint duration provided by the K-power system serves as an essential foundational step for the longitudinal monitoring of this cohort. However, practitioners must interpret individual changes with caution. The MDC95 was calculated at 0.094 s. While this value is substantially higher than the SWC, it is imperative to acknowledge that this threshold is heavily influenced by the performance variance inherent to the developmental cohort examined. It is acknowledged that this threshold might be too high for elite adult sprinters, where performance gains are often much smaller. Nevertheless, it is suggested that, in elite adult sprinters, this threshold might be lower due to increased homogeneity in such populations [30]. To clarify this, further research is required examining elite sprinters.
Research indicates that running mechanics in youth athletes are often characterized by greater variability compared to adults, with developing athletes exhibiting higher step-by-step inconsistency due to ongoing neuromuscular maturation and coordination refinement [17,31]. This elevated ‘biological noise’ naturally inflates the standard deviation of the group and, by extension, the derived MDC. Consequently, the threshold of 0.094 s likely reflects the instability of adolescent motor performance rather than solely sensor precision. It is plausible that testing experienced sprinters, who possess more stable force application and kinematic patterns [32], would yield a lower MDC, further validating the system’s precision for elite populations. However, it must be acknowledged that elite cohorts often exhibit reduced between-subject variance (homogeneity); this statistical characteristic may paradoxically lower the ICC values even if absolute measurement precision remains high.
From a practical standpoint, the K-power system offers distinct logistical advantages over traditional timing gates. Timing gates require time-intensive set-up, precise alignment of tripods, and are vulnerable to environmental factors such as wind or accidental disruption by athletes [3]. Furthermore, single-beam timing gates are susceptible to false triggering by an athlete’s limbs (e.g., a swinging arm) rather than the torso, which has been shown to introduce measurement errors in up to 32% of trials [33]. A set-up combining time-gates and a motion start sensor fixed at the leg did not reliably detect meaningful changes in sprint performance over a 20-m distance since SWC was less than the TE [34]. In contrast, the K-power sensor, fixed to the lower back, tracks the movement of the athlete’s center of mass, potentially offering a more consistent representation of the start of the sprint. The K-power system, utilizing a single anchor and a wearable sensor, allows for a more streamlined workflow, particularly when testing larger squads. The data suggests that strength and conditioning coaches can utilize this system to measure short sprint performance in adolescent athletes provided they are aware of the MDC thresholds when analyzing individual progress.
While the results are promising, this study is not without limitations. First, the sample size consisted of 15 adolescent athletes; future research should examine elite adult populations where the margins of performance improvement (SWC) are even smaller. Second, this study only validated linear sprinting over 20 m. The accuracy of the system during longer sprints (e.g., 40 m or flying sprints) or multidirectional movements remain to be established in future research. Finally, while the K-power sensor showed no bias, strictly adhering to the manufacturer’s placement protocols (lower back firm fixation) is essential, as sensor movement artifacts could influence IMU data integrity.
5. Conclusions
In conclusion, the K-power hybrid sensor provides valid and reliable measures of 20-m sprint performance in trained young athletes. With an ICC of 0.96 and a TE lower than the SWC, it serves as an effective field-based tool for monitoring speed development. However, practitioners should note an MDC95 of 0.094 s when interpreting individual performance changes. Future investigations should aim to extend these findings to elite adult populations and explore the system’s utility in multidirectional agility tasks. Such advancements are necessary to determine the broader utility of the system. Currently, the data supports the K-power system specifically as a valid practical alternative for recording 20-m sprint times in youth track and field athletes.
Author Contributions
Conceptualization, V.P., E.A. and C.C.; methodology, V.P., E.A., T.L. and C.C.; software, T.L. and C.C.; validation, E.A., T.L. and C.C.; formal analysis, V.P. and C.C.; investigation, V.P., P.K. and C.C.; resources, V.P. and C.C.; data curation, V.P., E.A. and C.C.; writing—original draft preparation, T.L. and C.C.; writing—review and editing, V.P., E.A. and C.C.; visualization, V.P. and C.C.; supervision, V.P.; project administration, V.P. and C.C. All authors have read and agreed to the published version of the manuscript.
Funding
This research received no external funding.
Institutional Review Board Statement
The study was conducted in accordance with the Declaration of Helsinki, and approved by the Institutional Review Board of the School of Physical Education and Sport Science at Thessaloniki, Aristotle University of Thessaloniki, Thessaloniki, Greece (approval code: 268/2025; date of approval: 11 May 2025).
Informed Consent Statement
Informed parental signed consent was obtained for all participants involved in the study.
Data Availability Statement
The data presented in this study are available on request from the corresponding authors due to ethical reasons.
Conflicts of Interest
The authors declare conflict of interest since E.A., T.L. and C.C. are employed at KINVENT Biomecanique S.A.S.; however, the company had no role in the design of the study; in the collection, analyses, or interpretation of data; in the writing of the manuscript; or in the decision to publish the results.
Abbreviations
The following abbreviations are used in this manuscript:
| CCC | Concordance correlation coefficient |
| CV | Coefficient of variation |
| GPS | Global navigation satellite systems |
| ICC | Intraclass correlation coefficient |
| IMU | Inertial measurement unit |
| LoA | Limits of agreement |
| MDC95 | Minimal detectable change at the 95% confidence level |
| SD | Standard deviation |
| SEM | Standard error of measurement |
| SWC | Smallest worthwhile change |
| TE | Typical error |
| UWB | Ultra-wideband |
References
- Haugen, T.A.; Buchheit, M. Sprint running performance monitoring: Methodological and practical considerations. Sports Med. 2016, 46, 641–656. [Google Scholar] [CrossRef]
- Mendiguchia, J.; Samozino, P.; Martinez-Ruiz, E.; Brughelli, M.; Schmikli, S.; Morin, J.B.; Mendez-Villanueva, A. Field monitoring of sprinting power-force-velocity profile before, during and after hamstring injury rehabilitation. J. Sports Med. Phys. Fit. 2014, 54, 655–661. [Google Scholar] [CrossRef]
- Bond, C.W.; Willaert, E.M.; Noonan, B.C. Comparison of three timing systems: Reliability and best practice recommendations in timing short-duration sprints. J. Strength Cond. Res. 2017, 31, 1062–1071. [Google Scholar] [CrossRef]
- Haugen, T.A.; Tønnessen, E.; Seiler, S.K. The difference is in the start: Impact of timing and start procedure on sprint running performance. J. Strength Cond. Res. 2012, 26, 473–479. [Google Scholar] [CrossRef] [PubMed]
- Duthie, G.M.; Robertson, S.; Ball, K.; Haycraft, J.; Bright, L.; Parkinson, T.; Billingham, J.; Aughey, R.J. Validation of a laser device for assessing high-speed running in an outdoor team sport setting. Sports Eng. 2025, 28, 25. [Google Scholar] [CrossRef]
- Rodríguez-Fernández, A.; Suárez-Iglesias, D.; Vaquera, A.; Leicht, A.S.; Rodríguez-Marroyo, J.A. Inter-system and inter-unit reliability of Polar Team Pro and WIMU PRO devices during external load measurements indoors. Proc. Inst. Mech. Eng. Part P J. Sports Eng. Technol. 2023, 239, 469–478. [Google Scholar] [CrossRef]
- Sašek, M.; Miras-Moreno, S.; García-Ramos, A.; Cvjetičanin, O.; Šarabon, N.; Kavčič, I.; Smajla, D. The Concurrent Validity and Reliability of a Global Positioning System for Measuring Maximum Sprinting Speed and Split Times of Linear and Curvilinear Sprint Tests. Appl. Sci. 2024, 14, 6116. [Google Scholar] [CrossRef]
- Varley, M.C.; Fairweather, I.H.; Aughey, R.J. Validity and reliability of GPS for measuring instantaneous velocity during acceleration, deceleration, and constant motion. J. Sports Sci. 2012, 30, 121–127. [Google Scholar] [CrossRef]
- Nobari, H.; Martins, A.D.; Brito, J.P.; Mainer-Pardos, E.; Valdés-Badilla, P.; Oliveira, R. Concurrent validity and reliability of global positioning systems for measuring intense running and peak speed performance: A systematic review. Ger. J. Exerc. Sport Res. 2025. [Google Scholar] [CrossRef]
- Chatzilazaridis, I.; Panoutsakopoulos, V.; Papaiakovou, G.I. Stride characteristics progress in a 40-M sprinting test executed by male preadelescent, adolescent and adult athletes. Biol. Exerc. 2012, 8, 59–77. [Google Scholar] [CrossRef]
- Papaiakovou, G.; Giannakos, A.; Michailidis, C.; Patikas, D.; Bassa, E.; Kalopisis, V.; Anthrakidis, N.; Kotzamanidis, C. The effect of chronological age and gender on the development of sprint performance during childhood and puberty. J. Strength Cond. Res. 2009, 23, 2568–2573. [Google Scholar] [CrossRef]
- Baker, J.; Read, P.; Graham-Smith, P.; Cardinale, M.; Jones, T.W. Growth and maturation in adolescent track and field athletes. Aspetar Sports Med. J. 2024, 13, 250–255. [Google Scholar]
- Sudlow, A.; Galantine, P.; Del Sordo, G.; Raymond, J.J.; Dalleau, G.; Peyrot, N.; Duché, P. Effects of maximal power and the force-velocity profile on sprint acceleration performance according to maturity status and sex. J. Sports Sci. 2025, 43, 1319–1328. [Google Scholar] [CrossRef] [PubMed]
- Haugen, T.; Seiler, S.; Sandbakk, Ø.; Tønnessen, E. The training and development of elite sprint performance: An integration of scientific and best practice literature. Sports Med.-Open 2019, 5, 44. [Google Scholar] [CrossRef]
- Meyers, R.W.; Oliver, J.L.; Hughes, M.G.; Cronin, J.B.; Lloyd, R.S. Maximal sprint speed in boys of increasing maturity. Pediatr. Exerc. Sci. 2015, 27, 85–94. [Google Scholar] [CrossRef] [PubMed]
- Rumpf, M.C.; Cronin, J.B.; Pinder, S.D.; Oliver, J.L.; Hughes, M. Effect of different training methods on running sprint performance in male youth. Pediatr. Exerc. Sci. 2012, 24, 170–186. [Google Scholar] [CrossRef]
- Keskinis, I.; Panoutsakopoulos, V.; Merkou, E.; Lazaridis, S.; Bassa, E. Examination of Step Kinematics Between Children with Different Acceleration Patterns in Short-Sprint Dash. Biomechanics 2025, 5, 60. [Google Scholar] [CrossRef]
- Yeadon, M.R.; Kato, T.; Kerwin, D.G. Measuring running speed using photocells. J. Sports Sci. 1999, 17, 249–257. [Google Scholar] [CrossRef]
- Koo, T.K.; Li, M.Y. A guideline of selecting and reporting intraclass correlation coefficients for reliability research. J. Chiropr. Med. 2016, 15, 155–163. [Google Scholar] [CrossRef]
- Currell, K.; Jeukendrup, A.E. Validity, reliability and sensitivity of measures of sport performance. Sports Med. 2008, 38, 297–316. [Google Scholar] [CrossRef]
- Zieliński, G. Effect Size Guidelines for Individual and Group Differences in Physiotherapy. Arch. Phys. Med. Rehabil. 2025, 106, 1844–1849. [Google Scholar] [CrossRef]
- Andrade, C. How to understand the 95% confidence interval around the relative risk, odds ratio, and hazard ratio. J. Clin. Psychiatry 2023, 84, 23f14933. [Google Scholar] [CrossRef]
- Buchheit, M.; Al Haddad, H.; Simpson, B.M.; Palazzi, D.; Bourdon, P.C.; Di Salvo, V.; Mendez-Villanueva, A. Monitoring accelerations with GPS in football: Time to slow down? Int. J. Sports Physiol. Perform. 2014, 9, 442–445. [Google Scholar] [CrossRef]
- Yang, W.; Wang, J.; Zhao, Z.; Cui, Y. Accuracy of an Ultra-Wideband-Based Tracking System for Time–Motion Analysis in Tennis. Sensors 2025, 25, 1031. [Google Scholar] [CrossRef]
- Müller, D. A Multi Layer Ultra Wideband Network Architecture for Real Time Player Analysis in Dynamic Sports. Doctoral Dissertation, FH Vorarlberg (Fachhochschule Vorarlberg), Dornbirn, Austria, August 2025. [Google Scholar]
- Hopkins, W.G. Measures of reliability in sports medicine and science. Sports Med. 2000, 30, 1–15. [Google Scholar] [CrossRef] [PubMed]
- Kos, A.; Keš, E.; Hribernik, M.; Tomažič, S.; Umek, A. A Wireless Optical Gate and IMU System for Agility Assessment: Architecture, Synchronization and Validation. Informacije MIDEM 2025, 55, 229–238. [Google Scholar] [CrossRef]
- Mănescu, A.M.; Mănescu, D.C. Self-Supervised Gait Event Detection from Smartphone IMUs for Human Performance and Sports Medicine. Appl. Sci. 2025, 15, 11974. [Google Scholar] [CrossRef]
- Chatzilazaridis, I.; Panoutsakopoulos, V.; Bassa, E.; Kotzamanidou, M.C.; Papaiakovou, G.I. Effects of Age and Sex on the Kinematics of the Sprinting Technique in the Maximum Velocity Phase. Appl. Sci. 2024, 14, 6057. [Google Scholar] [CrossRef]
- Villalón-Gasch, L.; Jimenez-Olmedo, J.M.; Penichet-Tomas, A.; Sebastia-Amat, S. Concurrent Validity and Reliability of Chronojump Photocell in the Acceleration Phase of Linear Speed Test. Appl. Sci. 2025, 15, 8852. [Google Scholar] [CrossRef]
- Lloyd, R.S.; Oliver, J.L.; Faigenbaum, A.D.; Howard, R.; De Ste Croix, M.B.A.; Williams, C.A.; Best, T.M.; Alvar, B.A.; Micheli, L.J.; Thomas, D.P.; et al. Long-term athletic development—Part 1: A pathway for all youth. J. Strength Cond. Res. 2015, 29, 1439–1450. [Google Scholar] [CrossRef]
- Nagahara, R.; Takai, Y.; Haramura, M.; Mizutani, M.; Matsuo, A.; Kanehisa, H.; Fukunaga, T. Age-related differences in spatiotemporal variables and ground reaction forces during sprinting in boys. Pediatr. Exerc. Sci. 2018, 30, 335–344. [Google Scholar] [CrossRef] [PubMed]
- Earp, J.E.; Newton, R.U. Advances in electronic timing systems: Considerations for selecting an appropriate timing system. J. Strength Cond. Res. 2012, 26, 1245–1248. [Google Scholar] [CrossRef] [PubMed]
- Holmberg, P.M.; Olivier, M.H.; Kelly, V.G. The Reliability of 20 m Sprint Time Using a Novel Assessment Technique. Sensors 2025, 25, 2077. [Google Scholar] [CrossRef] [PubMed]
Disclaimer/Publisher’s Note: The statements, opinions and data contained in all publications are solely those of the individual author(s) and contributor(s) and not of MDPI and/or the editor(s). MDPI and/or the editor(s) disclaim responsibility for any injury to people or property resulting from any ideas, methods, instructions or products referred to in the content. |
© 2026 by the authors. Licensee MDPI, Basel, Switzerland. This article is an open access article distributed under the terms and conditions of the Creative Commons Attribution (CC BY) license.