Abstract
The Santa Elena Peninsula has experienced local subduction earthquakes in 1901 (7.7 Mw) and 1933 (6.9 Mw), during which local ground conditions, including deposits of longshore-current sediments, paleo-lagoon or marsh, sandspit, and ancient tidal channel sediments, exhibited various coseismic deformation behaviors in Quaternary soils of inferior geotechnical quality. This study shows that geophysical profiles from seismic refraction and shear-wave velocities are correlated with stratigraphic data from sedimentary sequences obtained from slope cutting and geotechnical drilling. This database is used to create a comprehensive map to describe the lithological units of Salinas’ urban geology. The thickness of the Tertiary–Quaternary sedimentary sequences and the depth to the bedrock of the Piñon and Cayo geological formations determine the periods of sites in these stratigraphic sequences, which range from 0.3 to 1.5 s. This study provides the first geotechnical zoning map for the city of Salinas at a scale of 1:25,000, which is a technical requirement of the Ecuadorian construction standard. This geotechnical zoning information is essential for appropriate land management in Salinas and its neighboring cities, La Libertad and Santa Elena, as well as for outlining municipal restrictions on future construction.
1. Introduction
Along the South American active Pacific margin, the primary seismic sources are subduction and intraplate earthquakes, which have produced significant events with magnitudes ranging from 7.7 to 9.4 Mw [1,2,3,4,5]. Historical earthquakes in this region have caused significant coseismic environmental effects, including tectonic uplift or subsidence of coastal areas, reactivation of upper plate crustal faults, and the formation of tsunamis with run-up exceeding 2 m. These ground effects are more pronounced in saturated and unstable soils, classified as geotechnical profiles E-F (Vs30-m ≤ 180 m/s; NEC-11, 2015 [6]), which are prone to liquefaction of saturated sandy soils or cyclic deformation of clays, natural subsidence or differential settlement, seismically induced sinkholes in ancient river channels or lateral spreads on river banks, and also landslides, either coherent or disruptive, depending on the material consistency [7,8,9,10].
Although the degree of risk has been documented in developing industrial sectors and metropolitan regions, these effects are more closely linked to the topography and lithology of the ground and are tightly tied to local earthquake environmental effects. According to seismic hazard assessments, buildings and residences, public transportation, bridges, and energy infrastructure are sensitive elements exposed to coseismic ground effects [11,12,13,14], particularly if constructed on poor geotechnical soils.
Ecuadorian territorial planning law mandates that seismic microzonation studies prioritize urban areas and cantons with populations exceeding 100,000 inhabitants [6]. Despite this requirement, many coastal cities still lack comprehensive microzonation. Indeed, only the cities of Esmeraldas, Portoviejo, and Guayaquil have completed microzonation and geotechnical zoning studies, including data visualization tools for soil types, design spectra, shear-wave velocities, and site period maps [15,16,17]. With this background in mind, the relationship between the various lithological types of continental Ecuador and the geotechnical profiles of the Ecuadorian construction standard, according to their seismic shear-wave velocities [6], can be broadly stated as follows: Geotechnical profile A has Vs30-m ≥ 1500 m/s and its interaction with basalt, diorite, and andesite rocks. Profile B has 760 ≤ Vs30-m ≤ 1500 m/s and its relation to limestone, conglomerate, and sandstone. Profile C has 360 ≤ Vs30-m ≤ 760 m/s and is linked to soft rocks such as claystone, siltstone, and shale. These three profiles are linked to rocks. Profile D has 180 ≤ Vs30-m ≤ 360 m/s and its link to ancient colluvial soils. The E-F profile has Vs30-m ≤ 180 m/s and is related to alluvial sands and estuarine clays. The geological maps that are currently available for Ecuador are at a scale of 1:100,000, and numerous geomorphological features and lithological domains are not depicted in urban areas [18].
Currently, the city of Salinas lacks geological and geotechnical maps which identify areas susceptible to coseismic ground deformation, subsidence, slope instability, and surface faulting [19]. Therefore, the present study includes three primary goals: First, to describe the seismogenic structures of the Gulf of Guayaquil and the Santa Elena Province, considering thrust subduction and upper plate crustal fault scenarios, using deterministic analyses that incorporate maximum magnitudes and PGA-rock values. Second, to integrate and analyze data from Standard Penetration Tests (SPTs) and rotary percussion drillings in rocks, for subsequent correlation with geophysical surveys, including electrical tomography and measurements of average shear-wave velocity (Vs30-m). Finally, to develop a lithological and geomorphological characterization at a 1:25,000 scale following NEC-11 (2015) specifications [6], including the depth of more resistant layers of Tertiary and Cretaceous rocks, the thickness of cohesive and granular materials, and lithological contacts. Reaching these three goals allows us to provide the first geotechnical mapping of the city of Salinas and the adjacent parishes, José Luis Tamayo and Anconcito. This research establishes geological, geophysical, and geotechnical parameters that may be used in foundation designs for housing, particularly for sites susceptible to coseismic ground deformation, such as ancient tidal, paleo-lagoon and marsh, spit or sandspit, and sediment deposits from longshore currents.
2. Description of the Study Area
2.1. Seismotectonic Setting and Seismic Hazard
Located at the northwest edge of South America, the subduction zone is the main seismogenic structure for Ecuador’s continental coast. The oceanic Nazca plate, which subducts beneath the South American continental plate at a velocity of around 5.5 cm/yr, drives crustal deformation dynamics [4]. In Ecuador, this tectonic interaction divides the South American plate into four segments, which, from north to south, are (i) the Galera II segment, (ii) the Galera I segment, (iii) the Isla La Plata segment, and (iv) the Salinas segment (Figure 1). The Galera I segment exhibits the highest seismic activity, with earthquakes ranging from Mw 6.9 to 7.1 approximately every 20 years, and from Mw 7.6 to 7.9 every 70–80 years [1,20]. In contrast, the Salinas segment has the lowest recurrence rate, with significant earthquakes in January 1901 (7.7 Mw) and October 1933 (6.9 Mw). This location, frequently referred to as a “seismic gap”, has a limited likelihood of producing high-magnitude tsunamigenic earthquakes due to a sedimentary buffer channel between the two tectonic plates. Therefore, it has not experienced any moderate or high earthquakes since 1933 [21,22].
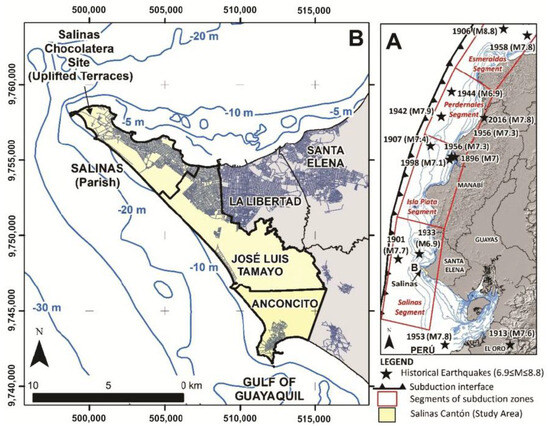
Figure 1.
Location maps and seismotectonic setting. (A) Regional view of tectonic segments and historical subduction earthquakes. (B) General map of the Salinas canton.
Nevertheless, seismic hazard analyses suggest that an 8.0 Mw earthquake could trigger tsunami waves with a local epicenter affecting Salinas within 17 to 22 min after the event [20]. If the tsunami run-up waves exceed five meters, the airport’s infrastructure might be flooded [23]. Such an earthquake might fall into the VIII–X macroseismic intensity range [19], resulting in soil liquefaction and land subsidence. To provide a better context, the tsunami hazard is complemented by studies that found deposits in La Libertad and Salinas cities, a region currently densely populated, likely displacing ancient pre-Columbian Manteña ethnic groups (500–1500 BC) [19].
The research area is the closest continental segment in Ecuador to the deep-ocean trench, located 62 km west of Salinas city. The Salinas canton, covering 97 km2 [24], comprises three parishes: Salinas (35,081 inhabitants), José Luis Tamayo (36,668 inhabitants), and Anconcito (15,052 inhabitants) (Figure 1A). This area has a dry climate, with average temperatures of 22 °C in the coldest month (August) and 28 °C in the warmest month (March), according to the Koppen climate classification [25]. Desert and subdesert tropical scrubland compose the vegetation, which stretches from the Posorja region to Punta de Santa Elena. The average annual rainfall is 125 mm, with a maximum of 60 mm recorded in March [25].
A seismotectonic map for Santa Elena Province is similar to Ecuador’s seismic risk map at a 1:1,000,000 scale, which assigns PGA-rock values between 0.50 and 0.55 g. The greatest expected magnitude for the Salinas segment is either 8.1 degrees if 100% of the fault is activated or 7.7 degrees if 60% of the fault is activated [6,19,20]. Given the deformation dynamics at comparable tectonic locations, the recurrence interval between maximum-magnitude events has not been precisely specified, but it is estimated to be between 800 and 1110 years [19]. In addition, the urban area of Salinas are vulnerable to natural phenomena, such as soil liquefaction and land subsidence, which may cause damage to buildings and residences, according to numerical models of tsunami flooding and paleoseismicity analysis for the Province of Santa Elena [23,26].
The historical earthquakes of 1901 (7.7 Mw) and 1933 (6.9 Mw) are illustrated in Figure 1 and Table 1, with their epicenters off the coast of Salinas. Their seismic source might trigger a new earthquake, causing significant damage to the current urban area and the developing industrial sectors of Santa Elena Province. Given this, extreme caution must be taken to assess the potential damage in the Salinas canton, which is one of the main tourist attractions in continental Ecuador.

Table 1.
Seismic subduction events in the Santa Elena (Guayaquil Gulf) and Manabí Provinces [20].
Due to insufficient calculations of the physical properties of rocks and soils, such as Vp, Vs30-m, and SPTs as well as a lack of data on lithological units susceptible to coseismic deformation of the ground, such as subsidence, soil liquefaction, sinkholes, among others [19,20], the canton of Salinas and its major urban areas lack basic geotechnical zoning maps.
2.2. Geological Formations in the Salinas Canton
Unfortunately, the canton of Salinas lacks an accurate and detailed geological map. As an initial illustration, the site of Cerro Chocolatera may be linked to the Cayo and Grupo Azúcar formations, among others [18,27]. The Cayo formation is identified more specifically through the lithological units in the field reconnaissance of this study. Instead of designating a unified lithological domain, the lowlands of the coastal platform are represented in various regional maps as the Azúcar Group (Paleocene) or Tablazo (Pliocene-Quaternary) formations. The parishes of Salinas and Anconcito include hilly rock massifs that are geologically related to the Tertiary sedimentary layers of the Socorro and Seca formations, which are part of the Ancón Group (Eocene age). Silty sandstones that form a matrix of andesite basaltic blocks with volcanic–clastic rock fragments (outcrops in the La Chocolatera sector, Figure 2) are part of the Cretaceous sedimentary facies. Indeed, an accretionary paleo-prism (Upper Cretaceous–Paleocene age) may be linked to this lithological unit. In the Salinas cemetery area (Paleocene age), siliceous sandstones and shales comprise the Estancia facies of the Azúcar Group [27]. The city of Salinas is encountered at its most developed areas at an elevation of 8 m above sea level (m a.s.l.). In contrast, the topographical elevations of moderate relief extend from 20 to 48 m a.s.l.
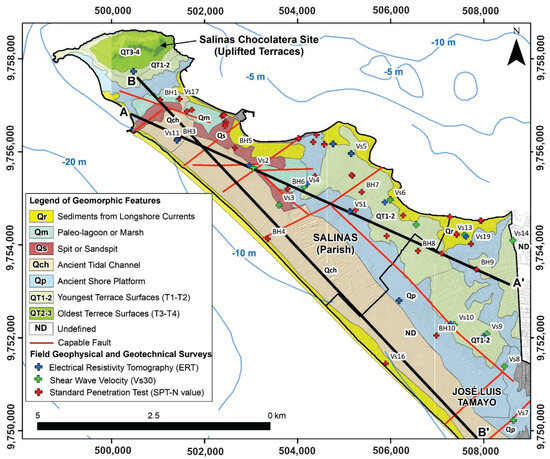
Figure 2.
Map of the canton of Salinas showing the geomorphological features and their relation to the lithological units. The spatial projection of geotechnical and geological tests is represented in profiles A-A′ and B-B′.
Furthermore, the dynamics of marine wave erosions are linked to the abrupt changes in the landscape and are visible in the Tertiary lithological units. The coastal retreat of the cliffs has been used to model the rock massifs nearest to the beach area in the parishes of José Luis Tamayo and Anconcito [28]. These massifs are composed of siltstones interbedded with sandstone layers and are prone to wind and marine erosion. Coherent landslides in the form of rockfalls and overturns, as well as (translational and rotational) disruptive landslides, are common on coastal cliffs. The paleo-cliffs in the Salinas canton are 7 to 16 m above the current sea level. These morphotectonic features indicate ancient tectonic uplift during the Pleistocene–Holocene period, which was connected with local subduction earthquakes. Indeed, the Santa Elena Peninsula, located 65 km from Salinas, is the closest continental segment to the tectonic trench [20].
In the present study, a first geological map at a scale of 1:25,000 is created using geophysical prospecting data from electrical tomography, Vp refraction seismic, Vs30-m shear-wave seismic velocities, fundamental soil periods, SPT and rotary percussion drilling methods. This map is the first product of a work to identify geomorphological units and their relationship to geotechnical zones and dominant lithology. Deposits of longshore-current sediments, paleo-lagoon or marsh, sandspits, and ancient tidal sediments are the geomorphological features linked to sedimentary deposition processes in the Pleistocene to Holocene (Figure 2). Here, greater focus is placed on the geomorphological characteristics of paleo-fluvial and tidal channels in the canton of Salinas, as many of its homes are constructed upon Holocene lithological units (Figure 3). Coseismic surface geological effects from VIIIESI-07 to XESI-07 macroseismic intensities could be recorded during a future earthquake in such poor geotechnical soil (ESI-07, Environmental Seismic Intensity scale; [19,29]).
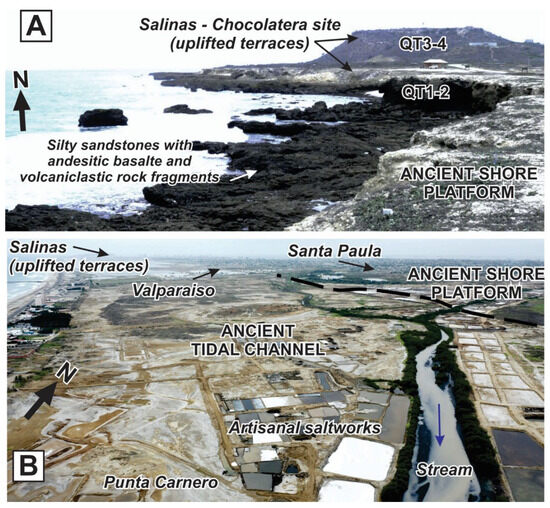
Figure 3.
Domain of geomorphological features in the Salinas canton. (A) Marine terraces raised tectonically in the Quaternary, La Chocolatera site. (B) Flood zone of ancient tidal channels located southeast of Salinas (courtesy of Johnny Chavarria).
3. Methods and Field Work
This research project followed a three-phase methodology. (i) Field research and seismic risk for Salinas. (ii) Geophysical and seismic surveys. (iii) Integrated geological, geophysical, and geotechnical zoning is presented, integrating the findings from the first two phases (Figure 4).
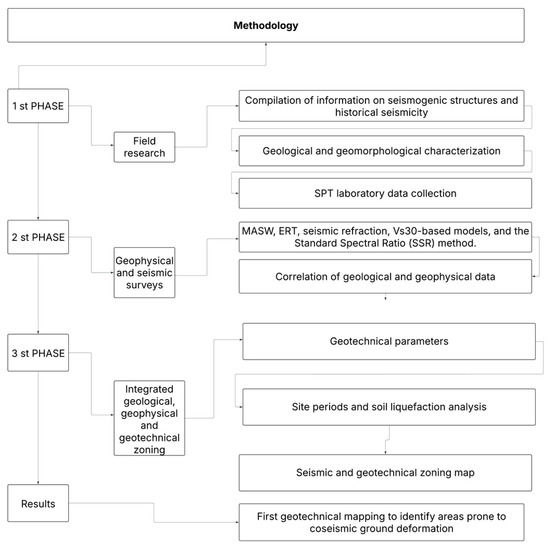
Figure 4.
Methodological flowchart illustrating the integrated geophysical and geological approach applied to geohazard assessment in Salinas.
3.1. Field Research and Seismic Risk for Salinas
The CERECIS, USGS, and Ecuadorian National Seismological Network catalogs are selected to identify past earthquakes related to the subduction zone and crustal geological faults [30,31]. Then, a typical earthquake scenario is modeled using the OpenQuake Hazard library for a deterministic seismic hazard analysis based on Cornell’s [32,33] approach. In this process, Peak Ground Acceleration (PGA) and Spectral Acceleration (SA) values at periods of 0.3 and 1.0 s are estimated. Then, the 1901 Mw 7.7 earthquake is selected for a deterministic analysis and evaluation of the seismic risk in Salinas. Furthermore, data from SPT and rotary percussion drilling in rocks enabled the delineation of lithological areas, which were then integrated with geomorphological features to create a 1:25,000 scale map of the Salinas canton.
3.2. Geophysical and Seismic Surveys
Field investigations and geophysical prospecting include: (a) seismic refraction; (b) estimation of fundamental soil periods; (c) collecting soil and rock samples; and (d) stratigraphical identification of samples in the laboratory (Figure 4). We are able to identify the contact boundaries between the hard soil and the Tertiary rock substrate in the Salinas canton by analyzing 26 Standard Penetration Tests (SPT) and rotary percussion drillings, based on data supplied by the Ingeotop soil laboratory and the municipality of Salinas [34].
The geophysical survey included lines of 1950 m to compute electrical tomography, with data acquired between April and May 2023. At specific locations, lines of 1035 m were installed on the ground to gather Vs30-m refraction seismic data. Additionally, records from 36 sites were obtained, using triaxial seismographs, to compute site periods. These geophysical tests were conducted in the José Luis Tamayo and Salinas parishes. Electrical Resistivity Tomography (ERT) is used in this study to detect electrical resistivity anomalies across different lithologies and stratigraphic contacts. The experiment injected electrical current into the ground at a maximum voltage of ±500 V and a maximum current of 2500 mA. The ABEM Terrameter LS 3000, a subsurface resistivity meter, was used. This electrical transect line has 81 electrodes spaced 4–5 m apart and can reach depths of 30–40 m [35,36].
Seismic prospecting involved the Multichannel Analysis of Surface Waves (MASW) in order to determine shear-wave velocities. Both passive (REMI, using ambient noise with 4.5 Hz geophones) and active data acquisition (refraction methods for P-wave and S-wave velocities with 10 Hz sensors) were performed. A seismic array consisting of 24 horizontal-component geophones enabled measurements along a 120 m line. The inversion of seismic data yields shear-wave velocity models (Vs30-m), with a root-mean-square (RMS) error of 2.4%. Six triaxial SmartSolo IGU-BD3C-5 seismometers were utilized to collect seismic noise at 36 sites within the Salinas canton. Each site was monitored for approximately two hours. Using this data, we apply the Standard Spectral Ratio (SSR) method [37] to estimate the site response. For each site and component, the method calculates the spectral ratio relative to the spectrum of a chosen reference site. The spectrum for each site is determined as the median of a set of spectra derived from 30 s windows, with a 50% overlap [38]. This approach helps to eliminate seismic outliers and emphasizes the standard features of the site. For the ratio calculations, the site S22 at Chocolatera is used as the reference site.
3.3. Integrated Geological, Geophysical, and Geotechnical Zoning
In the last stage, two geological cross-sections were built to determine the thickness of the Quaternary soil and its contact depth with the Tertiary rocks and the Cretaceous basement, which consists of volcanic and volcaniclastic rocks. The probability of liquefaction in longshore-current sediments, paleo-lagoon or marsh sediments, sandspit sediments, and ancient tidal channel sediments is computed using a series of equations that allow for the determination of the depth of coseismic deformation. This study aims to improve land-use planning in the Salinas canton by providing a comprehensive geotechnical map at a 1:25,000 scale and comparing it with the shear-wave velocity and period values specified by Ecuadorian construction regulations [6].
4. Results and Discussion
4.1. Seismic Hazard Study
Ground Motion Prediction Equations (GMPEs), which provide information on Peak Ground Acceleration, Spectral Acceleration, site condition, earthquake magnitude, faulting type, and epicentral distance, are used to evaluate seismic hazard in the Salinas Peninsula. A variety of commonly used equations are applied to the global ground motion data for interface and intraslab subduction earthquakes [33,39,40].
Furthermore, the OpenQuake Hazard library is used to evaluate seismic hazard values [32]. The 1901 M7.7 interslab megathrust earthquake in Salinas is used as the seismic source model for the deterministic seismic hazard analysis [20]. To better understand the PGA and SA spatial distributions at the 0.3 and 1 s periods, a 0.2 × 0.2 km area with a 5% damping ratio is chosen (Figure 5). The scenarios for a 10% probability of exceedance in 50 years, based on a 475-year return period, and for a 2% probability of exceedance in 50 years, based on a 2475-year return period, are analyzed.
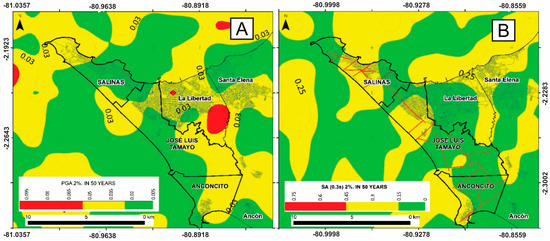
Figure 5.
Map showing the location of seismic hazards on the Peninsula de Santa Elena. The seismic source model is based on the Salinas M7.7 interslab megathrust earthquake from 1901. In terms of PGA (A) and SA (B) at 0.3 s for 10% likelihood of exceedance in 50 years on C-D boundary type profiles (317 ≤ Vs30-m ≤ 732 m/s).
In this work, we examined the seismic triggers of faults that may produce moderate-magnitude earthquakes near the Salinas canton [19]. A variety of formulae have been used in seismic hazard evaluations along Ecuador’s continental coast. The maximum seismic magnitude is calculated by comparing the fault rupture length, its kinematics, and its geometry within the region (Figure 6). The maximum magnitude (Mw) of normal, reverse, strike-slip, and shear geological faults in Ecuador is determined using the following formulas [41]:
Strike-slip or shear fault; Mw = 5.56 + 0.87 × Log(LF)
Normal fault; Mw = 6.12 + 0.47 × Log(LF)
Reverse fault; Mw = 4.11 + 1.88 × Log(LF)
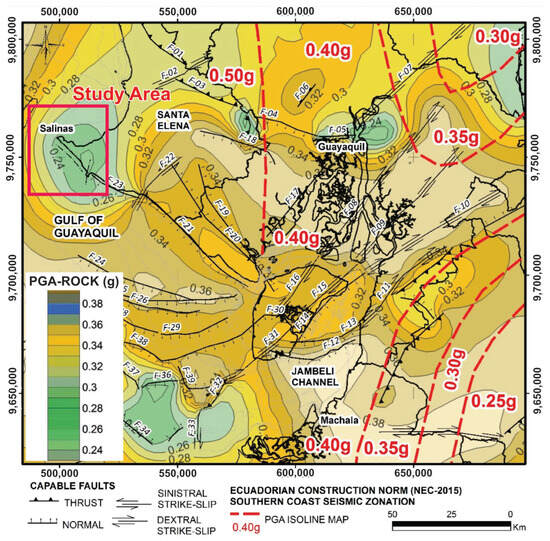
Figure 6.
Map of deterministic seismic hazards of the Peninsula de Santa Elena and Gulf of Guayaquil, using Chunga’s method [19]. The maximum PGA (Peak Ground Acceleration) was estimated from the examination of capable faults.
The length of the fault (LF) represents the capable fault’s mapped surface length in kilometers. We analyze the maximum seismic activation magnitudes for each type of earthquake-causing geological fault, taking into consideration the entire fault length. The PGA in the rock along Ecuador’s coast ranges between 0.5 and 0.55 g [6]. This gravitational acceleration range is consistent with the equation proposed by Fukushima and Tanaka [42], which is represented in the following equation:
where M is the estimated magnitude based on the length of the fault and Ztor, expressed in kilometers, is the focal distance or hypocenter from the capable fault. For faults with vertical displacements (normal and reverse, 60° dip) and horizontal displacements (strike-slip or shear, 85° dip).
PGA rock = (10(0.41M − log10(Ztor + 0.032 × 100.41M) − 0.0034 × Ztor + 1.3)/980,
The highest rock acceleration calculated for a 475-year return period by combining the previously utilized attenuation ratios is 0.48 g, which is the earthquake scenario employed in this study. For a 10% probability of exceedance in 50 yr, the calculated PGA distribution falls between 0.16 g and 0.4 g. Around 0.05 g of hazard is experienced in the urban region of Salinas. The highest PGA value is 0.095 g for the city of La Libertad, and 0.05 g for the city of Santa Elena (Figure 5). Regarding the 2% probability of exceedance in 50 years, the SA at 0.3 s period, its values exhibit spatial variation ranging from 0.15 g to 0.75 g, while at 1.0 s period, the range spans from 0.06 g to 0.206 g. According to the NEC-11 [6], the entire Province of Santa Elena is classified as Zone V, indicating the highest hazard in the Salinas Peninsula.
4.2. Geomorphological Conditions and Lithologic Units
Outcrops in slope cuttings and data from geotechnical drilling were used in the present study to precisely define the Quaternary lithological units and their connections to the main geomorphological features (see Table 2). The geomorphological features that are most susceptible to coseismic deformation are longshore-current sediments, tidal channels, intertidal estuaries, and coastal paleo-lagoons. The thickness of the sediment causes variations in the values of fundamental site periods for the ancient tidal channel deposits (Qch).For thicknesses less than 10 m, there are low periods of 0.0024 ≤ To(s) ≤ 0.0260, while for thicknesses greater than 10 m, the values rise to To = 1.59 s. The thickness of the sediments in contact with the rocky substrate is determined from the stratigraphy of geotechnical drillings supplied by the municipality of Salinas and the Ingeotop laboratory [34]. Quaternary geological faults, whose spatial distribution controls the thickness of sediments, are delineated in Figure 7 (see Table 2). Sites with high periods of To = 1.55 s are near the airport and the Ecuasal (referring to boreholes BH3 and BH4, respectively, Figure 8).
Table 2.
Relationship among lithological units and geomorphological features in the Quaternary deposits of the canton of Salinas.
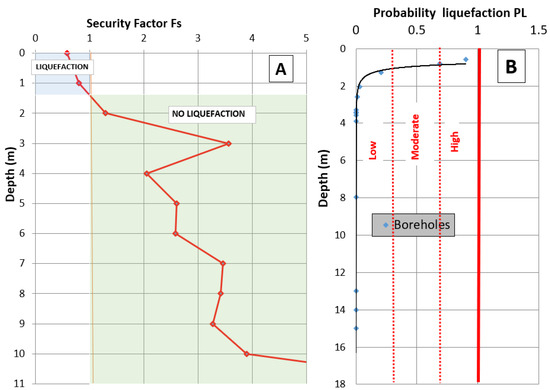
Figure 7.
(A) Results of safety factor (Fs) according to the depth of different geological units in the city of Salinas. (B) Probability liquefaction (PL) according to the depth of different geological units in the city of Salinas. The results show the average of the 10 boreholes.
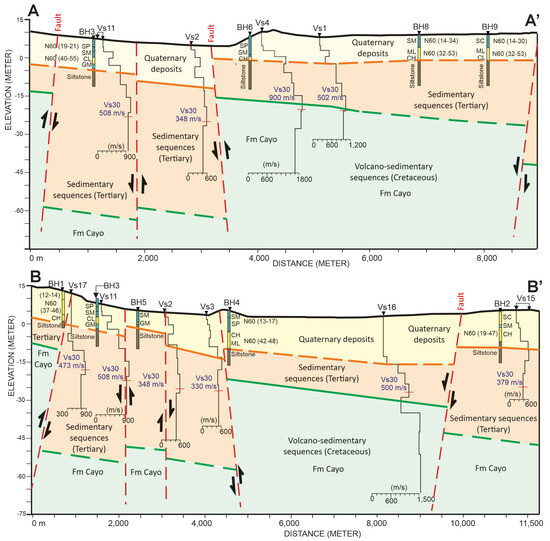
Figure 8.
Geological sections A–A′ and B–B′ with the distribution of Quaternary deposits, sedimentary sequences (Tertiary), and volcano-sedimentary sequences (Cretaceous, Cayo Formation). Boreholes (BH), Vs30-m velocities, N60 values, lithology, faults (red lines), and the top of the Cayo Formation (green line) are indicated.
One geomorphological characteristic that promotes the development of coastal paleo-lagoons is sandspits (Qs). In some places, the tidal channel deposits (Qch) and the old shore platform (Qp) are separated by these sandy units, which appear with a lower lithological distribution in the landscape. This sandspit’s thickness is around 5 m, below a more stable unit of the shore platform. Period values of To = 0.127 s are linked to both.
The wave-dominated sedimentation processes in longshore sediments are linked to the littoral drift currents. This sandy unit is 8 m thick, according to drilling at the Punta Carnero site (i.e., BH2). Above these longshore-current deposits are the cohesive subtidal and intertidal sediments of 15 m thickness. Both stratigraphic levels may have a soil period ranging from 0.33 to 0.66 s. Data on site periods up to 1.55 s are available for other sites with higher thicknesses of longshore-current sediments and poor geotechnical characteristics. The lithological conditions and their relationship to Late Pleistocene–Holocene sedimentary depositional (Quaternary) settings are depicted in Figure 8, which also enables the identification of urban areas where seismic waves would be amplified in strata of low geotechnical quality.
4.3. Liquefaction Susceptibility Analysis
The liquefaction potential of Quaternary lithological units is assessed using stratigraphic data obtained from geotechnical boreholes provided by the municipality of Salinas [34]. Data from the Standard Penetration Test (SPT) are used, along with simplified methods to calculate the factor of safety (Fs), cyclic resistance ratio (CRR), and cyclic stress ratio (CSR). Seed and Idriss [43] established these methods, which were then revised by Seed et al. [44] and Youd and Idriss [45].
Fs = CRR/CSR
Youd and Idriss [46] propose the following equation to approximate the CRR:
The number of blows N determines the resistance to penetration, which is corrected by (N1)60 using the overload pressure factor Cn, the energy correction of the hammer (ER) Ce, the borehole diameter Cb, the rod length correction factor Cr, and the correction for samplers with or without liners Cs. (Cn) was determined using Liao and Whitman’s [47], equation: Cn = (Pa/σ′v)0.5, where (Pa) is the atmospheric pressure and σ′v is the effective vertical stress. The computed N1(60) value was then corrected for “fine content” to produce an equivalent clean sand value (N1)60cs using the equations proposed by Youd [46]. The cyclic stress ratio can be expressed as follows:
where amax is the soil maximum horizontal acceleration, (g) is the acceleration caused by gravity, rd is a voltage reduction factor, σv is the total vertical stress at depth z, and σ′v is the effective vertical stress at the same depth of the stratum under study. The Liao and Whitman equation [47] was used in this investigation to account for the rd factor:
Rd = 1.0 − 0.00765 Z for Z ≤ 9.15 m
Rd = 1.174 − 0.0267 Z for 9.15 m ≤ Z ≤ 23 m
The magnitude scaling factor (MSF), which is determined by the following formula [46], was then divided by the CSR values:
MSF = (Mw/7.5)2.56
Additionally, Juang et al. [48] used their neural network analysis of field observations to create a simpler equation for CRR:
where FCI, an index of fines content (FC), is defined as follows: FCI = 1 for FC < 5%, FCI = 2 for FC < 12%, FCI = 3 for FC < 35%, and FCI = 4 for FC > 35%. Current geotechnical knowledge aligns with the use of an ordinal scale to describe the effect of fines content [49]. Figure 7 shows the safety factor (Fs) derived for the various soil strata in the city of Salinas. The liquefaction potential index (LPI) in the Salinas urban area was determined up to a depth of 4 m using the formula provided by Iwasaki [50]:
where F(z) is a function of the factor of safety against liquefaction, Fs, being F(z) = 1 − Fs for Fs < 1 and F(z) = 0 otherwise. The depth below the ground surface is in meters and represented by z. Additionally, W(z) = 10 − 0.5z.
CRR7.5 = 0.241 {exp [(0.032 + 0.004FCI) (N1)60]} − 0.182,
The severity of liquefaction-induced damages was determined by Iwasaki et al. [50] using the (LPI) values shown in Table 3.
Table 3.
Soil liquefaction probability for the city of Salinas. The values indicated for PL and Fs are the mean values of each class obtained in the present research.
As shown in Table 4, Sonmez [51] use this technique to categorize sites into low, moderate, high, and severe liquefaction susceptibility based on their LPI values. Additionally, because it is simpler to identify which strata are most affected by liquefaction, Figure 7 displays the LPI for each borehole per meter.
Table 4.
Liquefaction probability calculation according to the class proposed by Chen and Juang [49] in the city of Salinas.
According to the criteria set by Juang et al. [48] and Chen and Juang [49], strata with a safety factor less than 1.169, as determined by the conditional mean, would behave as a liquefiable layer when assessing the LPI through the boreholes examined in the city of Salinas. Soils that are not liquefiable would have values greater than this.
Based on the geotechnical data analysis and our interpretation, classes are categorized according to the calculated liquefaction probability and the safety factor, as suggested by Chen and Juang [49].
This study on liquefaction potential reveals that deposits of longshore-current sediments, paleo-lagoon or marsh, sandspit, and ancient tidal channel sediments are vulnerable to coseismic deformation up to 4 m depth.
The results of this research, which employs safety factors and liquefaction probability intervals for the soils in the city of Salinas, reveal a mean safety factor of 0.809 and a mean liquefaction probability value for class 4 of 0.683. Class 3 shows a safety factor of 1.085 and a mean PL value of 0.365. The mean PL and safety factor values for Class 2 are 0.255 and 1.218, respectively. Lastly, the mean PL and safety factor values for class 1 are 0.164 and 1.379, respectively. It is worth noting that no class 5 soils are found during examinations conducted in the urban area.
4.4. Geophysical Characterization and Site Period Map
Local geology and recent sedimentary deposition conditions have a substantial impact on ground vibrations [37]. In some cases, the site response may intensify ground motions over a given time period. Microtremors are used to evaluate site effects and produce detailed engineering maps [52,53,54]. With this goal, seismic microtremor measurements conducted at 36 locations in the Salinas canton in February 2024, primarily in the Salinas Parish and the northern part of José Luis Tamayo Parish, are used to calculate SSR. An outcrop is usually selected as a reference site, and the ratios reported here represent relative soil amplifications [55]. The best amplification contrast is observed when the location S22 is used as a reference (Figure 8). It is located at the north of the terrace QT3-4 (Figure 2). Figure 8 presents the amplification factors for location S21, situated east of the terrace QT3-4. This specific area has one of the highest amplification factors.
The maximum amplification factor for each site is selected to interpolate the data and create a map of the study area that reflects the variability of seismic site responses in Salinas. Several interpolation approaches were employed to create thickness maps of Quaternary and Tertiary sedimentary layers, as well as their depth contact with the Cretaceous basement. The results are illustrated in Figure 8.
The seismic data from the triaxial seismometer are integrated with a model of the seismic response of horizontal layers to identify soil periods, considering sedimentary deposit thickness and shear-wave velocity. The fundamental site period (To) corresponds to the first mode of vibration of a soil deposit and is a key criterion for seismic microzonation [56,57,58]. The period is calculated using the formula by Kramer [59]:
where H is the total thickness of sedimentary deposits (for less than 30 m), and Vs30-m is the average shear-wave velocity of the overlying soil. This equation is based on a model that assumes a vertically incident wave interacting with a horizontal soil layer. Because of the thinner overburden, the northern side of the Salinas canton has the lowest soil thicknesses in contact with the Pliocene marine terraces (Figure 8), with site period values ranging from 0.01 to 0.30 s. Since the thickness of these deposits is extremely modest and is typically followed by strata with high seismic velocities, the observed natural period is relatively low, and consequently, the resonance frequency is high. In contrast, the oldest tidal channel, paleo-lagoon, marsh, and longshore-current sediment layers have the thickest soils and are primarily found on the canton’s southern border. These deposits have site periods ranging from 0.60 to 1.55 s, according to the generated site period map (Figure 9).
Ts = 4H/Vs30-m
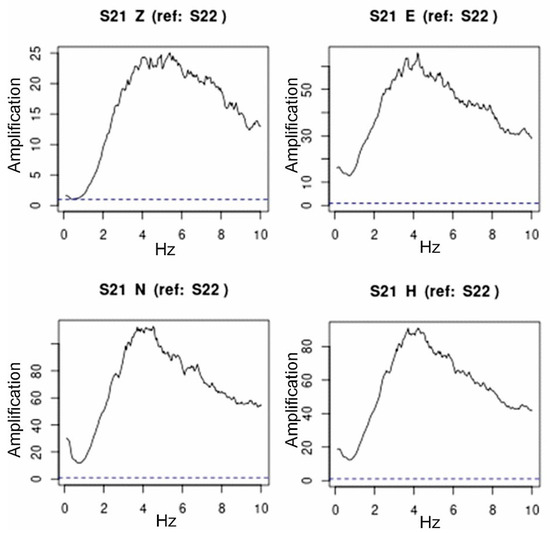
Figure 9.
SSR of vertical (Z), east (E), north (N), and horizontal (H) components at the location S21, using as reference S22.
The horizontal components are dependable between 0.5 and 10 Hz, while the vertical components are dependable between 0.2 and 20 Hz, based on the acceptable square coherence threshold of 0.8 and above. These results suggest that the data should only be utilized within the 0.5–10 Hz range (Figure 10). When the fundamental site period is near the building’s natural period, the buildings typically suffer the most damage.
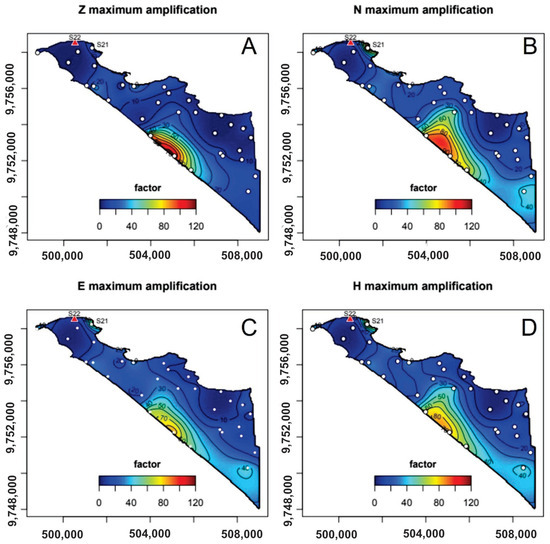
Figure 10.
Interpolations of maximum amplification factors for vertical (Z), north (N), east (E), and horizontal (H) components (A–D). The solid red triangle is at reference location S22. The location S21, whose amplification factors are presented in Figure 6, is also indicated.
The Ecuadorian construction standard also accounts for the connection between the soil period and the structure period. The mathematical relationship by Di Julio [60],
where N is the number of stories, is used to determine the fundamental periods of buildings with different levels. It can be used to calculate the natural period of the structure (T1) for steel and concrete moment-resisting framed buildings that are seven stories or less tall and have story heights of three meters or more.
T1 = 0.1 N,
To understand the relationship between the fundamental period of the soil and the dynamic amplification response of buildings, two geological sections are considered using the spatial distribution of geotechnical drilling and geophysical prospecting data. Firstly, soil periods at the northwest region of Salinas are in the range of 0.3 to 0.4 s, while the Quaternary strata thickness between 11 and 20 m (Figure 11). According to geotechnical drilling data, the first five meters of soil had SPT values of N60 < 30 and a fines content of F200 < 35%. Many of the structures have shallow foundations, are composed of beams and columns, and are flexible. Secondly, the current dynamic soil conditions suggest a construction with a slab foundation and footings on piles. The Vs30-m measured in this sector are in the range of 330 to 473 m/s.
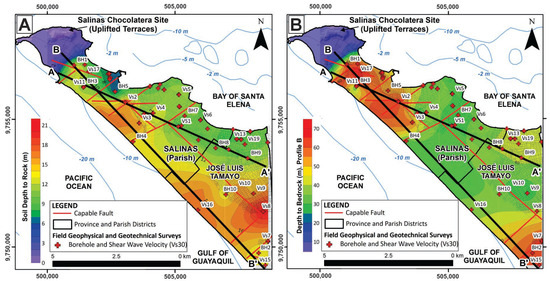
Figure 11.
Thickness map between the hard soil, Tertiary sedimentary sequences, and cretaceous bedrock (A,B).
To assess the dynamic amplifications of the structures and their correlation with the soil periods that may generate resonance, this scenario should be applied (Figure 9 and Figure 10). It is well recognized that local and global soil conditions affect the seismic response of buildings. In general, stiff structures exhibit greater damage under firm soil conditions, while flexible structures exhibit greater damage under soft soil conditions [61,62]. The use of stiff structures on soft soil and flexible structures on firm soil is therefore advised, despite the latter resulting in foundation issues.
Numerous studies have demonstrated a link between soft soils and major structural damage, especially after the Mexican earthquake in 1985, the Loma Prieta earthquake in the United States in 1989, and the Kobe earthquake in Japan in 1995 [63,64,65]. Damage is greater in hard soils for several reasons. Soft soils tend to amplify waves with the soil fundamental period and filter the frequency content of an earthquake [66,67]. Structures are particularly susceptible to resonance if their fundamental period is comparable to the soil fundamental period [68,69,70]. Structural ductility of buildings would prevent damage caused by those resonance effects. The second reason contributing to notable building damage atop soft soils is that ductility is decremented less pronouncedly than on firm soils. A third aspect is the relationship between earthquake duration and building damage, which is generally higher in soft soils, as occurred in Mexico City during its strong earthquake in 1985 [71,72].
As a result, in the case of a subduction earthquake with a magnitude of 6.9 to 7.7, low-rise buildings (less than four stories) scattered throughout the Salinas urban area may be vulnerable due to soil conditions. According to Zhao et al.’s (2006) categorization [73], the fundamental periods range from 0.1 to 0.4 s. The most competent rock substratum, as determined by the Nakamura and Vs30-m techniques, ranges between 10 and 15 m below the surface in the southern and southeast sectors of Salinas (with reference to the airport site). Possible zones of paleo-tidal channels with fundamental periods ranging from 0.66 to 1.60 s are indicated in the maps of the fundamental periods of soils (Figure 11 and Figure 12). Velocities in the range of 500 ≤ Vs30-m ≤ 900 m/s are found for Tertiary sedimentary strata. As assigned to category B geotechnical profile, the rocky substratum consists of a sandstone matrix supported by andesitic basalt fragments and volcanic tuffs, with seismic velocities ranging from 900 to 1500 m/s [6] (see Figure 13). Hereby, the degree of risk in an urban area is increased by homes situated on geomorphological features and soils prone to coseismic deformation, particularly when the fine content is less than 35%, and the SPT N60 value is less than 30 blows. Based on our data, we present new insights into geology maps of urban areas and how they relate to site stratigraphy, enabling better territorial planning for the city of Salinas.
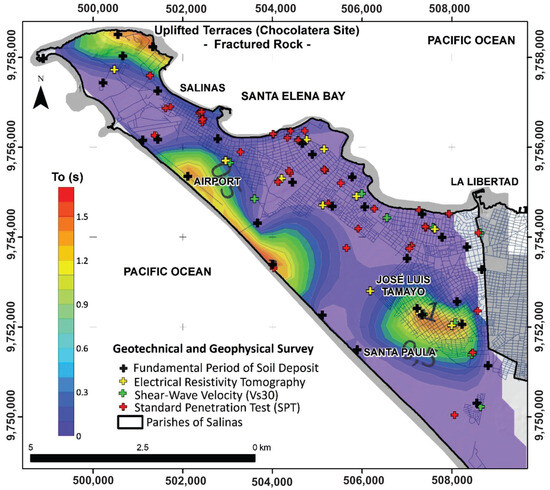
Figure 12.
Map of the distribution of fundamental soil periods interpolated with field-acquired data.
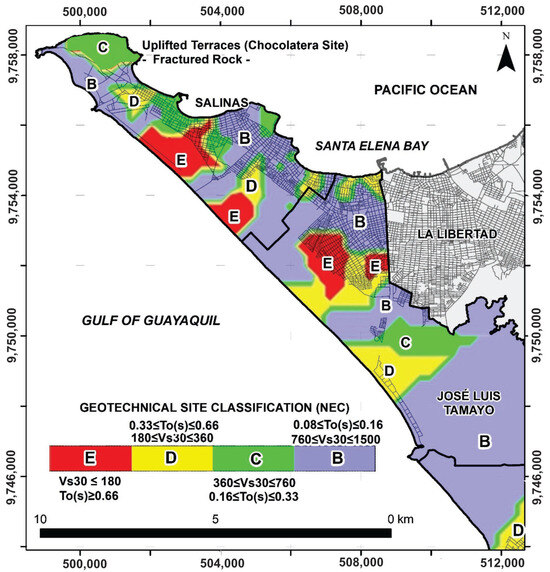
Figure 13.
Seismic site classification according to NEC-11 (2015) based on Vs30-m and fundamental site periods.
4.5. Geotechnical Mapping
The geotechnical zoning map for the Salinas canton is created using the Nearest Neighbor, Natural Neighbor, and Kriging gridding methods, which interpolate seismic velocity data and site periods. Connecting these findings to lithological units and geomorphological elements yields a more accurate cartographic representation of geotechnical profiles that adheres to Ecuadorian building standards (Figure 11). Geophysical investigations of shear-wave velocities and basic periods of soil deposits have been combined with SPT and rotary percussion drilling to identify the geotechnical zones specified in the soil and rock profiles of the NEC-11 standards [6].
They are linked to well-consolidated graywacke sandstones, some with fragments of andesitic basalts, where the type B geotechnical profiles are associated with velocities in the interval 760 ≤ Vs30-m ≤ 1500 m/s and for the fundamental site periods of sedimentary deposits in the interval 0.08 ≤ To ≤ 0.16 s.
The geotechnical profiles of type C are associated with well-fragmented volcanic tuffs and shales. They have fundamental site periods in the interval 0.16 ≤ To ≤ 0.33 s and shear-wave velocities in the interval 360 ≤ Vs30-m ≤ 760 m/s. To in this case corresponds with the high volcano-sedimentary rock outcrops at the La Chocolatera location, which are appropriately broken up.
Type D geotechnical profiles are associated with medium-dense fluvial sandstones formed in river channel deposits, somewhat fragmented volcano-sedimentary sediments, and altered graywacke sandstones. Their shear-wave velocities are in the interval 180 ≤ Vs30-m ≤ 360 m/s with fundamental site periods in the interval 0.33 ≤ To ≤ 0.66 s.
According to the Punta Carnero site, the poor geotechnical-quality soil profiles, type E, are associated with ancient tidal and sandspit deposit facies. The soil type is poorly graded sand, firm, and has SPT values of 5 to 20 in the first 5 m of depth. At 13 m, the consistency increases from dense to very dense, reaching 50 blows (N60). The CH-CL type lithology, which is firm to very rigid, makes up the paleo-lagoon and marsh deposits. The number of strikes is between 20 and 45, with a depth interval of up to 20 m. Shear-wave velocities in these lithological units with significant soil thickness are less than 180 m/s with fundamental periods larger than 0.66 s.
Two geological sections, one measuring 8.5 km and the other 11.7 km, are created using this initial map. The soil–rock contact is defined thanks to geotechnical drilling, and thicknesses of the Quaternary sequence are assigned between 12 and 22 m. Both the coastal stretch between Mar Bravo and Santa Paula, and the Chipipe area have the thickest soils. This contact is delineated using Vs30-m tests, giving seismic velocities of up to 550 m/s. Seismic velocities in the interval 600 ≤ Vs30-m ≤ 1000 are used to define Tertiary sequences.
Seismic velocities greater than 1000 m/s are present in bedrock composed of volcanic sequences of the Cayo geological formation. At the Chipipe sector, there are flexible buildings with four to five stories (period allocated between 0.2 and 0.4 s). Settlements have not been provided by those that are 20 years old and have deep foundations. Lower settlement rates are recorded for buildings with shallow foundations. With a seismic scenario like the ones recorded in 1901 (M7.7) and 1933 (M6.9), this settlement rate might rise.
5. Conclusions
The nearest continental stretch to the tectonic trench is Salinas, the most visited destination for tourists on Ecuador’s continental coast. Nearby subduction earthquakes, such as the 1901 (7.7 Mw) and 1933 (6.9 Mw) earthquakes, have the potential to cause coseismic geological effects in this region. Identifying the ground lithological units susceptible to seismic wave amplification is a crucial first step in creating accurate land-use plans, as this study identifies geomorphological features such as longshore-current sediments, tidal channels, intertidal estuaries, and coastal paleo-lagoons. Because of the sedimentological characteristics of Salinas’ Quaternary soils, liquefaction effects have safety factors with a limiting boundary of 1.08 Fs, indicating that coseismic deformation may occur in the ground at depths less than 4 m.
We use geophysical prospecting to produce the geotechnical maps, and geotechnical boreholes are used to correlate the strata. According to this assessment, the center and southern parts of the Salinas urban area, and the northern portion of José Luis Tamayo parish, are classified as geotechnical profiles, type E (Vs30-m ≤ 180 m/s). Shear-wave velocities in Quaternary sequences in contact with Tertiary rocks are in the range 330 ≤ Vs30-m ≤ 508 m/s. We identify Tertiary rocks composed of sandstones, graywackes, siltstones, and shales that cover Cretaceous volcano-sedimentary sequences. The geotechnical profile type B (760 ≤ Vs30-m ≤ 1500 m/s) refers to the specified seismic shear-wave velocities in the most competent rocky substrata. These lithological units are shown on the geological zoning map at a scale of 1:25,000.
To demonstrate the thickness of Quaternary strata, which are no thicker than 22 m, two geological sections are analyzed. The initial rock substratum consists of cohesive rocks ranging in thickness from 30 to 65 m and is interbedded with Tertiary sandstones. Beneath these sedimentary layers lies the volcanic bedrock of the Piñon and Cayo geological formations. The basic data presented in these findings are relevant to the most recent building codes that the Salinas municipality has enforced. Our findings emphasize the need for a more thorough investigation at these sites, accounting for the resonance between soils that record site periods of 0.2 to 0.4 s and structures that are two to four stories high. Therefore, it seems that two- to four-story structures, particularly those with poor foundations in the Chipipe area, are more vulnerable in the northern part of Salinas because of the coincidence of the periods that induce resonance.
Author Contributions
M.Q.-M.: Conceptualization, Data curation, Formal analysis, Investigation, Methodology, Validation, Visualization, Roles/Writing—original draft, Writing—review and editing. J.L.P.: Conceptualization, Investigation, Methodology, Resources, Supervision, Validation, Visualization, Writing—review and editing. D.B.: Conceptualization, Investigation, Methodology, Resources, Supervision, Validation, Visualization, Writing—review and editing. P.B.P.: Conceptualization, Investigation, Methodology, Resources, Supervision, Validation, Visualization, Writing—review and editing. L.M.-A.: Methodology, Resources, Supervision and Validation. M.C. and D.B.: Conceptualization, Investigation, Methodology, Resources, Supervision, Validation, Visualization, Writing—review and editing. All authors have read and agreed to the published version of the manuscript.
Funding
This research received no external funding.
Institutional Review Board Statement
Not applicable.
Informed Consent Statement
Not applicable.
Data Availability Statement
Data are contained within the article.
Acknowledgments
The authors express their gratitude to the Technical University of Manabí, Municipality of Salinas and the Secretariat of Risk Management for their technical and logistical support, especially to engineers Eduardo Ortiz, Jorge Silvestre, Dennis Córdova, María Fernanda Reyes, and Eddie Tandazo. They also thank to Engineer Andrea Hermenejildo, who granted permission to access data for geophysical information reprocessing. Additionally, they express their gratitude to the Ingeotop Soil Laboratory for sharing data from surveys conducted in the Salinas canton.
Conflicts of Interest
The authors declare no conflicts of interest.
References
- Chunga, K.; Livio, F.; Mulas, M.; Ochoa-Cornejo, F.; Besenzon, D.; Ferrario, M.F.; Michetti, A.M. Earthquake ground effects and intensity of the 16 April 2016, Mw 7.8 Pedernales Earthquake (Ecuador): Implications for the source characterization of large subduction earthquakes. Bull. Seismol. Soc. Am. 2018, 108, 3384–3397. [Google Scholar] [CrossRef]
- Gómez-Capera, A.A.; Leschiutta, I. Determining the parameters of earthquake sources in South America from macroseismic intensity data (CERESIS database). Earth Sci. Res. J. 2004, 8, 10. Available online: https://revistas.unal.edu.co/index.php/esrj/article/view/21255 (accessed on 23 June 2025).
- Barazangi, M.; Isacks, B.L. Spatial distribution of earthquakes and subduction of the Nazca plate beneath South America. Geology 1976, 4, 686–692. [Google Scholar]
- Chlieh, M.; Beauval, C.; Yepes, H.; Marinière, J.; Saillard, M.; Audin, L. Seismic and Aseismic Cycle of the Ecuador–Colombia Subduction Zone. Front. Earth Sci. 2021, 9, 701720. [Google Scholar] [CrossRef]
- Serey, A.; Piñero-Feliciangeli, L.; Sepúlveda, S.A.; Iveda, F.; Poblete, D.; Petley, I.; Murphy, W. Landslides induced by the 2010 Chile megathrust earthquake: A comprehensive inventory and correlations with geological and seismic factors. Landslides 2019, 16, 1153. [Google Scholar] [CrossRef]
- NEC-11. Norma Ecuatoriana de la Construcción. Registro Oficial No. 413 del 10 de Enero; 2015. Available online: https://www.habitatyvivienda.gob.ec/documentos-normativos-nec-norma-ecuatoriana-de-la-construccion/ (accessed on 13 July 2025).
- Palacios, P.B.; Yepes, H.; Marrero, J.M.; Ramón, P. Insights into the Site Effects and Ground Motion at Portoviejo, Ecuador, During the 2016 Mw 7.8 Jama-Pedernales Earthquake. Bull. Seismol. Soc. Am. 2025, 115, 2809–2825. [Google Scholar] [CrossRef]
- Schmitz, M.; Yepes, H.; Hernández, J.J.; Yegres, L.; Singer, A.; Rodríguez, L.M.; Marcial, D.; Sanchez-Rojas, J.; Garcia, K.; Rocabado, V.; et al. Principal results of the Portoviejo (Ecuador) seismic microzonation project and importance for seismic hazard mitigation. Nat. Hazards 2025, 121, 21891–21910. [Google Scholar] [CrossRef]
- Ortiz-Hernández, E.; Chunga, K.; Pastor, J.L.; Toulkeridis, T. Assessing Susceptibility to Soil Liquefaction Using the Standard Penetration Test (SPT)—A Case Study from the City of Portoviejo, Coastal Ecuador. Land 2022, 11, 463. [Google Scholar] [CrossRef]
- Salocchi, A.C.; Minarelli, L.; Lugli, S.; Amoroso, S.; Rollins, K.M.; Fontana, D. Liquefaction source layer for sand blows induced by the 2016 megathrust earthquake (Mw 7.8) in Ecuador (Boca de Briceño). J. S. Am. Earth Sci. 2020, 103, 102737. [Google Scholar] [CrossRef]
- Abbaszadeh-Shahri, A.; Behzadafshar, K.; Rajablou, R. Verification of a new method for evaluation of liquefaction potential analysis. Arab. J. Geosci. 2013, 6, 881–892. [Google Scholar] [CrossRef]
- Liu, G.; Zhong, Z.; Ye, T.; Meng, J.; Zhao, S.; Liu, J.; Luo, S. Impact failure and disaster processes associated with rockfalls based on three-dimensional discontinuous deformation analysis. Earth Surf. Process. Landf. 2024, 49, 3344–3366. [Google Scholar] [CrossRef]
- Zhang, X.; Luo, W.; Liu, G.; Yu, B.; Bo, W.; Zhao, P. An improved radial basis function neural network for displacement prediction of a reservoir slope. Front. Earth Sci. 2024, 12, 1389161. [Google Scholar] [CrossRef]
- Esmaeilabadi, R.; Abbaszadeh-Shahri, A.; Behzadafshar, K.; Gheirati, A.; Nosrati Nasrabadi, J. Frequency content analysis of the probable earthquake in Kopet Dagh region—Northeast of Iran. Arab. J. Geosci. 2015, 8, 3833–3844. [Google Scholar] [CrossRef]
- Geoestudios. Estudio de Microzonificación Sísmica y Geotécnica de la Ciudad de Esmeraldas Según la Norma Ecuatoriana de la Construcción 2015. Reporte Técnico 2016, Guayaquil. Available online: https://esmeraldas.gob.ec/Servicios%20de%20Direccion%20de%20Riesgos/Estudio-Microzonificaci%C3%B3n-S%C3%ADsmica.pdf (accessed on 11 January 2025).
- Vera-Grunauer, X.; Kayen, R.; Tandazo-Ortega, E.; Ramírez Calderón, J.; Vera Grunauer, J.G. Investigación y Estudio del Comportamiento Dinámico del Subsuelo y Microzonificación Sísmica de la Ciudad de Guayaquil; Estudio Geotécnico Fase I y II; M.I. Municipalidad de Guayaquil: Guayaquil, Ecuador, 2005; Available online: https://es.scribd.com/document/741093008/INVESTIGACION-Y-ESTUDIO-DEL-COMPORTAMIENTO-DINAMICO-DEL-SUBSUELO-Y-MICROZONIFICACION-SISMICA-DE-GUAYAQUIL-XAVIER-VERA (accessed on 20 May 2025).
- EPN-Tech. Estudio de Microzonificación Sísmica del Cantón Portoviejo, Segunda Fase, Producto 1: Estudio de la Microzonicación Sísmica del Ãrea Urbana de Portoviejo y sus Cabeceras Parroquiales Rurales. Reporte Técnico, EPN-Tech, Escuela Politécnica Nacional, Quito 2017. Available online: https://documentos.igepn.edu.ec/Convenio-EPN-Tech/Producto_01_DIC.pdf (accessed on 26 July 2025).
- CODIGEM. Hoja Geológica Santa Elena (Hoja 05), Escala 1:100.000; Corporación de Desarrollo e Investigación Geológico-Minera Metalúrgica: Quito, Ecuador, 1979; Available online: https://www.geoenergia.gob.ec/mapas-tematicos-11000-000 (accessed on 13 March 2025).
- Chunga, K.; Ochoa-Cornejo, F.; Mulas, M.; Toulkeridis, T.; Menéndez, E. Characterization of seismogenic crustal faults in the gulf of Guayaquil, Ecuador. Andean Geol. 2019, 46, 66–81. [Google Scholar] [CrossRef]
- UNESCO-IOC. Expert Meeting on Tsunami Sources, Hazards, Risk and Uncertainties Associated with the Colombia-Ecuador Subduction Zone, Guayaquil, Ecuador, 27–29 January 2019; Workshop Report No. 295; UNESCO: Paris, France, 2021; Available online: https://unesdoc.unesco.org/ark:/48223/pf0000376784 (accessed on 11 January 2025).
- Calahorrano, A.; Sallarès, V.; Collot, J.-Y.; Sage, F.; Ranero, C.R. Nonlinear variations of the physical properties along the southern Ecuador subduction channel: Results from depth-migrated seismic data. Earth Planet. Sci. Lett. 2008, 267, 453–467. [Google Scholar] [CrossRef]
- Sage, F.; Collot, J.-Y.; Ranero, C.R. Interplate patchiness and subduction erosion mechanisms: Evidence from depth-migrated seismic images at the central Ecuador convergent margin. Geology 2006, 34, 997–1000. [Google Scholar] [CrossRef]
- Ioualalen, M.; Monfret, T.; Bétoux, N.; Chlieh, M.; Ponce-Adams, G.; Collot, J.-Y.; Martillo-Bustamante, C.; Chunga, K.; Navarrete, E.; Montenegro, G.; et al. Tsunami mapping in the Gulf of Guayaquil, Ecuador, due to local seismicity. Mar. Geophys. Res. J. 2014, 35, 361–378. [Google Scholar] [CrossRef]
- INEC. Instituto Nacional de Estadística y Censos. Censo de Población y Vivienda del Ecuador. Available online: http://www.ecuadorencifras.gob.ec/base-de-datos-censo-de-poblacion-y-vivienda/ (accessed on 15 January 2025).
- POWER Data Access Viewer. Available online: https://power.larc.nasa.gov/data-access-viewer/ (accessed on 15 June 2025).
- Chunga, K.; Toulkeridis, T. First evidence of paleo-tsunami deposits of a major historic event in Ecuador. Sci. Tsunami Hazards J. 2014, 33, 55–69. Available online: https://api.semanticscholar.org/CorpusID:55910305 (accessed on 24 November 2025).
- Núñez del Arco Andrade, A.E. Geología del Ecuador; Cámara Ecuatoriana del Libro—Núcleo de Pichincha: Quito, Ecuador, 2003; 254p, ISBN 978-9978-43-162-7. Available online: https://books.google.com.ec/books/about/Geolog%C3%ADa_del_Ecuador.html?id=x67AtgAACAAJ&redir_esc=y (accessed on 24 November 2025).
- Espinoza-Villacís, E.; Rivas-Oviedo, J.; Martillo-Bustamante, C.; Cervantes-Bernabé, E.; Chunga, K. Coastal physical vulnerability to sea level rise for integrated coastal management in Santa Elena Bay in the active Ecuadorian margin. Nat. Hazards 2025, 121, 19071–19095. [Google Scholar] [CrossRef]
- Michetti, A.M.; Esposito, E.; Guerrieri, L.; Porfido, S.; Serva, L.; Tatevossian, R.; Vittori, E.; Audemard, F.; Azuma, T.; Clague, J.; et al. Intensity Scale ESI 2007. Mem. Descr. Carta Geol. D’Italia 2007, 74, 1–41. Available online: https://www.researchgate.net/publication/236147554_ESCALA_MEDIO-AMBIENTAL_DE_INTENSIDAD_SISMICA_ESI-_2007_INQUA_Basada_en_los_efectos_ambientales_y_geologicos_de_los_terremotos_Version_en_Espanol_2010 (accessed on 23 September 2025).
- IGEPN. Instituto Geofísico Escuela Politécnica Nacional. Available online: http://www.igepn.edu.ec/solicitud-de-datos (accessed on 22 August 2025).
- USGS. U.S. Geological Survey, Earthquake Lists, Maps, and Statistics. Available online: https://www.usgs.gov/natural-hazards/earthquake-hazards/lists-maps-and-statistics (accessed on 11 July 2025).
- Pagani, M.; Monelli, D.; Weatherill, G.; Danciu, L.; Crowley, H.; Silva, V.; Henshaw, P.; Butler, L.; Nastasi, M.; Panzeri, L.; et al. OpenQuake engine: An open hazard (and risk) software for the global earthquake model. Seismol. Res. Lett. 2014, 85, 692–702. [Google Scholar] [CrossRef]
- Cornell, C.A. Engineering seismic risk analysis. Bull. Seismol. Soc. Am. 1968, 58, 1583–1606. [Google Scholar] [CrossRef]
- Gad-Salinas. Proyecto: Contratación de Consultoría de Microzonación Sísmica en el Cantón Salinas; Reporte Técnico GAD-Salinas—SNGR; Gobierno Autónomo Descentralizado Municipal de Salinas: Salinas, Ecuador, 2025; Available online: https://www.salinas.gob.ec/images/descargas/LOTAIP/Rendicion_cuentas/2023/FASE_0/PDOT%20Alineado_compressed.pdf (accessed on 11 February 2025).
- ABEM Terrameter LS. User Manual 2016; ABEM Instrument AB: Sundbyberg, Sweden, 2018; 47p, Available online: https://www.manualslib.com/manual/1555904/Abem-Terrameter-Sas-4000.html (accessed on 24 November 2025).
- Vingoe, P. Electrical Resistivity Surveying. ABEM Geophys. Memo. 1972, 5, 1–3. Available online: https://www.scirp.org/reference/referencespapers?referenceid=1020530 (accessed on 23 May 2025).
- Panzera, F.; Romagnoli, G.; Tortorici, G.; D’Amico, S.; Rizza, M.; Catalano, S. Integrated use of ambient vibrations and geological methods for seismic microzonation. J. Appl. Geophys. 2019, 170, 103820. [Google Scholar] [CrossRef]
- D’Amico, S.; Panzera, F.; Martino, S.; Iannucci, R.; Paciello, A.; Lombardo, G.; Galea, P.; Farrugia, D. Chapter 12—Ambient noise techniques to study near-surface in particular geological conditions: A brief review. In Innovation in Near-Surface Geophysics; Persico, R., Piro, S., Linford, N., Eds.; Elsevier: Amsterdam, The Netherlands, 2019; pp. 419–460. [Google Scholar] [CrossRef]
- Abrahamson, N.; Gregor, N.; Addo, K. BC Hydro ground motion prediction equations for subduction earthquakes. Earthq. Spectra 2016, 32, 23–44. [Google Scholar] [CrossRef]
- Atkinson, G.M.; Boore, D.M. Empirical Ground-Motion Relations for Subduction-Zone Earthquakes and Their Application to Cascadia and Other Regions. Bull. Seismol. Soc. Am. 2003, 93, 1703–1729. [Google Scholar] [CrossRef]
- Wesnousky, S.G. Displacement and geometrical characteristics of earthquake surface ruptures: Issues and implications for seismic-hazard analysis and the process of earthquake rupture. Bull. Seismol. Soc. Am. 2008, 98, 1609–1632. [Google Scholar] [CrossRef]
- Fukushima, Y.; Tanaka, T. A new attenuation relation for peak horizontal acceleration of strong earthquake ground motion in Japan. Bull. Seismol. Soc. Am. 1990, 80, 757–783. Available online: https://gbank.gsj.jp/ld/resource/geolis/199000572 (accessed on 27 August 2025).
- Seed, H.B.; Idriss, I.M. Simplified Procedure for Evaluating Soil Liquefaction Potential. J. Soil Mech. Found. Div. 1971, 97, 1249–1273. [Google Scholar] [CrossRef]
- Seed, H.B.; Tokimatsu, K.; Harder, L.F.; Chung, R.M. Influence of SPT Procedures in Soil Liquefaction Resistance Evaluations. J. Geotech. Eng. 1985, 111, 1425–1445. [Google Scholar] [CrossRef]
- Youd, T.L.; Idriss, I.M. Liquefaction resistance of soils: Summary report from the 1996 NCEER and 1998 NCEER/NSFworkshops on evaluation of liquefaction resistance of soils. J. Geotech. Geoenviron. Eng. 2001, 127, 297–313. Available online: https://www.ce.memphis.edu/7137/pdfs/Reference2/Youd%20ad%20Idriss.pdf (accessed on 24 November 2025).
- Youd, T.L.; Idriss, I.M. Proceeding of the NCEER Workshop on Evaluation of Liquefaction Resistance of Soils; U.S. National Center for Earthquaake Engineering Research (NCEER): Buffalo, NY, USA, 1997; 276p, Available online: https://pesquisa.bvsalud.org/portal/resource/pt/des-10504 (accessed on 20 October 2025).
- Liao, S.; Whitman, R. Overburden correction factor for SPT in sand. J. Geotech. Eng. 1986, 112, 373–377. [Google Scholar] [CrossRef]
- Juang, C.H.; Chen, C.J.; Jiang, T.; Andrus, R.D. Risk-based liquefaction potential evaluation using standard penetration tests. Can. Geotech. J. 2000, 37, 1195–1208. Available online: https://articles.researchsolutions.com/risk-based-liquefaction-potential-evaluation-using-standard-penetration-tests/doi/10.1139/t00-064 (accessed on 22 November 2025). [CrossRef]
- Chen, C.J.; Juang, C.H. Calibration of SPT-and CPT-based liquefaction evaluation methods. In Proceedings of Sessions of Geo-Denver 2000—Innovations and Applications in Geotechnical Site Characterization; Mayne, P.W., Hryciw, R., Eds.; Geotechnical Special Publication; ASCE: Reston, VA, USA, 2000; Volume 97, pp. 49–64. Available online: https://scholars.ncu.edu.tw/en/publications/calibration-of-spt-and-cpt-based-liquefaction-evaluation-methods/ (accessed on 13 May 2025).
- Iwasaki, T.; Tokida, K.I.; Tatsuoka, F.; Watanabe, S.; Yasuda, S.; Sato, H. Microzonation for soil liquefaction potential using simplified methods. In Proceedings of the 3rd International Conference on Microzonation, Seattle, WA, USA, 28 June–1 July 1982; Volume 3, pp. 1310–1330. Available online: https://www.scirp.org/reference/referencespapers?referenceid=3540445 (accessed on 3 June 2025).
- Sonmez, H. Modification of the liquefaction potential index and liquefaction susceptibility mapping for a liquefaction-prone area (Inegol, Turkey). Environ. Geol. 2003, 44, 862–871. [Google Scholar] [CrossRef]
- Oliveira, L.; Carrilho-Gomes, R.; Teves-Costa, P. Contribution to the seismic microzonation of Lisbon based on the integration of geological, geophysical, and geotechnical data. Soil Dyn. Earthq. Eng. 2023, 171, 107965. [Google Scholar] [CrossRef]
- Sgarlato, G.; Lombardo, G.; Rigano, R. Evaluation of seismic site response nearby underground cavities using earthquake and ambient noise recordings: A case study in Catania area, Italy. Eng. Geol. 2011, 122, 281–291. [Google Scholar] [CrossRef]
- Uma-Maheswari, R.; Boominathan, A.; Dodagoudar, G.R. Seismic site classification and site period mapping of Chennai City using geophysical and geotechnical data. J. Appl. Geophys. 2010, 72, 152–168. [Google Scholar] [CrossRef]
- Borcherdt, R.D. Effects of Local Geology on Ground Motion near San Francisco Bay. Bull. Seismol. Soc. Am. 1970, 60, 29–61. Available online: https://pubs.usgs.gov/publication/70234243 (accessed on 11 June 2025).
- Gazetas, G. Vibrational characteristics of soil deposits with variable wave velocity. Int. J. Numer. Anal. Methods Geomech. 1982, 6, 1–20. [Google Scholar] [CrossRef]
- Fernández-Heredia, A.I.; Huerta-López, C.I.; Castro-Escamilla, R.R.; Romo-Jones, J.M. Soil damping and site dominant vibration period determination, by means of random decrement method and its relationship with the site-specific spectral decay parameter kappa. Soil Dyn. Earthq. Eng. 2012, 43, 237–246. [Google Scholar] [CrossRef]
- Oliveira, C.S.; Navarro, M. Fundamental periods of vibration of RC buildings in Portugal from in-situ experimental and numerical techniques. Bull. Earthq. Eng. 2010, 8, 609–642. [Google Scholar] [CrossRef]
- Kramer, S.L. Geotechnical Earthquake Engineering; Civil Engineering and Engineering Mechanics; Prentice Hall: Upper Saddle River, NJ, USA, 1996; Volume 794, Available online: https://books.google.com.ec/books/about/Geotechnical_Earthquake_Engineering.html?id=ws5HtVum3g8C&redir_esc=y (accessed on 24 November 2025).
- Di Julio, R.M. Linear static seismic lateral force procedures. In The Seismic Design Handbook, 2nd ed.; Naiem, F., Ed.; Kluwer Academic Publishers: Boston, MA, USA, 2001; pp. 247–274. Available online: https://link.springer.com/chapter/10.1007/978-1-4615-1693-4_5 (accessed on 24 November 2025).
- Seed, H.B.; Idriss, I.M. Ground Motions and Soil Liquefaction during Earthquakes; Earthquake Engineering Research Institute: Berkeley, CA, USA, 1982; Available online: https://searchworks.stanford.edu/view/1573032 (accessed on 24 November 2025).
- Abbaszadeh-Shahri, A.; Esfandiyari, B.; Hamzeloo, H. Evaluation of a nonlinear seismic geotechnical site response analysis method subjected to earthquake vibrations (case study: Kerman Province, Iran). Arab. J. Geosci. 2011, 4, 1103–1116. [Google Scholar] [CrossRef]
- Beck, J.L.; Hall, J.F. Factors contributing to the catastrophe in Mexico City during the earthquake of September 19, 1985. Geophys. Res. Lett. 1986, 13, 593–596. [Google Scholar] [CrossRef]
- Dietz, L.D.; Ellsworth, W.L. The October 17, 1989, Loma Prieta, California, earthquake and its aftershocks: Geometry of the sequence from high-resolution locations. Geophys. Res. Lett. 2010, 17, 1417–1420. [Google Scholar] [CrossRef]
- Wald, D.J. Slip history of the 1995 Kobe, Japan, earthquake determined from strong motion, teleseismic, and geodetic data. J. Phys. Earth 1996, 44, 489–503. [Google Scholar] [CrossRef]
- Lo, W.-C.; Yeh, C.-L.; Jan, C.-D. Effect of soil texture and excitation frequency on the propagation and attenuation of acoustic waves at saturated conditions. J. Hydrol. 2008, 357, 270–281. [Google Scholar] [CrossRef]
- Scanlan, R.H. Seismic wave effects on soil-structure interaction. Earthq. Eng. Struct. Dyn. 1976, 4, 379–388. [Google Scholar] [CrossRef]
- Güllü, H.; Pala, M. On the Resonance Effect by Dynamic Soil-Structure Interaction: A Revelation Study. Nat. Hazards 2014, 72, 827–847. [Google Scholar] [CrossRef]
- Gosar, A. Site effects and soil-structure resonance study in the Kobarid basin (NW Slovenia) using microtremors. Nat. Hazards Earth Syst. Sci. 2010, 10, 761–772. [Google Scholar] [CrossRef]
- Khalil, L.; Sadek, M.; Shahrour, I. Influence of the soil–structure interaction on the fundamental period of buildings. Earthq. Eng. Struct. Dyn. 2007, 36, 2445–2453. [Google Scholar] [CrossRef]
- Bard, P.Y.; Campillo, M.; Chavez-Garcia, F.J.; Sanchez-Sesma, F. The Mexico earthquake of September 19, 1985—A theoretical investigation of large-and small-scale amplification effects in the Mexico City Valley. Earthq. Spectra 1988, 4, 609–633. [Google Scholar] [CrossRef]
- Campillo, M.; Gariel, J.C.; Aki, K.; Sanchez-Sesma, F.J. Destructive strong ground motion in Mexico City: Source, path, and site effects during great 1985 Michoacán earthquake. Bull. Seismol. Soc. Am. 1989, 79, 1718–1735. [Google Scholar] [CrossRef]
- Zhao, J.X.; Zhang, J.; Asano, A.; Ohno, Y.; Oouchi, T.; Takahashi, T.; Ogawa, H.; Irikura, K.; Thio, H.K.; Somerville, P.G. Attenuation relations of strong ground motion in Japan using site classification based on predominant period. Bull. Seismol. Soc. Am. 2006, 96, 898–913. [Google Scholar] [CrossRef]


Disclaimer/Publisher’s Note: The statements, opinions and data contained in all publications are solely those of the individual author(s) and contributor(s) and not of MDPI and/or the editor(s). MDPI and/or the editor(s) disclaim responsibility for any injury to people or property resulting from any ideas, methods, instructions or products referred to in the content. |
© 2026 by the authors. Licensee MDPI, Basel, Switzerland. This article is an open access article distributed under the terms and conditions of the Creative Commons Attribution (CC BY) license.