Abstract
Diabetic retinopathy (DR) is a major cause of preventable vision loss, and its early detection is essential for timely clinical intervention. However, existing deep learning-based DR recognition methods still face two fundamental challenges: substantial lesion-scale variability and significant background noise in retinal fundus images. To address these issues, we propose a lightweight framework named Multi-Scale Soft-Thresholding Attention Network (MSA-Net). The model integrates three components: (1) parallel multi-scale convolutional branches to capture lesions of different spatial sizes; (2) a soft-thresholding attention module to suppress noise-dominated responses; and (3) hierarchical feature fusion to enhance cross-layer representation consistency. A squeeze-and-excitation module is further incorporated for channel recalibration. On the APTOS 2019 dataset, MSA-Net achieves 97.54% accuracy and 0.991 AUC-ROC for binary DR recognition. We further evaluate five-class DR grading on APTOS2019 with 5-fold stratified cross-validation, achieving 82.71 ± 1.25% accuracy and 0.8937 ± 0.0142 QWK, indicating stable performance for ordinal severity classification. With only 4.54 M parameters, MSA-Net remains lightweight and suitable for deployment in resource-constrained DR screening environments.
1. Introduction
Diabetic retinopathy (DR) is one of the most common microvascular complications of diabetes and a leading cause of preventable blindness worldwide [1]. Large-scale epidemiological studies have shown that approximately one-third of individuals with diabetes develop some form of DR during their lifetime, underscoring its high prevalence and substantial global disease burden [2,3]. With the worldwide prevalence of diabetes continuing to rise, the number of people affected by or at risk for DR is projected to increase significantly in the coming decades [4]. Prior research has demonstrated that, without timely treatment, DR can lead to severe and irreversible vision loss, highlighting the importance of early detection and intervention. However, conventional DR screening workflows still rely heavily on manual interpretation of fundus images, which is time-consuming, susceptible to inter-observer variability, and difficult to scale for large populations [5]. In recent years, deep learning-based approaches have substantially advanced automated DR detection [6], yet critical challenges persist due to lesion variability, image noise, and data imbalance.
One major difficulty lies in the large variability of lesion sizes and the presence of complex background noise in retinal fundus images [7,8]. DR lesions range from minute microaneurysms to extensive hemorrhages and exudates, producing substantial cross-scale diversity. Existing multi-scale feature extraction strategies, such as fixed-size convolutional kernels, feature pyramid networks, and other hierarchical designs [9,10,11], can capture certain scale variations but are constrained by their fixed receptive fields or layer-wise architectural limitations. As a result, they often struggle to model both global pathological structures and subtle local lesions, reducing performance in the presence of small-scale abnormalities and widespread pathological changes.
Another major challenge stems from imaging artifacts and background noise, including uneven illumination, color variation, vessel shadows, and reflections. These factors frequently cause models to focus on non-lesion regions [12,13,14]. Although channel and spatial attention mechanisms such as SE blocks [15,16] enhance salient features, they may amplify noise under low-quality imaging conditions. Transformer architectures further improve long-range dependency modeling [7,17], yet their robustness to noise remains limited, and they lack explicit suppression of low-confidence responses.
In recent years, a number of studies have explored five-class DR severity grading on APTOS2019 and reported representative results under different experimental settings. For instance, Farag et al. reported an accuracy of about 82% with a QWK of 0.888 for five-class grading [18]. Tariq et al. proposed a Siamese Neural Network strategy for small-dataset challenges and reported about 81% accuracy with a QWK of 0.89 on APTOS2019 [19]. Pakdelmoez et al. investigated conditional StyleGAN-based synthesis and reported 83.33% accuracy with a quadratic kappa score of 87.64% for APTOS2019 grading [20]. Since evaluation protocols may differ across studies, these results are cited to contextualize progress rather than to form a strict head-to-head comparison. Overall, the literature suggests that stable DR grading remains practically challenging when multi-scale lesion heterogeneity, background noise, and class imbalance co-exist, motivating models that improve feature robustness while keeping a compact model footprint for deployment.
To address the above limitations of existing DR recognition models, we propose the Multi-Scale Soft-Thresholding Attention Network (MSA-Net), which integrates several complementary mechanisms to enhance robustness against lesion-scale variability and background noise. First, the model adopts parallel convolutional branches to capture small-, medium-, and large-scale lesion patterns within a unified architecture, allowing the network to extract spatial details across diverse receptive fields [14,15]. This design enables more effective modeling of both subtle microaneurysms and extensive hemorrhagic regions. In addition, an adaptive shrinkage mechanism inspired by classical soft-thresholding theory [21,22] is incorporated to dynamically suppress low-confidence activations that frequently arise from illumination artifacts, vessel shadows, and other noise sources. This module helps the network retain discriminative lesion information while reducing noise-induced feature responses. Furthermore, a hierarchical feature fusion strategy merges low-, mid-, and high-level representations through cross-layer interactions and channel recalibration [23,24,25], improving information consistency and mitigating the loss of fine structural details in deeper layers. By combining these components, MSA-Net provides a more coherent multi-scale representation and strengthens its resilience to challenging retinal image conditions.
In summary, by incorporating parallel multi-scale convolution, adaptive shrinkage attention, and efficient hierarchical feature fusion, MSA-Net effectively alleviates the limitations of existing DR recognition models. These combined innovations allow the model to better handle lesion diversity and noisy imaging conditions, thereby improving robustness, stability, and overall recognition performance for automated DR diagnosis.
2. Proposed Method
The proposed MSA-Net primarily relies on three innovations: multi-scale feature extraction, adaptive shrinkage attention, and hierarchical feature fusion. They are designed to enhance the ability of the model to capture the features of diabetic retinopathy and improve its robustness.
2.1. Multi-Scale Feature Extraction
Lesions in diabetic retinopathy exhibit substantial scale variability, ranging from tiny microaneurysms (5–15 pixels) and medium-sized hard exudates (15–40 pixels) to large hemorrhages or cotton-wool spots exceeding 50–120 pixels. This wide spectrum of lesion sizes makes it challenging for traditional single-scale convolution kernels to simultaneously capture fine local structures and large pathological patterns.
To address this limitation, the proposed MSA-Net incorporates a multi-scale feature extraction module composed of three parallel convolution branches with different kernel sizes. This design enables the network to capture spatial representations of lesions at multiple scales in a single forward pass, improving robustness against lesion heterogeneity.
In this module, the convolution branch is responsible for extracting fine-grained textures such as microaneurysms, the branch captures intermediate-scale contrast variations between lesions and surrounding tissues, and the branch focuses on broader structural abnormalities such as hemorrhage regions. The feature extraction process for each branch is formulated as:
where the activation function is defined as:
By integrating convolutional responses from different receptive fields, MSA-Net effectively captures lesion-related cues at diverse spatial granularities. These multi-scale features provide a rich and complementary representation, forming a strong foundation for the subsequent adaptive shrinkage attention mechanism and hierarchical feature fusion within the network.
2.2. Adaptive Shrinkage
Soft-thresholding techniques have been widely used for noise suppression in image processing [17,22]. Medical images often contain significant background noise, such as retinal blood vessels and pigmentation, which traditional CNNs struggle to effectively remove. To address this issue, MSA-Net incorporates an Adaptive Shrinkage Mechanism, dynamically suppressing low-confidence features while enhancing key lesion regions.
Specifically, given an input feature f, the global gating value T is computed as:
where denotes global average pooling, and refer to fully connected layers, and represents the sigmoid activation function, normalizing the gating value to the range :
This mapping converts the feature activation into a probability space, controlling the activation level across different channels. The soft-thresholding operation for feature selection is defined as:
This mechanism ensures that low-confidence features (i.e., noise) are suppressed, whereas high-confidence features (i.e., lesion information) are preserved. As illustrated in Figure 1, the soft-thresholding mechanism dynamically computes a gating threshold to suppress low-confidence signals. FC Layer denotes the Fully Connected Layer.
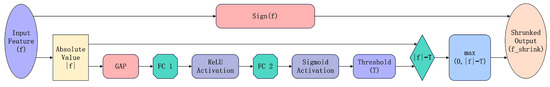
Figure 1.
Adaptive shrinkage mechanism based on soft-thresholding.
2.3. Channel Attention
To further improve the model’s focus on lesion regions, we introduced the Channel Attention Mechanism (Squeeze-and-Excitation) [21], which adaptively adjusts the importance of different channels to enhance the representation of critical features. Unlike conventional convolutional networks that mainly perform optimization in the spatial dimension, the SE module performs optimization in the channel dimension. As shown in Figure 2, the input feature map is first mapped to a channel descriptor by a transformation , which retains global channel information required for recalibration. This mechanism makes it possible to extract channel-specific characteristics with only a small number of additional parameters, thereby improving recognition performance.
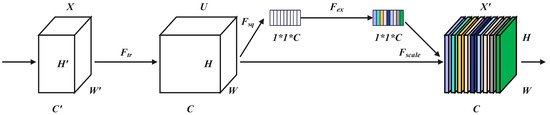
Figure 2.
Structure of the Squeeze-and-Excitation module.
The core process of the SE module includes Squeeze (compression), Excitation (activation), and Recalibration (weighted feature calculation). Global Average Pooling (GAP) is applied to extract global channel-wise features:
where H and W denote the height and width of the feature map, respectively.
The channel weights are computed as follows:
where the sigmoid function normalizes the weights, ensuring they remain within the range . The final weighted feature map is obtained as follows:
By using this module, the model increases the significance of lesion region features and limits background interference before hierarchical feature fusion, allowing properly calibrated channel-wise information to be preserved during subsequent multi-layer feature fusion. This ultimately improves recognition accuracy.
Figure 3 illustrates the effect of reweighting through the SE module, where global average pooling is used to extract global descriptors for adaptive channel calibration. Here, C represents the number of input channels, while denotes the reduced number of channels after applying dimensionality reduction with a reduction ratio r.
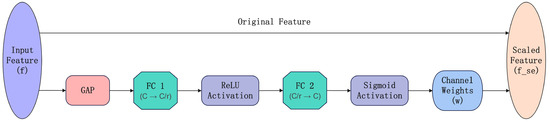
Figure 3.
Workflow of the Squeeze-and-Excitation channel attention mechanism.
2.4. Hierarchical Feature Fusion
While the Squeeze-and-Excitation module enhances critical features at the channel level, our proposed hierarchical feature fusion ensures that these enriched features are effectively integrated across multiple network layers. To enhance global information modeling, we introduce residual connections [8] and cross-layer feature fusion [15] between different network layers.
Let the output of the l-th layer be denoted by . The cross-layer feature fusion is performed as follows:
In this formula, denotes the convolutional output of the current layer, while and represent the skip-connection features from the previous two layers.
This multi-level feature fusion strategy promotes the interaction between features at different scales, thereby enhancing the model’s generalization ability while reducing information loss and mitigating gradient vanishing problems in deep CNN architectures.
2.5. Classification Module
After the hierarchical feature fusion, the final output feature F is subjected to global average pooling (GAP) and subsequently mapped to a two-class classification via a fully connected layer:
where denotes the weight matrix of the Fully Connected layer used for classification.
The Softmax function computes the probability distribution, normalizing the output into probability values for classification:
2.6. Overall Architecture
The overall architecture of MSA-Net is shown in Figure 4. The network contains three parallel convolutional branches with different kernel sizes to capture lesion structures at multiple spatial scales. Each branch follows the same sequence of convolution, batch normalization, ReLU activation, and max-pooling, allowing all branches to expand their receptive fields while maintaining comparable processing depth. This design enables the extraction of complementary multi-scale representations within a unified framework.
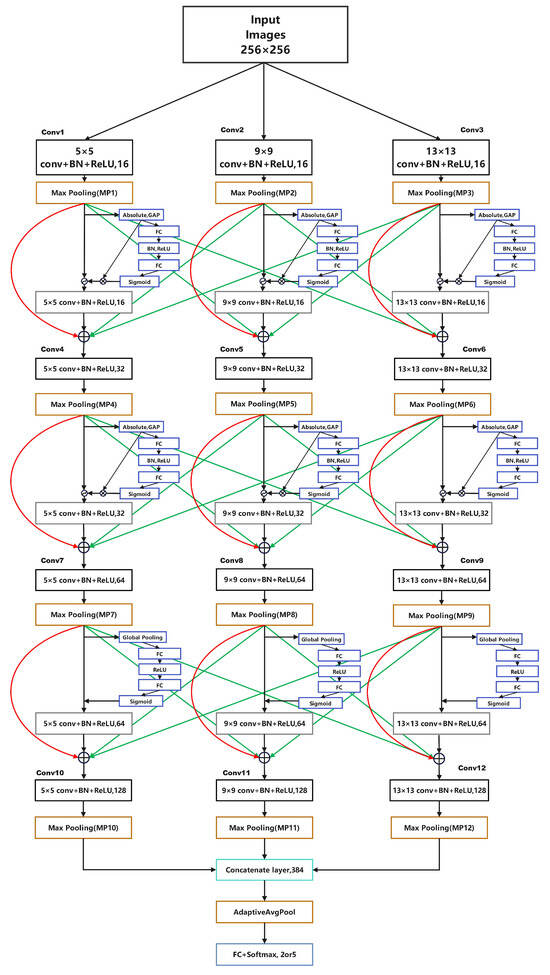
Figure 4.
Overall structure of MSA-Net.
After multi-scale processing, an adaptive shrinkage module is applied to suppress low-confidence and noise-dominated responses caused by illumination variation, reflections, and vessel shadows. The three branch outputs are then concatenated along the channel dimension to form a unified representation. A squeeze-and-excitation (SE) module further recalibrates channel importance, enhancing discriminative lesion features while reducing background interference.
To improve representational consistency, a hierarchical feature fusion mechanism integrates information across layers through skip connections, combining shallow textures with deeper semantic cues. Finally, the fused feature map is passed through global average pooling and a fully connected classifier to generate the prediction. Overall, the architecture combines multi-scale convolution, adaptive shrinkage, and cross-layer fusion to achieve a lightweight yet robust model for DR recognition.
3. Experiments
3.1. Dataset
In this study, the publicly available APTOS 2019 color fundus image dataset from the Kaggle platform was employed. The dataset consists of 3662 professionally annotated retinal images with resolutions ranging from to , originally labeled into five diabetic retinopathy (DR) severity levels: Normal, Mild, Moderate, Severe, and Proliferative DR. To simplify the classification task and focus on DR presence, the original five-class problem was reformulated as a binary classification task, in which Normal samples were assigned to the Normal class, while samples corresponding to mild to proliferative DR were merged into a single DR class.
The dataset is split into training, validation, and test sets using a 60%–20%–20% split, as shown in Table 1.

Table 1.
Dataset Partitioning of APTOS 2019.
To improve generalization and alleviate mild class imbalance, we applied stochastic data augmentation during training. Each image was resized to , and augmentations were sampled probabilistically (not as a fixed sequential pipeline): horizontal flip (), vertical flip (), random rotation within (), and color jitter (). Finally, images were converted to tensors and normalized using ImageNet statistics. No augmentation was used for validation/testing; only resizing and normalization were applied.
To assess the performance of MSA-Net and the baseline models, this study adopts a set of standard metrics commonly used in binary medical image recognition. Accuracy reflects the proportion of correctly predicted samples among all test images. Precision measures how many predicted DR cases are true DR, while Recall evaluates the model’s ability to correctly identify all DR cases. The F1-score provides a balanced indicator by combining Precision and Recall. AUC-ROC assesses the model’s discriminative ability across all decision thresholds, and PR-AUC offers a more informative evaluation under potential class imbalance. Inference Time (seconds per image) is reported to measure computational efficiency during deployment. Additionally, confusion matrices are used to present True Positives (TP), True Negatives (TN), False Positives (FP), and False Negatives (FN), offering a detailed view of recognition behavior.
Together, these metrics provide a comprehensive assessment of accuracy, robustness, sensitivity, reliability, and efficiency for DR screening models.
3.2. Training and Evaluation Pipeline
To improve reproducibility and clearly summarize the end-to-end experimental procedure, we provide a unified training and evaluation pipeline for diabetic retinopathy (DR) recognition using MSA-Net. The pipeline starts from resized fundus images () with training-only stochastic augmentations, and supports both binary (Normal vs. DR) and five-class (grades 0–4) settings. For the binary task, the dataset is split into training/validation/test subsets, while for the five-class task, a stratified k-fold cross-validation protocol is adopted to reduce evaluation variance. Within each run (or fold), MSA-Net performs multi-scale feature extraction, adaptive soft-thresholding shrinkage, SE-based channel attention, and hierarchical feature fusion, followed by a Softmax classifier. Model parameters are optimized using cross-entropy loss and backpropagation, and the best checkpoint is selected based on validation performance (e.g., AUC for binary or QWK for five-class). The overall workflow is summarized in Algorithm 1.
3.3. Kernel Size Selection Experiment
Before performing the ablation studies, we conducted a kernel-size search to determine an appropriate multi-scale receptive field configuration for MSA-Net. Since DR lesions show substantial variation in size, the choice of kernel sizes directly affects the model’s ability to capture both local details and large structural abnormalities. To this end, we evaluated four kernel triplets: (3, 5, 7), (5, 9, 13), (9, 13, 17), and (11, 15, 19), while keeping the rest of the architecture unchanged.
As summarized in Table 2, the (5, 9, 13) configuration achieved the highest validation accuracy, outperforming both smaller and larger receptive field settings. Smaller kernels lack sufficient contextual coverage, whereas excessively large kernels introduce redundant background information and lead to over-smoothing. Therefore, we adopt (5, 9, 13) as the default multi-scale configuration in MSA-Net for all subsequent experiments.
Table 2.
Kernel size selection for multi-scale convolution.
3.4. Experiment Results
3.4.1. Comparison Objects
To validate the effectiveness of the proposed MSA-Net, we conduct comparative experiments with models of similar parameter scales:
- ResNet18: A classic CNN architecture with strong feature extraction capabilities.
- EfficientNet-B2: A lightweight and efficient CNN widely applied in medical image recognition.
- SwinV2-Tiny: A Transformer-based model utilizing a window attention mechanism to capture global features.
3.4.2. Ablation Study of MSA-Net Components
To quantify the effect of each component in MSA-Net under a controlled setting, we perform an ablation study on the APTOS 2019 binary task. To avoid biased comparisons caused by different kernel configurations, we define the multi-scale-only variant (ms_only) as the ablation baseline, because it uses the same kernel set as all subsequent variants in the ablation chain. The single-scale model is reported only as a single-scale reference to highlight the performance gain introduced by the multi-scale design, rather than being used as the baseline of the progressive ablation.
| Algorithm 1: MSA-Net Training and Evaluation for Binary/Five-Class DR |
Input: Fundus dataset (APTOS2019), task , image size , batch size B, max epochs E, CV folds k (only for FiveClass), augment probs Output: Trained model(s), performance metrics (Binary: Acc/Prec/Rec/F1/AUC; FiveClass: Acc/QWK/Macro-F1)
End |
As reported in Table 3, the single-scale reference reaches an accuracy of 94.62%. Replacing it with multi-scale convolution (ms_only) improves the accuracy to 95.85%, indicating that diverse receptive fields better accommodate lesion-scale variability in DR images. Building on this kernel-consistent baseline, adding the shrinkage-based denoising module (ms_shrink) further increases accuracy to 95.99%, suggesting improved robustness by suppressing low-confidence activations. Incorporating SE channel attention (ms_shrink_se) yields an accuracy of 96.40%, implying that channel-wise recalibration enhances lesion-related responses. Finally, introducing hierarchical feature fusion produces the full model (full) with the best accuracy of 97.54%. Overall, the monotonic improvements along the ablation chain validate the complementary contributions of shrinkage, SE attention, and HFF under a consistent kernel configuration, while the single-scale reference illustrates the additional benefit brought by the multi-scale design.
Table 3.
Ablation study of MSA-Net components on the APTOS 2019 binary task.
3.4.3. Comparative Performance Analysis
The comparative performance of MSA-Net and the baseline models is summarized in Table 4. Overall, MSA-Net achieves competitive results across the main evaluation metrics. It reaches an accuracy of 97.54%, outperforming ResNet18 at 95.49%, EfficientNet-B2 at 96.58%, and SwinV2-Tiny at 96.99%. In terms of precision, MSA-Net obtains 97.54%, higher than ResNet18 at 95.62% and SwinV2-Tiny at 95.03%, and comparable to EfficientNet-B2 at 96.97%. For recall, MSA-Net achieves 97.54%. SwinV2-Tiny reports a higher recall of 99.18%, but this comes with reduced precision, indicating a more aggressive decision tendency.
Table 4.
Performance comparison of different models.
To support the lightweight claim, we further report model footprint and runtime efficiency in Table 5. All measurements follow a unified setting with IMG_SIZE set to 256 and batch size set to 1. The benchmark is conducted on an NVIDIA GeForce RTX 4060 Laptop GPU with 8 GB memory. Compute cost is measured by THOP in terms of GMACs. Inference latency is reported as mean ± standard deviation over five repeats with warm-up, and peak GPU memory allocation is also recorded. The results show that MSA-Net has the smallest footprint, with 4.54 M parameters and a 17.33 MB FP32 model size, which benefits memory-constrained deployment. Meanwhile, due to the multi-branch feature processing, MSA-Net exhibits higher compute, 11.29 GMACs, and a higher latency, 11.38 ms per image, compared with ResNet18 at 3.32 ms and EfficientNet-B2 at 6.56 ms. Further runtime improvements are possible through implementation-level optimization and deployment toolchains such as operator fusion, TensorRT, or ONNX Runtime.
Table 5.
Complexity and runtime efficiency comparison of different models.
3.4.4. ROC/PR Curves and Confusion Matrix Analysis
Figure 5 illustrates the confusion matrices of all compared models and provides a more fine-grained view of their classification behavior. MSA-Net produces relatively few misclassifications in both the Normal and DR categories, with a small number of false positives and false negatives. This indicates that the model does not strongly bias toward either class and preserves a balanced decision boundary. In contrast, ResNet18 and EfficientNet-B2 exhibit higher counts of both false positives and false negatives, suggesting that their feature representations are less discriminative for borderline cases. SwinV2-Tiny, on the other hand, yields the smallest number of false negatives among all models, which explains its very high recall, but this comes at the cost of a noticeably increased number of false positives. From a screening perspective, such a pattern may lead to more patients being incorrectly flagged as DR, increasing the burden on downstream clinical confirmation.
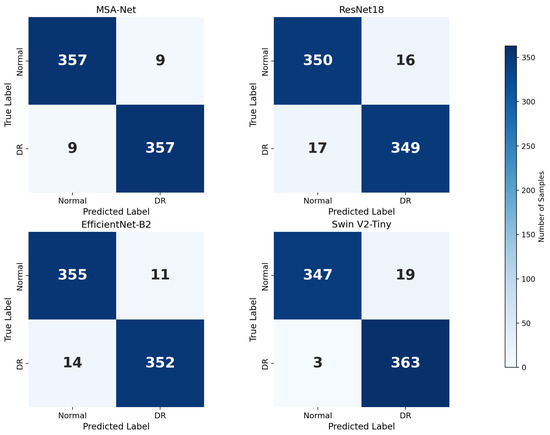
Figure 5.
Confusion matrices of different models.
The ROC and PR curves in Figure 6 further quantify these behaviors across different decision thresholds. In the ROC space, MSA-Net achieves an AUC-ROC of 0.991, which is comparable to EfficientNet-B2 at 0.991 and slightly lower than SwinV2-Tiny at 0.996. Across most false–positive rate regions, the ROC curve of MSA-Net lies above that of ResNet18 and is close to those of EfficientNet-B2 and SwinV2-Tiny, indicating strong discriminative ability even when the operating point is adjusted. This is particularly relevant in DR screening scenarios where the acceptable false–positive rate may vary depending on available resources and clinical workflow.
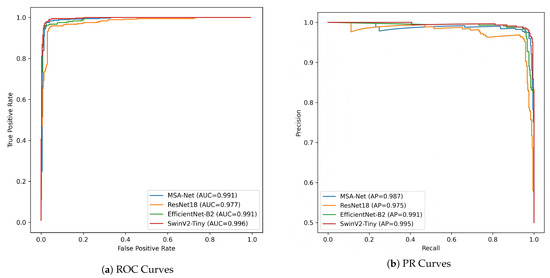
Figure 6.
ROC and PR curve comparison of different models.
The PR curves provide additional insight under the imbalanced setting between Normal and DR samples. MSA-Net attains a PR-AUC of 0.987 and maintains high precision as recall increases, indicating that it can recover a large proportion of DR cases without causing a drastic rise in false positives. EfficientNet-B2 shows more pronounced fluctuations in precision at higher recall levels, suggesting less stable performance when the classifier is tuned toward sensitivity. SwinV2-Tiny reaches the highest PR-AUC of 0.995 but its precision decreases more sharply in certain high-recall regions, consistent with the larger number of false positives observed in its confusion matrix. Taken together, these results suggest that MSA-Net provides a favorable balance between sensitivity and precision, which is desirable in large-scale DR screening where both missed diagnoses and excessive false alarms should be minimized.
3.4.5. Five-Class DR Grading with 5-Fold Cross-Validation on APTOS2019
To further evaluate the robustness of the proposed method for diabetic retinopathy (DR) severity grading, we conducted additional experiments on the APTOS2019 dataset using a five-class classification setting (grades 0–4) under 5-fold stratified cross-validation. This protocol helps reduce potential bias caused by a single data split and is commonly adopted in medical image analysis.
In each fold, the model was trained on four folds and evaluated on the remaining one while preserving class distribution. Considering the ordinal nature of DR grades, Quadratic Weighted Kappa (QWK) was used as the primary evaluation metric, together with accuracy (Acc) and Macro-F1. The best model in each fold was selected based on validation QWK.
The detailed per-fold results and their statistical summaries are reported in Table 6. Overall, the proposed method achieved an average accuracy of 82.71 ± 1.25%, a QWK of 0.8937 ± 0.0142, and a Macro-F1 score of 67.59 ± 2.37%, indicating stable performance across different data partitions.
Table 6.
Five-class DR grading results on APTOS2019 using 5-fold stratified cross-validation.
For reference, a recent Siamese Neural Network–based approach for five-class DR grading reported an accuracy of approximately 81% and a QWK of 0.89 on the APTOS2019 dataset. Compared with this representative method, our approach achieves comparable performance while relying on a standard classification framework without pairwise metric learning. These results further support the reliability of the proposed method for multi-class DR severity assessment.
3.4.6. Discussion
Overall, MSA-Net delivers strong and stable performance on APTOS 2019, outperforming conventional CNN baselines and remaining competitive with SwinV2-Tiny. Although SwinV2-Tiny achieves the highest recall, its reduced precision suggests a higher false-positive rate. In DR screening, recall is essential to reduce missed referrals, yet excessive false positives may increase unnecessary follow-up examinations and clinical workload. From a practical perspective, a balanced precision–recall trade-off is often preferred for large-scale screening pipelines, and MSA-Net provides a more balanced operating point while maintaining high sensitivity.
To strengthen clinical relevance beyond binary recognition, we further evaluate MSA-Net on five-class DR grading using 5-fold stratified cross-validation on APTOS2019. The model achieves an average accuracy of 82.71 ± 1.25%, a QWK of 0.8937 ± 0.0142, and a Macro-F1 of 67.59 ± 2.37%. The small variance across folds indicates consistent generalization under different partitions, which is particularly important for imbalanced and ordinal grading. Notably, recent DR grading studies on APTOS2019 report approximately 81% five-class accuracy with a QWK around 0.89 [19], indicating that the proposed model remains reliable under the same multi-class setting. This additional multi-class evidence directly addresses lesion variability across severity levels and supports the applicability of MSA-Net to DR grading tasks.
The performance gains can be explained by the complementary roles of the proposed design. The parallel multi-scale branches enhance the representation of lesions with diverse spatial extents. The adaptive shrinkage module acts as an explicit feature gating mechanism that suppresses low-confidence activations induced by illumination artifacts and background noise. The hierarchical feature fusion strengthens cross-layer consistency and preserves fine-grained structural cues. These choices are consistent with prior findings that multi-scale modeling, attention-based enhancement, and feature aggregation improve robustness in retinal image analysis.
Finally, the complexity analysis clarifies the scope of the lightweight claim. MSA-Net maintains a compact footprint with 4.54 M parameters and a 17.33 MB FP32 model size, which is favorable for resource-constrained deployment. Meanwhile, the multi-branch design may introduce additional compute and measured latency compared with some backbones. In this work, “lightweight” primarily refers to the model footprint, and the latency trade-off is explicitly reported for completeness. Deployment-oriented optimizations such as operator fusion and inference acceleration toolchains can be considered to further improve runtime efficiency.
4. Conclusions
This work presented MSA-Net, a compact framework for diabetic retinopathy recognition that integrates parallel multi-scale feature extraction, adaptive shrinkage-based feature gating, and hierarchical feature fusion. The proposed design targets two practical challenges in fundus-based DR analysis, namely lesion-scale variability and noise or artifact interference, while maintaining a small model footprint.
Experiments on APTOS 2019 demonstrate that MSA-Net achieves strong performance for binary DR recognition and remains competitive with Transformer-based baselines. Moreover, the additional five-class grading results under 5-fold stratified cross-validation confirm that the proposed model can distinguish severity levels consistently, yielding stable accuracy and QWK across folds. These findings support the robustness of MSA-Net for both screening-oriented recognition and grading-oriented classification.
Future work will focus on improving runtime efficiency without sacrificing grading robustness, evaluating cross-dataset generalization on additional public benchmarks, and incorporating interpretability modules to enhance clinical transparency and trustworthiness.
Author Contributions
X.M. and R.C. jointly designed the overall model architecture and developed the multi-scale soft-thresholding attention framework. X.M. implemented the complete MSA-Net system, conducted all experiments on the APTOS 2019 dataset, performed visualization, and prepared the initial manuscript draft. L.S. assisted with data preprocessing, model training, hyperparameter tuning, and contributed to the analysis of the ablation studies. T.M. provided system integration support, offered theoretical guidance on model optimization, and participated in revising and refining the manuscript draft. J.C. supervised the entire research workflow, guided experimental design and theoretical development, and provided critical revisions to improve the manuscript. All authors have read and agreed to the published version of the manuscript.
Funding
This research received no external funding.
Institutional Review Board Statement
Not applicable.
Informed Consent Statement
Not applicable. This study was conducted using publicly available and anonymized datasets that do not involve direct interaction with human subjects.
Data Availability Statement
The APTOS 2019 Blindness Detection dataset used in this study is publicly available at https://www.kaggle.com/competitions/aptos2019-blindness-detection (accessed on 4 August 2025). This retinal fundus image dataset was used for training and validation of all diabetic retinopathy classification experiments in this study. No proprietary or private data were used, and all experiments were conducted using publicly accessible resources.
Acknowledgments
The authors sincerely thank Pengju Zhang and Mengze Wu for their helpful suggestions and advice.
Conflicts of Interest
The authors declare no conflicts of interest.
References
- Teo, Z.L.; Tham, Y.C.; Yu, M.; Chee, M.L.; Rim, T.H.; Cheung, N.; Bikbov, M.M.; Wang, Y.X.; Tang, Y.; Lu, Y.; et al. Global prevalence of diabetic retinopathy and projection of burden through 2045: Systematic review and meta-analysis. Ophthalmology 2021, 128, 1580–1591. [Google Scholar] [CrossRef] [PubMed]
- Yau, J.W.Y.; Rogers, S.L.; Kawasaki, R.; Lamoureux, E.L.; Kowalski, J.W.; Bek, T.; Chen, S.J.; Dekker, J.M.; Fletcher, A.; Grauslund, J.; et al. Global prevalence and major risk factors of diabetic retinopathy. Diabetes Care 2012, 35, 556–564. [Google Scholar] [CrossRef] [PubMed]
- Zheng, Y.; He, M.; Congdon, N. The worldwide epidemic of diabetic retinopathy. Indian J. Ophthalmol. 2012, 60, 428–431. [Google Scholar] [CrossRef] [PubMed]
- Hou, Y.; Cai, Y.; Jia, Z.; Shi, S. Risk factors and prevalence of diabetic retinopathy: A protocol for meta-analysis. Medicine 2020, 99, e22695. [Google Scholar] [CrossRef] [PubMed]
- Gulshan, V.; Peng, L.; Coram, M.; Stumpe, M.C.; Wu, D.; Narayanaswamy, A.; Venugopalan, S.; Widner, K.; Madams, T.; Cuadros, J.; et al. Development and validation of a deep learning algorithm for detection of diabetic retinopathy in retinal fundus photographs. Jama 2016, 316, 2402–2410. [Google Scholar] [CrossRef] [PubMed]
- Abràmoff, M.D.; Lou, Y.; Erginay, A.; Clarida, W.; Amelon, R.; Folk, J.C.; Niemeijer, M. Improved automated detection of diabetic retinopathy on a publicly available dataset through integration of deep learning. Investig. Ophthalmol. Vis. Sci. 2016, 57, 5200–5206. [Google Scholar] [CrossRef] [PubMed]
- Tan, M.; Le, Q. Efficientnet: Rethinking model scaling for convolutional neural networks. In Proceedings of the International Conference on Machine Learning, Long Beach, CA, USA, 9–15 June 2019; pp. 6105–6114. [Google Scholar] [CrossRef]
- He, K.; Zhang, X.; Ren, S.; Sun, J. Deep residual learning for image recognition. In Proceedings of the IEEE Conference on Computer Vision and Pattern Recognition, Las Vegas, NV, USA, 27–30 June 2016; pp. 770–778. [Google Scholar] [CrossRef]
- Lin, T.Y.; Dollár, P.; Girshick, R.; He, K.; Hariharan, B.; Belongie, S. Feature pyramid networks for object detection. In Proceedings of the IEEE Conference on Computer Vision and Pattern Recognition, Honolulu, HI, USA, 21–26 July 2017; pp. 2117–2125. [Google Scholar] [CrossRef]
- Pratt, H.; Coenen, F.; Broadbent, D.M.; Harding, S.P.; Zheng, Y. Convolutional neural networks for diabetic retinopathy. Procedia Comput. Sci. 2016, 90, 200–205. [Google Scholar] [CrossRef]
- Yu, F.; Koltun, V. Multi-scale context aggregation by dilated convolutions. arXiv 2015, arXiv:1511.07122. [Google Scholar] [CrossRef]
- Huang, G.; Liu, Z.; Van Der Maaten, L.; Weinberger, K.Q. Densely connected convolutional networks. In Proceedings of the IEEE Conference on Computer Vision and Pattern Recognition, Honolulu, HI, USA, 21–26 July 2017; pp. 4700–4708. [Google Scholar] [CrossRef]
- He, K.; Zhang, X.; Ren, S.; Sun, J. Spatial pyramid pooling in deep convolutional networks for visual recognition. IEEE Trans. Pattern Anal. Mach. Intell. 2015, 37, 1904–1916. [Google Scholar] [CrossRef] [PubMed]
- Long, J.; Shelhamer, E.; Darrell, T. Fully convolutional networks for semantic segmentation. In Proceedings of the IEEE Conference on Computer Vision and Pattern Recognition, Boston, MA, USA, 7–12 June 2015; pp. 3431–3440. [Google Scholar] [CrossRef]
- Sun, K.; Zhao, Y.; Jiang, B.; Cheng, T.; Xiao, B.; Liu, D.; Mu, Y.; Wang, X.; Liu, W.; Wang, J. High-resolution representations for labeling pixels and regions. arXiv 2019, arXiv:1904.04514. [Google Scholar] [CrossRef]
- Chen, L.C.; Papandreou, G.; Kokkinos, I.; Murphy, K.; Yuille, A.L. Deeplab: Semantic image segmentation with deep convolutional nets, atrous convolution, and fully connected crfs. IEEE Trans. Pattern Anal. Mach. Intell. 2017, 40, 834–848. [Google Scholar] [CrossRef] [PubMed]
- Donoho, D.L. De-noising by soft-thresholding. IEEE Trans. Inf. Theory 2002, 41, 613–627. [Google Scholar] [CrossRef]
- Farag, M.M.; Fouad, M.; Abdel-Hamid, A.T. Automatic severity classification of diabetic retinopathy based on densenet and convolutional block attention module. IEEE Access 2022, 10, 38299–38308. [Google Scholar] [CrossRef]
- Tariq, M.; Palade, V.; Ma, Y. Effective diabetic retinopathy classification with siamese neural network: A strategy for small dataset challenges. IEEE Access 2024, 12, 182814–182827. [Google Scholar] [CrossRef]
- Pakdelmoez, S.; Omidikia, S.; Seyyedsalehi, S.A.; Seyyedsalehi, S.Z. Controllable retinal image synthesis using conditional StyleGAN and latent space manipulation for improved diagnosis and grading of diabetic retinopathy. arXiv 2024, arXiv:2409.07422. [Google Scholar] [CrossRef]
- Hu, J.; Shen, L.; Sun, G. Squeeze-and-excitation networks. In Proceedings of the IEEE Conference on Computer Vision and Pattern Recognition, Salt Lake City, UT, USA, 18–23 June 2018; pp. 7132–7141. [Google Scholar] [CrossRef]
- Zhao, M.; Zhong, S.; Fu, X.; Tang, B.; Pecht, M. Deep residual shrinkage networks for fault diagnosis. IEEE Trans. Ind. Inform. 2019, 16, 4681–4690. [Google Scholar] [CrossRef]
- Lin, G.; Milan, A.; Shen, C.; Reid, I. Refinenet: Multi-path refinement networks for high-resolution semantic segmentation. In Proceedings of the IEEE Conference on Computer Vision and Pattern Recognition, Honolulu, HI, USA, 21–26 July 2017; pp. 1925–1934. [Google Scholar] [CrossRef]
- Liu, S.; Qi, L.; Qin, H.; Shi, J.; Jia, J. Path aggregation network for instance segmentation. In Proceedings of the IEEE Conference on Computer Vision and Pattern Recognition, Salt Lake City, UT, USA, 18–23 June 2018; pp. 8759–8768. [Google Scholar] [CrossRef]
- Oktay, O.; Schlemper, J.; Folgoc, L.L.; Lee, M.; Heinrich, M.; Misawa, K.; Mori, K.; McDonagh, S.; Hammerla, N.Y.; Kainz, B.; et al. Attention u-net: Learning where to look for the pancreas. arXiv 2018, arXiv:1804.03999. [Google Scholar] [CrossRef]


Disclaimer/Publisher’s Note: The statements, opinions and data contained in all publications are solely those of the individual author(s) and contributor(s) and not of MDPI and/or the editor(s). MDPI and/or the editor(s) disclaim responsibility for any injury to people or property resulting from any ideas, methods, instructions or products referred to in the content. |
© 2026 by the authors. Licensee MDPI, Basel, Switzerland. This article is an open access article distributed under the terms and conditions of the Creative Commons Attribution (CC BY) license.