1. Introduction
In the context of the global transition toward low-carbon transportation, the adoption of electric vehicles (EVs) has been accelerating at an unprecedented rate [
1]. By the end of 2024, the global EV fleet surpassed 45 million units, confirming large-scale deployment as an irreversible trend [
2]. However, the rapid growth in EV ownership and charging infrastructure, combined with uncoordinated charging behaviors, has led to a sharp rise in urban electricity demand. This surge poses new challenges for power grid load forecasting, as inaccurate predictions can directly compromise real-time dispatch and operational planning. Moreover, when the actual peak load exceeds the system’s stability threshold, cascading failures such as voltage instability and transmission line overloads may occur [
3]. This problem extends beyond predictive uncertainty and presents a tangible threat to grid reliability and security. Empirical studies show that when EV penetration exceeds 15%, distribution networks are already at risk of overloads [
4]. In addition, inadequate charging infrastructure, such as a charger-to-vehicle ratio below 1:10, can lead to irrational charging behaviors among users, thereby amplifying load volatility and unpredictability [
5]. However, recent studies indicate that with advanced control strategies, EVs can also function as flexible assets to provide frequency response and inertia support for grid stability [
6]. Therefore, developing accurate and computationally efficient prediction models, along with a comprehensive understanding of EV user charging behavior, has become an essential prerequisite for ensuring the safe and stable operation of modern power systems.
Early research on EV charging demand forecasting primarily focused on characterizing the inherent uncertainty of charging behavior using probabilistic and statistical approaches. Several pioneering studies modeled charging stations as queuing systems and applied traffic flow and queuing theories to develop mathematical models for predicting site-specific charging demand [
7,
8]. To better capture the stochastic characteristics of charging behavior, later studies employed modeling and simulation methods based on stochastic processes. For instance, Goh et al. [
9] combined an improved grey model with Monte Carlo Simulation (MCS) to predict charging loads across different EV categories, whereas Dai et al. [
10] achieved high-accuracy load predictions using the Monte Carlo method.
To improve predictive accuracy, later studies increasingly focused on modeling the spatio-temporal heterogeneity of EV charging demand, with particular emphasis on identifying critical regions and key influencing factors. For instance, Xing et al. [
11] incorporated ride-hailing trajectory data and human decision-making behaviour to forecast urban EV fast-charging demand, while Zhou et al. [
12] employed Point of Interest (POI) data to enhance demand predictions in specific areas, such as residential districts. Although these probabilistic approaches have yielded valuable theoretical insights into the mechanisms underlying charging demand, they continue to face several inherent challenges. On one hand, these models often rely on strong prior assumptions and idealized probability distributions, which constrain their ability to accurately represent the complex and dynamic charging behaviors observed in real-world scenarios [
13]. On the other hand, efforts to incorporate complex simulation processes or behavioral heterogeneity to enhance predictive precision often lead to substantial computational costs [
14]. Consequently, these limitations result in limited predictive accuracy and poor generalization in practical applications.
Developing accurate probabilistic models for electric vehicle (EV) charging demand is challenging. This challenge stems from the complex dynamics of charging systems, numerous influencing factors, and high-dimensional data. Moreover, many existing probabilistic models rely on simplifying assumptions and simulated data. As a result, these models often exhibit low prediction accuracy and fail to capture real-world conditions effectively [
15,
16,
17]. Consequently, data-driven forecasting approaches have gained growing research attention [
18]. Early studies adopted conventional deep learning architectures. For instance, Wang et al. [
19] applied Long Short-Term Memory (LSTM) and Convolutional Neural Network (CNN) models for time-series forecasting over hourly and daily horizons. Building on these studies, Bharat et al. [
20] extended the framework by integrating multivariate LSTM architectures. They further applied explainability techniques such as SHAP to interpret model decisions and identify key influencing factors, thereby enhancing the interpretability and credibility of the predictions.
To further capture long-range dependencies and complex spatio-temporal correlations, research attention has gradually shifted toward more advanced deep learning architectures. Some recent approaches have even introduced self-supervised learning to enhance forecasting resilience against cyberattacks [
21]. Koohfar et al. [
22] were among the first to apply the standard Transformer model to EV charging demand prediction, leveraging its self-attention mechanism to model long-term dependencies and demonstrating its potential for time-series forecasting. However, their model did not explicitly incorporate multiple periodic patterns, including daily, weekly, and holiday cycles, which are intrinsic to charging behavior and essential for accurate forecasting. In parallel, Gunasekaran et al. [
23] proposed a hybrid framework combining an enhanced Gated Recurrent Unit (GRU) with a Graph Convolutional Network (GCN), which achieved significant improvements in prediction accuracy. However, such models primarily focus on spatial interdependencies between regions and are less efficient in modeling long-range temporal dependencies in long-sequence forecasting tasks, while lacking explicit mechanisms to incorporate multi-period temporal features.
To establish performance baselines for complex deep learning models and evaluate their practical advantages, many comparative studies have incorporated traditional machine learning algorithms. For example, Tolun et al. [
24] conducted a comprehensive evaluation of multiple models, including Random Forest, LSTM, and Transformer architectures, using real-world datasets. Among these, Linear Regression remains one of the most fundamental predictive models, generating forecasts by establishing linear relationships between explanatory variables and target values. Due to its simplicity, computational efficiency, and high interpretability, it is often used as a benchmark model [
25]. However, its linear assumptions prevent it from capturing the inherently complex and nonlinear dynamics of EV charging behavior.
To more effectively address nonlinearity and feature interactions within traditional machine learning frameworks, ensemble models based on Gradient Boosting Decision Trees (GBDT) have been introduced in this field. Specifically, Histogram-based Gradient Boosting (HistGradientBoosting) enhances training speed and memory efficiency by discretizing continuous feature values into histogram bins, making it an effective and scalable predictive tool for large datasets [
26]. Furthermore, because forecasting tasks often require both point estimates and the quantification of predictive uncertainty, Quantile Regression has been introduced as a complementary technique. Unlike conventional regression models that estimate only the conditional mean, Quantile Regression predicts arbitrary quantiles of the target variable, providing deeper insights for risk assessment and interval forecasting [
27]. Although these machine learning models improve predictive performance, they are still limited in handling complex temporal data with long-range dependencies, often relying on extensive feature engineering and lacking the ability to automatically learn deep temporal representations.
Existing studies on EV charging demand prediction generally consider multiple factors, including traffic flow, weather conditions, and vehicle characteristics, to facilitate efficient dispatch and optimal resource allocation in power systems. However, the predictive accuracy of these approaches remains limited. A key limitation is their inability to effectively capture the intrinsic heterogeneity of EV charging demand, especially in extracting local temporal features from sequential data. Although deep learning approaches have made progress, most models still fail to fully utilize the multiple periodic patterns inherent in charging behavior, including daily, weekly, and holiday cycles. Meanwhile, models such as the standard Transformer incur high computational costs when processing long sequences due to their global self-attention mechanism, which leads to low training efficiency and a higher risk of overfitting. These limitations together hinder further advances in predictive accuracy and computational efficiency.
More specifically, standard Transformer architectures exhibit three notable failure modes in this context. First, they experience attention dilution, in which the global self-attention mechanism smooths sharp, high-frequency local fluctuations by averaging them with longer-term trends. Second, standard positional encodings lack semantic hierarchy and treat time as a continuous sequence without distinguishing among workdays, weekends, and holidays, which results in poor generalization during irregular calendar events. Finally, the quadratic computational complexity () creates a trade-off between efficiency and context length, often limiting the model’s ability to process sufficiently long historical sequences needed to capture seasonal dependencies.
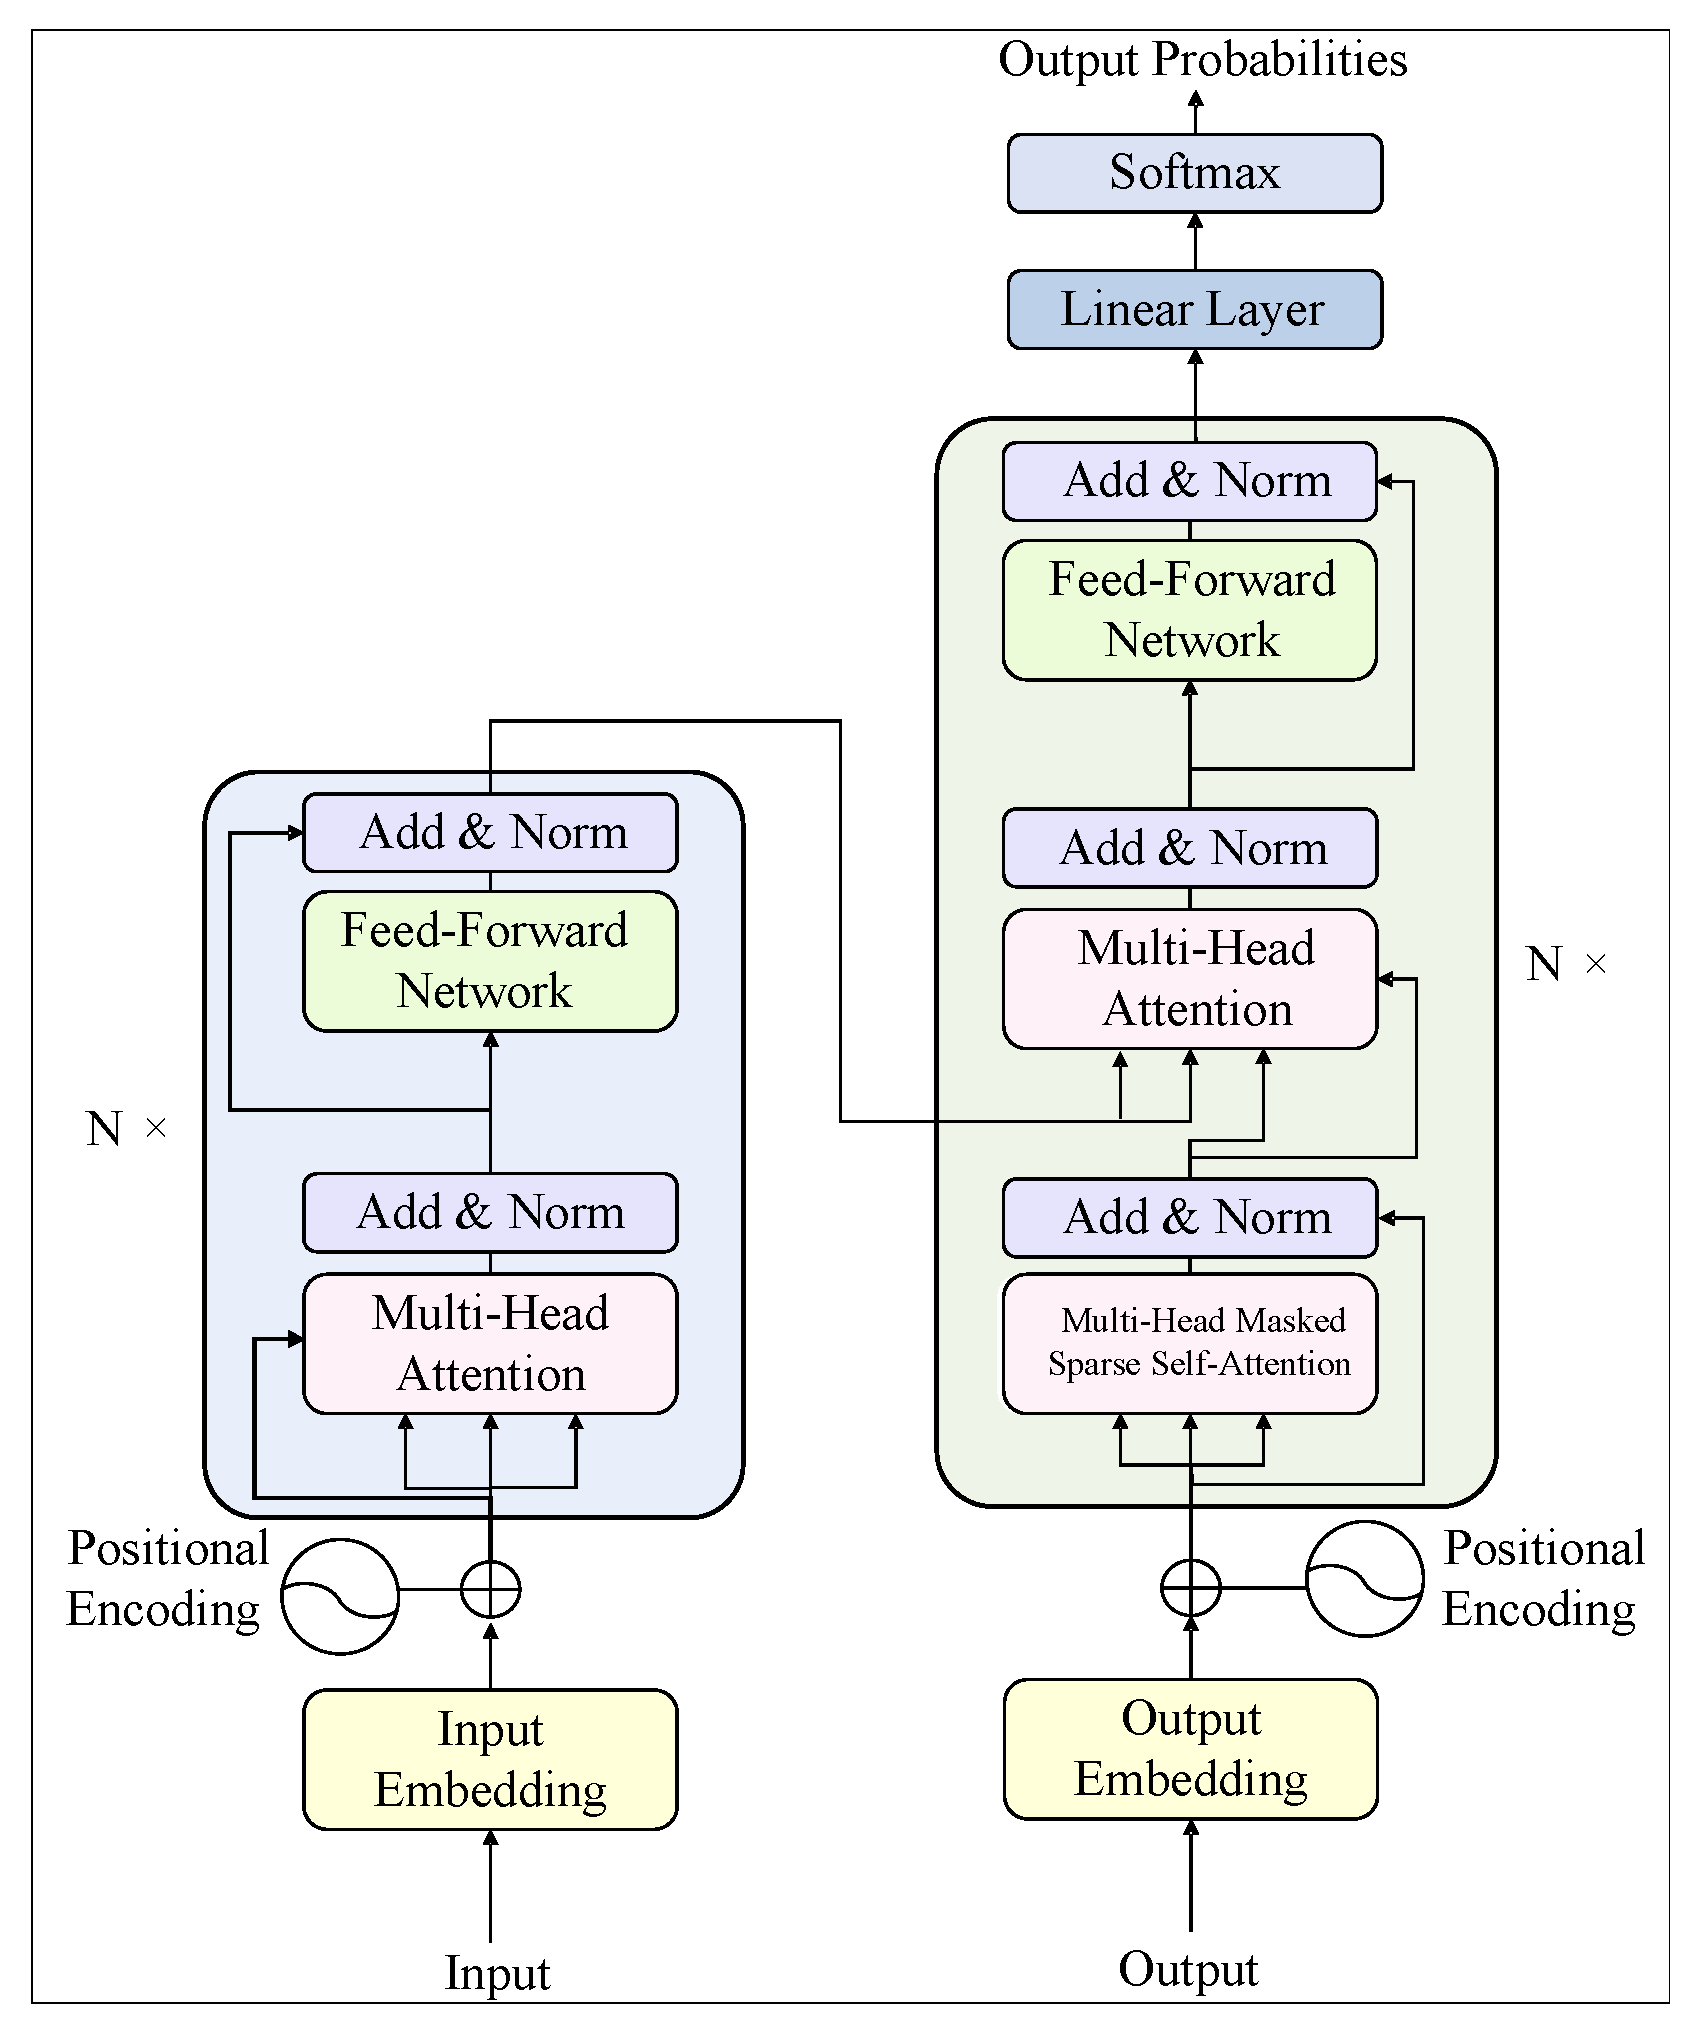
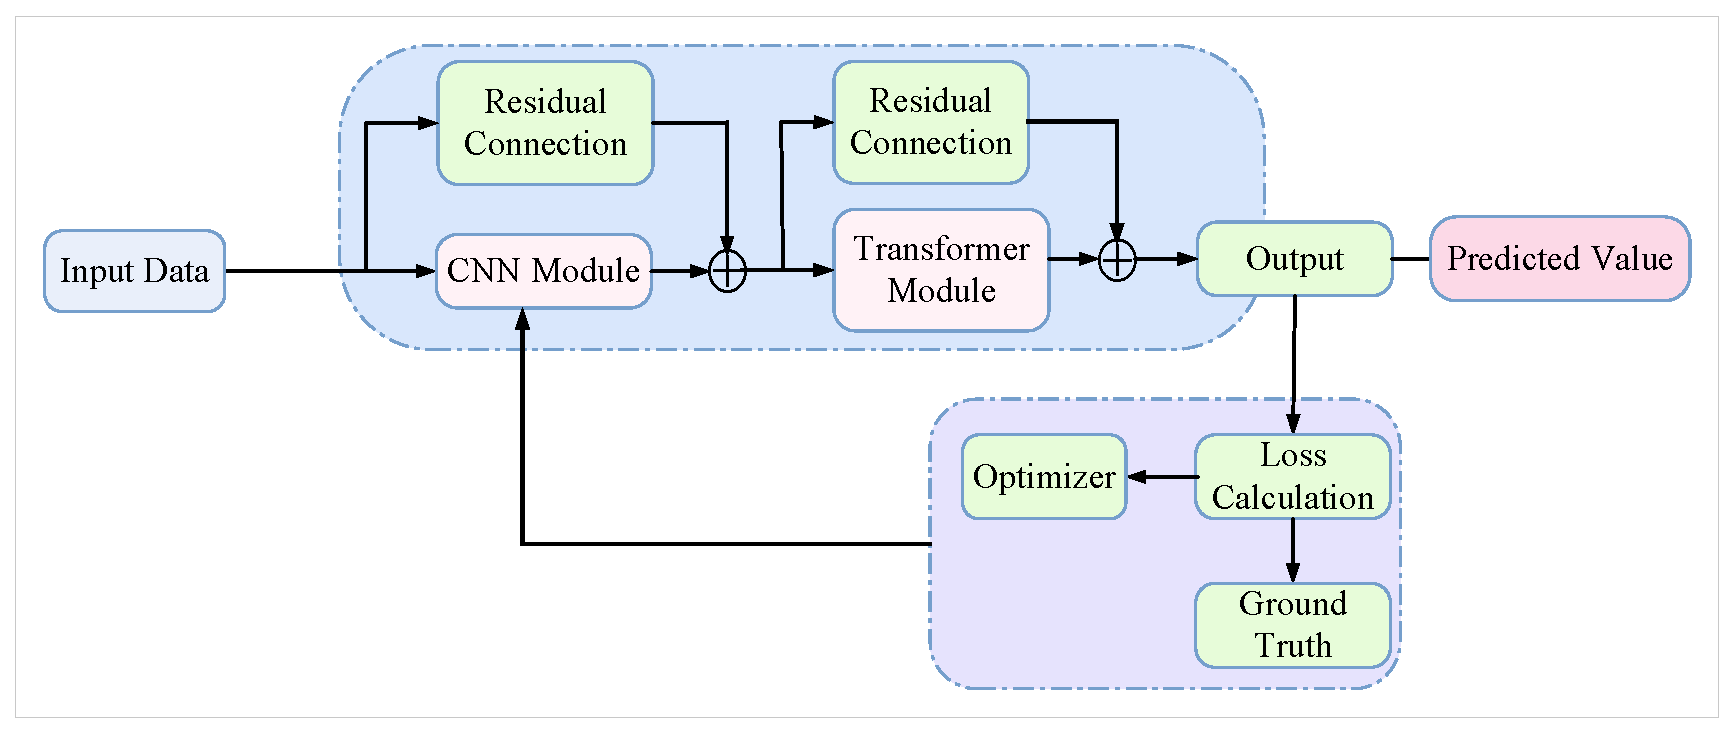
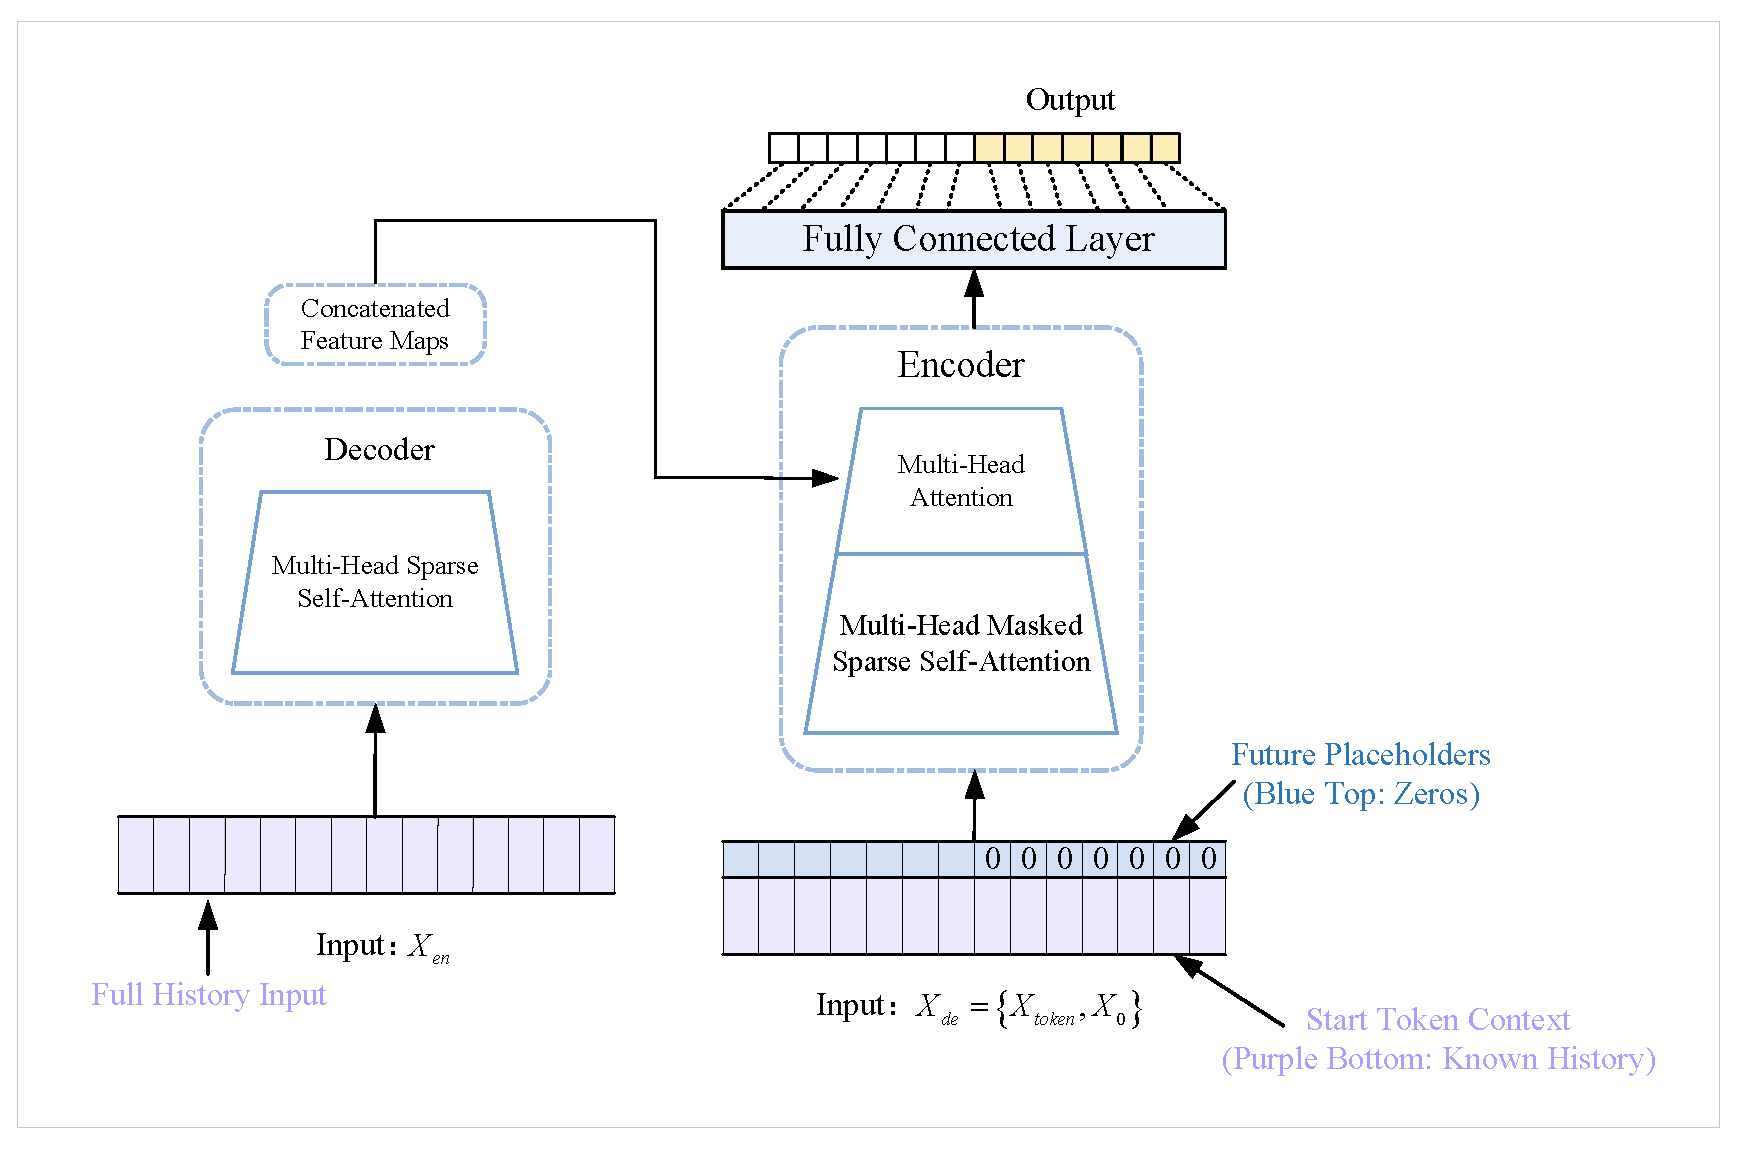
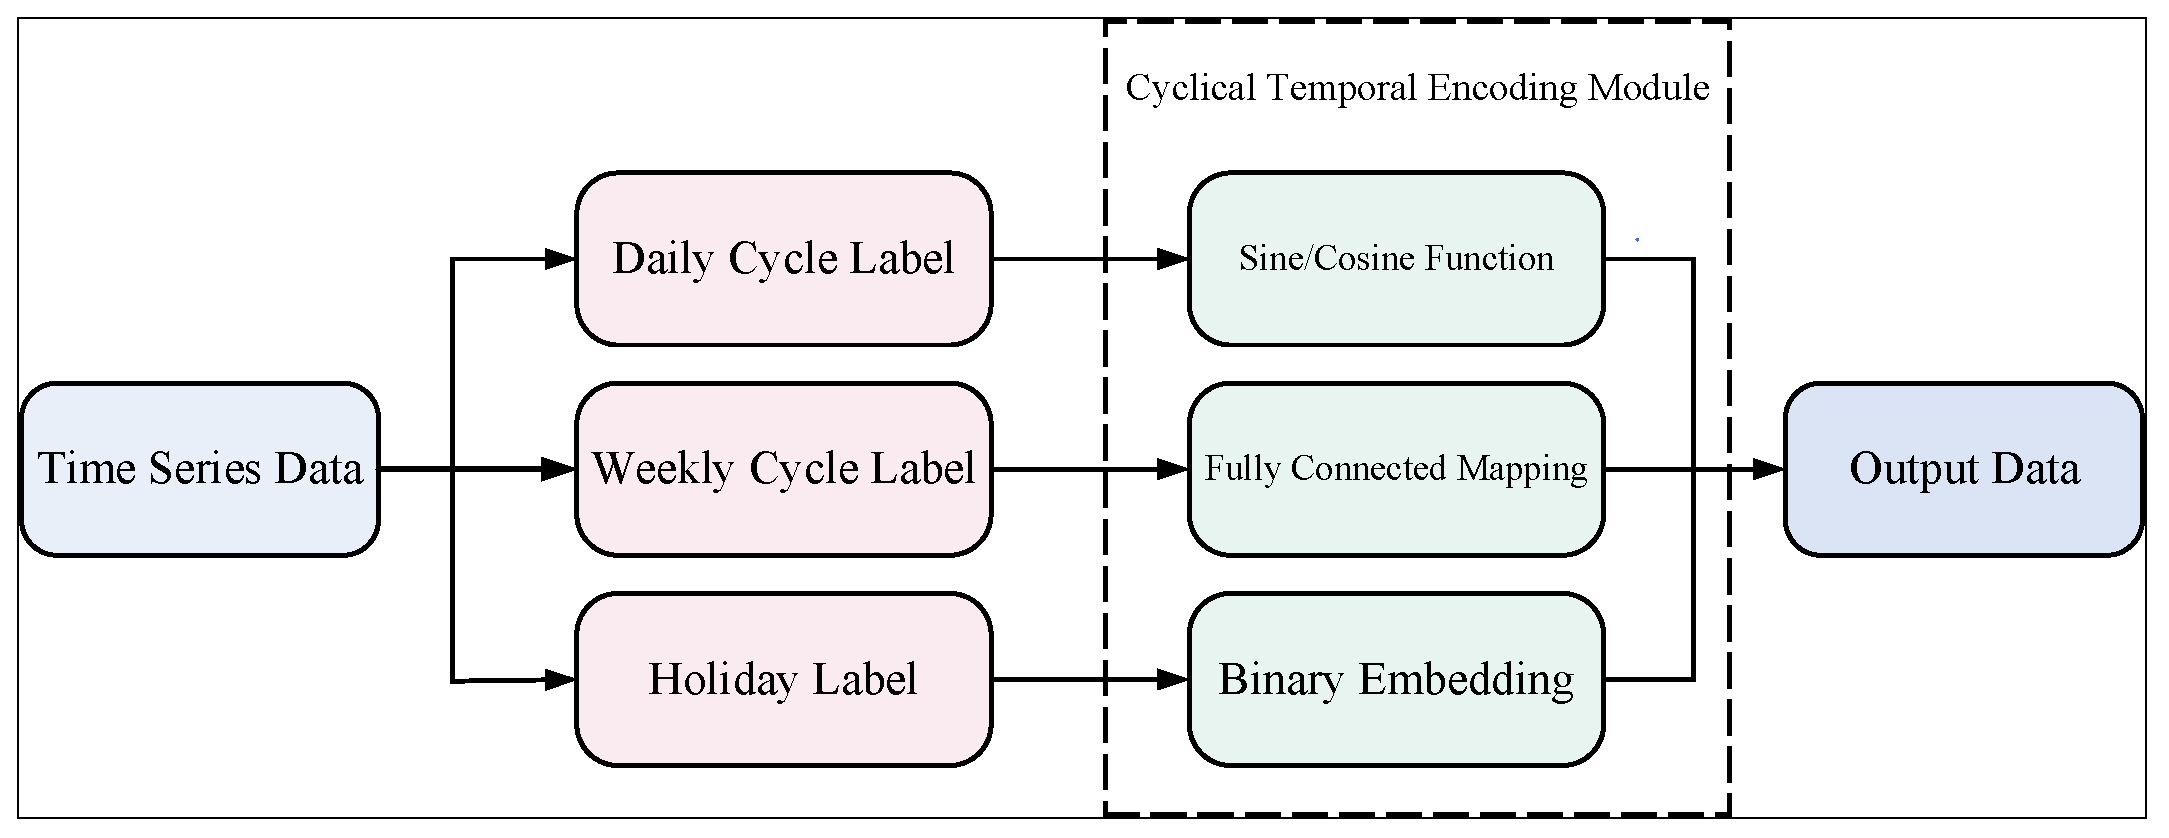
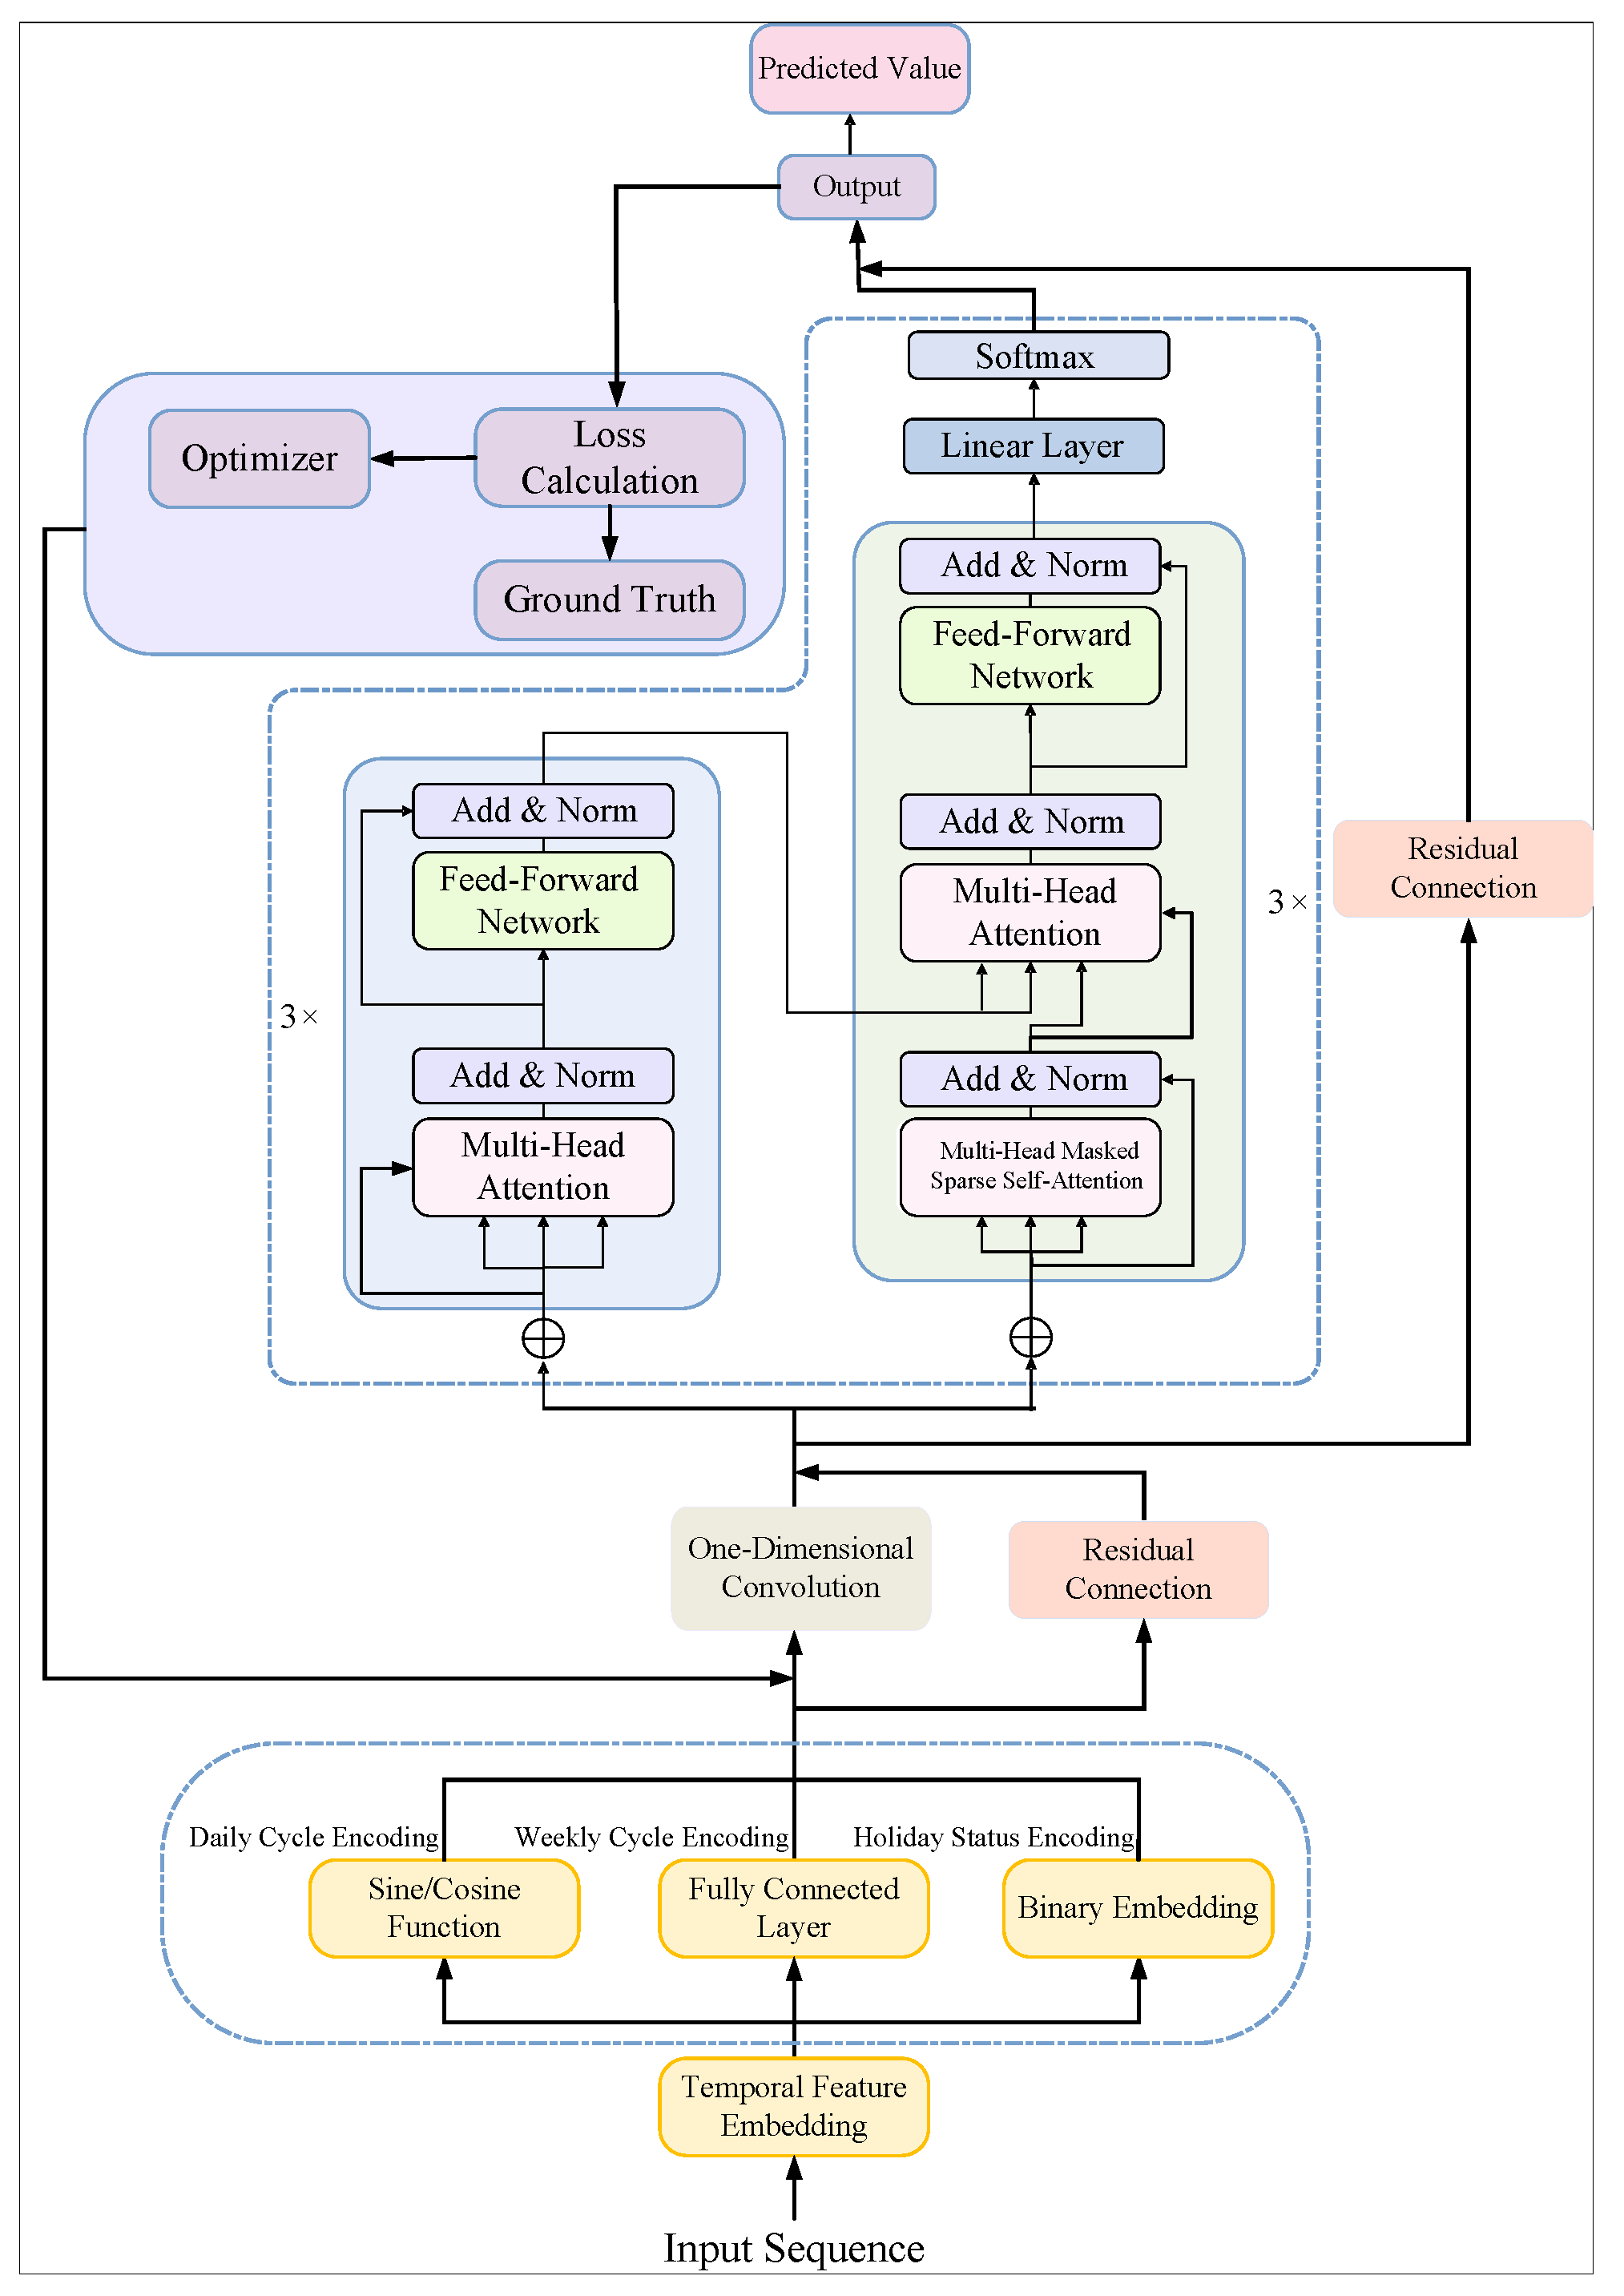
To address these challenges, this study proposes a novel Convolutional Sparse Periodic Transformer Network (CSPT-Net) that introduces three targeted improvements designed to overcome the specific limitations of the standard Transformer in EV charging demand forecasting. First, since the standard Transformer’s global self-attention mechanism is inefficient at capturing local dependencies and short-term temporal patterns, a one-dimensional convolutional neural network (1D-CNN) is incorporated at the model’s front end to strengthen local feature extraction. Second, the standard global attention mechanism is replaced by a sparse attention module that narrows the attention scope to reduce computational complexity and enhances the model’s focus on key temporal segments. Finally, a periodic temporal encoding module is developed to explicitly embed multi-level periodic patterns, including daily, weekly, and holiday cycles, into temporal representations. This design reinforces temporal correlations in the input data, simplifies the model architecture, and substantially improves its ability to capture multi-periodic and trend information.
3. Experiments
The performance of the CSPT-Net model was rigorously evaluated through a series of experiments conducted on a large-scale real-world dataset [
14]. A multi-source heterogeneous data fusion strategy was employed to ensure the diversity and comprehensiveness of the training data [
31]. The dataset consists of two main components:
A total of 12,541 synthetic charging records were generated using the Monte Carlo simulation method [
32,
33], calibrated to the real-world road network of Xi’an. To ensure that the simulated data captured realistic spatio-temporal heterogeneity, the environment was configured with detailed topological and vehicle-level parameters. Geographically, the simulation encompassed 27 functional zones mapped from the urban core, including 9 residential areas, 9 commercial districts, and 9 working zones. This spatial design enabled the dataset to reflect charging demand patterns across diverse land-use categories.
In terms of vehicle characteristics, the simulation agents were calibrated to represent the composition of the local EV market, covering 10 representative battery-electric and plug-in hybrid models. Battery capacities in the generated dataset ranged from approximately 13 kWh to 75 kWh, with most samples concentrated between 40 and 75 kWh—consistent with the specifications of mainstream private and commercial vehicles in the region.
In addition to the synthetic data, 60,000 supplementary charging entries were incorporated from an authoritative public dataset published in Scientific Data [
34]. Integrating these two datasets enhanced the diversity and coverage of charging behaviors, thereby improving the model’s generalization capability across different operational environments.
The dataset consists of approximately 71.4% working days, 25.5% weekends, and 3.1% statutory holidays. Although the distribution is imbalanced, the substantial number of non-working-day samples (>20,000) provides adequate support for learning temporal differences. Furthermore, CSPT-Net incorporates independent embedding layers for weekend and holiday indicators, allowing the model to capture event-specific patterns while preventing the dominant workday distribution from overshadowing minority classes, which contributes to stable training.
3.1. Data Preparation and Feature Extraction
3.1.1. Data Normalization and Anomaly Filtering
During the data fusion stage, the two heterogeneous data sources were merged into a unified, timestamp-aligned sample space using feature alignment and dimensional matching techniques. Missing feature values were handled using a null-value flagging strategy, and a sliding window sampling method was applied to construct sequential samples suitable for time-series forecasting. This process produced a unified, multi-dimensional training dataset containing 72,541 records.
A multi-stage data cleaning pipeline was employed to standardize the raw dataset. First, temporal fields were normalized by converting all time identifiers to the “YYYY-MM-DD HH:mm:ss” format to ensure strict time-series alignment. Based on the physical constraints of charging behavior, valid charging durations were defined between 5 min and 24 h, leading to the removal of 572 anomalous records outside this range. Additionally, a sequential conflict detection algorithm was applied to identify and remove 72 invalid entries with overlapping time windows. To ensure continuity in EV charging records, the initial record for each vehicle was removed to establish a complete prior charging history for subsequent sessions. After preprocessing, a cleaned dataset containing 71,520 valid charging sessions was obtained.
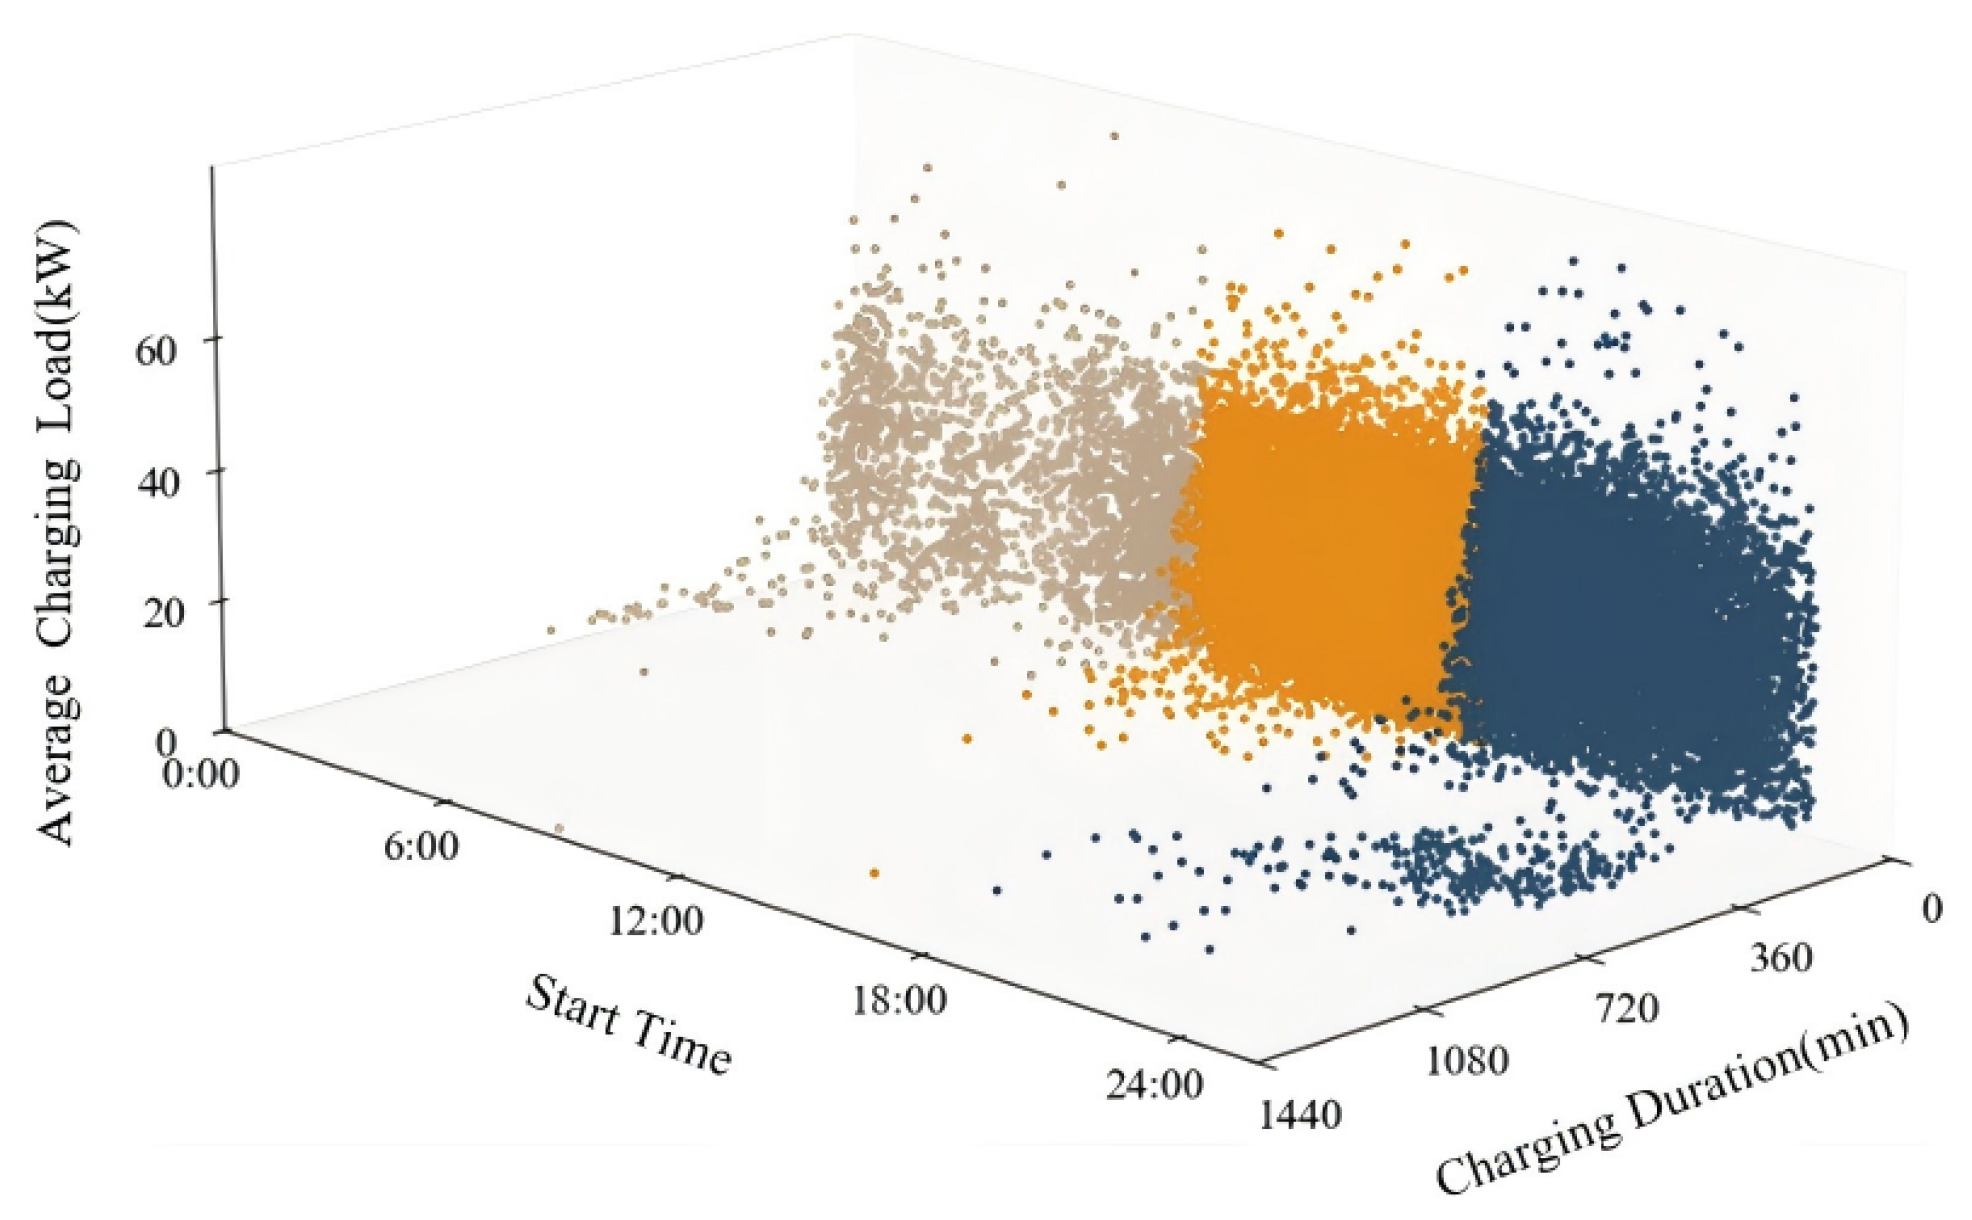
Figure 6 shows a three-dimensional scatter plot illustrating the data distribution across start time, charging duration, and average charging load. The data are primarily concentrated between 06:00 and 24:00, representing 76.44% of all sessions. Although charging durations range from a few minutes to 1800 min, 95.92% of sessions lie within the 0–720 min range. The average charging load mainly falls between 0 and 60 kW, with only 2.91% of sessions exceeding this threshold.
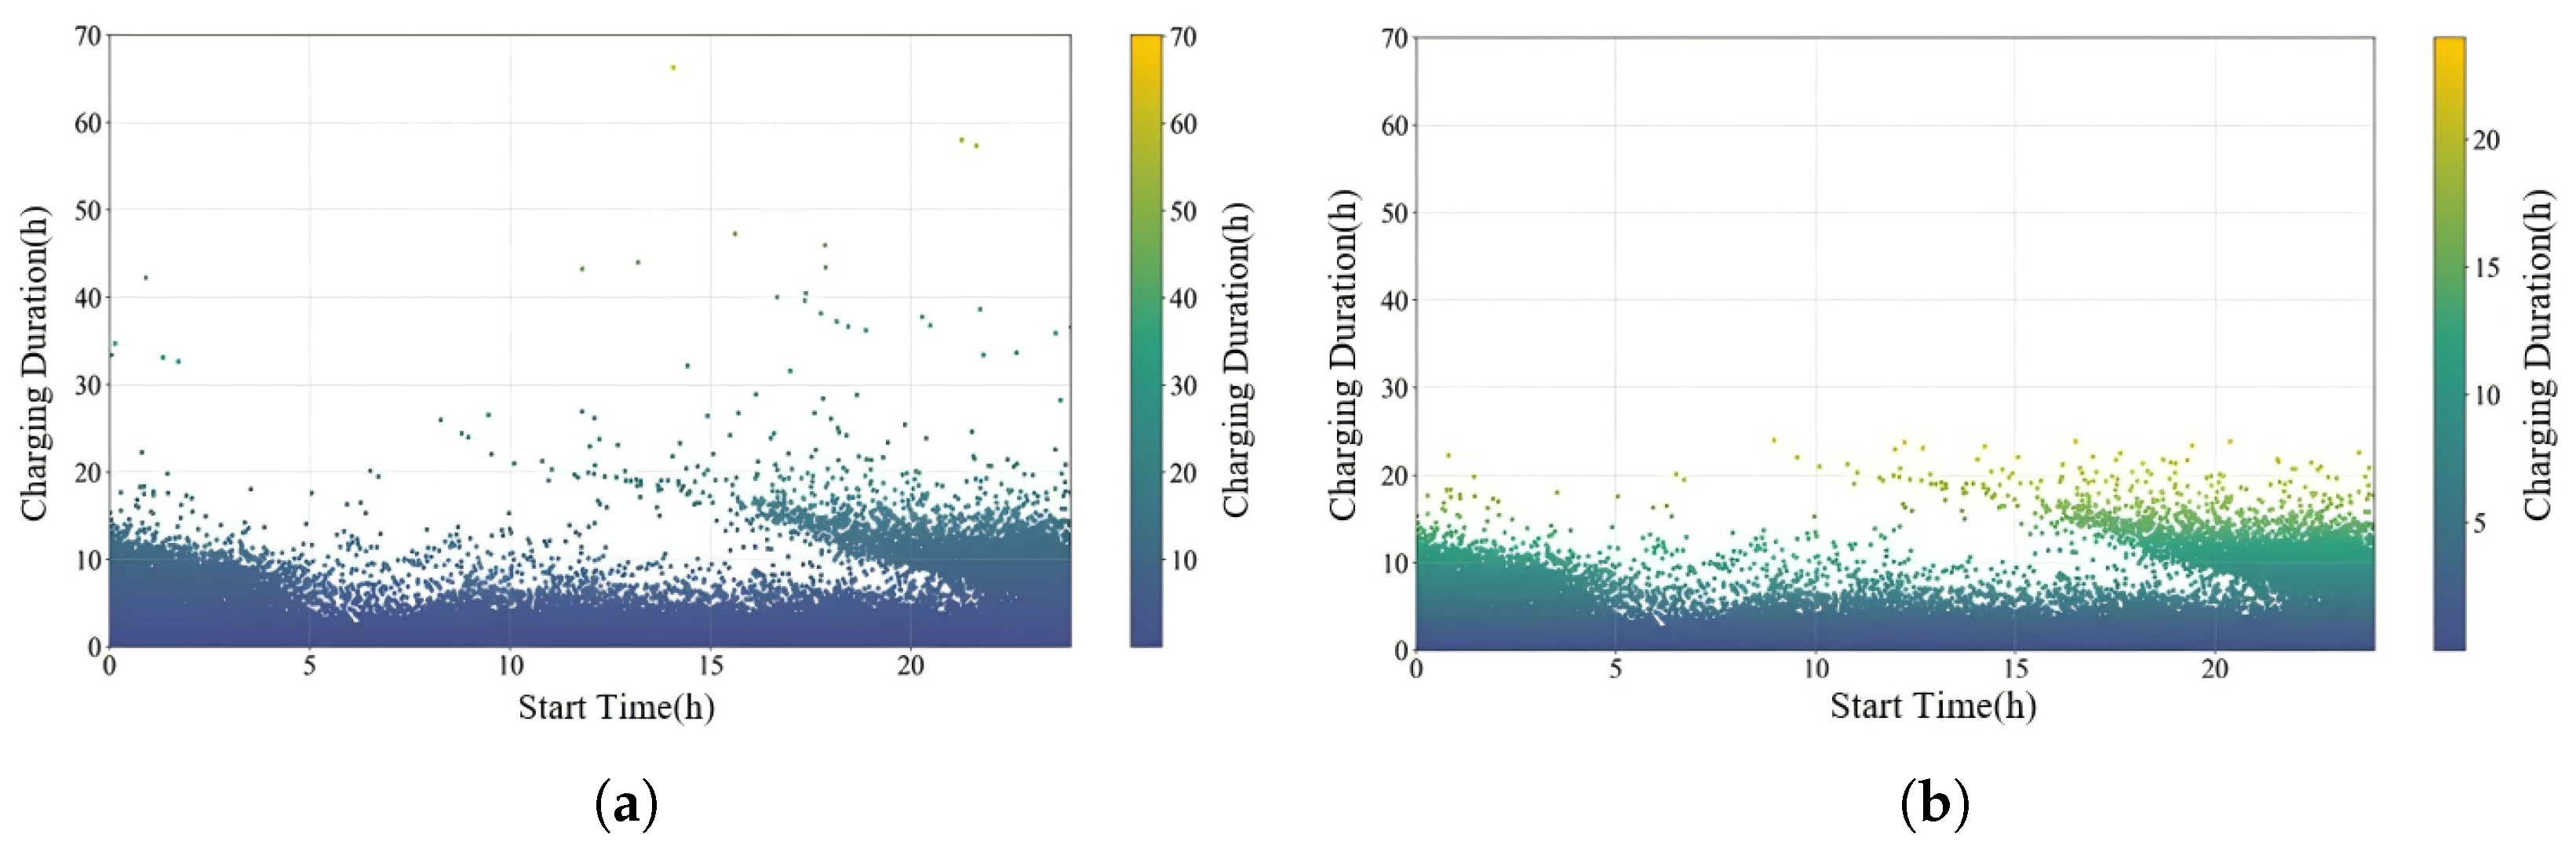
Figure 7 illustrates the specific impact of the data-cleaning pipeline on the dataset’s temporal distribution. As shown in
Figure 7a, the raw data exhibits significant stochastic noise and discrete outliers, particularly charging durations extending beyond physical limits or anomalous short-duration spikes caused by connection errors. In contrast,
Figure 7b demonstrates the efficacy of the applied constraints: the distribution is strictly bounded within the valid [5 min, 24 h] interval, and the sparse ’long-tail’ noise has been effectively truncated. This logical refinement ensures that the training inputs reflect valid charging physics rather than sensor anomalies or data logging errors.
3.1.2. Multi-Dimensional Feature Extraction
From the cleaned dataset, a total of 17 key features were derived and extracted, capturing the spatio-temporal distribution characteristics and associated attributes of the charging load. These features are systematically categorized into six distinct groups: temporal, metadata, environmental, transactional, charging state, and historical features. A representative subset of these features, together with their detailed descriptions, is summarized in
Table 1.
The prediction target of the model is the charging duration, which directly represents the user’s trade-off between charging power and time cost. Accurate prediction of charging duration enables operators to dynamically schedule charging resources and provides users with personalized charging time recommendations based on forecast results. The detailed feature descriptions are provided in
Table 2.
3.2. Experimental Setup and Result Analysis
3.2.1. Parameter Settings and Evaluation Metrics
To ensure the reproducibility of the experimental results, all models were trained and evaluated on a standardized hardware platform equipped with an Intel Core i7-8700 CPU (Intel Corporation, Santa Clara, CA, USA), 16 GB of RAM, and an NVIDIA GeForce RTX 2080 GPU (8 GB VRAM; NVIDIA Corporation, Santa Clara, CA, USA). The deep learning models were implemented using PyTorch (version 1.13.0) and Python (version 3.8.0). To determine the optimal configuration, a grid search strategy was employed on the validation set, where multiple combinations of learning rates, batch sizes, and optimizer settings were evaluated. To ensure a fair and rigorous comparison, identical optimization protocols were applied to all models, including the proposed CSPT-Net and all baseline architectures. Specifically, a standardized grid search strategy was employed on the validation set to identify the optimal hyperparameters for each individual model. The search space included learning rates in the range of
, batch sizes of
, and hidden layer dimensions of
. Furthermore, to prevent unfair advantages due to training duration, an early stopping mechanism (patience = 10 epochs) was universally implemented, ensuring that all deep learning models converged to their respective optimal states. The resulting optimal hyperparameters for the CSPT-Net, selected from this search process, are detailed in
Table 3.
A set of key evaluation metrics was utilized to comprehensively evaluate the predictive performance of the proposed model. To ensure analytical rigor and transparency, the definitions and computational formulas for each metric are provided below.
Absolute Error (AE): This metric quantifies the absolute deviation between the predicted value,
, and the true value,
. The formula is shown in Equation (
8):
Mean Absolute Error (MAE): This is defined as the sum of the absolute errors for all observations
i divided by the total number of observations
n. The specific formula is shown in Equation (
9):
Median Absolute Error (MdAE): In cases where the data distribution is highly skewed and contains a large number of outliers, MdAE is a more robust metric than MAE because the mean is more sensitive to outliers. Its calculation formula is shown in Equation (
10):
Mean Absolute Percentage Error (MAPE) is defined as the mean absolute difference between the predicted and actual values, expressed as a percentage of the actual value. MAPE expresses the prediction error as a percentage, intuitively indicating the deviation of the predicted values from the actual values. Because MAPE is scale-independent, it facilitates comparison across datasets with different magnitudes and measurement units. The calculation formula is provided in Equation (
11).
Median Absolute Percentage Error (MdAPE) is defined similarly to MAPE; it is obtained by calculating the median of the absolute percentage errors.
Symmetric Mean Absolute Percentage Error (SMAPE) quantifies the relative error between predicted and actual values. Its symmetric formulation mitigates the denominator issue that arises in MAPE when actual values approach zero. The detailed calculation is presented in Equation (
12).
Training Time measures the total duration required for the model to complete all training epochs. It provides a direct measure for evaluating the model’s computational complexity and training efficiency. All comparisons are conducted under a consistent software and hardware environment.
3.2.2. Comparison of Results
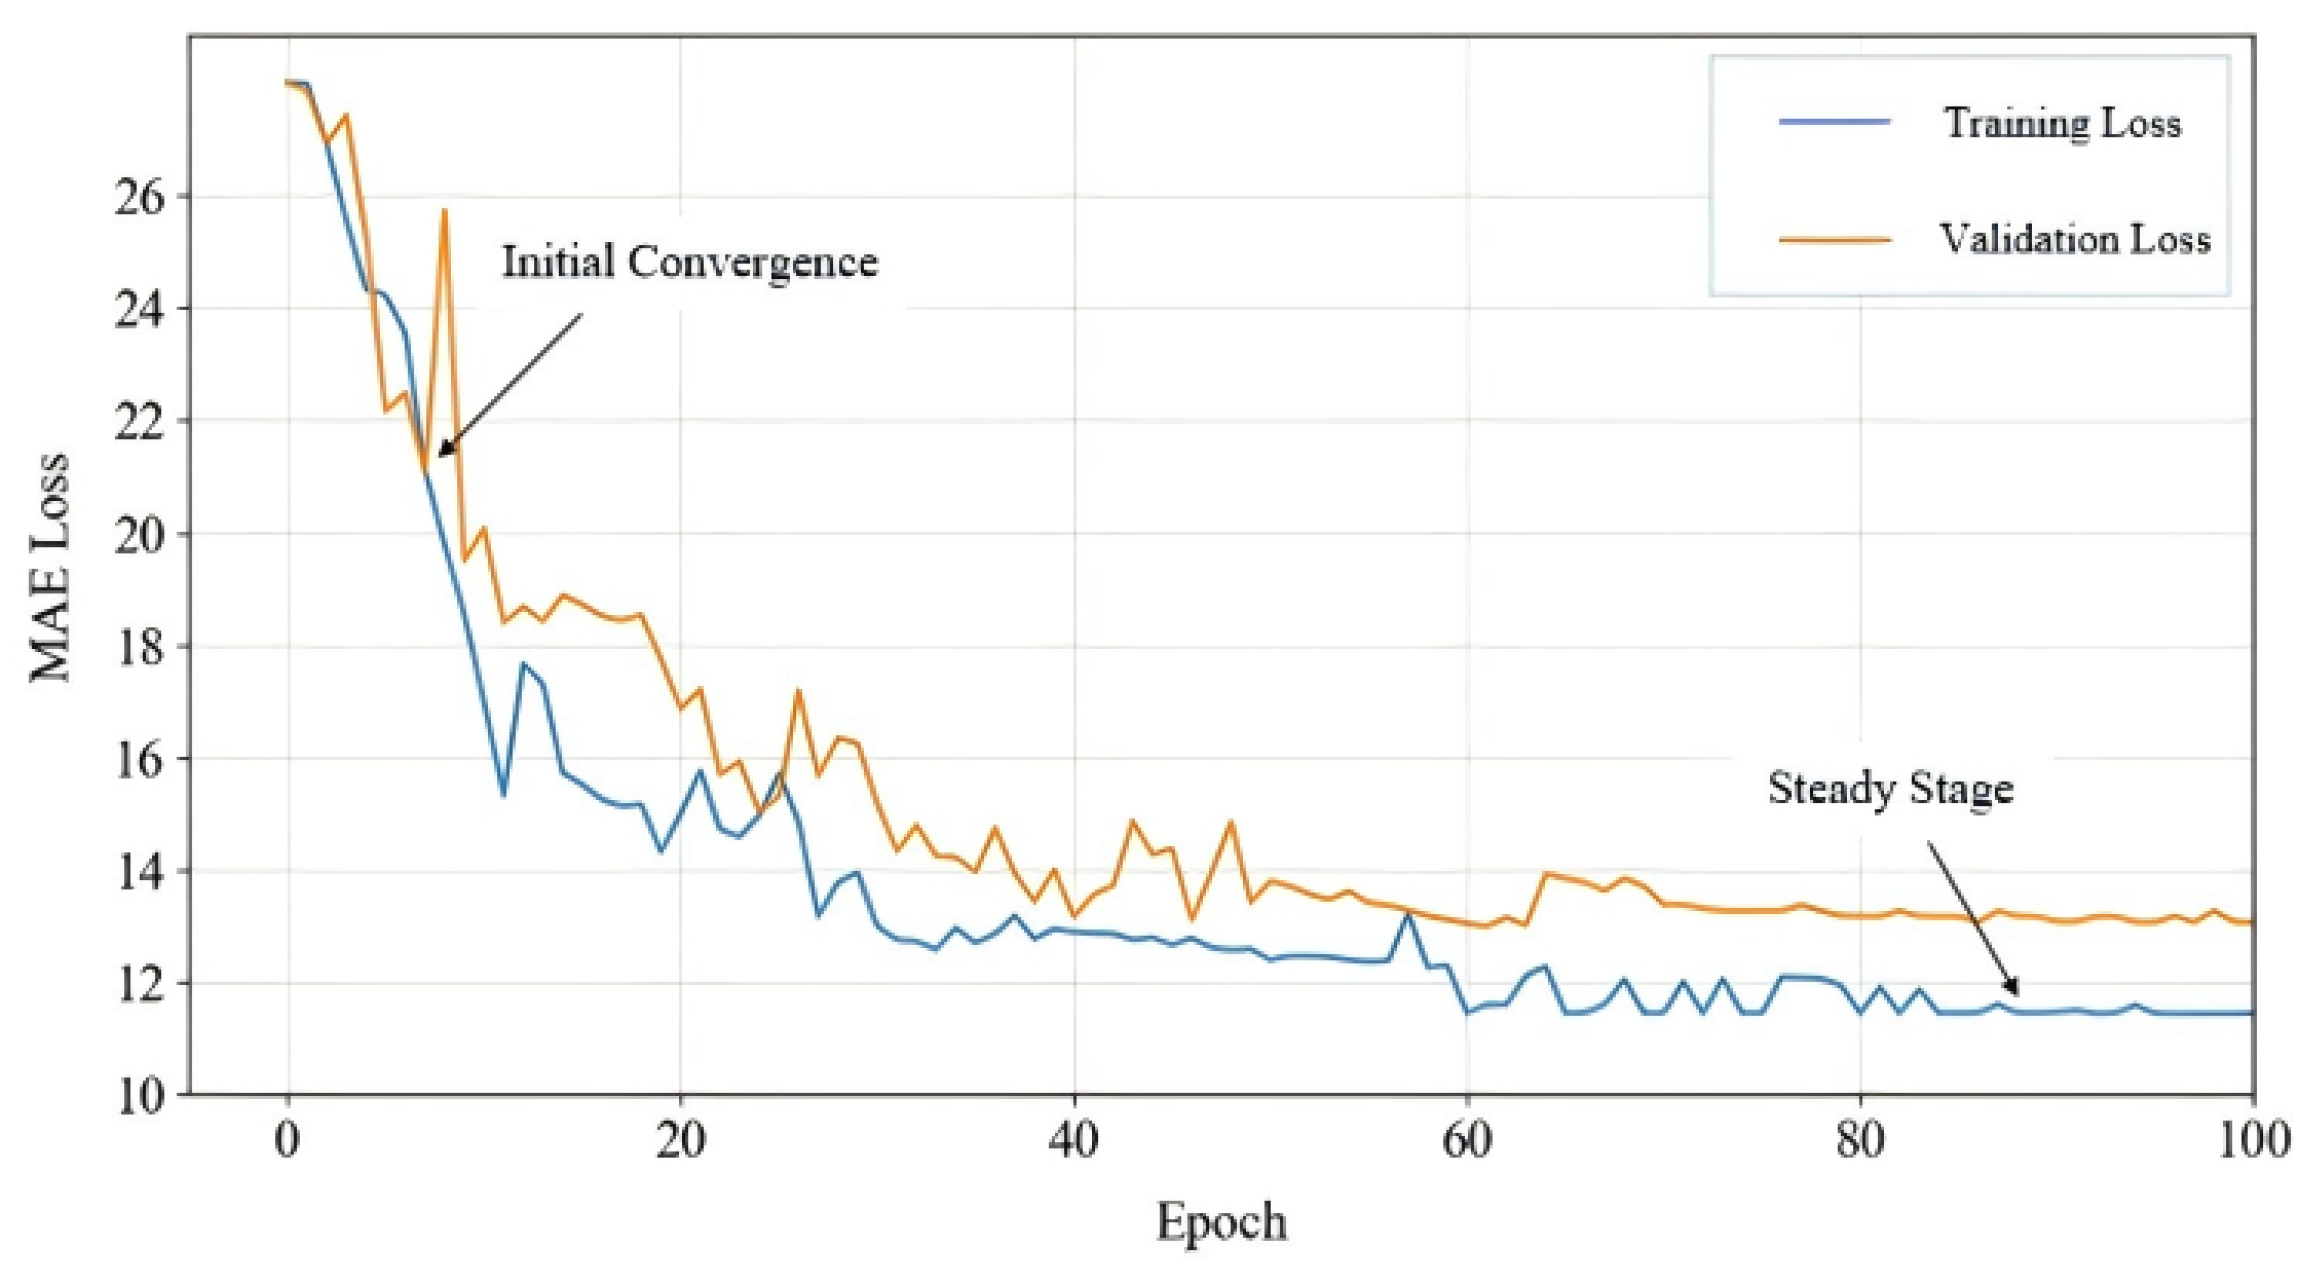
Figure 8 presents the learning curve of the CSPT-Net model, depicting the evolution of the loss function across training epochs. During the initial training phase, the loss decreases sharply, indicating the model’s strong early convergence ability. Around the 20th epoch, the ReduceLROnPlateau learning rate scheduler is activated, dynamically adjusting the learning rate and causing a brief fluctuation in the loss curve. After about 40 epochs, the loss reduction slows noticeably but continues a steady downward trend. Between the 60th and 80th epochs, the scheduler continues fine-tuning its parameters to further optimize convergence. After 85 epochs, the loss function stabilizes, and the final training loss converges to 11.02421. The validation loss remains consistently higher than the training loss, eventually stabilizing around 13.14425, which suggests mild overfitting. Using the expanded dataset, the full 100-epoch training completed in only 763 s, demonstrating a significant improvement in training efficiency.
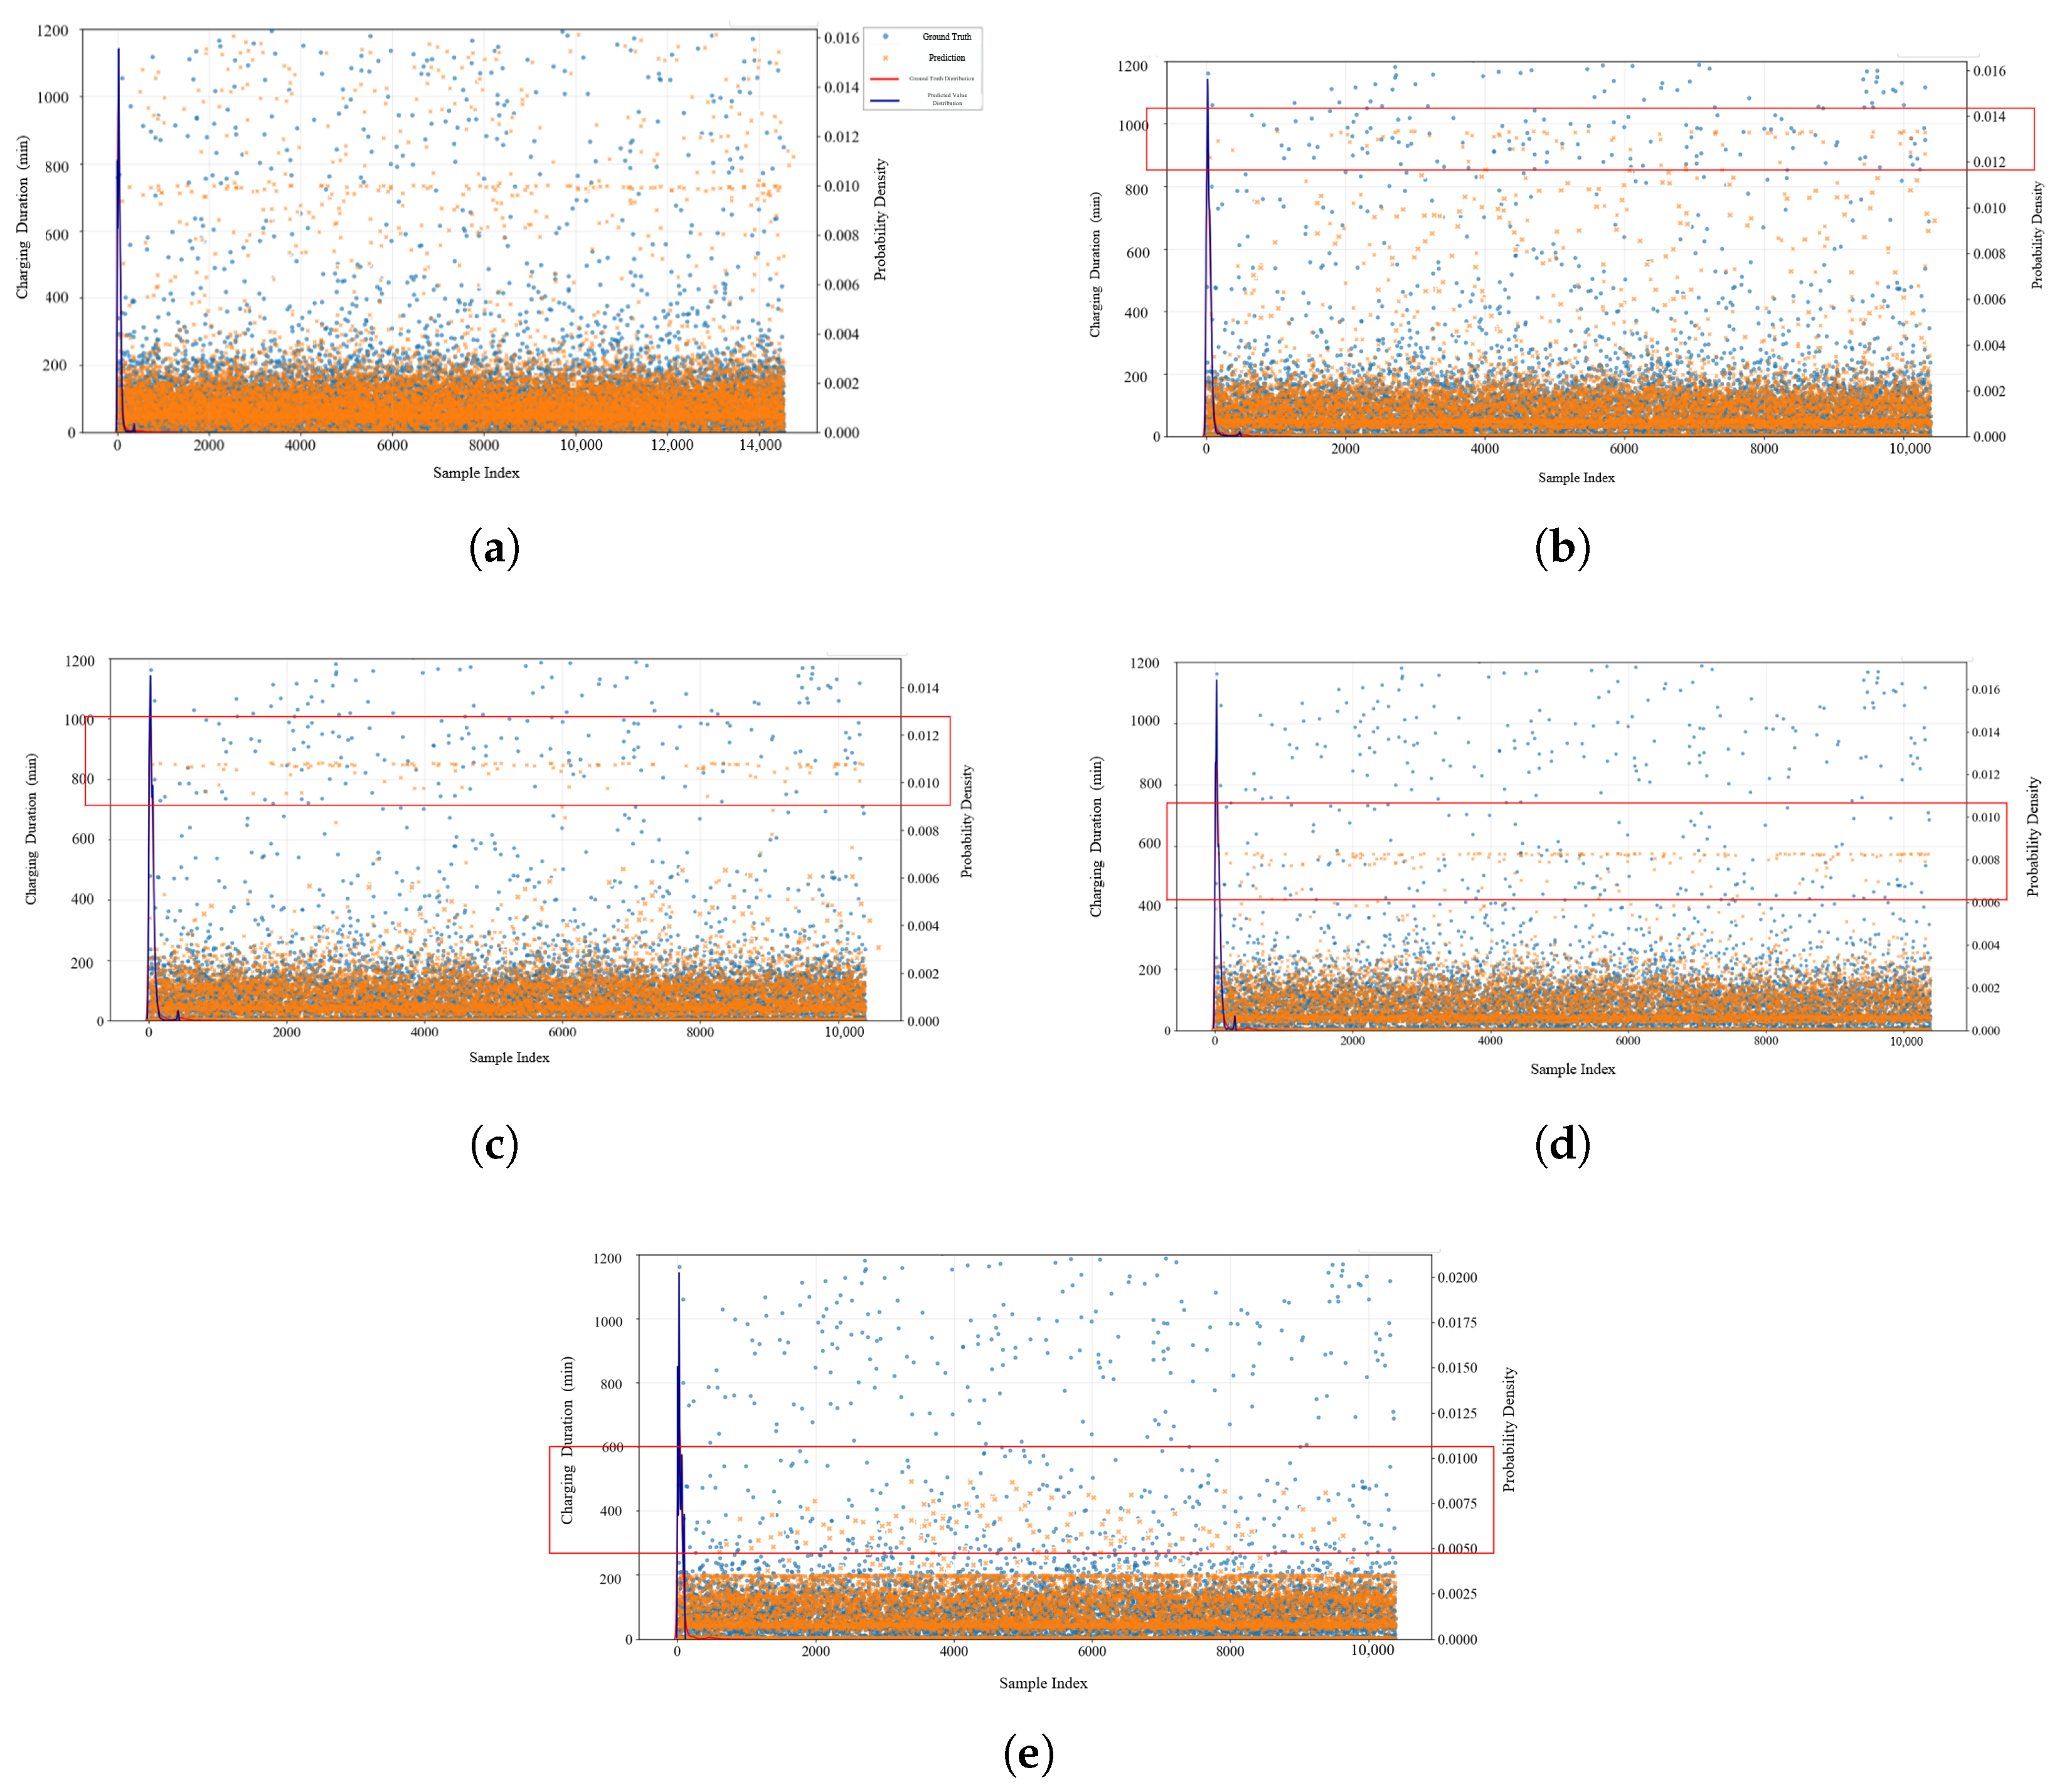
Figure 9 presents a comparative analysis of the charging demand prediction performance across multiple models. As shown in
Figure 9a, the proposed model demonstrates high robustness and predictive accuracy, even for anomalous charging sessions with long durations (e.g., over 1000 min). The predicted value distribution closely matches the ground truth, indicating strong generalization capability. This superior performance mainly results from the proposed periodic time encoding, which enables the model to identify atypical temporal patterns related to holidays or special intervals. Meanwhile, the sparse attention mechanism enhances focus on critical time segments and suppresses noise interference. In contrast,
Figure 9b shows that the standard Transformer model exhibits a significant accuracy decline for charging durations exceeding 1000 min, though it maintains acceptable performance for shorter sessions. As shown in
Figure 9c, the HistGradientBoosting model has a constrained prediction range of about 850 min and exhibits a systematic bias between predicted and actual values.
Figure 9d,e shows that the QuantileRegressor and LinearRegression models perform even worse; both completely fail to predict sessions exceeding 600 min, and their short-duration predictions deviate markedly from the ground truth. These results suggest that traditional linear models cannot effectively capture the complex non-linear spatio-temporal dependencies inherent in EV charging behavior.
3.2.3. Comparative Evaluation of Model Performance
Table 4 summarizes the overall performance evaluation results for the charging duration prediction task across all vehicles. Based on 71,520 charging samples, the global error statistics show that CSPT-Net achieves superior overall performance in this task. The Mean Absolute Error (MAE) of 12.21 min represents the smallest overall prediction bias among all compared models. The low Median Absolute Error (MdAE) of 4.92 min further demonstrates the model’s high predictive accuracy for most samples, with large deviations restricted to a few outliers. For relative error metrics, the Mean Absolute Percentage Error (MAPE), Median Absolute Percentage Error (MdAPE), and Symmetric Mean Absolute Percentage Error (SMAPE) all achieved the lowest values, highlighting the model’s superior consistency and reliability.
Among baseline models, the Transformer outperformed both HistGradientBoosting and LinearRegression on key metrics such as MAE and SMAPE, whereas LinearRegression showed clear disadvantages across all evaluation criteria. These results offer a broad comparison of predictive performance across different modeling approaches.
Significant differences were also observed in computational efficiency. Traditional models, such as LinearRegression, completed training in approximately 10–15 s; however, their accuracy remained insufficient for practical deployment. The standard Transformer achieved higher accuracy than traditional approaches but required the longest training time (1850 s), resulting in considerable computational overhead. In contrast, the proposed CSPT-Net achieved the best overall performance across all metrics and completed training in only 763 s, representing a 58% improvement in training efficiency compared with the standard Transformer. These findings demonstrate that CSPT-Net achieves an optimal balance between predictive accuracy and computational efficiency, validating the effectiveness and superiority of the proposed architecture.
Table 5 summarizes the average values of each evaluation metric calculated on a per-vehicle basis. This analytical perspective highlights the distinctive behavioral patterns of individual vehicles, allowing for a more detailed assessment of model performance and providing a solid basis for fine-grained analysis. In this per-vehicle prediction task, CSPT-Net again demonstrates a clear performance advantage over the comparison models.
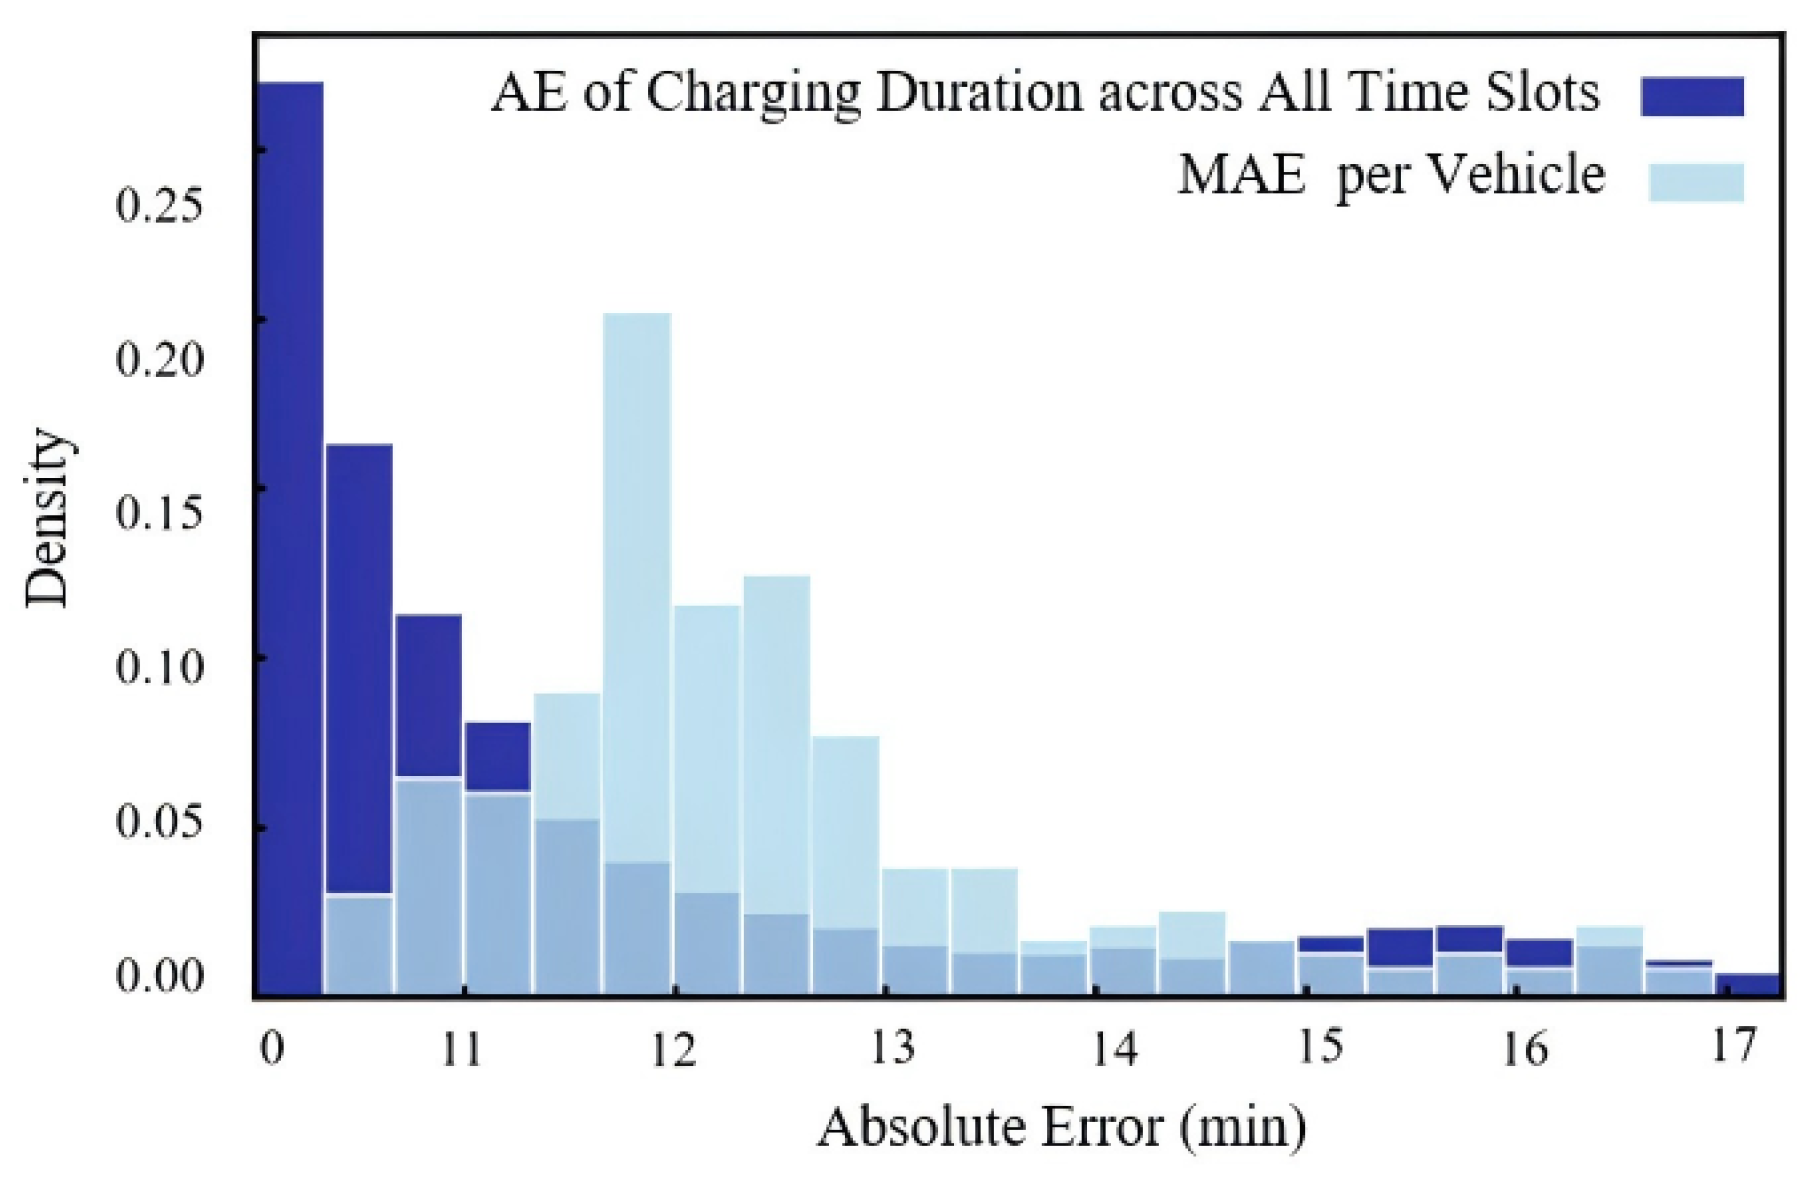
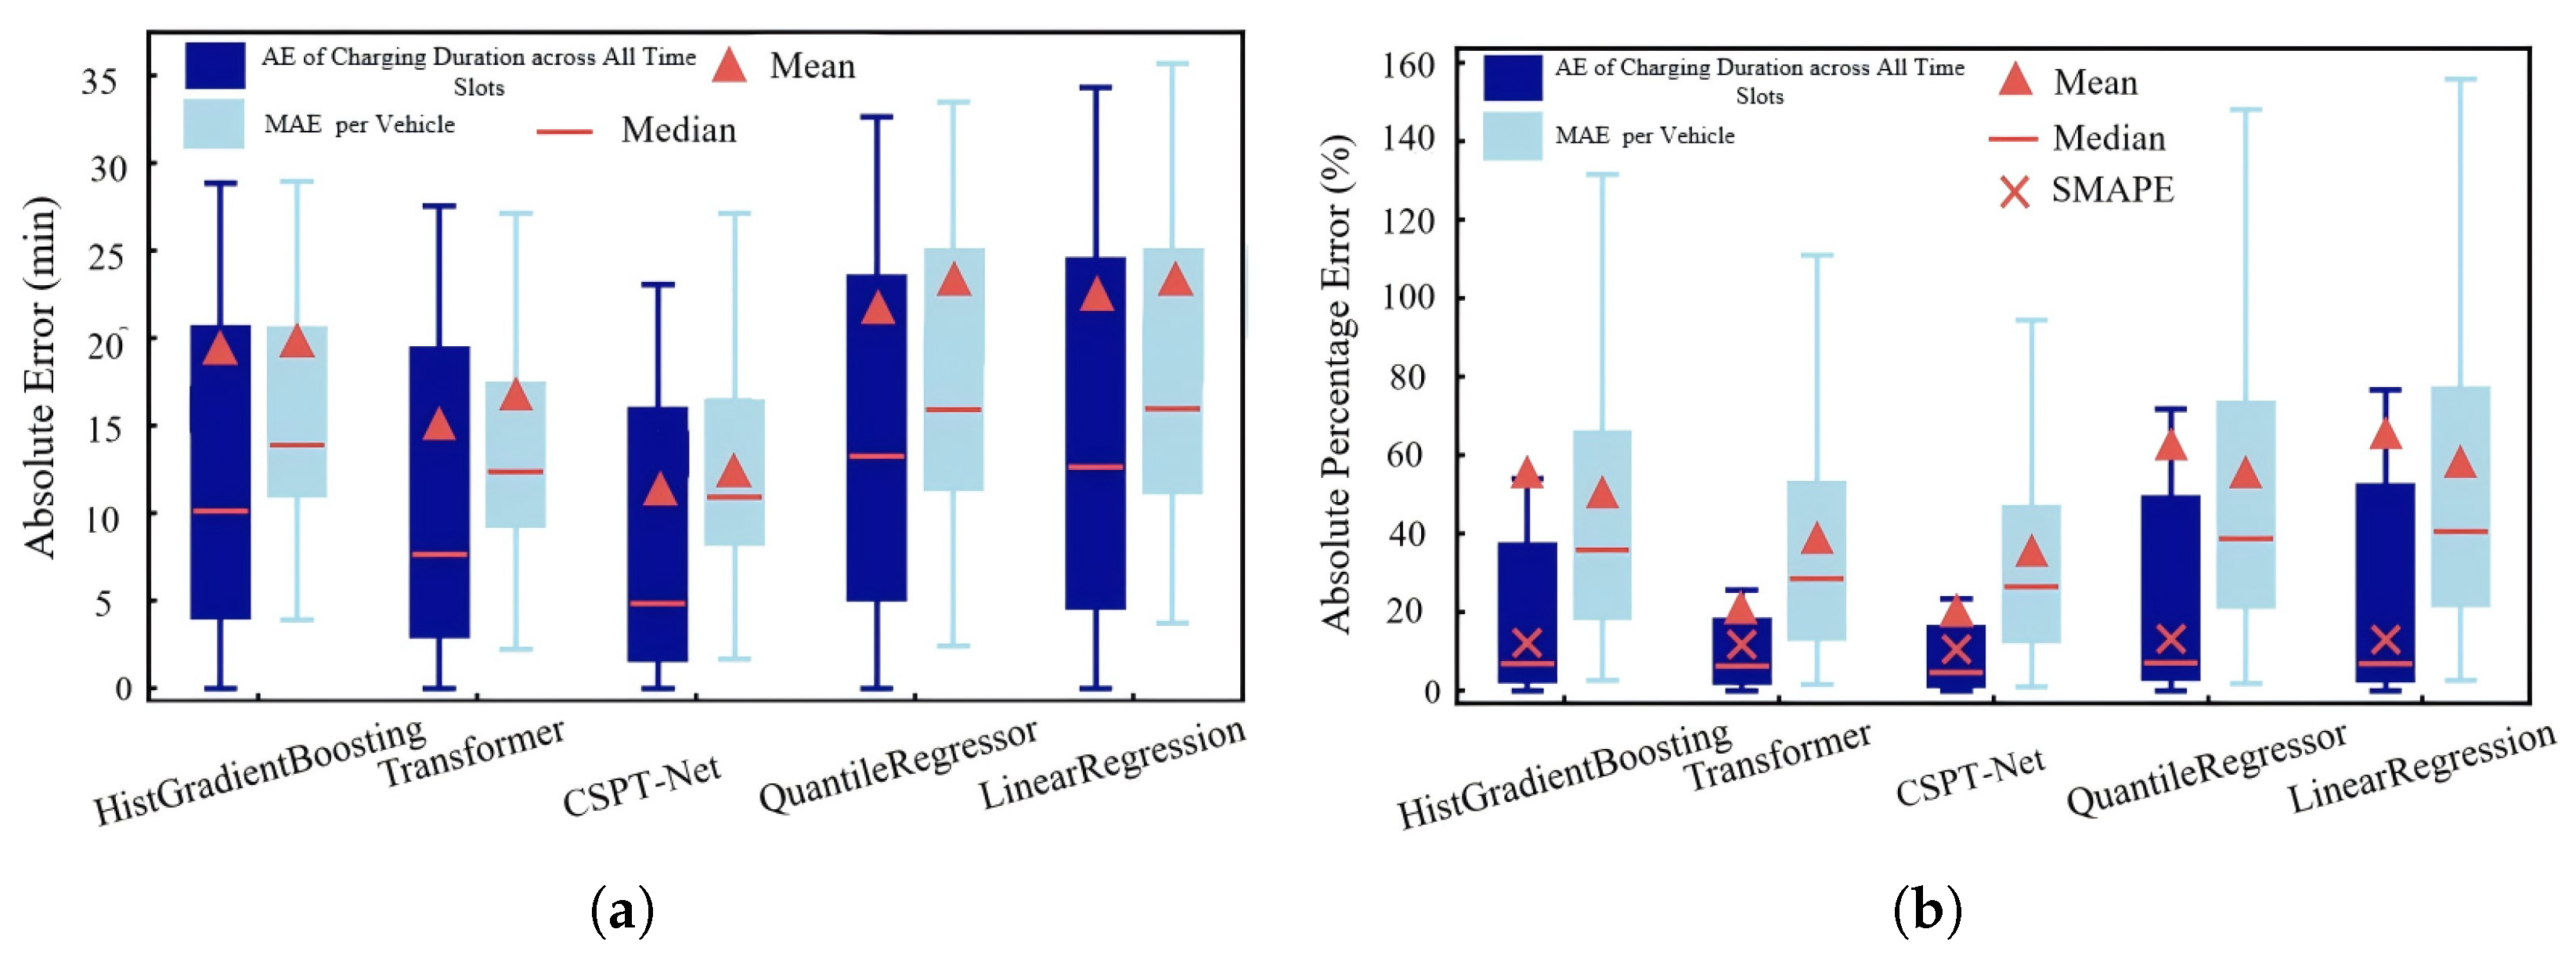
Based on the observed data characteristics and trends,
Figure 10 illustrates the model’s predictive behavior at a microscopic level through a dual-scale distribution analysis of the Absolute Error (AE) and MAE. Similarly,
Figure 11 uses boxplots to display the statistical distribution of errors, providing a comprehensive assessment from the perspectives of Absolute Error and Absolute Percentage Error. A combined analysis of these two figures further confirms the model’s superior ability in spatio-temporal feature extraction and its strong adaptability to anomalous patterns, as reflected by its consistent performance across both micro-level structures and macro-level statistical distributions.
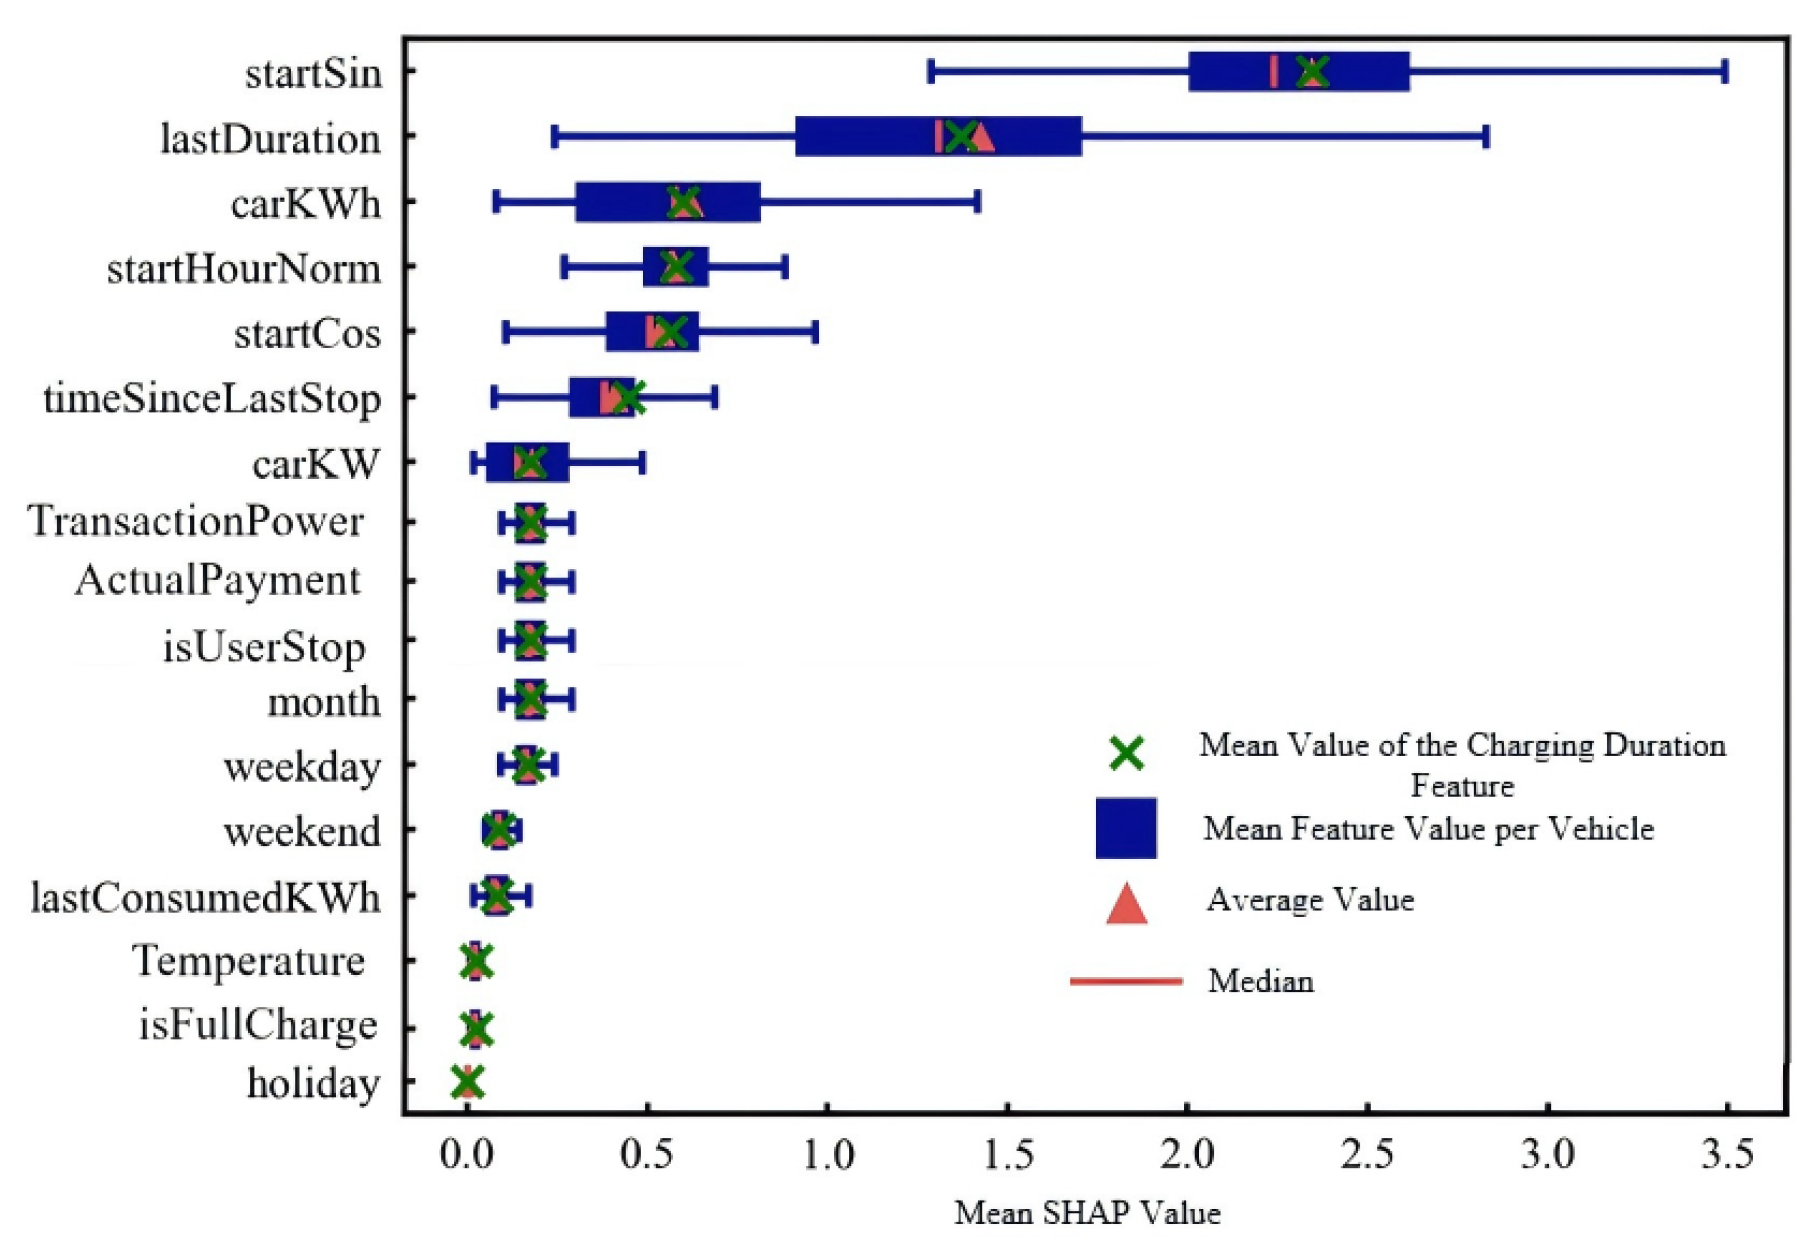
According to the Shapley value definition, the SHAP value of a feature represents the weighted average of its marginal contributions across all possible feature subsets. The SHAP value
for feature
i is calculated as
Figure 12 presents the distribution of mean SHAP values for all input features using boxplots. Notably, the features startSin and lastDuration display substantially wider value ranges and higher average contributions. This prominence can be attributed to inherent EV user behavior patterns rather than to any inadequacy in the model’s ability to exploit other input features. startSin encodes the circadian rhythm of human activity and functions as a primary physical constraint governing charging initiation. Similarly, lastDuration serves as a high-fidelity proxy for individual charging habits and battery-capacity limitations, effectively capturing the inertial characteristics of charging behavior. However, this does not imply that other temporal signals are negligible. As reflected in the long-tail portion of the distribution, features such as weekend, holiday, and temperature provide non-trivial marginal contributions, indicating that the model effectively incorporates these variables as scenario-specific refinement signals.
3.2.4. Ablation Study
To rigorously evaluate the effectiveness of each core component in the CSPT-Net architecture and quantify their individual contributions to overall model performance, a series of ablation experiments was performed. Following the principle of controlled experimentation, each key module—namely, the one-dimensional convolution (1D-CNN), Sparse Attention, and Periodic Encoding—was systematically removed or replaced to assess its independent impact.
To ensure experimental fairness and result validity, all model variants were trained on the same dataset using identical hyperparameters and training protocols as the full CSPT-Net, differing only by the ablated component. The performance comparison of these model variants on the test set is summarized in
Table 6.
Quantitative analysis shows that the complete CSPT-Net consistently outperforms all ablated variants across all test datasets, emphasizing the necessity of synergy among its core components. A detailed analysis of individual module contributions reveals that removing either the 1D-CNN or the Periodic Encoding module substantially increases prediction error, with MAE rising to 13.58 and 13.92 min, respectively. This finding confirms the pivotal role of the 1D-CNN in capturing fine-grained local temporal dependencies and the importance of the Periodic Encoding module in modeling multi-scale periodic patterns. Second, replacing Sparse Attention with standard global attention dramatically increased training time from 763 to 1810 s, without improving predictive accuracy. This result highlights the inherent advantage of Sparse Attention in improving computational efficiency while maintaining model accuracy.
In summary, the ablation study provides clear empirical evidence for both the independent contributions and the synergistic effects of each CSPT-Net component. Specifically, the 1D-CNN improves local feature extraction, Sparse Attention enhances computational efficiency without sacrificing accuracy, and the Periodic Encoding module allows the model to accurately capture multi-level temporal regularities. Collectively, these findings validate the theoretical foundation and architectural robustness of the proposed CSPT-Net, confirming its reliability and effectiveness in complex time-series prediction tasks.
3.2.5. Impact of Environmental Factors
To further evaluate the robustness of CSPT-Net and its capability to incorporate exogenous variables, we conducted a supplementary experiment by integrating historical meteorological data into the input features. While the primary model relies on historical charging records, environmental factors such as temperature are known to influence EV charging behavior due to battery performance variations and cabin climate control needs [
33].
For this experiment, we collected daily average temperature data corresponding to the spatiotemporal range of our charging dataset. The temperature feature was normalized and concatenated with the existing input vector (denoted as
in
Figure 3) before being fed into the 1D-CNN module. We compared the performance of the standard CSPT-Net (baseline) with the temperature-enhanced version (CSPT-Net+Temp) on the same test set.
Table 7 summarizes the comparative results. The inclusion of temperature data led to a marginal but consistent improvement in predictive accuracy. Specifically, the MAE decreased from 12.21 min to 12.15 min, and the MAPE reduced from 18.40% to 18.32%.
The results indicate that while historical charging patterns remain the dominant predictor, explicit environmental information provides supplementary context that helps the model better capture fluctuations associated with weather-sensitive demand This experiment confirms that the proposed CSPT-Net architecture is flexible and extensible, capable of effectively fusing multi-modal data sources to further enhance forecasting precision.
4. Discussion
The experimental results presented in
Section 3 demonstrate that CSPT-Net effectively addresses the challenges of accuracy and efficiency in EV charging demand forecasting. Our findings can be interpreted in the context of existing literature as follows.
First, in terms of predictive accuracy, CSPT-Net achieved an MAE of 12.21 min, significantly outperforming the standard Transformer baseline (MAE 14.27 min). This improvement contrasts with previous studies utilizing standard Transformers, such as [
20], which effectively captured long-range dependencies but lacked explicit mechanisms for local periodic fluctuations. Our model addresses this limitation by incorporating the Periodic Time Encoding module, which explicitly captures multi-scale temporal patterns.
Second, regarding computational efficiency, our model demonstrated a 58% reduction in training time compared to the standard Transformer. This result validates the theoretical advantage of the sparse attention mechanism discussed in recent surveys [
27]. Unlike the quadratic complexity (
) inherent in standard self-attention [
28], the sparse attention module in CSPT-Net effectively reduces the computational burden, making it more suitable for real-world applications where rapid model retraining is essential.
Third, the supplementary experiment in
Section 3.2.5 provides preliminary evidence of the model’s ability to incorporate exogenous variables. When temperature information was included, CSPT-Net achieved a consistent improvement in accuracy (MAE reduced to 12.15 min;
Table 7), suggesting that the architecture can effectively integrate multi-modal inputs. Although factors such as traffic intensity and dynamic pricing are also known to influence EV charging behavior, they were not included in this study because high-resolution, time-aligned datasets for the study region were not available within the current data scope, rather than due to any limitation of the model itself.
However, while our model outperforms traditional machine learning baselines [
24] in handling non-linear dynamics, these traditional models still possess advantages in interpretability. Although the SHAP analysis in
Section 3.2.3 provides insights into feature importance, the internal decision-making process of the deep network remains less transparent than decision tree-based models.