You are currently viewing a new version of our website. To view the old version click .
Applied Sciences
  • Article
  • Open Access

16 November 2025

Safety and Functional Properties of Rapeseed Honey Regarding Its Geographical Origin

,
,
,
,
and
1
Department of Chemistry and Food Toxicology, Faculty of Technology and Life Sciences, University of Rzeszów, Ćwiklińskiej 1a, 35-601 Rzeszow, Poland
2
Department of Plant Products Technology and Nutrition Hygiene, Faculty of Food Technology, University of Agriculture in Krakow, Balicka 122, 30-149 Krakow, Poland
*
Author to whom correspondence should be addressed.
This article belongs to the Special Issue The World of Bees: Diversity, Ecology and Conservation

Abstract

Rapeseed (Brassica napus) honey is a popular monofloral honey produced in Poland and is often suspected of pesticide-residue contamination due to the extensive use of pesticides in oilseed rape cultivation. Moreover, because of the presence of fatty acids, it can absorb hydrophobic polycyclic aromatic hydrocarbons (PAHs) that occur as environmental pollutants. Thus, the aim of the study was to assess the safety of rapeseed honey in terms of pesticide residues and PAHs contamination in relation to its functional properties, including antioxidant properties, polyphenol profile, protein content, and enzymatic activity. Local honey samples originating from Lublin (five) and Podkarpackie (five) Voivodeships were compared with five samples purchased from commercial sources. None of 58 pesticides, including carbamates, organophosphorus, organochlorines, pyrethroids, and neonicotinoids, were detected in the tested honey samples. All samples were also completely free of four major harmful PAHs legally limited in food (benzo[a]pyrene, benz[a]anthracene, chrysene, and benzo[b]fluoranthene). Among other PAH compounds, seven were detected accidentally in samples of various origins. The total phenolic content and antioxidant activity determined by DPPH, FRAP, and CUPRAC assays were relatively uniform among the groups studied. High-performance thin-layer chromatography (HPTLC) revealed characteristic fingerprints including kaempferol, ferulic acid, and caffeic acid, providing a specific profile that can be considered a marker of rapeseed honey authenticity and used to detect adulteration. Protein content ranged from 18 to 85 mg/100 g, remaining within the range typical for light honeys, while α-glucosidase activity was significantly reduced in commercial products, reflecting the effects of processing and storage. The study confirmed the high functional value and safety of rapeseed honey offered on the South-Eastern Poland market, which confirm the cleanliness of the bees’ habitat in terms of pesticide residues and PAHs pollution. Nevertheless, regular monitoring of pesticide residues and PAHs in honeys from agricultural areas remains advisable.

1. Introduction

Rapeseed honey, derived from the nectar of Brassica napus (rapeseed), is a significant product in both apiculture and agriculture due to the crop’s extensive cultivation for oil and animal feed. The honey is characterized by its light color, rapid crystallization, and mild flavor, making it popular in many regions. The mass flowering of rapeseed provides abundant forage for honeybees, supporting colony development and commercial honey production [,,]. However, the intensive agricultural practices associated with rapeseed cultivation, particularly the use of pesticides and fertilizers, have raised concerns about the potential transfer of harmful chemicals into honey, with implications for both bee health and human food safety. In bees, such exposure can cause oxidative stress and induce the expression of antioxidant enzymes (e.g., SOD, CAT) and detoxification genes, consequently weakening immunity and disrupting physiological functions [,]. Among these pesticides, neonicotinoid insecticides act as potent neurotoxins that overstimulate nicotinic acetylcholine receptors, leading to impaired neural transmission, oxidative imbalance, and behavioral alterations such as reduced learning ability and foraging efficiency []. These sublethal effects cumulatively compromise colony stability and are considered one of the contributing factors to colony collapse. Furthermore, recent studies have reported high-risk synergistic interactions in pesticide mixtures, where the toxicity of neonicotinoids markedly increases in the presence of certain fungicides [].
However, one of the key problems related to the production of rapeseed honey is its potential contamination with chemicals originating from human activity, such as toxic elements [,], pesticide residues [,,] and polycyclic aromatic hydrocarbons (PAHs) [,,]. Although the pesticide residue content in bee products is well documented [], only a few countries have performed such analyses on varietal honeys [,]. Studies on rapeseed honey increasingly identify the presence of chlorinated pesticide (OCP) residues and organophosphate (OP) residues, the use of which in cultivated areas near apiaries can lead to their accumulation in bee products [,,]. Witczak and Ciemniak [] conducted an analysis of the content of selected persistent organic pollutants (POPs) in various types of honey available on the Polish market, demonstrating the presence of, among others, DDT, aldrin, endrin, and dieldrin—substances banned but still present in the environment due to their high durability. The finding of residues of these compounds in rapeseed honey suggests that bees can transfer pesticides not only from currently sprayed fields, but also from soils and plants containing historical residues of these substances. In turn, organophosphate pesticides, such as chlorpyrifos, parathion, or malathion, are still commonly used in intensive agricultural production. These substances act as acetylcholinesterase inhibitors, and their chronic consumption can lead to symptoms of neurotoxicity, hormonal disorders, and developmental problems. Surma et al. [] demonstrated the presence of numerous pesticide residues in honeys available on the European market, including products from rapeseed crops. Pyrethroids (e.g., permethrin) and neonicotinoids (e.g., imidacloprid) were often detected, which are particularly dangerous not only to human health, but also to the bees themselves—contributing, among others, to the phenomenon of colony collapse disorder (CCD). Kędzierska-Matysek et al. [] also confirmed the presence of both pesticide residues and toxic elements in domestic varietal honeys, including rapeseed honey.
Although pesticides remain one of the main chemical threats to honey quality, pollutants of dust and exhaust origin are no less important, among which polycyclic aromatic hydrocarbons (PAHs) attract the special attention of researchers. Polycyclic aromatic hydrocarbons (PAHs) are a group of organic compounds with multiple fused aromatic rings, known for their persistence in the environment and potential health risks. They are primarily introduced into honey through environmental pollution, including incomplete combustion of organic materials such as coal, oil, and biomass, as well as industrial processes and vehicular emissions [,]. Honey can become contaminated with PAHs from atmospheric deposition on plants, which bees then collect, or directly from contaminated water and soil [,,]. Due to their durability and lipophilic properties, PAHs can be easily transferred by bees to the hive and accumulate in honey. In studies conducted by Ciemniak et al. [], the presence of many representatives of this group of compounds in honey samples was demonstrated, including the particularly dangerous benzo[a]pyrene—a substance classified by IARC as a class 1 carcinogen. It was also found that the level of PAHs contamination in honey may significantly depend on the location of the apiary—honey from urbanized and industrialized areas shows significantly higher concentrations of these compounds than honey from rural and forest areas. PAHs not only negatively affect the quality of honey, but may also pose a threat to the health of consumers, especially in the case of long-term consumption. For this reason, their determination and monitoring are becoming an increasingly important element of assessing the safety of bee products.
The sources of contamination are complex and include, among others, direct use of plant protection products in agriculture, the impact of industrial areas, and traffic emissions, as well as general air and soil pollution. Bees, as foragers interacting with many environmental elements, can transfer toxic substances to the hive, which makes honey a sensitive indicator of environmental quality. From the point of view of consumer safety, standards specifying permissible levels of pesticide residues (MRLs), established by, among others, the European Union, are of key importance. Regular monitoring of the presence of contaminants and compliance with regulatory provisions are essential to ensure food safety and maintain confidence in bee products [,,]. Rapeseed honey production is closely linked to the agricultural practices used in rapeseed cultivation. Conventional systems employ a range of pesticides and fertilizers, leading to the potential transfer of harmful chemicals—especially neonicotinoids and fungicides—into honey via foraging bees. Advances in analytical detection and integrated management practices are helping to mitigate these risks, but continued research and region-specific monitoring are essential to ensure the long-term safety and sustainability of rapeseed honey production [,,].
The aim of this study was to comprehensively assess the safety of rapeseed honey in terms of pesticide residues and PAHs contamination in relation to its functional properties, including antioxidant properties, polyphenol profile, protein content, and enzymatic activity. An additional objective was to determine the influence of the ecological quality of bee habitats on honey quality. For the first time, the HPTLC method was used to compare multiple samples of rapeseed honey and to search for potential markers of authenticity.

2. Materials and Methods

2.1. Chemicals

Analytical standards and reagents were obtained from Sigma Aldrich (St. Louis, MO, USA), solvents were obtained from CHEMPUR (Piekary Śląskie, Polska). All used chemicals were at least of analytical grade.

2.2. Material

The research material consisted of 10 local rapeseed honey samples collected from small apiaries located in the Lublin (n = 5) and Podkarpackie (n = 5) provinces in South-Eastern Poland, as well as honeys (n = 5) available in retail sale distributed by Polish commercial apiaries. The samples were collected in the 2023 harvesting season. Until analysis, honey samples were stored in room conditions (21 °C ± 1 °C), in a dark place. The botanical origin of the samples was determined based on the beekeepers’ declarations, taking into account the location of the hives and the dominant nectar-bearing vegetation in a given harvest period.

2.3. Quality Evaluation Regarding Legal Requirement for Honey

The determination of basic physicochemical properties of honey included the measurement of pH, titratable acidity, specific conductivity, and water content, using established analytical procedures []. The pH measurement was carried out using a pH meter after dissolving 10 g of honey in 75 mL of distilled water at room temperature. Titratable acidity was determined by titrating a 20% aqueous solution of honey with a NaOH solution (0.1 M) until pH = 8.3 (Seven Compact pH-meter, Mettler Toledo, Columbus, OH, USA); the result was expressed in mval/kg. The specific conductivity was determined by conductometry (CP-401 conductometer, Elmetron, Zabrze, Poland) after immersing the electrode in a 20% aqueous solution of honey; the result was given in mS/cm. The water content was determined refractometrically—after placing a honey sample on the refractometer prism (HI96800, Hanna Instruments, Woonsocket, RI, USA), the value was read, and the water content was calculated according to Formula (1):
100 − read value = % water
Additionally, the color of honey was determined by measurement of decrystallized honey samples, using a honey color photometer (Honey Color Photometer HI 96,785, Hanna Instruments, Woonsocket, RI, USA). The result was read on the Pfund scale, in the range of 0–150 mm.

2.4. Detection of Pesticide Residues and PAHs

2.4.1. Sample Preparation

The extraction process was based on the modified QuEChERS method that was previously developed and validated by the authors []. In summary, 1 g of the sample was weighed into a 50 mL centrifuge tube, and all internal standards were added, as well as 5 mL of deionized water. The samples were then subjected to a mixing process, and left to stand for a period of 15 min at room temperature. Subsequently, 10 mL of acetonitrile was added to the mixture, which was then vigorously shaken for a period of 1 min. In the subsequent stage of the experiment, 1 g of NaCl and 4 g of MgSO4 were added to each sample, and the tubes were vigorously shaken for a further 1 min. The tubes were then subjected to a centrifugation process at 8700 RCF for 15 min. A volume of 8 mL of the superior phase was transferred to a 15 mL PP tube containing 200 mg of PSA and 300 mg of C18. Following a 30 s shaking period, the sample was centrifuged for 15 min at 5000 RCF. Thereafter, 7 mL of the extract was divided into three portions of 2 mL each, and evaporated to dryness under a stream of N2.

2.4.2. GC-MS Analyses

The residues after evaporation were dissolved in 0.25 mL of hexane (PAH analysis) or acetonitrile (pesticide analysis), the mixture was transferred into an autosampler vial, and 1 μL of the extract was analyzed with GC-MS. The analysis was carried out on a Varian 4000 GC/MS (Varian, Inc., Palo Alto, CA, USA). Injections were realized by a CP-1177 Split/Splitless Capillary Injector at a temperature of 270 °C for both analyses and a volume of 1.0 µL (splitless mode). The DB-5MS column (30 m × 0.25 mm × 0.25 μm; Agilent Technologies, Santa Clara, CA, USA) was used for separating analytes with the following temperature program: initial temperature 50 °C (1 min)–15 °C (1 min)–300 °C (6.0 min) for PAHs and 70 °C (3 min)–30 °C/min–150 °C (1 min)–10 °C/min–280 °C (5 min) for pesticides. Helium 5.0 (Linde Gas, Poland) was used as the GC carrier gas at a flow rate of 1.0 mL/min. The ion trap mass spectrometer was operated in a selected ion monitoring mode (SIM), scanning from 45 to 500 m/z. Analyzed compounds were identified according to their qualitative ions and retention times. The trap and the transfer line temperatures were set at 180 and 230 °C, with the ion trap emission current set at 15 µA. Acquisition and processing of data were performed using Varian Start Workstation software and NIST 2.0 library (National Institute of Standards and Technology, Gaithersburg, MD, USA). MS1 Minishaker (IKA, Königswinter, Germany) and MPW 350 R Centrifuge (MPW Med. Instruments, Warsaw, Poland) were employed during the sample preparation. AccublockTM (Labnet, Edison, NJ, USA) with nitrogen 5.0 (Linde Gas, Munich, Germany) was used to evaporate the solvent and concentrate the extracts. The construction of the calibration curve was achieved by plotting the ratio of the peak area, divided by the peak area of the suitable internal standard, as a function of the analyte concentration. The LOD and LOQ values for PAHs were <0.3 µg/kg and <0.8 µg/kg, respectively, while for pesticide residues, the LOD and LOQ values were 0.01 mg/kg and <0.03 mg/kg, respectively. All validation parameters for PAHs are presented in Table S1, and for pesticide residues in Table S2.

2.4.3. HPLC-DAD Analysis

The analysis of neonicotinoids was conducted as follows: firstly, the residues (3 mL of the above-mentioned sample after evaporation) were dissolved in 1 mL of acetonitrile. The mixture was then filtered through a nylon filter and transferred into an autosampler vial. Finally, 20 μL of the extract was analyzed with HPLC-DAD. Neonicotinoid qualitative and quantitative analyses were carried out using HPLC-DAD LaChrom ELITE (Merck KGaA, Darmstadt, Germany). The measurement parameters are outlined below: eluent: 0.2% FA in water/ACN 4:6 (v/v), flow rate: 0.7 mL/min, DAD detection from 190 to 440 nm observed at 245, 254, and 270 nm, column: RP-18 Lichrospher (250 × 4 mm, 5 µm particle size) (Merck, Germany), sample injection volume: 20 µL. LOD and LOQ values for neonicotinoids were <3.1 µg/kg and <9.3 µg/kg, respectively (Table S3).

2.5. Antioxidant Activity and Total Phenolic Content in Honey

The FRAP (Ferric-Reducing Antioxidant Power) assay was carried out according to a previously described procedure []. Briefly, 20 µL of an aqueous honey solution (1 g/5 mL) and 180 µL of FRAP reagent were added to each well of a microplate. After incubation for 10 min at 37 °C, the absorbance was read at 593 nm. The results were presented as mmol of Trolox/g of honey, based on a calibration curve (y = 0.152x; R2 = 0.9998) measured in a microplate reader (EPOCH 2 microplate spectrophotometer, BioTek, Winooski, VT, USA).
The DPPH (2,2-diphenyl-1-picrylhydrazyl) assay was performed according to a previously described procedure []. Briefly, 20 µL of a 20% (w/v) honey solution and 180 µL of 0.5 mM DPPH solution were added to each well. The mixture was incubated for 30 min in the dark, and the absorbance was measured at 517 nm against methanol as a blank. Results were expressed as the percentage of free radical inhibition according to Formula (2)
% inhibition = [(Ak − Ap)/Ak] × 100
where Ak—absorbance of the control sample, Ap—the test sample.
Additionally, results were also counted per µmol Trolox/100 g of honey according to the calibration curve (y = 15.553x; R2 = 0.9982)
The CUPRAC (Cupric Ion Reducing Antioxidant Capacity) assay was performed according to the procedure described by []. Briefly, this involved 10 µL of the sample (20% honey solution), 40 µL of 10 mM CuCl2, 50 µL of 7.5 mM neocuproine, and 50 µL of 1 M ammonium acetate. Incubation was carried out for 30 min in the dark. Results were expressed as µmol Trolox/g honey, according to the calibration curve (y = 0.026x; R2 = 0.9973).
Total phenolic compounds (TPC) were assessed using the modified Folin–Ciocalteu method []. To 20 µL of 20% honey solution, 100 µL of Folin–Ciocalteu reagent and 80 µL of 7.5% sodium carbonate solution were pipetted into each well. Incubation was carried out for 1 h in the dark, and then absorbance was measured at 760 nm. Phenolic content was expressed as mg gallic acid (GAE)/g honey using the calibration curve (y = 0.336x; R2 = 0.9914).

2.6. Honey Protein and Enzymes

The protein content of honey samples was determined using the Bradford method using multi-well plates based on the previously described procedure []. To each well, 20 µL of 20% honey solution (w/v) and 200 µL of Bradford reagent 5-fold diluted (Merck KGaA, Darmstadt, Germany) were added. Water was used instead of a honey solution in the control. The plate was shaken and left for 5 min at room temperature. Absorbance was then read at 595 nm against a blank. Protein content (mg/g honey) was calculated based on a calibration curve determined for bovine albumin in the range of 0.67–8 µg/20 µL sample (regression equation: y = 0.1264x; R2 = 0.97).
The activity of three acid glycosidases (N-acetyl-β-D-glucosaminidase (NAG), α-glucosidase (α-GLU), and β-galactosidase (β-GAL)) was evaluated by the previously described procedure [] for a freshly prepared honey solution 0.2 g/mL water. The assay was performed on a 96-well plate. In total, 25 µL of honey solution was measured into the plate well, and 25 µL of the appropriate substrate was added. For the blank test, 25 µL of water was used instead of a honey solution. The plate was incubated for 60 min at 37 °C, after which 250 µL of stopper (0.5M Na2CO3/NaHCO3 buffer at pH 10.5) was added, and absorbance at 400 nm was measured against distilled water using a BIOTEK microplate reader. The following substrates were used for enzyme analysis: NAG (1 mM p-nitrophenyl-2-acetamido-2-deoxy-β-D-glucopyranoside in 0.2 M citrate buffer pH 4.0), α-GLU (1 mM p-nitrophenyl-α-D-glucoside in 0.2 M citrate buffer pH 5.5), and β-GAL (1 mM p-nitrophenyl-β-D-galactoside in 0.2 M citrate buffer 4.0). Enzyme activity was expressed in mU/g units according to the Formula (3):
79.4 × ΔA (400 nm)
where ΔA = Asample − Acontrol.

2.7. HPTLC Polyphenolic Profile

Sample preparation for analysis by high-performance thin-layer chromatography (HPTLC) involved a multi-stage procedure for the extraction of phenolic compounds. In the first step, 10 g of honey was dissolved in 50 cm3 of water at pH 2, and then this solution was subjected to purification from sugars using Bekolut C18 columns, previously conditioned with 10 cm3 of methanol and 10 cm3 of acidified water (pH 2). After passing the sample solutions, the columns were washed with an additional 10 mL of water (pH 2), and then the phenolic compounds were eluted using 5 mL of methanol. In total, 4 µL were taken from the prepared extracts and applied to chromatographic plates (HPTLC Silica Gel 60 F254) using an automatic applicator (Linomat 5, Camag, Muttenz, Switzerland). Reference standards kaempferol, chrysin, caffeic acid, and ferulic acid (200 μg/mL in methanol) were applied to separate lanes in a volume of 2 μL. Chromatographic separation was carried out in an automatic developing chamber (ADC2, Camag, Muttenz, Switzerland) using the following solvent system: chloroform/ethyl acetate/formic acid (50:40:10 v/v/v). After the separation was completed, the plates were sprayed with p-anisoaldehyde reagent and then placed in 105 °C for 10 min to develop color. The plate was observed before and after derivatization using the HPTLC Visualizer 2 (Camag, Muttenz, Switzerland) in UV (366 nm) and the documentation of the results was carried out using Vision CATS software (Camag, Muttenz, Switzerland).

2.8. Statistical Analysis

All analyses were performed in triplicate unless otherwise indicated. Results are presented as mean ± standard deviation (SD). Statistically significant differences between individual samples and groups (L, P, and C) for specific parameters were calculated using one-way analysis of variance (ANOVA) (p < 0.05) followed by Tukey’s test. Pearson’s correlation coefficients were calculated to assess the relationships between all tested parameters. Statistical analyses were performed, and graphs were generated, using GraphPad Prism 10 software (GraphPad Software, Boston, MA, USA).

3. Results

3.1. Honey Quality Evaluation Regarding Legal Requirements

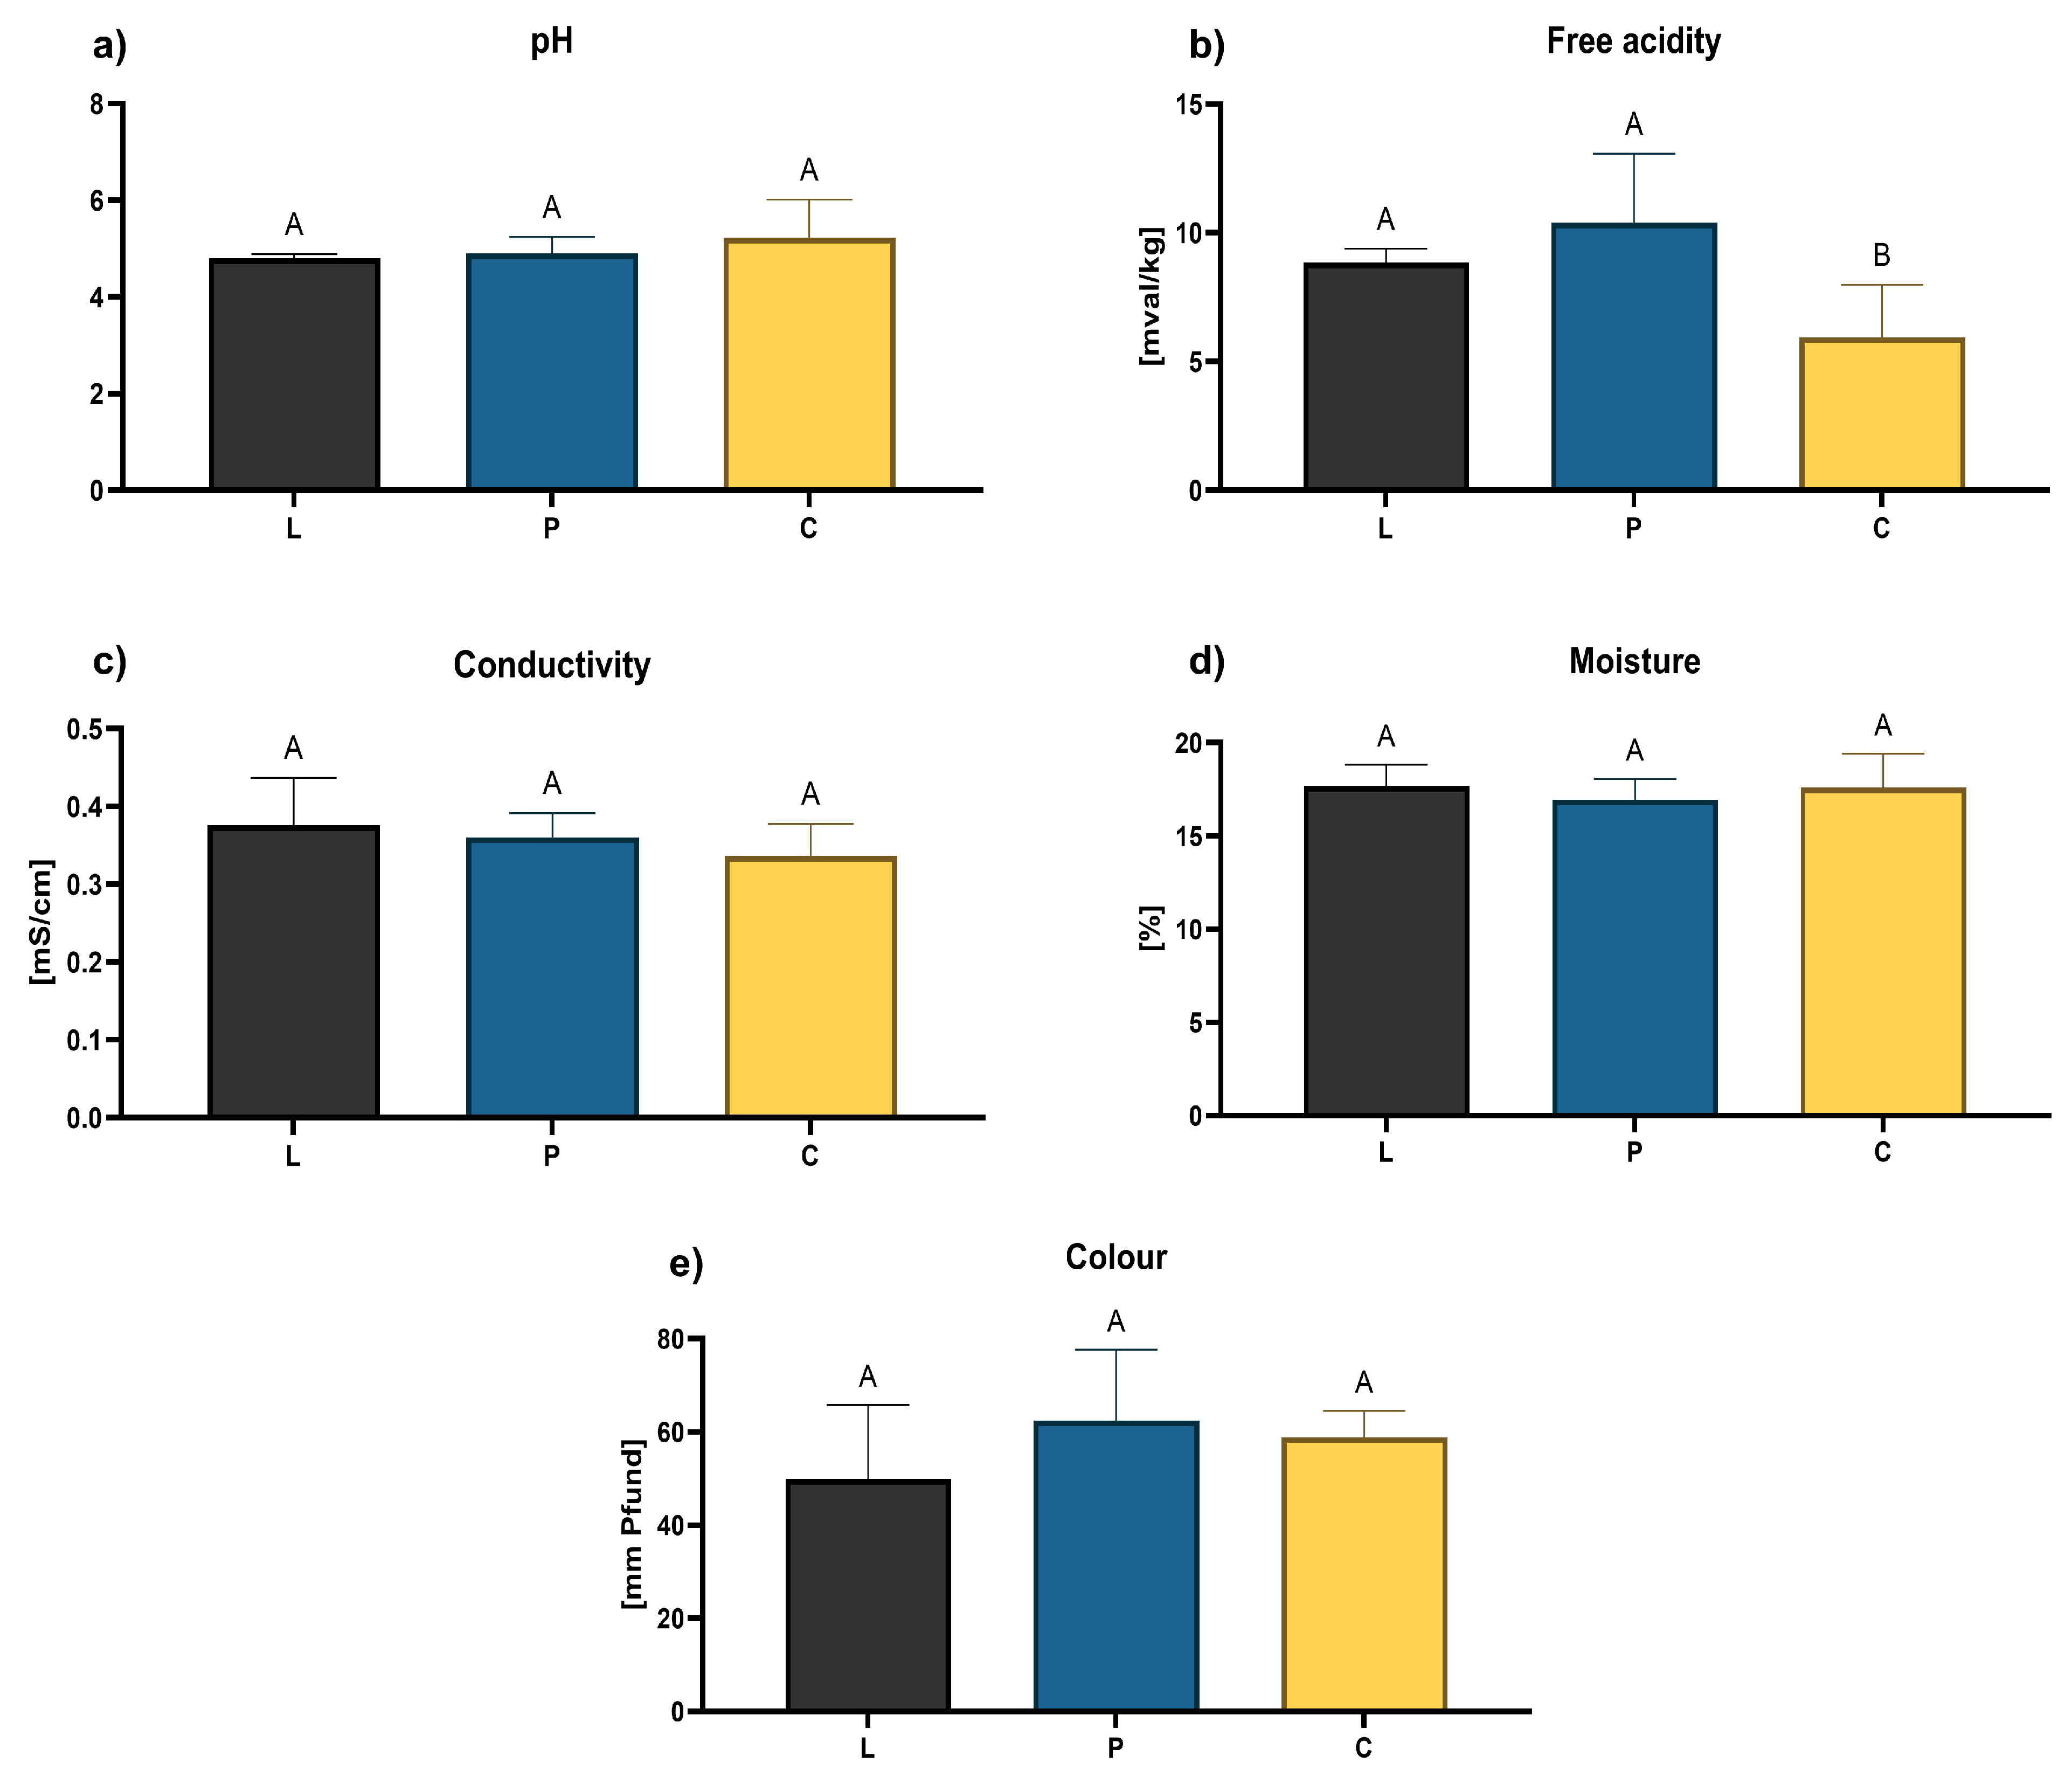
Analysis of the physicochemical parameters of rapeseed honeys from the Lublin and Podkarpacie region as well as commercial samples revealed that all tested samples had values within the typical range for nectar honeys (Table S4). In general, any statistical differences were observed between tested honey groups (Figure 1) regarding studied parameters, excluding free acidity, which was significantly higher in the Podkarpacie honeys. Lower values of this parameter were observed in the commercial samples, suggesting the influence of technological processes. Similar values of analyzed parameters tested by other authors [,,]. Moreover, the obtained values of individual parameters are within the limits specified in the Polish Regulation of the Minister of Agriculture and Rural Development of 3 October 2003 on detailed requirements for the commercial quality of honey [], which provides, among others, a maximum value of free acidity of up to 50 mval/kg and a specific conductivity for nectar honeys of no more than 0.8 mS/cm.
Figure 1. The results of physicochemical parameters analysis: pH (a), free acidity (b), conductivity (c), moisture content (d), color (e) of the tested groups of honey samples (L-Lublin province, P-Podkarpackie province and C-commercial). A, B—bars marked with different letters are statistically significantly different (Tukey’s honest significant difference test, p < 0.05).

3.2. Pesticide Residues and PAHs Detection

No pesticide residues were detected in any of the samples tested (Table S5). Another study showed some content of such residues in Polish rapeseed honeys, primarily thiacloprid, acetamiprid, carbendazim, and DMF, which, however, were determined within safe limits for human consumption []. Rapeseed is one of the most useful plants on which various plant protection products are commonly used. Studies on pesticide transfer in rapeseed plantations confirmed the presence of the same pesticides used for crop protection in the bodies of bees, brood, and also honey. However, the levels determined were low, and the calculated ADI values did not exceed 0.01% of the allowable values []. Previous studies have shown that intensive use of pesticides in rapeseed cultivation may be the source of their presence in honey, but a direct correlation has not been established [].
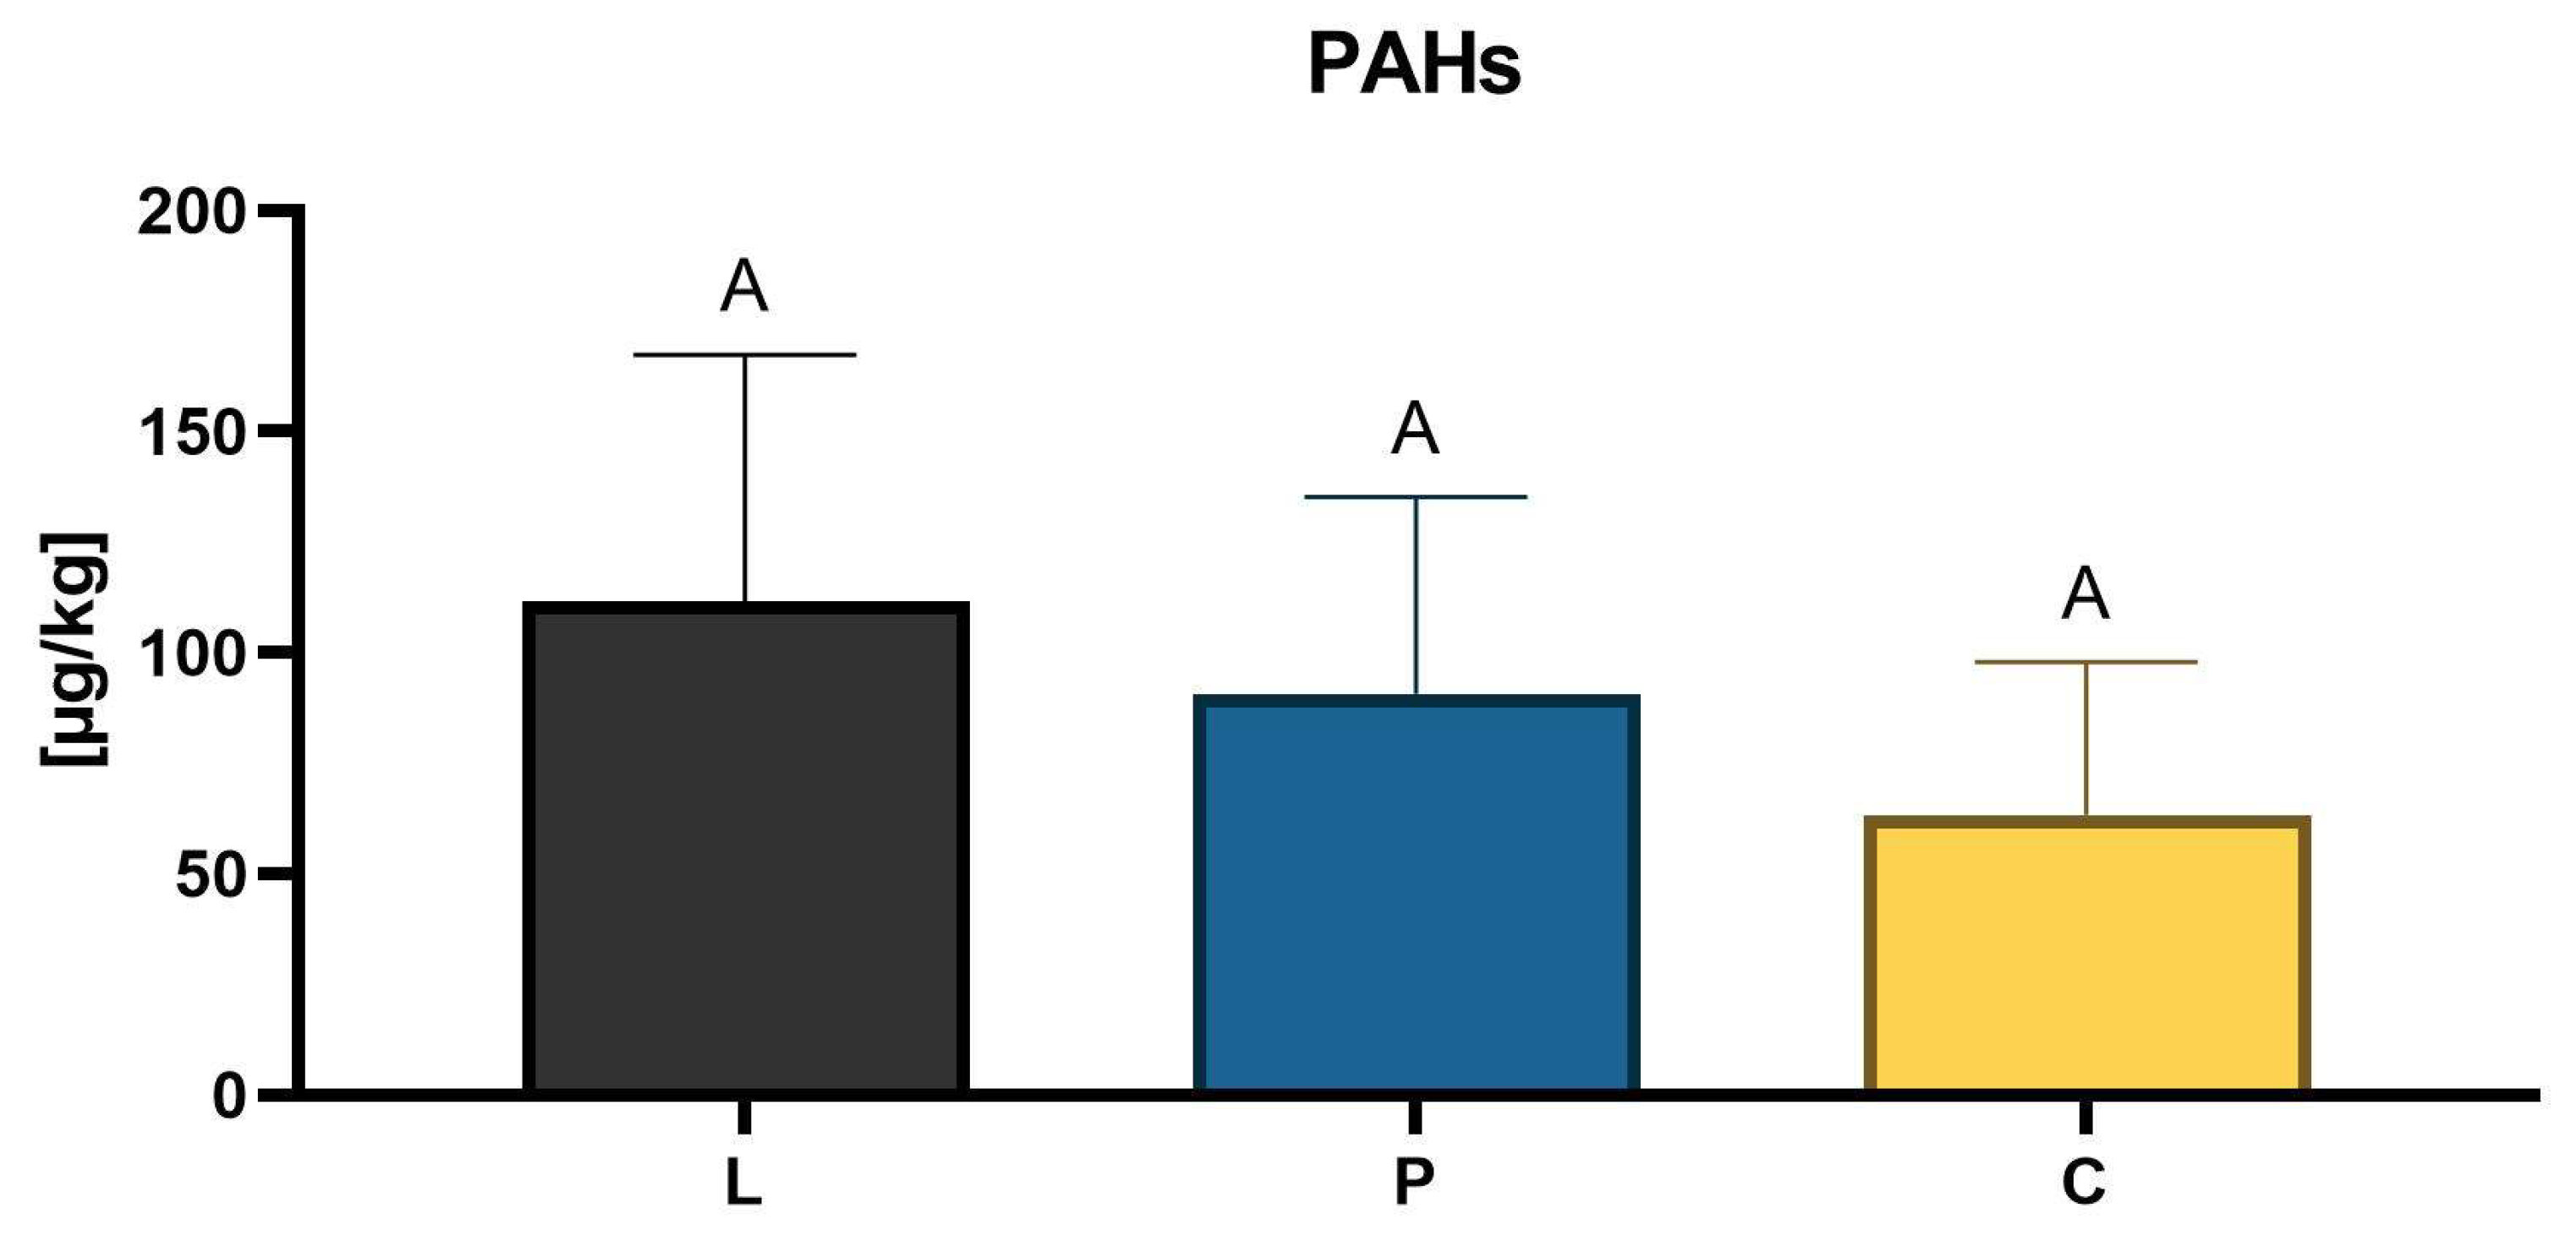
Among the 20 PAHs tested in honey, 4 major harmful PAHs legally limited in food (benzo[a]pyrene, benz[a]anthracene, chrysene, and benzo[b]fluoranthene) were not detected. However, seven other less-dangerous compounds were detected and the most common ones were phenanthrene (in 15 samples), fluoranthene (12 samples), and 2-methylnaphthalene (12 samples), followed by acenaphthene (7 samples), naphthalene (5 samples), 1-methylnaphthalene (4 samples), and fluorene (2 samples) (Table 1). The level of contamination was diversified between samples, i.e., phenanthrene was detected in the range from 12.6 to 97.7 µg/kg and 2-methylnaphthalene from 2.8 to 21 µg/kg, whereas fluoranthene was from 6.7 to 40.6 µg/kg. The contamination was observed in each tested group; the highest total PAHs content was detected in samples L1 and P2: 172 and 163.3 μg/kg, respectively. Taking into account the average of total PAHs contents for the three groups of honeys examined, the best results were achieved by commercial honeys (on average 63.4 µg/kg), followed by honeys from the Podkarpacie region (90.8 µg/kg) and the highest contents were recorded in honeys from the Lublin region (111.6 µg/kg) (Figure 2). However, none of the samples were detected with any of the following PAH4: benzo[a]anthracene, chrysene, benzo[b]fluoranthene, and benzo[a]pyrene, carcinogenic compounds whose content in many food products is legally limited []. According to EU Regulation 835/2011, the maximum permitted level of PAHs in food is limited from 1 to 5 µg/kg depending on the kind of food product, and no definitive safe intake level for PAHs separately or their mixtures has yet been established, complicating risk assessment and regulation []. The toxicity of PAHs varies greatly. Benzopyrene is classified as a proven carcinogen (IARC Group 1), while the others have significantly lower toxicity to humans (groups 2B and 3). However, the toxicity of PAHs is usually tested for individual compounds, whereas in combination, they can potentiate their effects. Additionally, these compounds exhibit wide spectrum of non-carcinogenic toxicity. For example naphthalene, which has been classified by the International Agency for Research on Cancer (IARC) as possibly carcinogenic (2B group) [], simultaneously is considered as a direct skin irritant and toxin that increases the incidence of cataracts, renal and hepatic impairment, respiratory ailments, diminished immune function, pulmonary dysfunction, and asthma-like symptoms []. It also could be a causative agent in the destruction of red blood cells if inhaled or ingested in high quantities. Furthermore, it has been demonstrated that PAH metabolites or derivatives can act as potent mutagens, even if primary compounds are not considered to have such properties. Furthermore, potential health risks arise from the ability of these compounds to accumulate in the body and from multiple dietary sources []. Even low concentrations of PAHs in honey may contribute to chronic exposure when consumed regularly alongside other contaminated foods, such as smoked meat products []. Therefore, a high total PAH sum in certain honeys might pose possible risks for human health.
Table 1. PAHs content [µg/kg] in analyzed rapeseed honey samples (L—Lublin province, P—Podkarpackie province, and C—commercial).
Figure 2. The concentration of PAHs in the tested groups of honey samples (L-Lublin province, P-Podkarpackie province and C-commercial). A—bars marked with the same letters are not statistically significantly different (Tukey’s honest significant difference test, p > 0.05).
PAH residues are of interest in honey quality control, and there are numerous scientific reports available on their content in honeys of different origins. A similar order of magnitude of PAH content in rapeseed honeys is given by Ciemniak et al. [] for honeys from Poland (West Pomerania): total PAHs between 20.91 and 66.14 μg/kg, including BaP up to 0.24 μg/kg. Other studies of Polish honeys from urbanized areas showed the sum of PAHs not exceeding 10 μg/kg []. For honeys from different parts of Europe, total PAH content was 0.76–18.98 μg/kg, including PAH4 between 0.1 and 1.32 μg/kg []. In the studies by Batelková et al. [], the PAH content in Czech honeys from direct sale from beekeepers ranged between 0.02 and 1.64 µg/kg, while in commercial honeys it ranged from 0.04 to 1.93 µg/kg. BaP was detected in amounts of up to 0.83 µg/kg.

3.3. Functional Properties of Honey

Honey is widely valued for its nutritional value and numerous health-promoting properties. However, they largely depend on the honey’s floral origin, which determines its chemical composition and biological activity. Therefore, contemporary research often focuses on identifying varietal markers, such as physicochemical, enzymatic, or chemical markers, which can be used to differentiate honeys’ botanical origins.
The most well-known functional properties of honey are its antioxidant and antimicrobial activities, which result from the bioactive components content strongly related to its botanical origin as well as being shaped by geographical variations []. Phenolic compounds promote, among other activities, high antioxidant activity, being capable of minimizing intracellular oxidative damage []. Rapeseed honey as a light honey is considered one of the varieties with weaker antioxidant properties, resulting from low polyphenols concentration compared to the darker varietal honeys produced in Central and Eastern Europe [,]. This is a varietal characteristic of rapeseed honey, related to the composition of rapeseed nectar, which bees collect after the winter season when the supply of other nutrients is limited []. Rapeseed honey also exhibits low enzymatic activity and a poorer mineral composition compared to other varieties, which is a result of its botanical origin [].
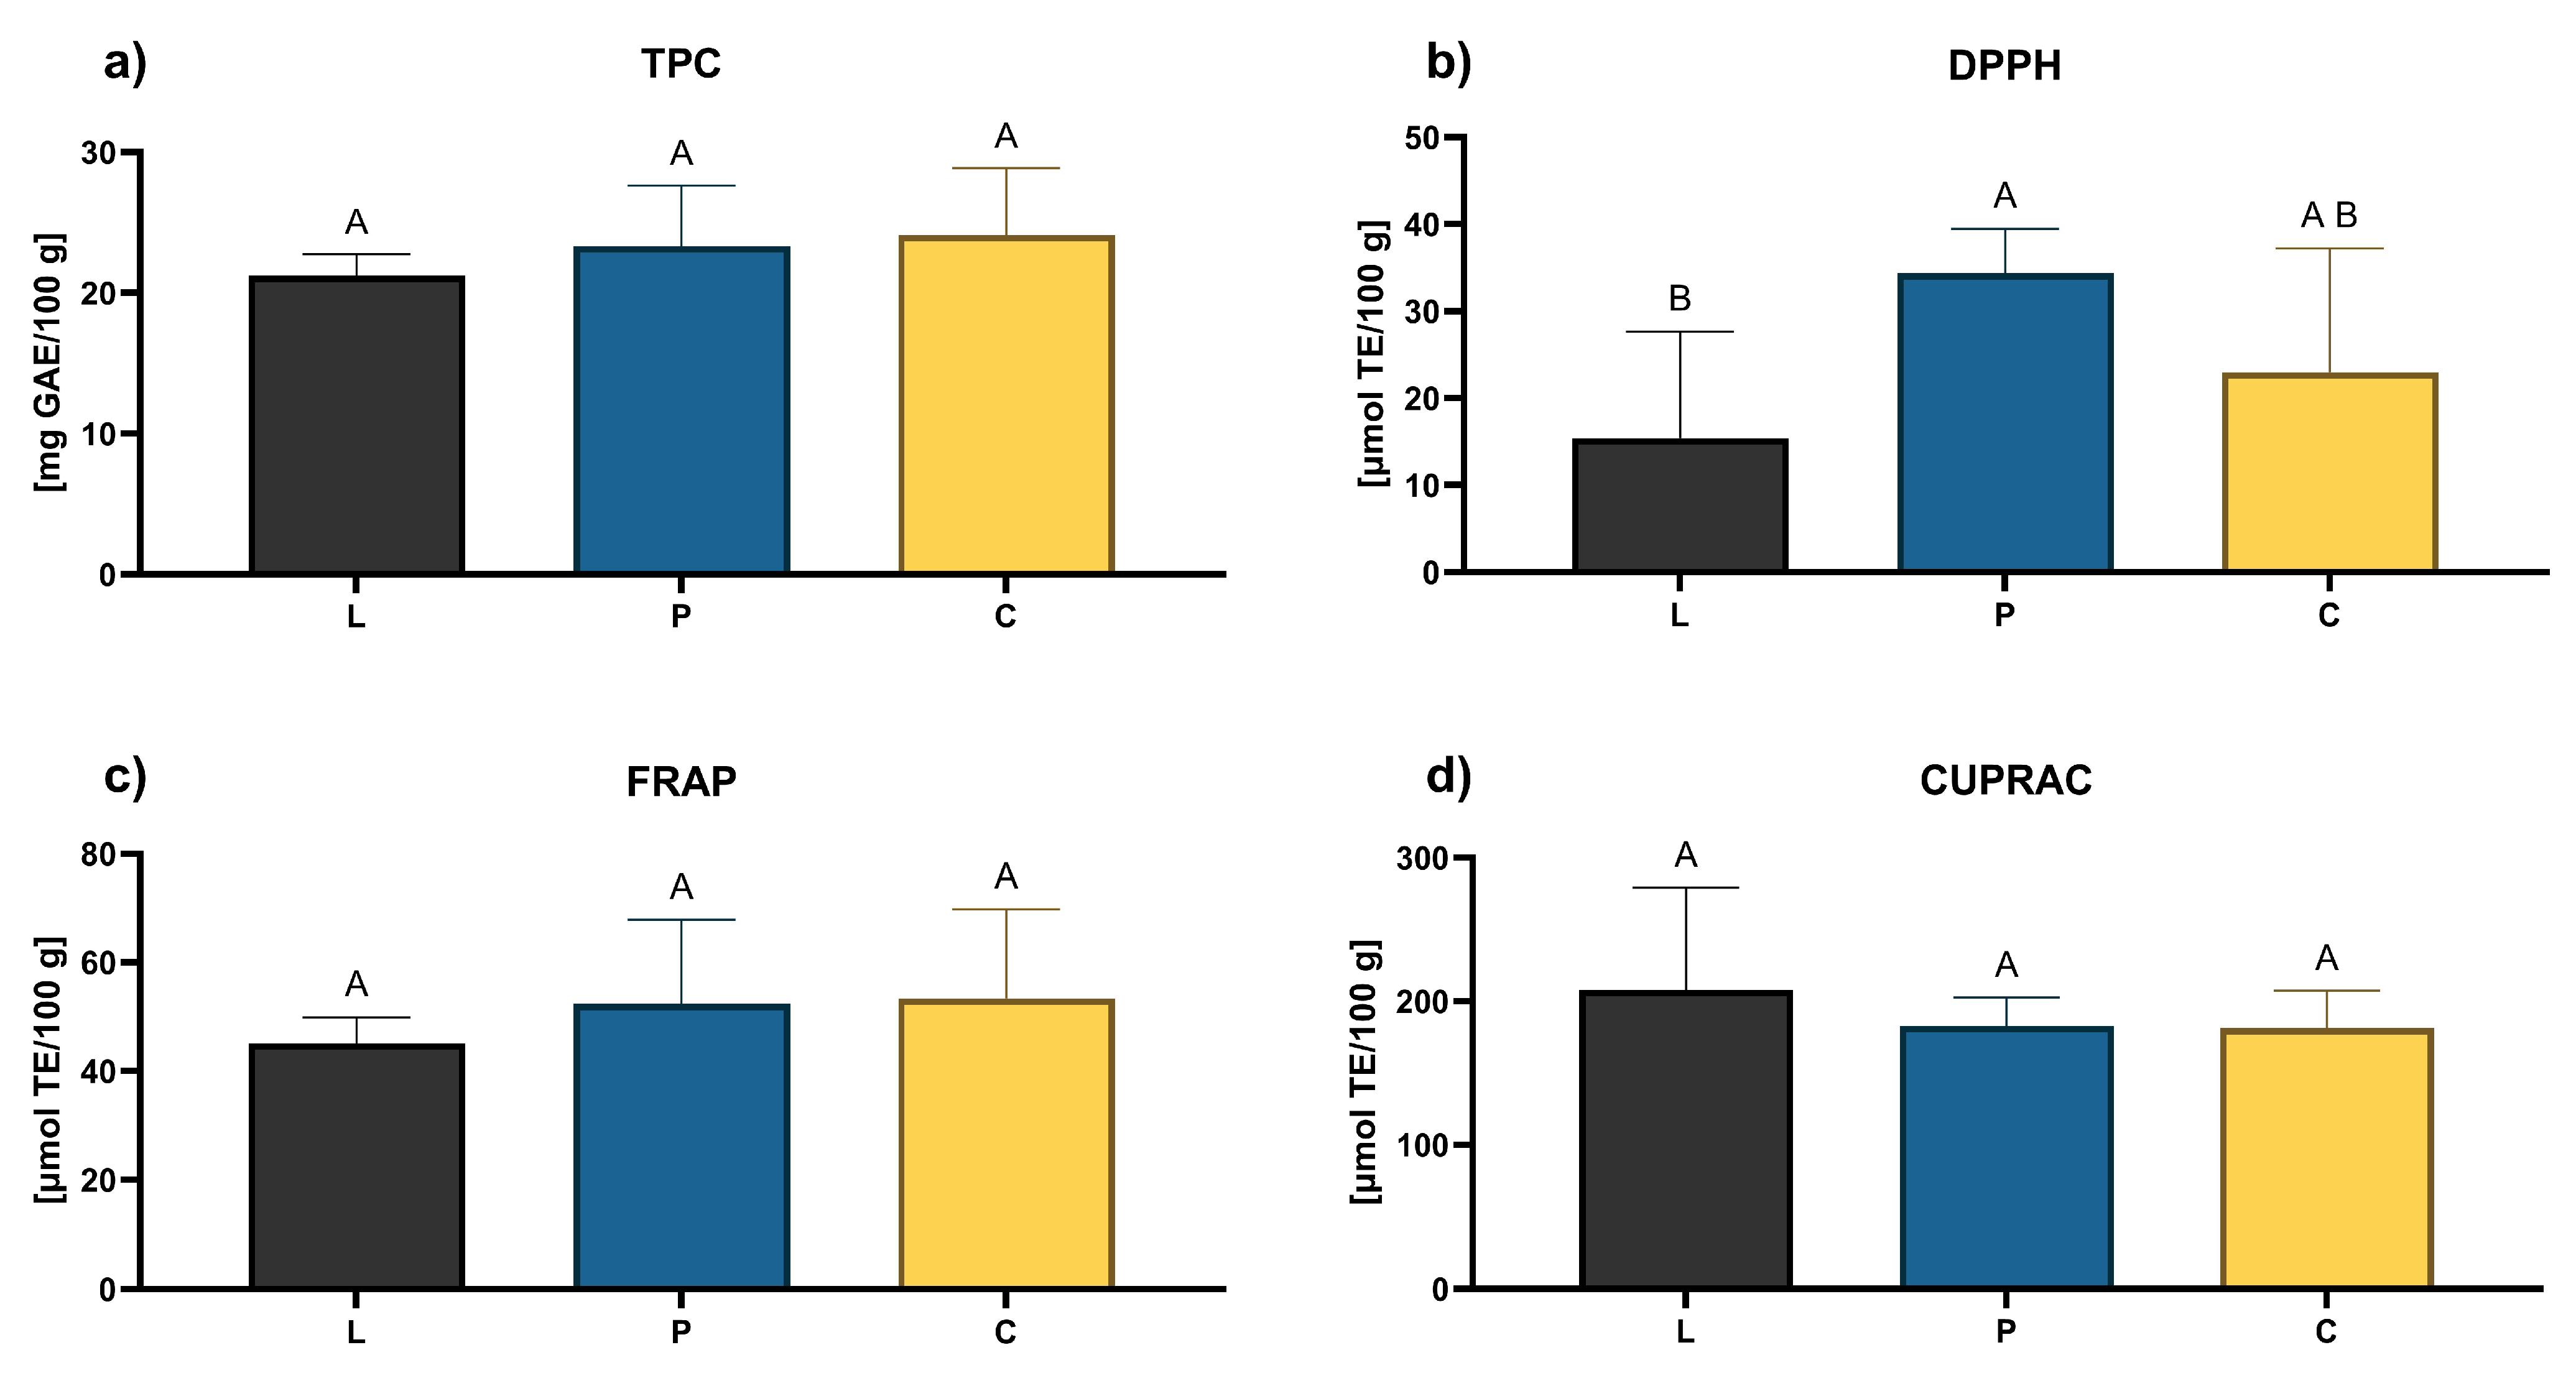
The determined total phenolic content in the honeys tested ranged from 16.99 to 29.96 mg GAE/100 g, with an average of 22.89 mg GAE/kg for all 15 samples (Table S6). Due to the origin of honey, the average values for the individual groups studied were at a similar level (Figure 3). These values are typical for Polish rapeseed honey; similar average TPC values for this honey variety have been previously reported at 25.45 mg/100 g [], 29.76 mg/100 g [], and 26.7 mg/100 g []. Other studies indicate a slightly wider range of TPC values from 3.43 to 41.74 mg GAE/100 g [,].
Figure 3. Total phenolic content (TPC) (a), and antioxidant activity measured by radical scavenging activity (DPPH) (b), ferric-reducing antioxidant power (FRAP) (c), and cupric ion-reducing antioxidant capacity (CUPRAC) (d) of test groups of honey samples (L—Lublin province, P—Podkarpackie province, and C—commercial). A, B—bars marked with different letters are statistically significantly different (Tukey’s honest significant difference test, p < 0.05).
The antiradical activity measured by the DPPH method ranged from 4.00 to 41.80 μmol TE/100 g (expressed as % radical inhibition by 20% honey solution—in the range of 2.5–26%). In this parameter, the results were more diverse depending on the origin; the highest average (34.38 μmol TE/100 g) was shown by honeys from the Podkarpackie region, and the lowest (15.41 μmol TE/100 g) from the Lublin region (Table S6). The DPPH radical quenching capacity, converted to Trolox equivalents, was reported by Kowalski et al. [] at the level of 37 µmol TE/100 g for Polish rapeseed honeys and 35 µmol TE/100 g for Slovak honeys. Other sources often report antiradical properties expressed as a percentage of DPPH radical inhibition—from 18.21% [] to even 55.16% []. However, this way of expressing the result is difficult to compare between individual studies due to different measurement conditions.
The reducing properties towards iron(III) and copper(II) ions were determined using the FRAP and CUPRAC methods, respectively. For the FRAP parameter, values ranged from 30.26 to 73.42 µmol TE/100 g. For the CUPRAC parameter, the results were higher, from 98.72 to 313.46 µmol TE/100 g. For the groups of honeys of different origin, the differences were not significant (p > 0.05). A slightly higher average FRAP value for rapeseed honeys—65.6 μmol TE/100 g—was previously described []. In turn, a differently expressed average for rapeseed honeys at the level of 466.7 mM Fe(II)/kg is given by Kędzierska-Matysek et al. []. Taking into account the average values for groups, the analyzed commercially available honeys do not differ from those purchased directly from beekeepers, which proves their good quality.

3.4. Searching for Rapeseed Honey Fingerprint

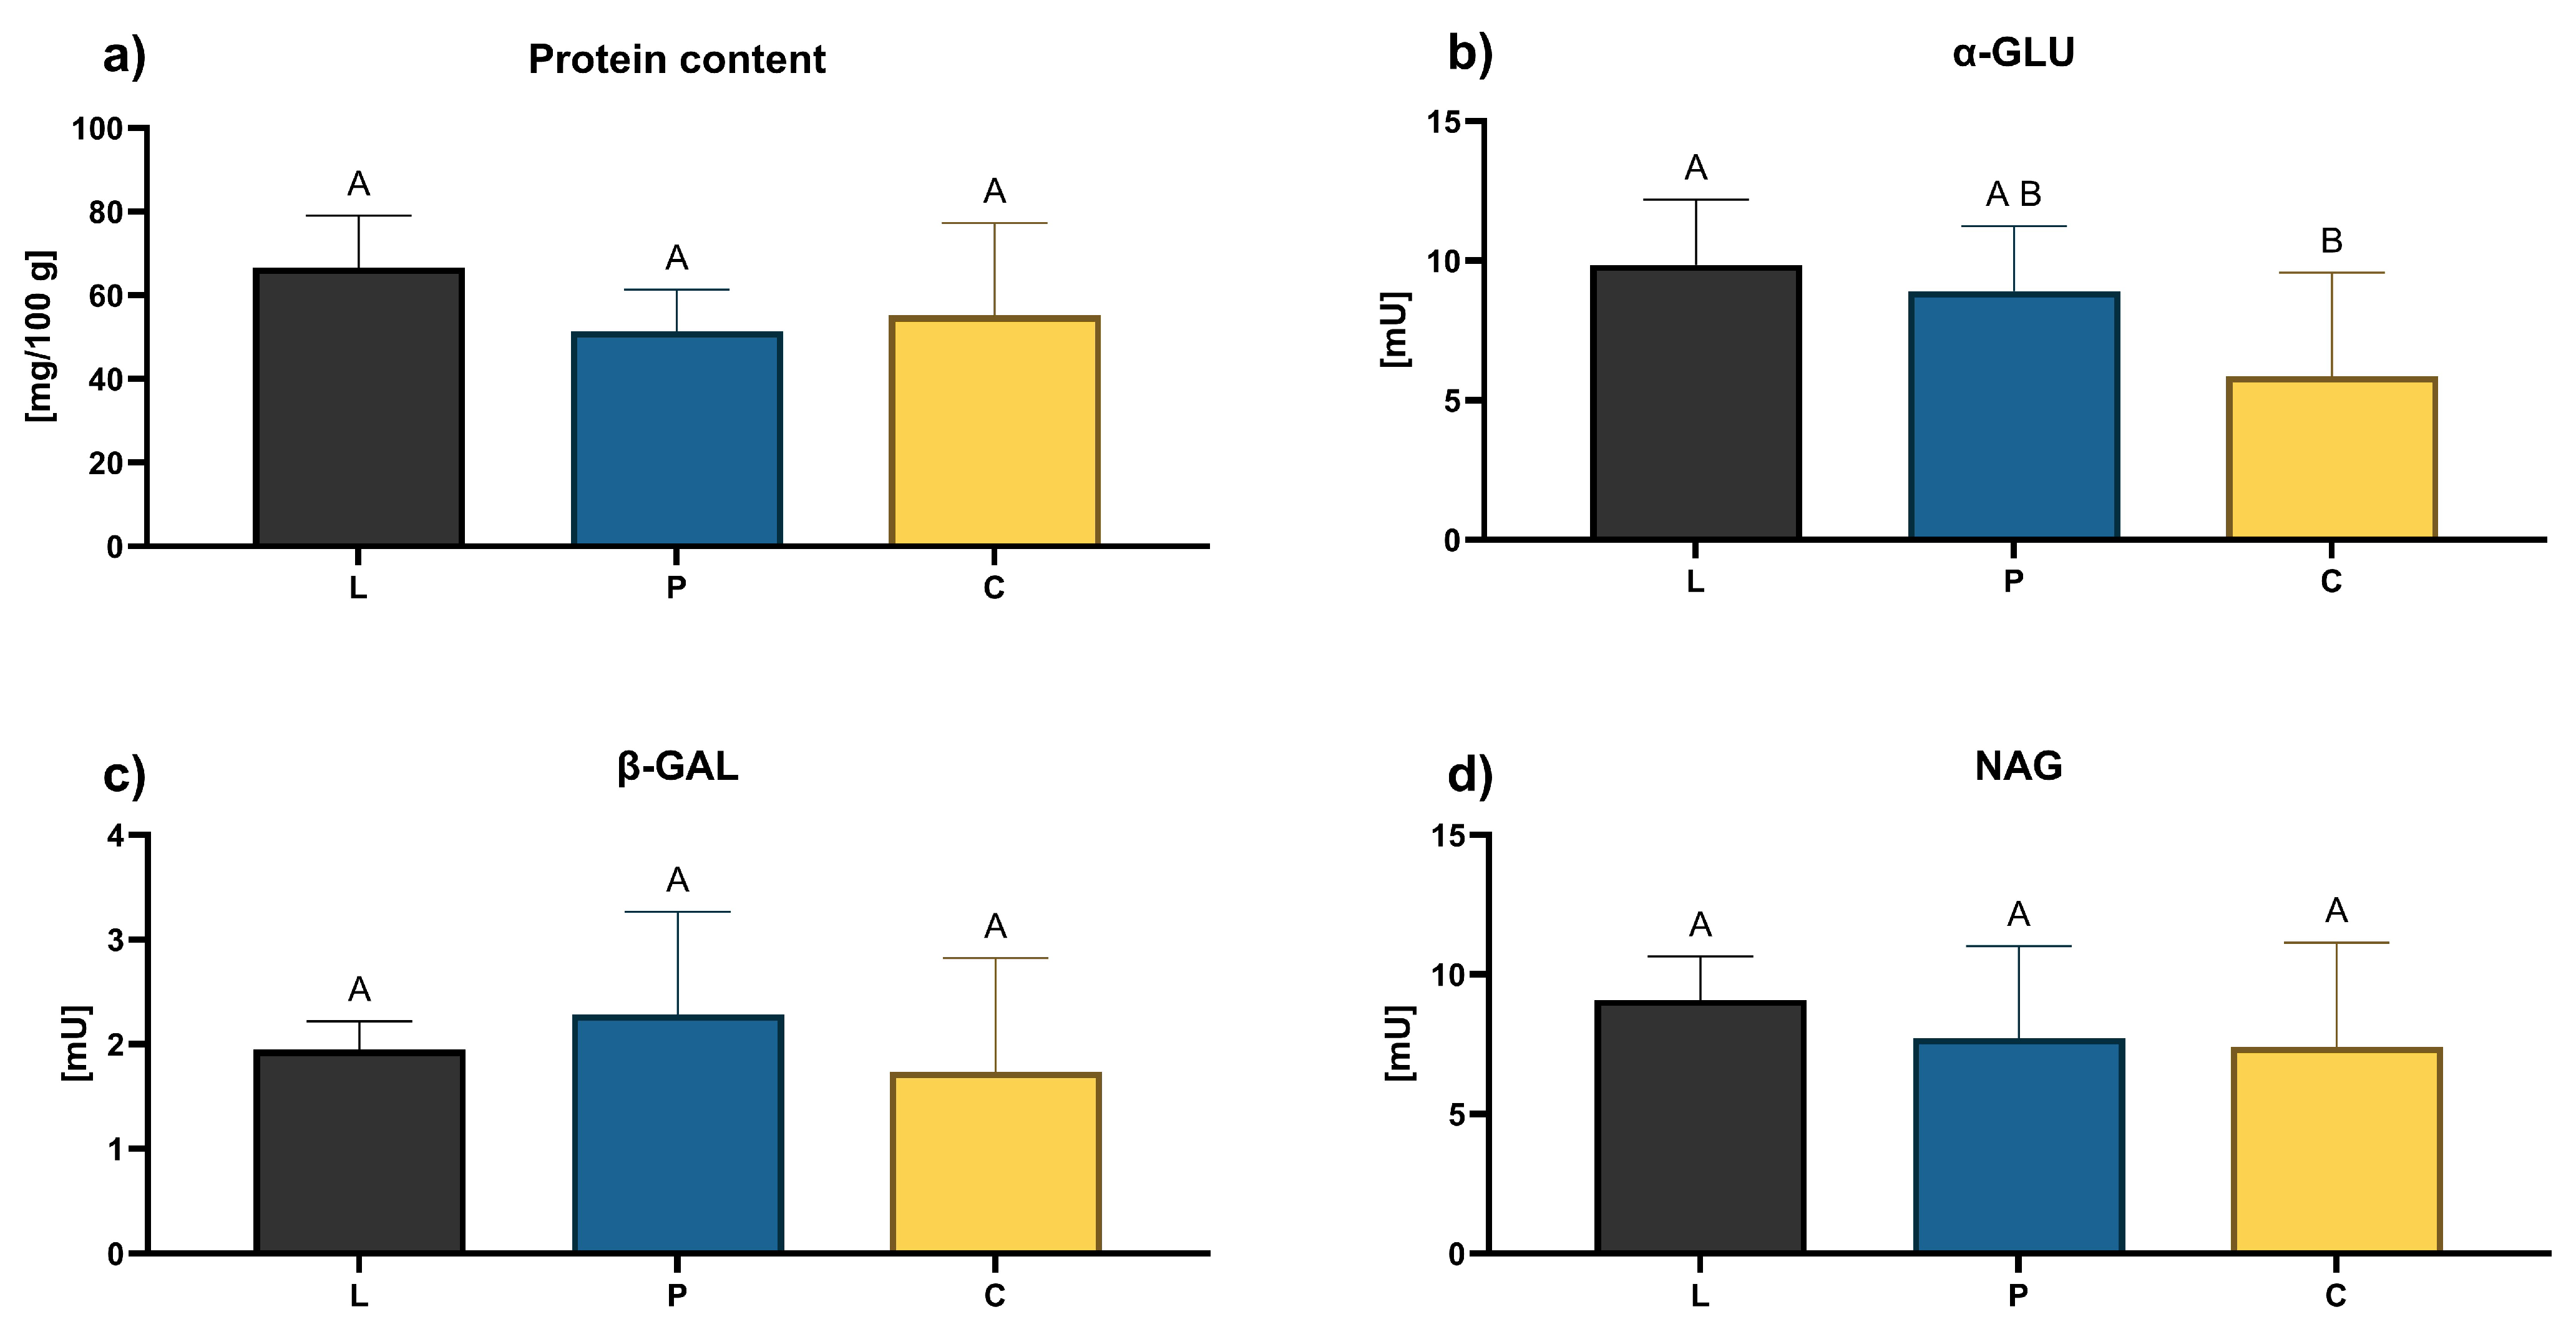
Proteins are minor components of honey that are rarely used for its quality evaluation, although these components create its biological activity and also can serve for overheating detection. Recently, colorimetric assays of protein and some hydrolytic enzymes have been proposed as an indicator of honey variety []. In the analyzed rapeseed honey samples, the protein content ranged from 18 to 85 mg/100 g (0.018–0.085%) (Table S7). These values are consistent with literature data, where protein levels in honey usually do not exceed 0.2% and vary with botanical and geographical origin []. In our previous study, lower protein values were reported for light honeys, such as rapeseed compared to dark honeys []. In another Polish study, Kunat-Budzyńska et al. [] demonstrated that rapeseed honey had among the lowest protein levels compared to other varieties’ reported value of 49.20 ± 3.40 mg/100 g. The final result may be influenced by the type of Bradford method used, which does not take into account all protein fractions, as well as by potential losses occurring during filtration or sample processing []. Enzyme activity analysis showed that α-GLU activity in apiary samples remained in the moderate range (up to ~12 mU), and was significantly higher than in commercial honeys (p < 0.05). This agrees with previous reports that enzyme activities such as invertase, diastase, or glucose oxidase decrease under heat treatment and long storage, indicating reduced freshness or intensive processing [,]. β-GAL and NAG activities were low in all samples and showed no significant differences between groups (Figure 4), which is consistent with earlier findings that these enzymes are more useful for supporting honey variety identification rather than as freshness markers []. Overall, the reduced α-GLU activity and lower protein content observed in commercial honeys support the view that industrial processing steps (filtration, heating, liquefaction, long storage) negatively affect honey’s enzymatic and protein profiles [,,].
Figure 4. The protein content (a) and enzymatic activity of α-GLU (b), β-GAL (c), and NAG (d) of test groups of honey samples (L—Lublin province, P—Podkarpackie province, and C—commercial). A, B—bars marked with different letters are statistically significantly different (Tukey’s honest significant difference test, p < 0.05).
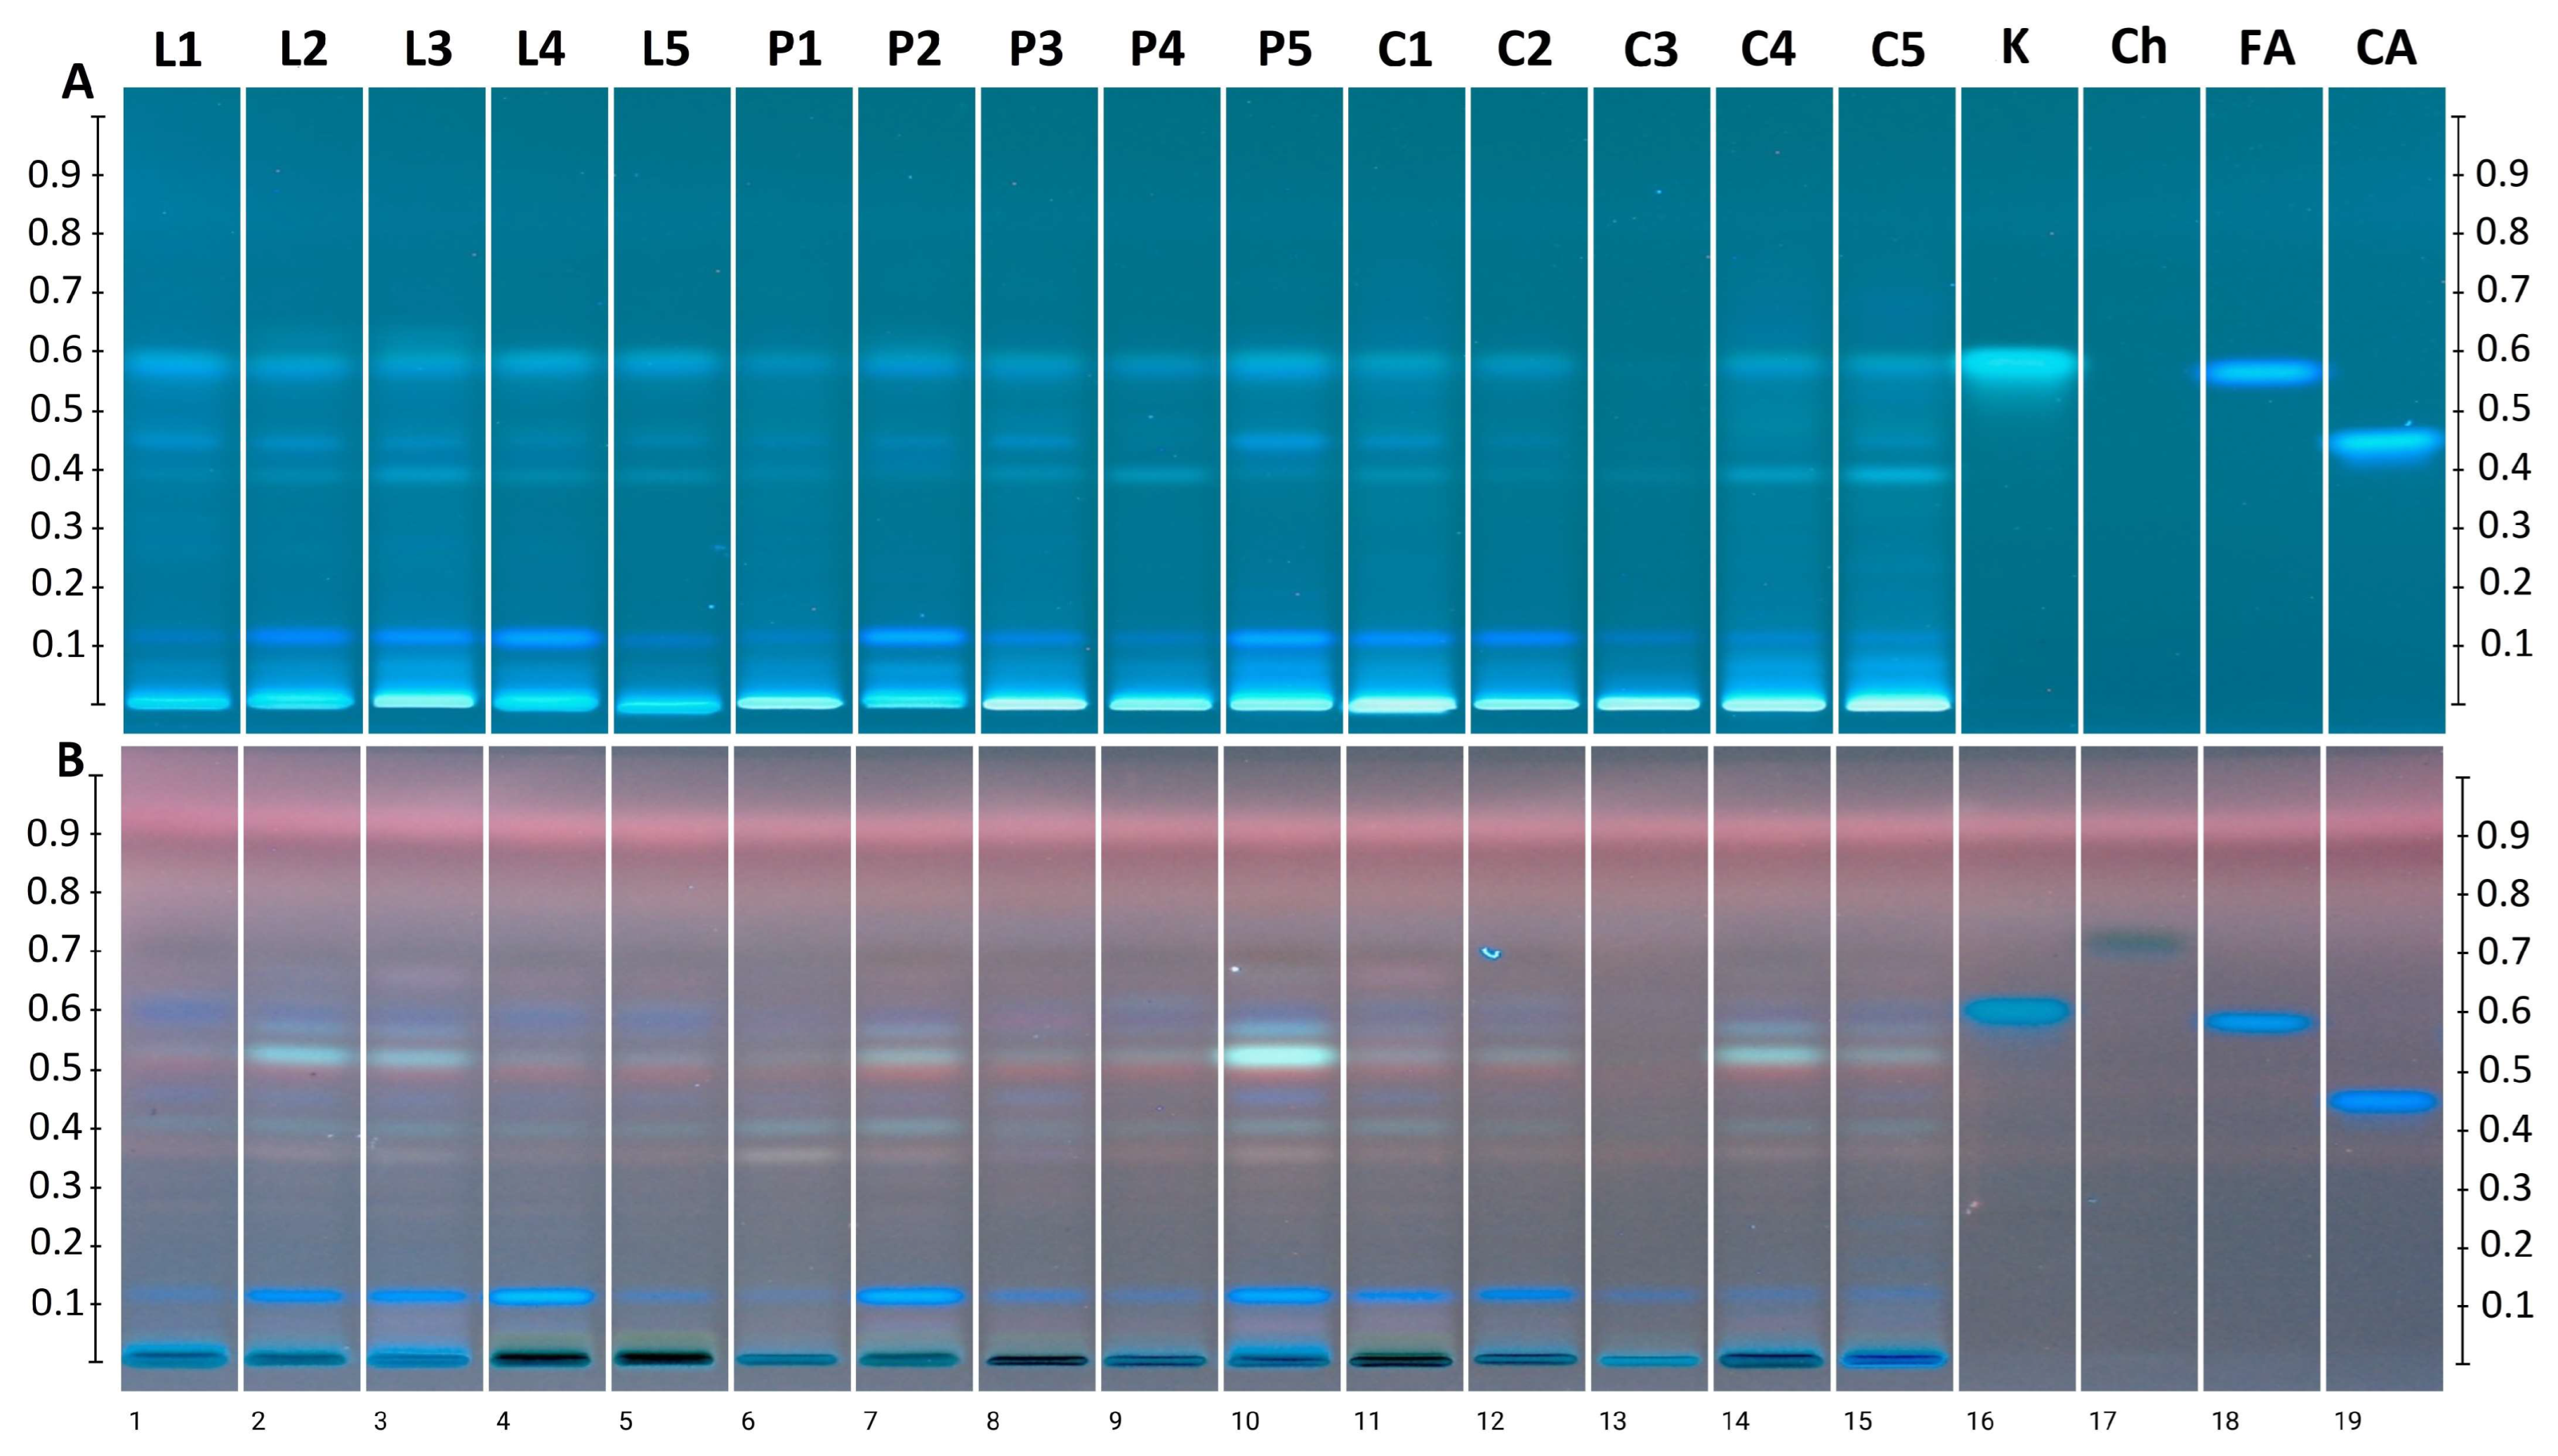
HPTLC was previously used to compare the polyphenol profiles of Polish varietal honeys, including phacelia [], linden and acacia [], and goldenrod honeys []. The polyphenol profiles of rapeseed honeys were compared on such a scale for the first time, extending previous studies that focused mainly on comparisons between rapeseed and other varietal honeys. All tested honey samples exhibit a similar pattern of bands corresponding to individual components, primarily phenolics (Figure 5). Visualization under 366 nm UV light reveals green-blue bands corresponding to flavonoids and navy-blue bands corresponding to phenolic acids. The presence of kaempferol (Rf = 0.60) and ferulic acid (Rf = 0.58) was identified in 93% of the samples, with the exception of sample C3, which had a poor profile. Caffeic acid band was also identified (Rf = 0.45) in most samples, and was most intense in sample P5. Moreover, the navy-blue band at Rf = 0.11 (unidentified phenolic acid) and the yellow-green band at Rf = 0.40 (unidentified flavonoid), present in all samples but with different intensity, should be considered as characteristic for rapeseed honeys. Derivatization with p-anisaldehyde reveals numerous additional bands, not necessarily derived from phenolic compounds, as this reagent is nonspecific. However, the intense dark blue band with an Rf value of approximately 0.11 after developing with p-anisaldehyde reagent became more visible. This compound, most likely from the class of phenolic acids, should be identified using additional techniques, which will allow it to be recognized as a varietal marker.
Figure 5. Images of HPTLC separation of rapeseed honey originated from Lublin province (tracks 1–5), Podparpackie province (tracks 6–10), and commercial (11–15) and standards: K-kaempferol (track 16), Ch-chrysin (track 17), FA-ferulic acid (track 18), and CA-caffeic acid (track 19) after p-anisaldehyde derivatization, in UV 366 nm light (A) and visible light (B).
Searching for unique compounds which can serve as rapeseed honey marker has been conducted previously. Using other chromatographic techniques, primarily HPLC, various phenolics have been identified in rapeseed honeys, including 3,4-dihydroxybenzoic acid, 4-hydroxybenzoic acid, caffeic acid, p-coumaric acid, vanillic acid, syringic acid, and trans-ferulic acid [], but none of them have been recognized as a unique marker of this variety. Wang et al. [] suggest that ellagic acid could be such a marker. Furthermore, isomers of abscisic acid and flavonoids, primarily kaempferol and 8-methoxykaempferol, have also been identified []. In studies of Polish varietal honeys, rapeseed honeys were characterized by an increased content of hesperidin [].
Establishing a standard HTPLC profile for rapeseed honey is important for detecting adulteration of honey varieties, especially in cases of incorrect declaration of the variety by the producer. For this purpose, it is necessary to develop a standard pattern of bands in a chromatogram to which the results obtained for subsequent tested samples could be compared. Deviations from the reference profile would indicate a suspicious sample, which should be referred for further analysis.

3.5. Correlation Between PAHs Content and Functional Properties of Honey

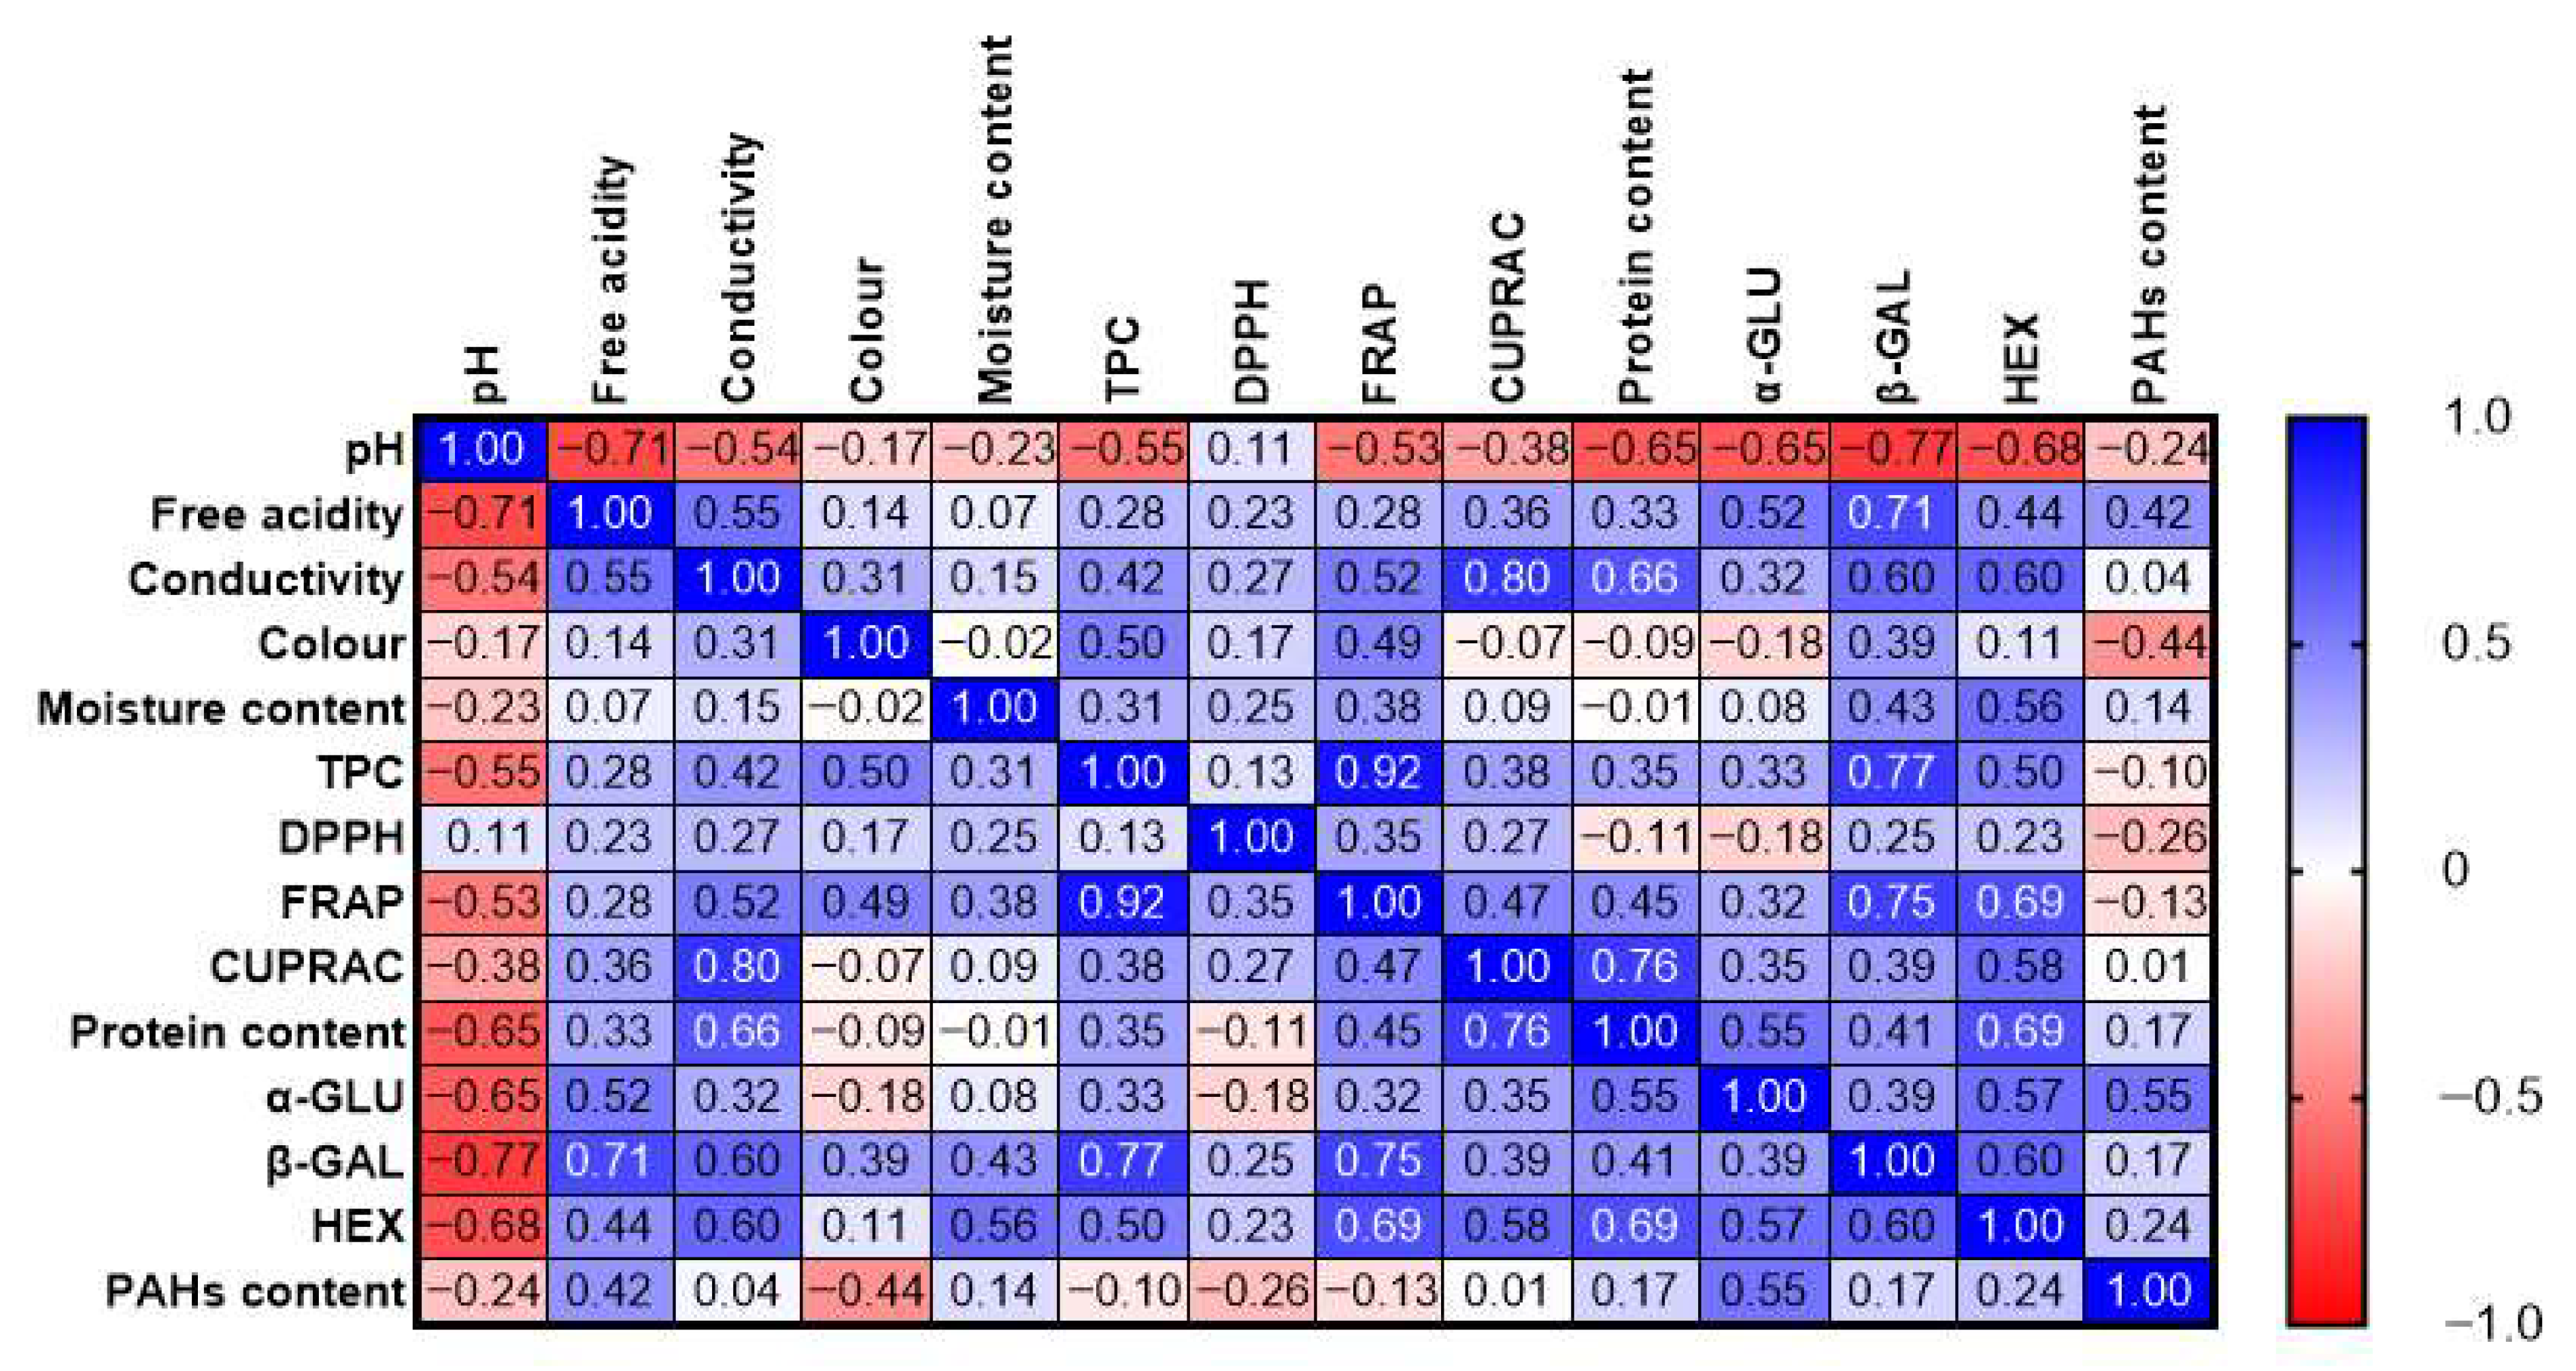
Correlation matrix analysis revealed relationships between all parameters studied (Figure 6). Positive correlations were observed between antioxidant capacity indices (TPC, FRAP, CUPRAC, DPPH), confirming the complementarity of the methods used in assessing antioxidant activity. Enzymatic activity (α-GLU, β-GAL, HEX) was significantly associated with TPC and FRAP, indicating the possible involvement of phenolic compounds in modulating enzymatic activity. However, the weak and statistically insignificant correlation between these parameters and the content of PAHs suggests a lack of impact of honey contamination on its functional properties.
Figure 6. Correlation matrix between all tested parameters.
The relatively small number of analyzed samples (n = 5 in each group) and their limited geographic origin from South-Eastern Poland may be a potential limitation of this study. However, it can be justified by the low variability in the chemical composition of rapeseed honeys. Our previous research has shown that a specific feature of rapeseed honey is its stable chemical composition, regardless of its geographical origin [,], where the greatest similarity in the properties of Polish and Slovak honeys among varietal honeys was observed for rapeseed honey only. Especially, a balanced level of bioactive components, such as phenolics, distinguishes it from other honey varieties. The same was observed when the protein profiles of varietal honeys available on the local market (collected from apiary and retail markets) were compared []. Such uniformity results from the homogeneity of the nectar base available to bees during the rapeseed flowering period. However, further research involving larger and more geographically diverse sampling is necessary to confirm and extend findings of this study.
The absence of harmful pesticide residues in the tested honeys not only demonstrates their safety for consumers but also reflects agricultural practices in which chemical inputs are limited. In turn, the detection of certain PAHs, fortunately not including the most toxic PAH4 group, indicates the potential for environmental pollutants to migrate into honey, despite its natural biofiltration by bees []. These findings confirm that maintaining an ecologically clean environment is essential for the production of high-quality and safe honey.

4. Conclusions

The study demonstrated stable functional value and high safety of rapeseed honey available in South-Eastern Poland, both available in direct sale and in supermarkets. Low concentrations of some of the less dangerous PAHs and no detectable pesticide residues, indicating that rapeseed honey from this ecologically clean region meets human safety. Compared to honey collected directly from an apiary, commercial samples showed reduced enzymatic activity, probably resulting from thermal processing. The results confirmed that α-glucosidase activity and protein content can be valuable indicators of honey processing, whereas specific phenolic HPTLC profile obtained in this study can be used to verify the authenticity of rapeseed honeys. It was found that the choice of high quality of the bees’ habitat by locating apiaries away from industrial or intensively used agricultural areas is crucial for the production of safe honey with good functional properties. The results provide practical guidance for beekeepers on selecting suitable honey sources, especially for traveling apiaries, and on the other hand indicate the need to monitor contaminants in honey. Due to limited sample sets, further studies based on a larger and more geographically diverse set of samples are needed to validate and broaden the present findings.

Supplementary Materials

The following supporting information can be downloaded at: https://www.mdpi.com/article/10.3390/app152212146/s1; Table S1: GC-MS method validation parameters for PAHs quantitation; Table S2: GC-MS method validation parameters for pesticide residues quantitation; Table S3: HPLC-DAD method validation parameters for neonicotinoides residues quantitation; Table S4: Physicochemical parameters of the individual tested rapeseed honeys; Table S5: Pesticide residues content in analyzed rapeseed honey samples; Table S6: Total phenolics content (TPC) and antioxidant activity measured by DPPH, FRAP and CUPRAC methods for the individual tested rapeseed honey samples; Table S7: The protein content and enzymatic activity of the individual tested rapeseed honey samples.

Author Contributions

Conceptualization, M.D.; methodology, M.T., M.M., and M.S.; software, M.T. and M.M.; validation, M.T., M.M., M.S., and A.S.-R.; formal analysis, M.T.; investigation, M.T., M.L. M.M., M.S., and A.S.-R.; resources, M.D.; data curation, M.T.; writing—original draft preparation, M.T., M.M., and M.S.; writing—review and editing, M.D.; visualization, M.T. and M.M.; supervision, M.D.; project administration, M.D.; funding acquisition, M.D. All authors have read and agreed to the published version of the manuscript.

Funding

The research was financially supported by Polish Ministry of Science and Higher Education research project within the University of Rzeszów PB/KCHTZ/2025.

Institutional Review Board Statement

Not applicable.

Data Availability Statement

The original contributions presented in this study are included in the article and Supplementary Material. Further inquiries can be directed to the corresponding author.
.

Conflicts of Interest

The authors declare no conflicts of interest.

Abbreviations

The following abbreviations are used in this manuscript:
PAHsPolycyclic aromatic hydrocarbons
HPTLCHigh performance thin layer chromatography
RfRetardation factor
GC-MSGas chromatography coupled with mass spectrometry
HPLC-DADHigh-performance liquid chromatography with diode array detection
SODSuperoxide dismutase
CATCatalase
OCPOrganochlorine pesticides
OPOrganophosphate
POPsPersistent organic pollutants
DDTDichlorodiphenyltrichloroethane
CCDColony collapse disorder
IARCInternational agency for research on cancer
MRLsMaximum residue limits
PSAPrimary-secondary amine
PPPolypropylene
SIMSelected ion monitoring
DPPH2,2-Diphenyl-1-picrylhydrazyl
FRAPFerric-reducing antioxidant power
CUPRACCupric reducing antioxidant capacity
TPCTotal phenolic compounds
GAEGallic acid equivalents
TETrolox equivalents
NAGN-acetyl-β-D-glucosaminidase
α-GLUα-glucosidase
β-GALβ-galactosidase

References

  1. Queirós, J.; Malça, J.; Freire, F. Environmental life-cycle assessment of rapeseed produced in Central Europe: Addressing alternative fertilization and management practices. J. Clean. Prod. 2015, 99, 266–274. [Google Scholar] [CrossRef]
  2. Pound, M.; Dalgleish, A.; McCoy, J.; Partington, J. Melissopalynology of honey from Ponteland, UK, shows the role of Brassica napus in supporting honey production in a suburban to rural setting. Palynology 2018, 42, 400–405. [Google Scholar] [CrossRef]
  3. Puvača, N.; Bursić, V.; Brkić, I.; Vapa Tankosić, J.; Prodanović, R.; Vuković, G.; Vještica, S.; Lekić, S.; Vapa, I.; Gvozdenac, S. Toxicological assessment of honey from conventional and organiproduction and risk assessment for public health. J. Cent. Eur. Agric. 2024, 25, 554–566. [Google Scholar] [CrossRef]
  4. Gizaw, G.; Kim, Y.; Moon, K.; Choi, J.B.; Kim, Y.H.; Park, J.K. Effect of environmental heavy metals on the expression of detoxification-related genes in honey bee Apis mellifera. Apidologie 2020, 51, 664–674. [Google Scholar] [CrossRef]
  5. Tahir, F.; Goblirsch, M.; Adamczyk, J.; Karim, S.; Alburaki, M. Honey bee Apis mellifera L. responses to oxidative stress induced by pharmacological and pesticidal compounds. Front. Bee Sci. 2023, 1, 1275862. [Google Scholar] [CrossRef]
  6. Ahsan, Z.; Wu, Z.; Lin, Z.; Ji, T.; Wang, K. The Sublethal Effects of Neonicotinoids on Honeybees. Biology 2025, 14, 1076. [Google Scholar] [CrossRef]
  7. Shepherd, S.; Park, Y.G.; Krupke, C.H. Effects of common co-occurring pesticides (a neonicotinoid and fungicide) on honey bee colony health in a semi-field study. Heliyon 2024, 10, e29886. [Google Scholar] [CrossRef]
  8. Naccari, C.; Ferrantelli, V.; Cammilleri, G.; Barbaccia, G.; Riolo, P.; Ferrante, M.C.; Procopio, A.; Palma, E. Study of Toxic Metals and Microelements in Honey as a Tool to Support Beekeeping Production and Consumer Safety. Foods 2025, 14, 1986. [Google Scholar] [CrossRef] [PubMed]
  9. Dżugan, M.; Wesołowska, M.; Zaguła, G.; Kaczmarski, M.; Czernicka, M.; Puchalski, C. Honeybees (Apis mellifera) as a biological barrier for contamination of honey by environmental toxic metals. Environ. Monit. Assess. 2018, 190, 101. [Google Scholar] [CrossRef] [PubMed]
  10. Surma, M.; Sadowska-Rociek, A.; Draszanowska, A. Levels of Contamination by Pesticide Residues, Polycyclic Aromatic Hydrocarbons (PAHs), and 5-Hydroxymethylfurfural (HMF) in Honeys Retailed in Europe. Arch. Environ. Contam. Toxicol. 2023, 84, 165–178. [Google Scholar] [CrossRef] [PubMed]
  11. Jaramillo-Zárate, M.J.; Londoño-Giraldo, L.M. Pesticides in honey: Bibliographic and bibliometric analysis towards matrix quality for consumption. Braz. J. Food Technol. 2023, 26, e2022112. [Google Scholar] [CrossRef]
  12. Kędzierska-Matysek, M.; Teter, A.; Skałecki, P.; Topyła, B.; Domaradzki, P.; Poleszak, E.; Florek, M. Residues of Pesticides and Heavy Metals in Polish Varietal Honey. Foods 2022, 11, 2362. [Google Scholar] [CrossRef]
  13. Corredera, L.; Bayarri, S.; Pérez-Arquillué, C.; Lázaro, R.; Molino, F.; Herrera, A. Multiresidue determination of carcinogenic polycyclic aromatic hydrocarbons in honey by solid-phase extraction and high-performance liquid chromatography. J. Food Prot. 2011, 74, 1692–1699. [Google Scholar] [CrossRef] [PubMed]
  14. Ciemniak, A.; Witczak, A.; Mocek, K. Assessment of honey contamination with polycyclic aromatic hydrocarbons. J. Environ. Sci. Health—Part B Pestic. Food Contam. Agric. Wastes 2013, 48, 993–998. [Google Scholar] [CrossRef]
  15. Végh, R.; Csóka, M.; Mednyánszky, Z.; Sipos, L. Pesticide residues in bee bread, propolis, beeswax and royal jelly—A review of the literature and dietary risk assessment. Food Chem. Toxicol. 2023, 176, 113806. [Google Scholar] [CrossRef]
  16. Ligor, M.; Bukowska, M.; Ratiu, I.A.; Gadzała-Kopciuch, R.; Buszewski, B. Determination of Neonicotinoids in Honey Samples Originated from Poland and Other World Countries. Molecules 2020, 25, 5817. [Google Scholar] [CrossRef] [PubMed]
  17. Scripcă, L.A.; Amariei, S. The influence of chemical contaminants on the physicochemical properties of unifloral and multifloral honey. Foods 2021, 10, 1039. [Google Scholar] [CrossRef]
  18. Fasasi, K.A.; Awodiran, O.F.; Ayeni, D.J.; Awoniyi, O.I.; Awojide, S.H. Assessment of Bee Honey in some Districts in South-Western Nigeria for Agricultural Pesticide Residues and Polycyclic Aromatic Hydrocarbons (PAHs). J. Agric. Sci. 2024, 19, 142–156. [Google Scholar] [CrossRef]
  19. Hungerford, N.L.; Fletcher, M.T.; Tsai, H.H.; Hnatko, D.; Swann, L.J.; Kelly, C.L.; Anuj, S.R.; Tinggi, U.; Webber, D.C.; Were, S.T.; et al. Occurrence of environmental contaminants (pesticides, herbicides, PAHs) in Australian/Queensland Apis Mellifera honey. Food Addit. Contam. Part B Surveill. 2021, 14, 193–205. [Google Scholar] [CrossRef]
  20. Witczak, A.; Ciemniak, A. Evaluation of contamination of some types of honey with selected persistent organic pollutants (POPs). Ocena zanieczyszczenia wybranych gatunków miodu związkami z grupy trwałych zanieczyszczeń organicznych. Rocz. Panstw. Zakl. Hig. 2012, 63, 359–366. [Google Scholar]
  21. Montano, L.; Baldini, G.M.; Piscopo, M.; Liguori, G.; Lombardi, R.; Ricciardi, M.; Esposito, G.; Pinto, G.; Fontanarosa, C.; Spinelli, M.; et al. Polycyclic Aromatic Hydrocarbons (PAHs) in the Environment: Occupational Exposure, Health Risks and Fertility Implications. Toxics 2025, 13, 151. [Google Scholar] [CrossRef]
  22. Feng, Y.; Li, Z.; Li, W. Polycyclic Aromatic Hydrocarbons (PAHs): Environmental Persistence and Human Health Risks. Nat. Prod. Commun. 2025, 20, 1–8. [Google Scholar] [CrossRef]
  23. Chiesa, L.M.; Panseri, S.; Nobile, M.; Ceriani, F.; Arioli, F. Distribution of POPs, pesticides and antibiotic residues in organic honeys from different production areas. Food Addit. Contam. Part A Chem. Anal. Control Expo. Risk Assess. 2018, 35, 1340–1355. [Google Scholar] [CrossRef] [PubMed]
  24. Panseri, S.; Bonerba, E.; Nobile, M.; Cesare, F.D.; Mosconi, G.; Cecati, F.; Arioli, F.; Tantillo, G.; Chiesa, L. Pesticides and environmental contaminants in organic honeys according to their different productive areas toward food safety protection. Foods 2020, 9, 1863. [Google Scholar] [CrossRef]
  25. Piechowicz, B.; Grodzicki, P.; Podbielska, M.; Tyrka, N.; Śliwa, M. Transfer of active ingredients from plant protection products to a honeybee (Apis mellifera F.) hive from winter oilseed rape crops protected with conventional methods. Pol. J. Environ. Stud. 2018, 27, 1219–1228. [Google Scholar] [CrossRef]
  26. Minister of Agriculture and Rural Development. Regulation of 14 January 2009 on methods of analysis related to honey quality assessment. J. Laws 2009, 17, 94. [Google Scholar]
  27. Sawicki, T.; Surma, M.; Sadowska-Rociek, A. Characteristics of contaminants in the Polish-origin bee products and cancer risk assessment. Food Chem. Toxicol. 2023, 175, 113693. [Google Scholar] [CrossRef]
  28. Dżugan, M.; Miłek, M.; Kielar, P.; Stępień, K.; Sidor, E.; Bocian, A. SDS-PAGE Protein and HPTLC Polyphenols Profiling as a Promising Tool for Authentication of Goldenrod Honey. Foods 2022, 11, 2390. [Google Scholar] [CrossRef]
  29. Dżugan, M.; Miłek, M.; Sidor, E.; Buczkowicz, J.; Hęclik, J.; Bocian, A. The Application of SDS-PAGE Protein and HPTLC Amino Acid Profiling for Verification of Declared Variety and Geographical Origin of Honey. Food Anal. Methods 2023, 16, 1157–1171. [Google Scholar] [CrossRef]
  30. Szczesna, T.; Rybak-Chmielewska, H.; Waś, E.; Kachaniuk, K.; Teper, D. Characteristics of Polish unifloral honeys. I. Rape honey (Brassica napus L. Var. oleifera Metzger). J. Apic. Sci. 2011, 55, 111–119. [Google Scholar]
  31. Marić, A.; Sakač, M.; Jovanov, P.; Đermanović, B.; Teslić, N.; Plavšić, D.; Jakimov, D. Functional Properties of Rapeseed Honey Enriched with Lyophilized Fruits. Agriculture 2024, 14, 2117. [Google Scholar] [CrossRef]
  32. Kowalski, S.; Ciesarová, Z.; Kukurová, K.; Tobolková, B.; Polovka, M.; Skoczylas, Ł.; Tabaszewska, M.; Mikulec, K.; Mikulec, A.; Buksa, K. Physicochemical and Antioxidant Properties of Selected Polish and Slovak Honeys. Appl. Sci. 2025, 15, 5810. [Google Scholar] [CrossRef]
  33. Minister of Agriculture and Rural Development. Regulation of 3 October 2003 on Detailed Requirements for the Commercial Quality of Honey. J. Laws 2003, 181, 1773. (In Poland) [Google Scholar]
  34. Karise, R.; Raimets, R.; Bartkevics, V.; Pugajeva, I.; Pihlik, P.; Keres, I.; Williams, I.H.; Viinalass, H.; Mänd, M. Are pesticide residues in honey related to oilseed rape treatments? Chemosphere 2017, 188, 389–396. [Google Scholar] [CrossRef] [PubMed]
  35. Sampaio, G.R.; Guizellini, G.M.; da Silva, S.A.; de Almeida, A.P.; Pinaffi-Langley, A.C.C.; Rogero, M.M.; de Camargo, A.C.; Torres, E.A.F.S. Polycyclic aromatic hydrocarbons in foods: Biological effects, legislation, occurrence, analytical methods, and strategies to reduce their formation. Int. J. Mol. Sci. 2021, 22, 6010. [Google Scholar] [CrossRef]
  36. International Agency for Research on Cancer; WHO. Agents Classified by the IARC Monographs. Volumes 1–125. Available online: https://monographs.iarc.fr/agents-classified-by-the-iarc/ (accessed on 17 October 2025).
  37. Patel, A.B.; Shaikh, S.; Jain, K.R.; Desai, C.; Madamwar, D. Polycyclic Aromatic Hydrocarbons: Sources, Toxicity, and Remediation Approaches. Front. Microbiol. 2020, 5, 562813. [Google Scholar] [CrossRef]
  38. Kowalska, J.; Stanisławek, M.; Latoch, A.; Marzec, A.; Galus, S.; Kowalska, H.; Ciecierska, M. Polycyclic Aromatic Hydrocarbons in Polish Traditionally and Industrially Smoked Meats as an Element of Monitoring and PAH Reduction Strategies. Foods 2025, 14, 350. [Google Scholar] [CrossRef] [PubMed]
  39. Wilczyńska, A.; Żak, N.; Stasiuk, E. Content of Selected Harmful Metals (Zn, Pb, Cd) and Polycyclic Aromatic Hydrocarbons (PAHs) in Honeys from Apiaries Located in Urbanized Areas. Foods 2024, 13, 3451. [Google Scholar] [CrossRef] [PubMed]
  40. Batelková, P.; Borkovcová, I.; Čelechovská, O.; Vorlová, L.; Bartáková, K. Polycyclic aromatic hydrocarbons and risk elements in honey from the South Moravian region (Czech Republic). Acta Vet. Brno 2012, 81, 169–174. [Google Scholar] [CrossRef]
  41. Al-Kafaween, M.A.; Alwahsh, M.; Mohd Hilmi, A.B.; Abulebdah, D.H. Physicochemical Characteristics and Bioactive Compounds of Different Types of Honey and Their Biological and Therapeutic Properties: A Comprehensive Review. Antibiotics 2023, 12, 337. [Google Scholar] [CrossRef]
  42. Luchese, R.H.; Prudêncio, E.R.; Guerra, A.F. Honey as a Functional Food. In Honey Analysis; de Alencar Arnaut de Toledo, V., Ed.; IntechOpen: London, UK, 2017. [Google Scholar] [CrossRef]
  43. Dżugan, M.; Tomczyk, M.; Sowa, P.; Grabek-Lejko, D. Antioxidant activity as biomarker of honey variety. Molecules 2018, 23, 2069. [Google Scholar] [CrossRef]
  44. Kędzierska-Matysek, M.; Stryjecka, M.; Teter, A.; Skałecki, P.; Domaradzki, P.; Florek, M. Relationships between the content of phenolic compounds and the antioxidant activity of polish honey varieties as a tool for botanical discrimination. Molecules 2021, 26, 1810. [Google Scholar] [CrossRef]
  45. Majewska, E.; Drużyńska, B.; Derewiaka, D.; Ciecierska, M.; Pakosz, P. Comparison of Antioxidant Properties and Color of Selected Polish Honeys and Manuka Honey. Foods 2024, 13, 2666. [Google Scholar] [CrossRef]
  46. Jaśkiewicz, K.; Szczęsna, T.; Jachuła, J. How Phenolic Compounds Profile and Antioxidant Activity Depend on Botanical Origin of Honey—A Case of Polish Varietal Honeys. Molecules 2025, 30, 360. [Google Scholar] [CrossRef] [PubMed]
  47. Halagarda, M.; Groth, S.; Popek, S.; Rohn, S.; Pedan, V. Antioxidant activity and phenolic profile of selected organic and conventional honeys from Poland. Antioxidants 2020, 9, 44. [Google Scholar] [CrossRef]
  48. Wilczyńska, A. Phenolic content and antioxidant activity of different types of polish honey—A short report. Pol. J. Food Nutr. Sci. 2010, 60, 309–313. [Google Scholar]
  49. Socha, R.; Juszczak, L.; Pietrzyk, S.; Gałkowska, D.; Fortuna, T.; Witczak, T. Phenolic profile and antioxidant properties of Polish honeys. Int. J. Food Sci. Technol. 2011, 46, 528–534. [Google Scholar] [CrossRef]
  50. Flanjak, I.; Strelec, I.; Kenjerić, D.; Primorac, L. Croatian produced unifloral honey characterized according to the protein and proline content and enzyme activities. J. Apic. Sci. 2016, 60, 39–48. [Google Scholar] [CrossRef]
  51. Kunat-Budzyńska, M.; Rysiak, A.; Wiater, A.; Grąz, M.; Andrejko, M.; Budzyński, M.; Bryś, M.S.; Sudziński, M.; Tomczyk, M.; Gancarz, M.; et al. Chemical Composition and Antimicrobial Activity of New Honey Varietals. Int. J. Environ. Res. Public Health. 2023, 20, 2458. [Google Scholar] [CrossRef]
  52. Nazarian, H.; Taghavizad, R.; Majd, A. Origin of honey proteins and method for its quality control. Pak. J. Bot. 2010, 42, 3221–3228. [Google Scholar]
  53. Stanek, N.; Teper, D.; Kafarski, P.; Jasicka-Misiak, I. Authentication of phacelia honeys (Phacelia tanacetifolia) based on a combination of HPLC and HPTLC analyses as well as spectrophotometric measurements. LWT 2019, 107, 199–207. [Google Scholar] [CrossRef]
  54. Stanek, N.; Kafarski, P.; Jasicka-Misiak, I. Development of a high performance thin layer chromatography method for the rapid qualification and quantification of phenolic compounds and abscisic acid in honeys. J. Chromatogr. A 2019, 1598, 209–215. [Google Scholar] [CrossRef]
  55. Puścion-Jakubik, A.; Karpińska, E.; Moskwa, J.; Socha, K. Content of Phenolic Acids as a Marker of Polish Honey Varieties and Relationship with Selected Honey-Quality-Influencing Variables. Antioxidants 2022, 11, 1312. [Google Scholar] [CrossRef] [PubMed]
  56. Wang, J.; Xue, X.; Du, X.; Cheng, N.; Chen, L.; Zhao, J.; Zheng, J.; Cao, W. Identification of Acacia Honey Adulteration with Rape Honey Using Liquid Chromatography–Electrochemical Detection and Chemometrics. Food Anal. Meth. 2014, 7, 2003–2012. [Google Scholar] [CrossRef]
  57. Tomás-Barberán, F.A.; Martos, I.; Ferreres, F.; Radovic, B.S.; Anklam, E. HPLC flavonoid profiles as markers for the botanical origin of European unifloral honeys. J. Sci. Food Agric. 2001, 496, 485–496. [Google Scholar] [CrossRef]
  58. Tomczyk, M.; Tarapatskyy, M.; Dżugan, M. The influence of geographical origin on honey composition studied by Polish and Slovak honeys. Czech J. Food Sci. 2019, 37, 232–238. [Google Scholar] [CrossRef]
Disclaimer/Publisher’s Note: The statements, opinions and data contained in all publications are solely those of the individual author(s) and contributor(s) and not of MDPI and/or the editor(s). MDPI and/or the editor(s) disclaim responsibility for any injury to people or property resulting from any ideas, methods, instructions or products referred to in the content.

Article Metrics

Citations

Article Access Statistics

Multiple requests from the same IP address are counted as one view.