Abstract
The monitoring of the process of converging historic mining excavations in the medieval and still-active Bochnia Salt Mine, conducted for years using classic geodetic measurements, allows for determining the results of point displacements. The movements of the selected fragments of the excavation over time, determined on the basis of these displacements, allow for estimating the displacement field, characterizing the entire excavation together with the often-complicated surface layout of the sidewalls, roof and floor. However, this is a certain simplification of the model of this field, and so far, no stress field has been determined that would characterize the compressive forces and would correspond to the characteristics of the measured deformations. This issue has both scientific and practical importance. The latter involves determining the model characteristics of deformations that would be used in the strategy of the conducted protective works. The authors concluded that in modeling displacements, the results of classic geodetic measurements are insufficient for a precise description of the displacement field and reliable simulations of the stress field model. The use of a laser scanner made it possible to obtain an appropriate image of the geometry of the selected excavation and displacements over time. From a scientific point of view, it is interesting to explain the differentiation of displacements in different directions, and determine the nature and share of the acting compressive forces (gravitational forces, the impact of other excavations, tectonic forces).
1. Introduction
One of the inevitable consequences of mining operations is that there may come a time when deposits are depleted, and the question arises as to how to utilize old workings. The effective utilization of post-mining areas is a considerable challenge and requires the consideration of a number of factors. In the case of old workings of historical significance which are accessible, the idea of their possible use as a tourist attraction arises.
There are approximately 200 underground tourist sites in Poland, but the supervision of the State Mining Authority covers only 15 of them (as of 31 December 2022), but this number may change as new routes are prepared. Those under control are located exclusively in decommissioned mines (meaning that there are no basements, corridors, bunkers, caves, etc.) and one of them is the Bochnia Salt Mine, a historic salt mine, which dates back to the 12th century. The Bochnia Salt Mine was probably established sometime before 1247, making it one of the oldest business enterprises in the world. However, salt production was stopped in 1990, but the mine is still active, mostly as a tourist attraction. In the past, together with the Wieliczka salt mine, it formed one company, located at the foot of the Carpathian Mountains: The Wieliczka and Bochnia Royal Salt Mines (Figure 1).
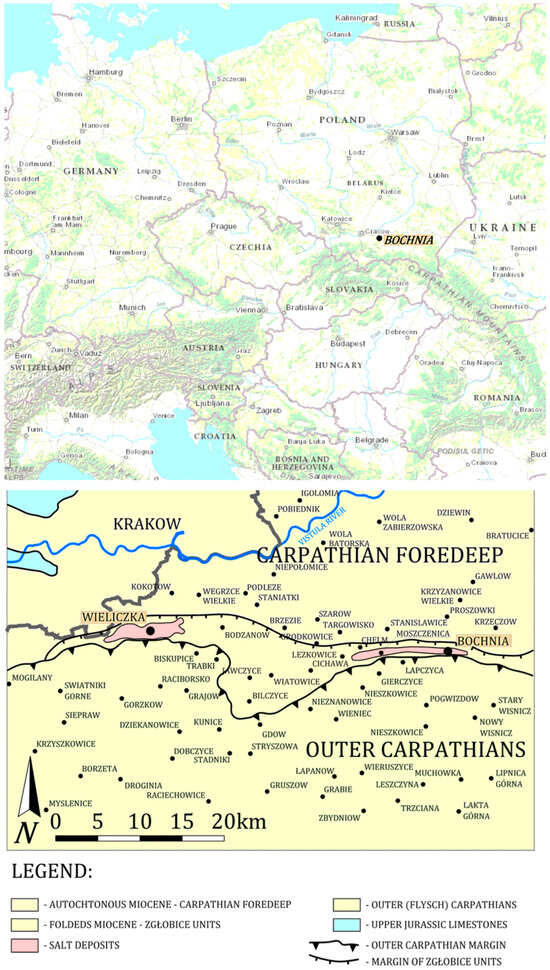
Figure 1.
Location of the Bochnia salt deposit, and simplified geological map and location of the deposit (based on [1]).
The Bochnia Salt Mine contains many artifacts of mining from the past. The historical sites with old chambers and galleries with several historical chapels carved out in salt are situated in the upper part of the mine. Kilometers of galleries with works of art, underground chapels and statues sculpted in the salt make for a fascinating pilgrimage into the past (see: https://whc.unesco.org/en/list/32, URL accessed on 15 June 2025). But it also presents us with the responsibility to secure and preserve these historical relics.
Since the late 15th century, the Wieliczka and Bochnia Royal Salt Mines have been a frequent destination for visitors, but during these times, only members of the upper classes were admitted. The first tourist route dates back to the early 19th century. The modern touring route in the Bochnia Salt Mine was arranged in 1993, and it is situated between two main shafts: the Sutoris (from the 13th century) and the Campi (from the 16th century). These two shafts are connected by a longitudinal gallery of the first mine level called August. The level founded at the beginning of the 18th century is situated at a depth of 212 m below the ground surface (about 30 m above sea level), and has a length of 3 km. The sections open to tourists, over 2 km long, lead through old workings of the mine. These include galleries, crosscuts and internal shafts in the mine.
Geologically, the area is located in the contact zone of two large tectonic units: the Carpathian Foredeep Basin and the Outer Carpathians. The salt deposit was tectonically deformed in an extreme way, and mining operations carried out in this complicated geological environment faced technical problems. One such problem was the large compression activating the convergence of the workings. This problem still exists, so due to its unique historical and natural values, the Bochnia Salt Mine underground safety works are still in existence and this object of cultural heritage is under constant maintenance of the national historic preservation office. Another factor contributing to the preservation of historic mining excavations is the result of the geomechanical properties of salt rocks; fortunately, the plasticity of rock salt is the main “damper” on the cave-in process, so the old excavations in the Bochnia Salt Mine are able to still be maintained.
Fundamental to this protection activity is the geodetic monitoring of the underground excavations. A network of control points and benchmarks, and regularly carried out surveying works allow us to monitor the development of the convergence process, which varies in different parts of the mine and varies over time. This geodetic safety monitoring also allows us to pinpoint areas requiring additional protection, make necessary modifications to existing support, and even to support the excavations themselves [2,3]. Additionally, geodetic monitoring also covers the ground surface which includes the urban development of the town of Bochnia and its surroundings.
Deformation studies carried out for several decades using conventional measurement instruments (levelers, professional measuring tapes, theodolites) have shown that the deformation of the mine workings, especially the chambers, is characterized by significant variability. Therefore, measurements are required that encompass a large number, preferably a cloud of points, contouring individual sidewalls, roof and floor to determine the full displacement field, as well as giving a more complete outline of the workings’ deformation, particularly convergence. High measurement precision and the determination of all measurement point coordinates are crucial. The use of a laser scanner meets these needs. Traditional measurement techniques, while still consistently useful, have limited application, especially when it comes to the measurement of complex-shaped objects like the Bochnia salt chambers.
Measurement results in the form of a point cloud, which precisely contours the excavations and provides high-resolution images of displacements, are crucial for assessing the safety of the excavation and developing reliable numerical models of its deformation. Such work has just been initiated at the Bochnia Salt Mine in the historic Saint Kinga Chapel. The primary objective of the geodetic monitoring discussed here was to determine the stability of the old workings, which are subject to constant rock mass pressure. This pressure results in the deformation of the original contours of the chambers and galleries, their tightening, the reduction in their cross sections, and even their complete closure. Systematically conducted geodetic measurements allow for the determination of the intensity of the tightening process, and provide guidance on the nature and scope of safety measures.
The authors here present the results of the new approach, including the results of previous measurements, along with a geodetic convergence model, the results of laser scanning, and the theoretical numerical modeling of the excavation deformation based on its precise geometry determined from the laser scanning and data gained from the geomechanical parameters of the salt rocks.
The presented research is preliminary, and its long-term practical application will involve the development of a high-resolution convergence model based on scanner measurements. This will allow for the identification of specific parts of the excavation that are moving in a particular manner. Subsequently, it will be possible to plan appropriate protection designs and wall treatments to maintain the excavation geometry. Furthermore, the numerical modeling studies can be improved with more detailed displacement characteristics. Current measurements using conventional measurements are point-based and do not allow for the development of a more detailed model of the excavation kinematics.
2. Geological Overview
The area site is situated about 40 km east of Cracow. Geomorphologically, the area under study is situated at the Raba River, in the Babica stream valley, at the boundary of the Carpathian Foothills and Sandomierz Basin. This area is distinguished by its location above a salt deposit that lies close to the surface and which was probably the reason for ancient settlement (the occurrence of surface brines). Ever since the first underground mining operations began in Bochnia, facts about the geological structure have been available. And over the centuries, this knowledge has continued to expand right up to present day. Geological studies of the geological structure date back to the early 19th century. In historical times, interest in the geology of the Bochnia area was practical and focused on mining operations, primarily identifying the presence of rock salt (especially uncontaminated salt). In modern times, research conducted by several generations of geologists has been multi-faceted: hydrogeological, mineralogical, examination of the deposit tectonics, and neotectonics, etc. The Bochnia mine is a mine of geological facts, phenomena and processes. Detailed information on this topic can be found in the extensive literature on the subject [4,5,6,7,8,9]. Limiting ourselves to the basic information that is relevant to the research presented below, we can list the basic facts related to the geological background:
- Geological position: The location of the Bochnia salt deposit is unique in the tectonic map of Europe, where the Alpine–Carpathian–Dinaridic orogenic system is clearly marked, and this includes the line of the Carpathian arc. The Bochnia area is located at the contact zone of two large tectonic units: the Carpathian Foredeep Basin and the Outer Carpathians (Figure 1 and Figure 2). The latter is assumed to be still tectonically active [10,11,12]. Therefore, it can be assumed that Bochnia finds itself in the northernmost region of recent tectonic activity in the Carpathian orogeny.
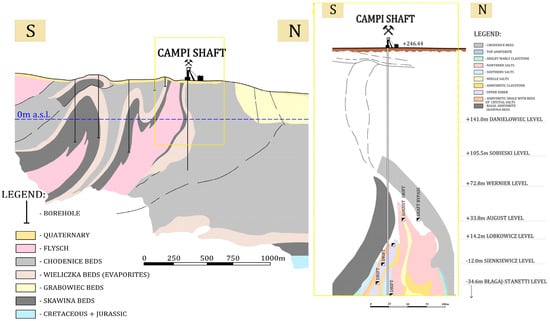 Figure 2. The geology of the Bochnia salt deposit: the cross sections through the Miocene salt deposits at the contact with the Flysch Carpathians in the area of Bochnia (on the left), and a simplified geological cross section through the Bochnia deposit at the Campi shaft (on the right) (according to Poborski [3], modified).
 - The general shape of the geological structure: The most significant geological feature of the area is its complicated tectonics. Since the Bochnia salt deposit is located at the front of the Carpathian overthrust and its formation resulted from the collision of large tectonic units, where the role of the ram was played by salt sediments, the strata have undergone extreme tectonic deformation over the years.
Thus, the uplift of the deposit was related to the overthrust movements of the Flysch Carpathians over the strata of the Carpathian Foredeep. Due to these movements, the salt series were thickened and uplifted toward the ground surface [3,4,5,6]. Finally, it was formed and situated in a narrow belt of folded Miocene strata, called the allochthonous unit, which spreads along the northern boundary of the Carpathians. Thus, in the area of Bochnia, in front of the Carpathians, two Miocene anticlines occur (Figure 1 and Figure 2). Also, the geometry of the salt deposit area on the map reflects the tectonic push on the salt layers: the 7 km long deposit has been compressed to a width ranging from a dozen meters to a maximum of 200 m. In the area under study, its width amounts to 50 m (Figure 3).
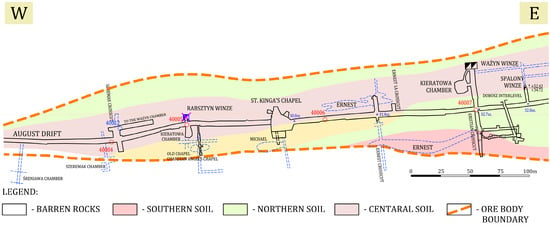
Figure 3.
The geological layout of the central part of the August gallery made on the basis of archival cartographic studies from the geological documentation of the Bochnia deposit (archives of the Surveying and Geological Department of the Bochnia Salt Mine).
- C
- The inner tectonics: Intense folding, a partial tectonic squeezing of certain limbs of the folds resulting in plastic translocation, the shearing of salt from the more rigid rock layers, and the accumulation of salt in the fold bends are reflected in the complicated internal arrangement and formation of structures that can be admired in the sidewalls of the mine workings. The profile of the salt series, which reaches a thickness of approximately 75 m, features numerous alternating layers of rock salt, anhydrite, gypsum, clay rocks, and mudstones. The numerous folds in the layers create impressive images on the sides of the Bochnia mine’s workings. Interbeddings of salt and anhydrite are often visible, demonstrating numerous tectonic deformations in the form of various folds and fractures. The high plasticity of evaporites and the elevated temperature and pressure have created a work of art of high artistic value. All the above-mentioned forms are valued not only by geologists and tourists, but also by collectors.
- D
- The intensive convergence: The extent of the convergence of the workings amounting to 6 mm/yr [13], considering the moderately depth of their occurrence, is remarkable, as previously discussed in [14]. This applies to both the vertical and horizontal compression, and the convergence processes, both of which pose a significant challenge for the services responsible for securing the excavations. The process is the result of rock mass stress, the distribution of which is likely to have been the result of a remnant of the action of geological forces in the Miocene and which are reflected in the tectonic setting. Furthermore, they may be the forces that currently manifest in the form of small movements of the rock mass and the terrain surface, or more precisely, they disturb the characteristics of the mine-induced deformations. The noticeable tectonic deformations and movements of the rock mass observed by geodetic methods have three sources [12]:
- -
- Tectonic—the tectonic stress of the Carpathian orogeny;
- -
- Mining—the effect of the plastic (most often) deformations of underground excavations;
- -
- Halotectonic (pushing salt masses upward).
The tectonic activity of the area has been the subject of widespread interest for successive generations of scientists [3,4,5,6,7]. Some more geological manifestations of tectonic stress in the mine, and within the salt deposit after its final formation, have been previously discussed in several articles [13,14,15].
An outline of the deposit geology is presented in order to allow us to better understand the complex measurement environment and the challenges faced by researchers assessing the deformation of the salt rock masses, particularly in those sections of the mine which were excavated centuries ago.
3. The Underground Surveying Monitoring
Due to its unique historical and natural values, the Bochnia Salt Mine is under constant care and underground safety works are still in progress. As mentioned before, the fundamental component of this activity is the geodetic monitoring, which has been carried out in underground excavations for decades. The results of these measurements are supervised by the District Mining Office in Cracow (a regional representative of the State Mining Authority). They are necessary for several reasons.
Firstly, they form the basis for the maintenance and continuous protection of the underground historical excavations. This is the primary mission of the mine. The salt mine is legally protected both as a Monument of History (presidential decree, September 2000) and also as a place of importance to cultural or natural heritage. As such, they have been placed on the UNESCO World Heritage List. The protection of the monuments is the responsibility of the Conservator’s Office for Protecting Historic Monuments, and the application to the mine of mining laws and regulations, as was mentioned, is the responsibility of the Cracow District Mining Office (see https://whc.unesco.org/en/list/32, URL accessed on 15 June 2025).
Secondly, regarding the safety of mine visitors, the primary goal of qualified underground tourism is to ensure the complete safety of tourists in the underground chambers. Therefore, the Bochnia Salt Mine is obligated to monitor the excavations that form part of the tourist route and the sanatorium [16]. This monitoring includes, among other things, daily inspections of the condition of tourist trail equipment, the condition of sidewalls, and excavation support, as well as periodic geodetic measurements of deformation parameters (usually once a year).
And thirdly, it is important because it helps to safeguard the development of the town of Bochnia [1,2]. Any losses in the stability of the old mine workings could have led to, and could still lead to, a construction disaster on the ground level as sinkholes [17,18].
An important feature of the salt rock mass is the maintenance of the coherence and continuity of its deformation over time, but any exceeding of the strength limit would cause the loss of rock mass cohesion and lead to collapses. This phenomenon can be caused by changes in the physical conditions during the deformation process, such as temperature changes, or by changes in the stress field, etc. Hence, there is a clear need for monitoring to ensure the continued existence of the mine workings at the Bochnia Mine.
Broadly speaking, mine surveying in the Bochnia Salt Mine has a long history, addressing geological, mining and networking (cartographic) matters. The historical documents devoted to the mine surveying have survived through the ages, but so has the geodetic infrastructure itself (control points, benchmarks), so they are still of use today. Unfortunately, the distribution of control points and benchmarks is quite uneven (for example, in some chambers, there are no control points), and many are missing (their loss is due to the fact that there has been frequent renovation work).
Over 30 years of research has provided interesting insights regarding the displacements of underground measurement points. What is unique is the wide variation in the displacements and the resulting convergence throughout the mine. The characteristics of the compression process vary between adjacent workings. The salt chambers also exhibit variations in the displacement of control points, reflecting the movements of the entire chamber or its individual components. Moreover, previous studies indicate that the compression of workings in the meridional direction is much greater [13]. The most recent research, based on measurements enabling the extension of the observation of displacements in the space outside the underground workings, yet just inside the rock mass that has been penetrated by extensometer probes, has yielded a completely new type of result. It has shown that in the process of the horizontal compression of the chambers, the S component (from the south) plays a greater role than the N component [15,19]. To date, there are no measurements of the absolute values of the horizontal displacements of points made with satisfactory accuracy, which would allow for determining the detailed characteristics of the displacement of individual sidewalls. The situation is different in the case of vertical convergence. Here, it is known that the vertical displacements of the roof are greater than the floor subsidence, and it is this which is the cause of the vertical convergence of the workings.
The most important aids to research are the leveling surveys, and their provision of a vertical displacement is the basic parameter depicting the deformation process in the Bochnia mine. In the rock salt mass in the Bochnia mine, both horizontal and vertical components of the displacement vectors are similar, which is curious when compared with other types of rock masses [20,21]. The results of leveling measurements are used for the calculation of vertical convergence. This parameter is estimated on the basis of both the determined vertical displacements of the roof benchmark (dHroof) which is at the upper end of the baseline, and the displacements of the floor benchmark (dHfloor) which is located just below and constitutes the lower end of this line. The vertical compression of the chamber is the result of different rates of vertical displacements of the roof and the floor.
The horizontal component of the deformation process is only determined as a relative measurement, seeing that it is derived from a relative change in length of the baselines. These surveying measurements provide data that can determine horizontal convergence. This is another parameter which is applied in the deformation control and periodic safety assessments in Bochnia. Convergence is the closure of the workings (chambers, passages etc.), and it refers to the negative increment in the distance between the walls of the excavation which results in the expression of convergence in linear units, e.g., millimeters. The finite closure process in the salt rock mass takes place over hundreds of years, which results from the rheological properties of rock salt [20,22].
A new, very effective tool for studying the deformation of historical mine chambers is laser scanning. Scanning total stations and laser scanners are now popular data acquisition tools for developing architectural and construction documentation, and for the 3D visualization of various important objects, such as historical monuments, industrial facilities, etc. [23,24]. Due to the huge amount of data acquired in the form of point clouds, a comprehensive image of the object’s geometry is obtained within the range of the sight view of the instrument, with a resolution adjusted to the characteristics of the surfaces being measured or the purpose of subsequent processing. Laser scanning is an automated form of classic reflectorless measurement, allowing for capturing multi-million-point clouds (measuring horizontal and vertical angles and distances in relation to various types of geodetic signals in a relatively short time) (Figure 4). Measurements taken from different locations are combined and transformed in specialized cloud-based programs. A three-dimensional point cloud is the result of laser scanning and is often considered a full commercial product in the form of a point model. This point model of St. Kinga Chapel at the Bochnia Salt Mine was obtained by the authors using a precise Trimble SX 10 scanning total station (Trimble Inc., Sunnyvale, CA, USA) (Figure 5). The basic technical parameters of the SX 10 are provided in Table 1.
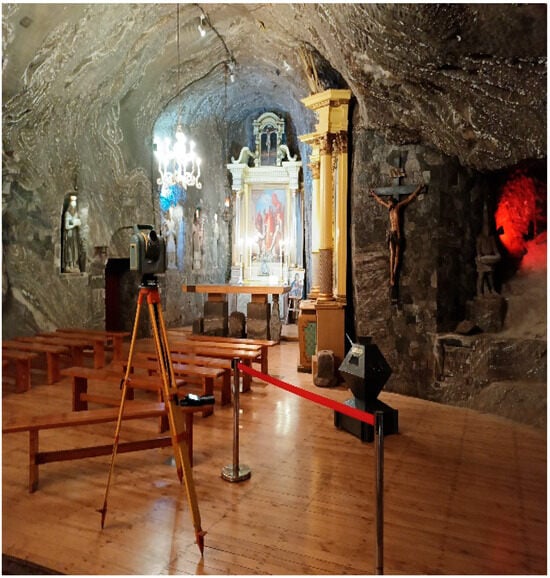
Figure 4.
The Saint Kinga Chapel. The Trimble SX10 Scanning Total Station SX10 during scanning of the St. Kinga Chapel in the Bochnia Salt Mine (phot. by Rafał Gawałkiewicz).
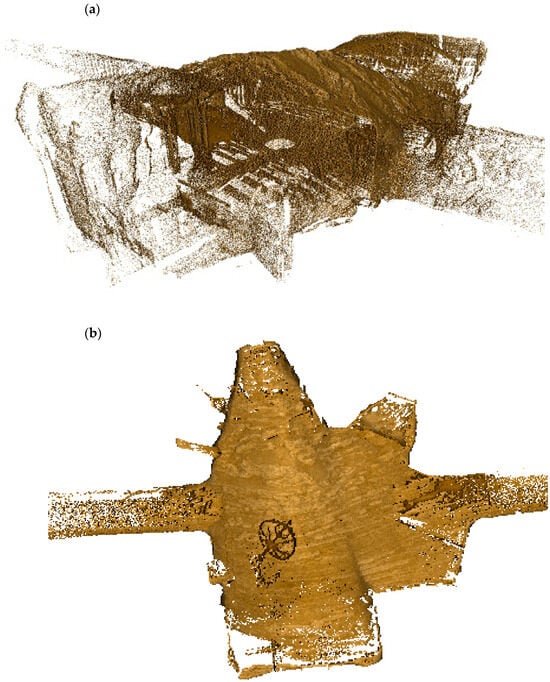
Figure 5.
The Saint Kinga Chapel. View of a single-point cloud acquired with use of the Trimble SX10: (a) from the SE direction; (b) from the top.

Table 1.
The basic technical specifications the Trimble SX10 Scanning Total Station SX10 [25].
Over the years, measuring the geometric changes in the workings at the Bochnia Salt Mine has evolved, as has their accuracy. Today, horizontal convergence baseline length measurements are determined using a mining tape, which guarantees an accuracy of mHL = ±1 mm. For vertical baseline height changes, leveling techniques have been used for years, starting from simple techniques in the past to precise ones today, using precision invar bars. The authors’ mining experience indicates that the estimated accuracy of leveling lines conducted in the Campi Shaft—St. Kinga’s Chapel—Sutoris Shaft direction (line length approximately 1 km) have a maximum error of determined benchmark heights in the Chapel of mH = ±0.75 mm (after strict alignment). Therefore, in the case of horizontal measurements of convergent bases using a mining tape, the significance level of length changes ΔHLi,i+1 is determined using the following formula:
where
ΔHLi,i+1 ≤ k · mΔHLi,i+1
- mΔHLi,i+1 —mean error in determining the length change;
- k—significance factor, which, due to high accuracy and repeatability, was assumed to be k = 1 for a confidence level of a = 0.6828).
This means that actual length changes are assumed if the base changes (lengthening or shortening) by the following value:
mΔHLi,i+1 = ±m2HL · √2 = ±1.4 mm
Using the above assumptions for vertical bases, the significance level of height changes ΔH is determined using the following formula:
ΔHi,i+1 ≤ k · mΔHi,i+1
If the error in determining the height of a single point for the chapel points in subsequent measurement campaigns is mH = ~±0.75 mm, then the limit of significant changes for vertical bases is determined using the following formula:
mΔHi,i+1 = ±m2H · √2 = ±1.1 mm
The above analysis shows that the error value is an order of magnitude smaller than the annual changes in vertical displacements and has no impact on the trend values presented below. The same is true for horizontal convergence measurements, but the annual convergence values are smaller than those for vertical convergence. More valuable information on the measurements can be found in [19,20,21].
4. The Saint Kinga Chapel: Measurement Results and Kinematics of the Chamber
On the August level, approximately halfway between the two main shafts (the Sutoris and the Campi), is situated The Saint Kinga, the largest chapel in the Bochnia mine (Figure 3). This is one of the biggest tourist attractions of the Bochnia mine and was opened in 1747, and is still used for official ceremonies. It is the largest of the existing chapels in the mine, and its current appearance and décor date from the early 20th century. The chapel consists of several parts: the main nave, chancel, sacristy, choir, a niche with Christmas decorations and a short walkway under the choir. The chapel is furnished with two altars and several sculptures carved in both wood and rock salt. It is about 31 m long, 21 m wide, and has an average height of 5–6 m. Its total area is 258 m2. Very distinct features of salt tectonics are exposed on the walls and the roof.
Due to the complex geometry of the chamber, the measurements required multiple instrument stations, and the scans were combined based on the surveyed geodetic return signals, which were uniquely mapped onto two overlapping scans. Of course, obtaining more precise and illustrative forms required further processing, involving the conversion of the large-file point model into shell or solid models. The cloud’s basic model provided the basis for generating derived visualizations in the form of cross sections and 3D models. The derived models provide a clearer image of the significant details of the geometry of the examined object or its changes over time. This is crucial for monitoring its technical condition and predicting threats (discontinuous deformations). The results are outlined in Figure 5.
The chapel is subjected to compressive forces which are manifested by, among other things, bulging walls and cracks which are easily visible in the unsupported section without timbers. Particularly distinguishing cracks and fissures (currently being repaired) occur at the western entrance and at the entrance to the walkway under the choir, which has a partially supported roof.
As a special feature of the Bochnia Salt Mine, a network with a large number of control points was established in the chapel chamber (Figure 6). Regular convergence measurements have been conducted since 1993. Since 1998, they have been carried out at semiannual intervals, and since 2012, at annual intervals. Basic surveying includes the following: a leveling of the roof and floor benchmarks, and the length measurements of the convergence baselines (22 linear measurement baselines and 11 baselines of leveling measurements). The main aim of the measurements is presented as displacements of control points expressing the rock mass movements of either the entire chamber or its individual elements, and also the differentiation of this process, which, in individual cases, gives evidences of geometric deformations (vertical and horizontal displacements, convergence).
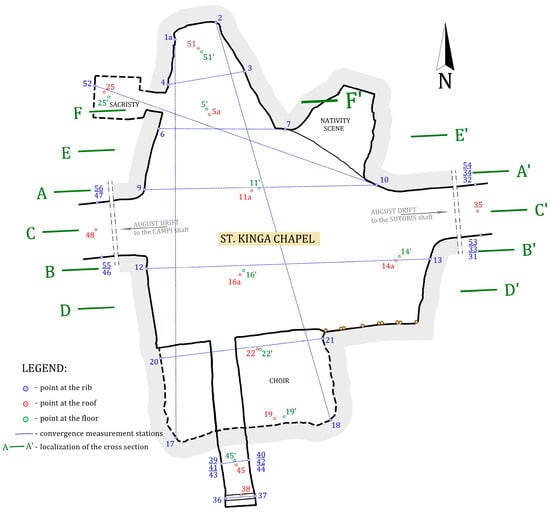
Figure 6.
The monitoring network in the Saint Kinga Chapel. Localization of the benchmarks, control points, baselines and cross sections used in numerical modeling.
The average annual height changes for benchmarks determined from leveling measurements are presented in Table 2. The roof subsidence rate in the chamber between 2014 and 2024 ranged from −8.8 mm/yr to −15.4 mm/yr (average −11.4 mm/yr), and is has shown high stability over time (Table 2). The highest displacement rates occur in the highest, central part of the chamber, and at its southern and eastern edges. The lowest values are on the northern side near the altar. The annual subsidence of the chamber roof is approximately twice as great as that of the floor. The exception is the northern end of the chamber, where the subsidence of the roof and floor is almost the same. The rate of roof subsidence in the chamber ranged from −3.6 mm/yr to −8.7 mm/yr (average −5.6 mm/yr) during the 2014–2024 period (Figure 7).

Table 2.
The deformation parameters determined on the base of measurements of benchmarks and baselines involved in surveying monitoring in the Saint Kinga Chapel during the 2014–2024 period. Downward vertical displacement and distance reduction are expressed by negative values.
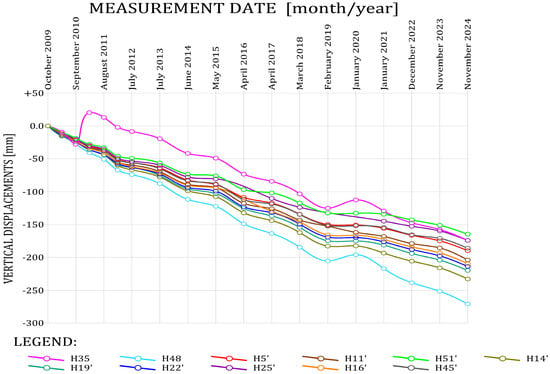
Figure 7.
The vertical displacements of the benchmarks in the Saint Kinga Chapel since 2009.
Based on these leveling measurements taken at ten measurement baselines, vertical convergence was determined (Table 2, Figure 8). During the 2014–2024 period, length changes for vertical baselines ranged from −1.3 mm/yr to −8.2 mm/yr (average −5 mm/yr). The highest compressive convergence was observed at baseline H14-H14′ (the southeastern part of the chamber). However, due to its short length, this is a specific base. The stability of the chamber compression process is characteristic: analyzing the distribution of vertical displacement and convergence rates, it is apparent that although different points and measurement baselines exhibit different time-dependent changes, the temporal changes in the parameters demonstrate high stability in the deformation process (Figure 7, Figure 8 and Figure 9).
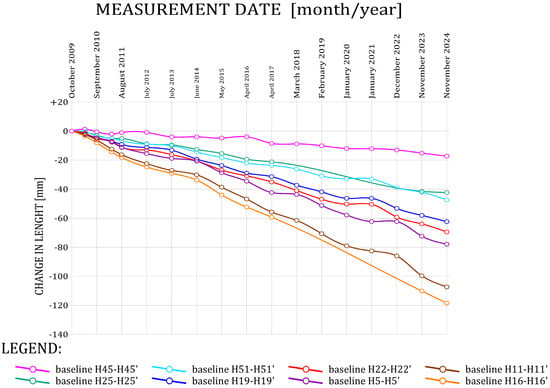
Figure 8.
The convergence values determined on the base of leveling measurements in the Chapel since 2009.
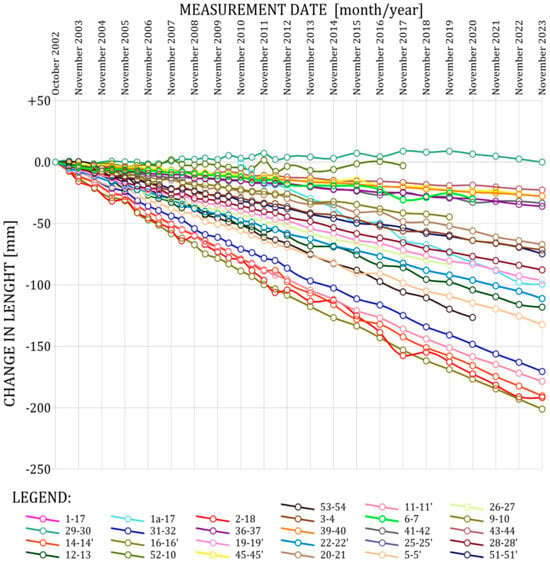
Figure 9.
The values of convergence determined for the baselines in the chapel since 2002.
Understanding the cause of the vertical compression of the chamber becomes easier after analyzing the distribution of displacements in the roof and floor. The presented maps of annual subsidence illustrate significant differences in the characteristics and magnitude of the subsidence of both surfaces (Figure 10). The greatest values of subsidence of the floor occur in the northern and southern parts of the chamber. In the case of the roof, however, it occurs in the areas of the western and eastern exits at the intersection with the August gallery. However, the greatest differences in the subsidence of both surfaces, i.e., the greatest convergence, occur, as already mentioned, in the southeastern part and also in the central part of the chamber.
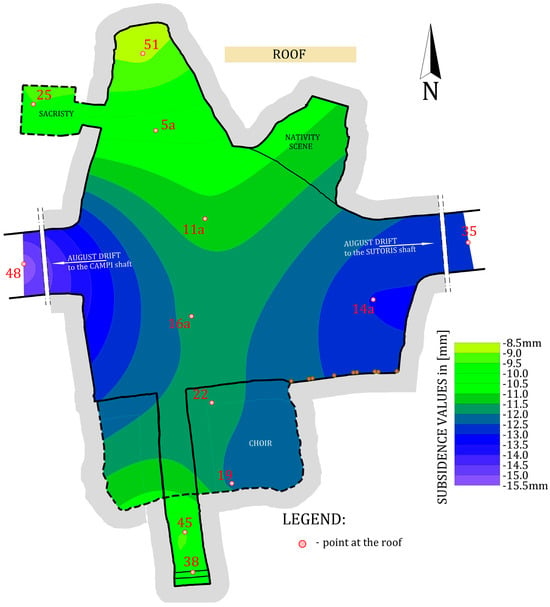
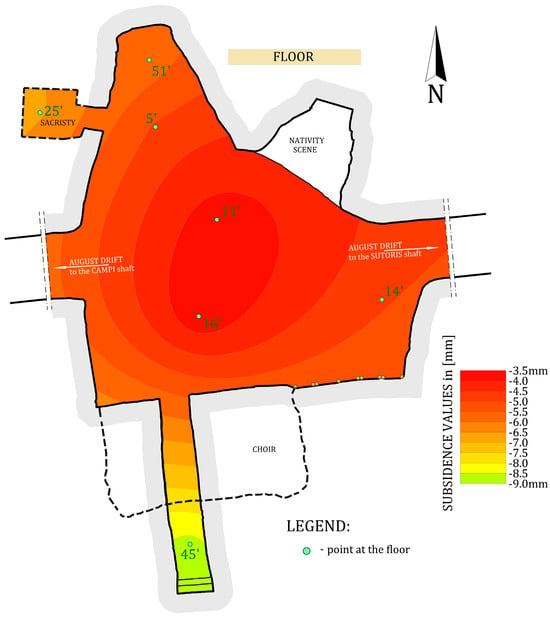
Figure 10.
The Saint Kinga Chapel. The annual vertical displacements of the chamber’s roof (the upper map) and floor (the lower map).
Horizontal baselines also demonstrate high deformation stability. Table 2 presents the average annual convergence values observed for each individual baseline in 2014–2024. Significant variations are also visible in this case. However, as can be seen in the plot of the distribution of annual convergence rates determined since 2002, the deformation process is stable, and the annual changes in the length for each individual baseline over time are constant (Figure 9). However, as can be seen in the presented distributions, the annual convergence values for baselines show high variability, ranging from −1.3 mm to −8.2 mm, with these values oscillating around a mean of approximately 5 mm.
However, the measurements in the passages at the western and the eastern entrances to the chapel provide a different deformation characteristic. At the western entrance, there are two baselines (55–56 and 46–47) used in horizontal convergence measurements and one roof benchmark (48) used in leveling. The observed convergence values have amounted to −11.42 mm/yr and −15.54 mm/yr, respectively. The eastern entrance is remarkable due to a baseline placed in one vertical plane at different levels (one above another).
Long-term measurements have revealed significant variation in their length, which is the cause of differential compression at different heights of this mining gallery. Baselines 31–32, 33–34 and 53–54 are located at 1/4, 1/2 and 3/4 of its height, respectively. As can be seen from Figure 11, the greatest convergence occurs at mid-height, and the least at the baseline closer to the roof. The average annual convergence value at these baselines ranged from −8.4 mm to −7.4 m over the 2014–2024 period. These values are twice as high as the average convergence value found at the baselines in the chapel itself, but also half as low as the average annual convergence value found at the baselines at the western entrance. Figure 11 presents modeled values of displacements of benchmarks, which constitute the ends of the individual baseline. The horizontal displacement of each benchmark was determined as half of the convergence value determined for the individual baseline. Therefore, a uniform rate of horizontal displacement was assumed for the opposing benchmarks. The annual vertical convergence, which is a difference in vertical displacement of the roof and floor, in this section of the August gallery (right at the Chapel), is significantly greater (−7 mm) than the horizontal convergence (approximately −4 mm).
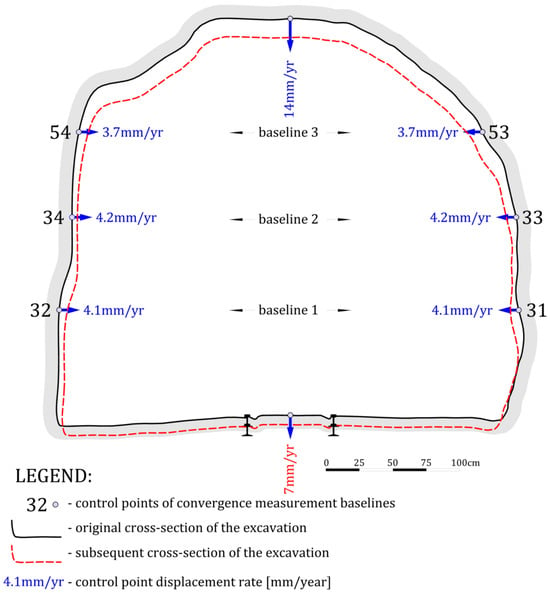
Figure 11.
The convergence values determined by the length measurements at the eastern entrance to the chapel.
This surprising variation in convergence values within such a short distance between baselines will be able to be explained in the future by the result from several years of measurements using a laser scanner (an appropriate time interval and a sufficient number of measurement campaigns to obtain a reliable displacement model is needed).
Considering the aforementioned variation in convergence values in different parts of the chamber, the authors propose incorporating laser scanning into the regular monitoring of the chapel. The recently performed measurements are preliminary, and the results of these measurements allowed us to obtain a geometric model of the chamber for deformation modeling purposes using the previously mentioned geodetic data and theoretical numerical modeling.
5. Numerical Modeling and Results
Numerical calculations were performed using the RS3, version 4.038 software, which uses the finite element method in a three-dimensional system. However, in the case of the geomechanical conditions under consideration, scientific achievements regarding salt rocks are important. Deformation studies conducted in recent years have yielded interesting results. For example, the authors of the paper [26] compared vertical and horizontal displacements in salt caverns modeled using Flac3D. Analysis of the results showed that horizontal displacement exhibits clear symmetry.
The influence of rock mass stratification significantly affects the stability of excavations, especially in conditions of high horizontal stresses [27,28]. Zhang et al. included bedded rock salt formation in their numerical models [29]. The models revealed a relationship between radial displacement and internal pressure. The models revealed a relationship between radial displacement and internal pressure. Wang et al. found that in stratified salt formations, an increase in the thickness of the cavern-bearing salt formation results in greater surrounding rock displacement and cavern shrinkage [30]. Weber and Konietzky presented mechanisms for assessing the long-term safety of abandoned salt mines using spatial numerical modeling based on difference and finite element methods [31]. Reza et al. drew attention to the fact that the creep of the rock salt can be a major cause of casing collapse [32]. Bui et al. stated that rock salt can be modeled by a viscoplastic steady-state double-power creep law combined with the Mohr–Coulomb and Hoek–Brown plastic models [33]. Zhang et al. determined that in numerical modeling of salt deposits, the displacement of the surrounding rock can be controlled by increasing the geological strength index, which is an essential parameter of the Hoek–Brown criterion or operating pressure, while the displacement increases with increasing the dilation angle [34]. Yu et al. found a relationship between the salt layer with a large inclination angle and the stability of the cavity [35]. Escanellas et al. suggested that for the salt rock materials, loading rate dependency is due to mechanisms developed within the fracture process zone [36].
The computational model in this study shows the spatial representation of the mining and geological situation in the area of The Saint Kinga Chapel in the Bochnia Salt Mine. The calculations concerned the state of total displacement. For the calculations and analyses, six cross sections were made for the St. Kinga Chapel, spaced 2 m apart (Figure 6 and Figure 12). The cross sections were made on the base of data obtained by measurements with the use of laser scanning. As mentioned before, this method in the chapel’s conditions is important for precise geometrization. Hence, the points contouring the complicated geometric model of the chamber were imported to AutoCAD, version 2025 software and then imported into the RS3 software. The cross sections were then combined to form the chamber’s body (Figure 12 and Figure 13).
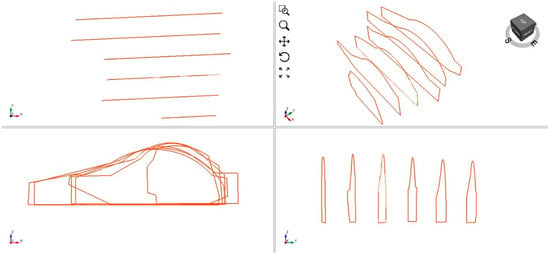
Figure 12.
Cross sections for the Saint Kinga Chapel.
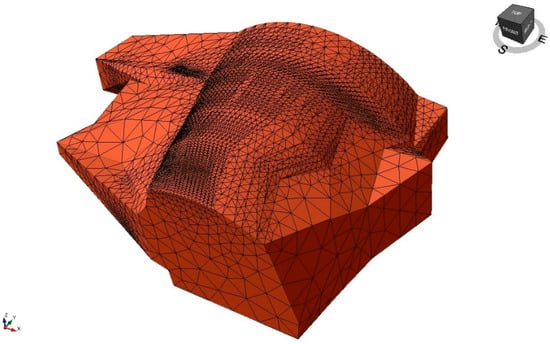
Figure 13.
The structure of part of the Saint Kinga Chapel.
The dimensions of the spatial computational model are 50 m × 50 m × 50 m, which was dictated by the possibilities of representing the most critical mining situation from the point of view of the total displacements (Figure 14).
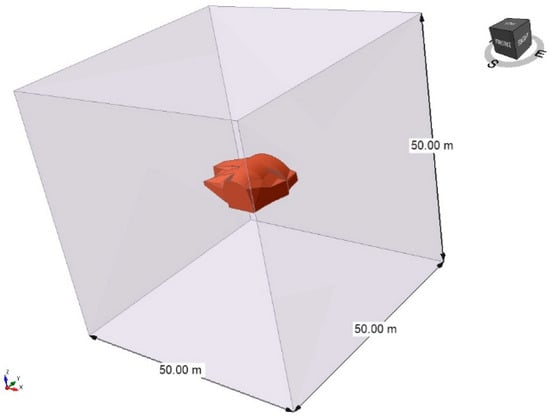
Figure 14.
The mining situation reproduced in the computational model for the St. Kinga Chapel.
Calculations were performed on a three-dimensional model representing a section of the rock mass encompassing the roof and floor rocks in the area of St. Kinga Chapel. Structural, strength and deformation parameters were adopted based on laboratory test results [37]. The model assumed that the roof and floor of the excavation contained a salt layer with the following parameters: unit weight: 0.027 MN/m3, Poisson ratio: 0.25, Young modulus: 986 MPa, tensile strength: 0.95 MPa, friction angle: 19.1°, cohesion: 0.97 MPa. The parameters adopted for the calculations should be considered as corresponding to the properties of the rock mass in the considered region. The model was loaded by the self-weight of the rock mass, and the load of the overlying rocks at a depth of H = 212 m for this part of the salt seam. Due to the conditions of high horizontal convergence, a horizontal normal stress was applied to the lateral surfaces of the model, 20% greater than the vertical stress. The calculations were performed using an elastic–plastic physical model with the Coulomb–Mohr yield condition. Figure 6 and Figure 15 present six cross sections: A-A, B-B, C-C, D-D, E-E and F-F, for which total displacement calculations were performed. The calculations yielded a number of results, and the most significant values of total displacements from a geomechanical perspective are presented in Figure 16.
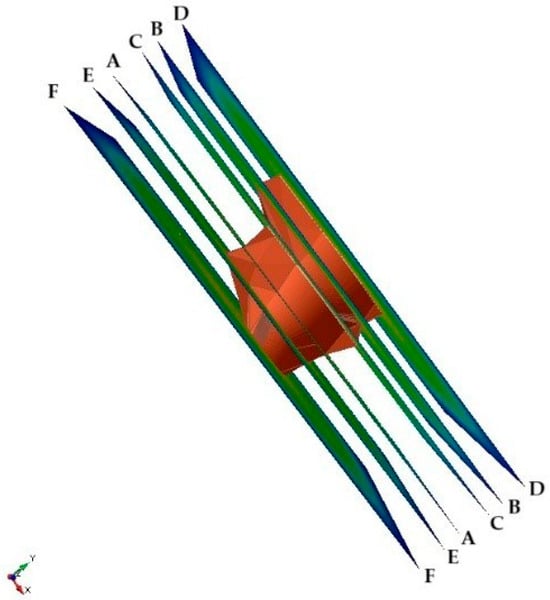
Figure 15.
Cross sections for the model of St. Kinga Chapel: letters: A, B, C, D, E, F—indicate cross-sections.
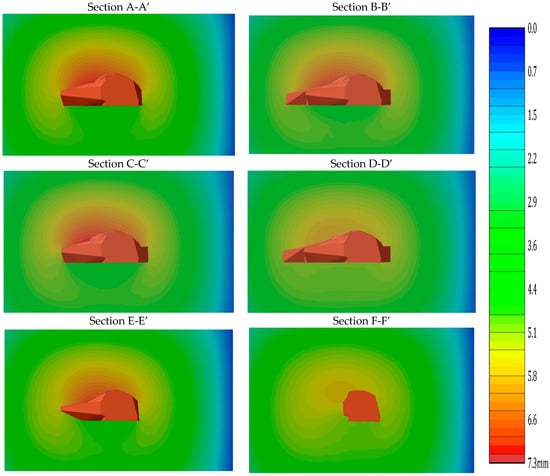
Figure 16.
The Saint Kinga Chapel. The displacements determined in individual cross sections.
In order to better localize the distribution of total displacements, isosurfaces with values of 7 mm (Figure 17), 6 mm (Figure 18) and 5 mm (Figure 19) were created.

Figure 17.
Total displacements with an isosurface of 7 mm: (a) 3D view, (b) cross section.
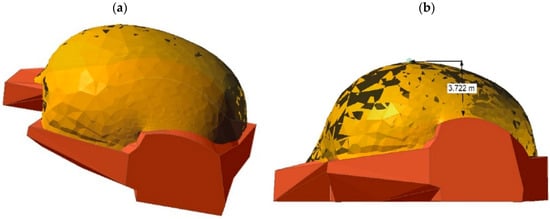
Figure 18.
Total displacements with an isosurface of 6 mm: (a) 3D view, (b) cross section.
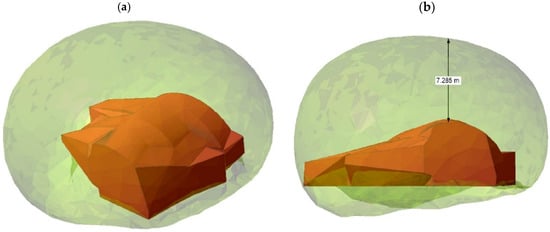
Figure 19.
Total displacements with an isosurface of 5 mm: (a) 3D view, (b) cross section.
Based on the numerical modeling, for the Saint Kinga Chapel, it can be concluded that the chamber geometry and the radius of the roof arc connecting with the sidewall have the greatest impact on the obtained total displacement results. Moreover, the maximum value of total displacement of 7 mm occurs at the roof of the excavation for cross-section E-E, but this is less than the chamber height in the largest cross-section C-C. However, as can be seen in outlined deformations, the value of total displacement above the chamber roof for a value of 6 mm occurs for cross-section C-C and is 3.722 m. Compared to the value of 5 mm, this value is 3.563 m lower.
Dunn et al. [38] stated that a major advantage of the 3D laser mapping system is the possibility of applying this method to underground coal mining, particularly in coal dust explosion-prone areas in Australia. Yang et al. [39] combined 3D laser scanning image results with deep learning models to predict roof stresses in mined areas. Gašinec et al. [40] used a tachymetric method and terrestrial laser scanning to determine the morphometric parameters of the interpolation function for the Great Hall of the Dobšinská Ice Cave. Dušeková et al. [41] used various 3D scanner models for the long-term monitoring of ice excavations. For the Dobšinská Ice Cave in Slovakia, they found that a mobile 3D scanner offered the best balance between time and accuracy. However, for assessing more detailed changes in ice morphology, a stationary scanner is preferable. The specific geological and microclimate conditions in the Dobšinská Ice Cave necessitate the use of close-range digital photogrammetry in some areas to map and monitor the ice surface shape [42]. Štroner et al. [43] found that for underground mining conditions, new SLAM (Simultaneous Localization and Mapping) scanners provide similar accuracy to static scanners and collect data faster, which represents an improvement in measurement techniques.
6. Conclusions
The Saint Kinga Chapel in the Bochnia Salt Mine is a site with a unique measurement environment. It is located in the central part of the mine and at the center of a tourist route and requires significant care and investment due to compressive deformation processes and the need to maintain it for historical and tourist purposes. The complicated geometry and characteristics of the deformation process make this site unique from the perspective of the geometrization of this salt chamber and also from its deformation modeling. This paper proposes a regular deformation monitoring routine with the additional use of laser scanning. The analyses conducted allowed for the formulation of conclusions that serve as the starting point for further monitoring activities.
The most fundamental result of the conducted research on chamber deformation is the discovery of completely different characteristics of deformation (convergence) between the model and empirical results.
The differences in the deformation process between particular parts of the chamber are surprising, and this is due to the impossibility of modeling this complicated characteristic without introducing additional forces. Such interactions could originate from neighboring chambers, which are also undergoing convergence. However, no such chambers and forces exist in the vicinity of the chapel.
Thanks to scanning, it was possible to obtain an accurate geometric model and gauge its precise volume. Numerical analysis enabled the identification of locations with specific deformations, which have not yet been covered by geodetic measurements. These locations were difficult to access for conventional measurements at the time the measurement bases were established. The use of a laser scanner solves these types of problems. The theoretical deformation model in addition provides guidance on locations at particular risk, and this encourages the potential expansion of the scope of its particular type of measurement work.
A detailed model of the chamber’s movements has not yet been developed. This is due to the lack of appropriate measurements that would allow for a detailed model of the displacements of the entire chamber, not just at scattered measurement points. The presented study aims to outline the problem and indicate a path for further necessary work with the additional use of a laser scanner for obtaining a high-resolution geometric model. It is important not only for determining deformations in further periodic measurement campaigns, but also for the numerical modeling of these deformations.
The presented research is, as already mentioned, pioneering. No one has conducted numerical modeling of this facility prior. Future planned research will allow for the implementation of appropriate strategies for securing work. Such work must be conducted based on measurement data, while theoretical modeling will allow for the development of long-term forecasts of chamber movements and the planning of long-term securing work. The mine also conducts such planning in connection with estimating budget of the mine’s operation plan.
In future years, measurements using a scanner will provide a more detailed outline of the displacement distribution of individual chamber fragments. Conventional measurements will, of course, continue due to legal requirements (e.g., the need to maintain a geodetic control network). However, by using both measurement methods (conventional and scanning), it will be possible to achieve mutual verification of the measurement results. This will contribute to greater reliability of the obtained results and a more reliable assessment of deformation. At the same time, the characteristics of geometric changes can be used to improve theoretical numerical models. In the approach presented here, the results of the survey measurements are primarily used to build the geometric model. Due to the lack of a comprehensive convergence model (for all excavation fragments), reliable calibration of the theoretical model is not possible at this stage.
The authors plan a series of future activities that will contribute to the development of the so-called open laboratory concept. The authors plan a series of future activities that will enable the presented work to fit into the popular trend of building so called open laboratories (see example [44]). In this case, this will mean using research for educational and promotional purposes for young people who frequently visit the Bochnia Salt Mine.
Author Contributions
Conceptualization, Z.S., K.S. and R.G.; methodology, Z.S., K.S. and R.G.; software, Z.S., K.S. and R.G.; validation, Z.S., K.S. and R.G.; formal analysis, Z.S., K.S. and R.G.; investigation, Z.S., K.S. and R.G.; resources, Z.S., K.S. and R.G.; data curation, Z.S., K.S. and R.G.; writing—original draft preparation, Z.S., K.S. and R.G.; writing—review and editing, Z.S., K.S. and R.G.; visualization, Z.S., K.S. and R.G.; supervision, Z.S., K.S. and R.G.; project administration, Z.S., K.S. and R.G.; funding acquisition, Z.S., K.S. and R.G. All authors have read and agreed to the published version of the manuscript.
Funding
This research received no external funding.
Institutional Review Board Statement
Not applicable.
Informed Consent Statement
Not applicable.
Data Availability Statement
The raw data supporting the conclusions of this article will be made available by the authors on request.
Acknowledgments
Special thanks to the Directorate of the Bochnia Salt Mine, Andrzej Kawalec and other employees of the Bochnia Salt Mine Surveying Department for providing the data from the convergence measurements and which were used here. We are also grateful to our editors, especially Sara, whose support was invaluable.
Conflicts of Interest
The authors declare no conflicts of interest.
References
- Wiewiórka, J.; Dudek, K.; Charkot, J.; Gonera, M. Historic salt mines in Wieliczka and Bochnia. Geoturystyka 2008, 4, 61–70. [Google Scholar] [CrossRef]
- Wiewiórka, J.; Dudek, K.; Charkot, J.; Gonera, M. Natural and historic heritage of the Bochnia salt mine (South Poland). Stud. Univ. Babes-Bolyai Geol. 2009, 54, 43–47. [Google Scholar] [CrossRef][Green Version]
- Szczerbowski, Z. Irregularity of Post Mining Deformations as Indicator Revealing Effects of Processes of Unknown Origin in Area of Bochnia. Geoinform. Pol. 2020, 19, 81–93. [Google Scholar] [CrossRef]
- Poborski, J. The Bochnia salt-deposit on the geological background of region. Biul. Inst. Geol. 1952, 78, 1–160. (In Polish) [Google Scholar]
- Poborski, J.; Skoczylas-Ciszewska, K. About the Miocene in the zone of Carpathian thrust margin near Wieliczka and Bochnia. Rocz. PTG 1963, 33, 363–385. (In Polish) [Google Scholar]
- Garlicki, A. Autochthonous salt series in the Miocene of the Carpathian Foredeep, between Skawina and Tarnów. Biul. Inst. Geol. 1968, 215, 5–77. (In Polish) [Google Scholar]
- Garlicki, A. Sedimentation of Miocene salts in Poland. Prace Geologiczne PAN 1979, 119, 1–67. (In Polish) [Google Scholar]
- Tarka, R. Tectonics of some salt deposits in Poland based on mesostructural analysis. Prace PIG (PGI Bull.) 1992, CXXXVII, 1–47, (In Polish, English Summary). [Google Scholar]
- Burliga, S.; Krzywiec, P.; Dąbroś, K.; Przybyło, J.; Włodarczyk, E.; Źróbek, M.; Słotwinński, M. Salt tectonics in front of the Outer Carpathian thrust wedge in the Wieliczka area (S Poland) and its exposure in the underground salt mine. Geol. Geophys. Environ. 2018, 44, 71–90. [Google Scholar] [CrossRef]
- Zuchiewicz, W. Geodynamics and neotectonics of the Polish Outer Carpathians. Prz. Geol. 2001, 49, 710–716, (In Polish, English Summary). [Google Scholar]
- Zuchiewicz, W. Quaternary tectonics of the Outer West Carpathians, Poland. Tectonophysics 1998, 297, 121–132. [Google Scholar] [CrossRef]
- Poborski, J. Geological introduction to the problems of geodynamic menaces in Wieliczka Salt Mine. Stud. Mater. Hist. Saltworks Poland 1982, 11, 17–28, (In Polish, English Abstract). [Google Scholar]
- Toboła, T.; Bezkorowajny, A. Neotectonic and recent movements revealed in the Bochnia Salt Mine. Geologia 2006, 32, 5–19, (In Polish, English Summary). [Google Scholar]
- Szczerbowski, Z.; Kaczorowski, M.; Wiewiorka, J.; Jóźwik, M.; Zdunek, R.; Kawalec, A. Monitoring of tectonically active area of Bochnia. Acta Geodyn. Geromater. 2016, 13, 59–67. [Google Scholar] [CrossRef]
- Szczerbowski, Z.; Niedbalski, Z. The application of a sonic probe extensometer for the detection of rock salt flow field in underground convergence monitoring. Sensors 2021, 21, 5562. [Google Scholar] [CrossRef] [PubMed]
- Chmura, J.; Migdas, T. Bochnia chambers in the “Bochnia” salt mine combined with a surveying proposal of new sites. Górnictwo I Geoinżynieria 2005, 3/1, 119–133. (In Polish) [Google Scholar]
- Dobos, E.; Kovács, I.P.; Kovács, D.M.; Ronczyk, L.; Szűcs, P.; Perger, L.; Mikita, V. Surface Deformation Monitoring and Risk Mapping in the Surroundings of the Solotvyno Salt Mine (Ukraine) between 1992 and 2021. Sustainability 2022, 14, 7531. [Google Scholar] [CrossRef]
- d’Obyrn, K.; Hydzik-Wiśniewska, J. Selected aspects of numerical modelling of the salt rock mass: The case of the Wieliczka salt mine. Arch. Min. Sci. 2013, 58, 73–88. [Google Scholar] [CrossRef]
- Szczerbowski, Z.; Niedbalski, Z.; Bednarek, Ł. Tectonic strain in salt rock mass based on measurements. Geol. Geophys. Environ. 2023, 49, 157–173. [Google Scholar] [CrossRef]
- Kortas, G. (Ed.) Rock Mass Movement in the Surrounding of Monument Salt Mines; The Mineral and Energy Economy Research Institute of the Polish Academy of Science: Krakow, Poland, 2004; p. 175. (In Polish) [Google Scholar]
- Bieniasz, J.; Wojnar, W. History and selected results of convergence studies in underground excavations within stratiform salt deposits. Gospod. Surowcami Miner. 2007, 23, 133–142. (In Polish) [Google Scholar]
- Jeremic, M.L. Rock Mechanics in Salt Mining; Balkema, A.A., Ed.; CRC Press: Boca Raton, FL, USA, 1994. [Google Scholar]
- Rozmus, M.; Tokarczyk, J.; Michalak, D.; Dudek, M.; Szewerda, K.; Rotkegel, M.; Lamot, A.; Rošer, J. Application of 3D Scanning, Computer Simulations and Virtual Reality in the Redesigning Process of Selected Areas of Underground Transportation Routes in Coal Mining Industry. Energies 2021, 14, 2589. [Google Scholar] [CrossRef]
- Singh, S.K.; Banerjee, B.P.; Raval, S. A review of laser scanning for geological and geotechnical applications in underground mining. Int. J. Min. Sci. Technol. 2023, 33, 133–154. [Google Scholar]
- Lachat, E.; Landes, T.; Grussenmeyer, P. First Experiences With The Trimble Sx10 Scanning Total Station For Building Facade Survey. Int. Arch. Photogramm. Remote Sens. Spatial Inf. Sci. XLII-2/W3, 405–412. [CrossRef]
- Li, L.; Jiang, X.; Tan, J.; Liu, R.; Quan, X.; Fan, J.; Qian, C.; Suo, J. Numerical Simulation Analysis of the Influence of Interlayer Quantity on the Long-Term Stable Operation of Gas Storage Facilities. Appl. Sci. 2024, 14, 9760. [Google Scholar] [CrossRef]
- Skrzypkowski, K. 3D Numerical Modelling of the Application of Cemented Paste Backfill on Displacements around Strip Excavations. Energies 2021, 14, 7750. [Google Scholar] [CrossRef]
- Wang, J.; Apel, D.B.; Xu, H.; Wei, C.; Skrzypkowski, K. Evaluation of the Effects of Yielding Rockbolts on Controlling Self-Initiated Strainbursts: A Numerical Study. Energies 2022, 15, 2574. [Google Scholar] [CrossRef]
- Zhang, Q.Y.; Duan, K.; Jiao, Y.Y.; Xiang, W. Physical model test and numerical simulation for the stability analysis of deep gas storage cavern group located in bedded rock salt formation. Int. J. Rock Mech. Min. Sci. 2017, 94, 43–54. [Google Scholar] [CrossRef]
- Wang, X.; Zhang, G.; Xu, M.; Zhu, S.; Bai, W.; Liu, Y.; Yang, K.; Liu, K.; Shi, X.; Li, Y. Influence of the thickness and stratigraphic position of the cavern-bearing salt formation on stability and tightness of horizontal hydrogen storage caverns in bedded salt formations: A case study in Jiangsu Province, China. Int. J. Hydrogen Energy 2025, 164, 150884. [Google Scholar] [CrossRef]
- Weber, F.; Konietzky, H. Concept to proof long-term safety of abandoned salt mines by hydro-mechanical coupled simulations with FLAC3D and Ansys Fluent. Deep Resour. Eng. 2025, 100201. [Google Scholar]
- Reza Taheri, S.; Pak, A.; Shad, S.; Mehrgini, B.; Razifar, M. Investigation of rock salt layer creep and its effects on casing collapse. Int. J. Min. Sci. Technol. 2020, 30, 357–365. [Google Scholar] [CrossRef]
- Bui, T.A.; Cammarata, G.; Kancharla, V.C.; Brasile, S. Modeling the behavior of underground structures in a rock salt formation: A coupled Finite Element approach. In The Mechanical Behavior of Salt X, Proceedings of the 10th Conference on the Mechanical Behavior of Salt (Saltmech x), Utrecht, The Netherlands, 6–8 July 2022; Bresser, D., Drury, M.R., Fokker, P.A., Gazzani, M., Hangx, S.J.T., Niemeijer, A.R., Spiers, C.J., Eds.; CRC Press: Boca Raton, FL, USA, 2022; pp. 395–406. [Google Scholar]
- Zhang, H.; Zhang, Q.; Wang, L. Displacement Solution of Salt Cavern with Shear Dilatation Behavior Based on Hoek-Brown Strength Criterion. Adv. Civ. Eng. 2019, 2019, 6735623. [Google Scholar] [CrossRef]
- Yu, H.; Liu, Y.; Ma, H.; Zhao, K.; Liu, J. Pillar safety in shallow salt caverns by using numerical simulations. J. Energy Storage 2022, 55, 105881. [Google Scholar] [CrossRef]
- Escanellas, A.; Cámara, E.; Liaudat, J.; Carol, I. Experimental study of the time-dependent behaviour of fracture propagation in salt rock. Geomech. Energy Environ. 2025, 43, 100687. [Google Scholar] [CrossRef]
- Chmura, J.; Lasoń, A. The “Ważyn” Chamber Security Project. Min. Geoengin. 2005, 29, 101–117. (In Polish) [Google Scholar]
- Dunn, M.; Reid, P.; Malos, J. Development of a Protective Enclosure for Remote Sensing Applications—Case Study: Laser Scanning in Underground Coal Mines. Resources 2020, 9, 56. [Google Scholar] [CrossRef]
- Yang, Y.; Hou, K.; Sun, H.; Guo, L.; Zhe, Y. Prediction Model and Knowledge Discovery for Roof Stress in Mined-Out Areas Integrating 3D Scanning Image Features. Appl. Sci. 2024, 14, 11180. [Google Scholar] [CrossRef]
- Gašinec, J.; Gašincová, S.; Černota, P.; Staňková, H. Uses of terrestrial laser sanning in monitoring of ground ice within Dobsinska Ice Cave. J. Pol. Miner. Eng. Soc. 2012, 13, 31–42. [Google Scholar]
- Dušeková, L.; Herich, P.; Pukanská, K.; Bartoš, K.; Kseňak, Ľ.; Šveda, J.; Fehér, J. Comparison of Non-Contact Measurement Technologies Applied on the Underground Glacier—The Choice for Long-Term Monitoring of Ice Changes in Dobšiná Ice Cave. Remote Sens. 2024, 16, 3870. [Google Scholar] [CrossRef]
- Pukanská, K.; Bartoš, K.; Gašinec, J.; Pašteka, R.; Zahorec, P.; Papčo, J.; Bella, P.; Andrássy, E.; Dušeková, L.; Bobíková, D.; et al. Methodological approaches to survey complex ice cave environments—The case of Dobšiná (Slovakia). Front. Environ. Sci. 2024, 12, 1484169. [Google Scholar] [CrossRef]
- Štroner, M.; Urban, R.; Křemen, T.; Braun, J.; Michal, O.; Jiřikovský, T. Scanning the underground: Comparison of the accuracies of SLAM and static laser scanners in a mine tunnel. Measurement 2025, 242, 115875. [Google Scholar] [CrossRef]
- Liberotti, R.; Paolocci, M. Perugia, City Walls and Green Areas: Possible Interactions Between Heritage and Public Space Restoration. Sustainability 2025, 17, 6663. [Google Scholar] [CrossRef]
Disclaimer/Publisher’s Note: The statements, opinions and data contained in all publications are solely those of the individual author(s) and contributor(s) and not of MDPI and/or the editor(s). MDPI and/or the editor(s) disclaim responsibility for any injury to people or property resulting from any ideas, methods, instructions or products referred to in the content. |
© 2025 by the authors. Licensee MDPI, Basel, Switzerland. This article is an open access article distributed under the terms and conditions of the Creative Commons Attribution (CC BY) license (https://creativecommons.org/licenses/by/4.0/).