Article

Effect of Corn Straw Returning Under Different Irrigation Modes on Soil Organic Carbon and Active Organic Carbon in Semi-Arid Areas

1
College of Resource and Environmental Science, Jilin Agricultural University, Changchun 130118, China
2
College of Humanities & Information, Changchun University of Technology, Changchun 130122, China
3
National Agricultural Experimental Station for Agricultural Environment, Luhe, Institute of Agricultural Resources and Environment, Jiangsu Academy of Agricultural Sciences, Nanjing 210014, China
*
Author to whom correspondence should be addressed.
Appl. Sci. 2025, 15(20), 11006; https://doi.org/10.3390/app152011006
Submission received: 1 August 2025 / Revised: 2 October 2025 / Accepted: 10 October 2025 / Published: 14 October 2025
(This article belongs to the Section Agricultural Science and Technology)

Abstract

In the global agricultural production system, maintaining and improving soil quality are core elements for ensuring food security and sustainable agricultural development. As a key indicator of soil quality, the content and dynamic change in soil organic carbon have a profound impact on the physical, chemical and biological properties of soil, and play a decisive role in soil fertility, structural stability, water and fertilizer conservation capacity and microbial activity. However, its decomposition is slow, and a large number of straws returning to the field will impact crop growth; its combination with irrigation is a more reasonable solution, as it can significantly improve the soil environment, increase soil moisture and promote straw decomposition. Therefore, in order to further study the effects of different irrigation methods and straw-returning combinations on soil active-carbon content, an experiment was carried out in long-term arid and semi-arid areas under in-field corn cultivation during 2019–2020. Three irrigation modes were designed—flood irrigation (BI), shallow drip irrigation (SD) and drip irrigation under film (DP)—and straw returning (CS) and no straw returning (CK) were set up, with irrigation applied at critical corn growth stages (internode elongation, heading, bell mouth stage) to support plant growth. The results are as follows: (1) The content of soil organic carbon in different treatments had a gradual upward trend with the advance of growth period; the content of soil organic carbon in DP treatment was significantly higher than that in SD and BI treatment under the same straw returning mode, indicating that drip irrigation under film and straw-returning mode can synergistically improve soil fertility and organic carbon content. (2) Different irrigation methods and straw-returning methods have significant effects on the content of soil active organic carbon components. Different drip irrigation modes can significantly improve the content of soil POC and MBC compared with flood irrigation. The Kos of SD treatment is significantly higher than that of other irrigation treatments, and the CPMI is lower than that of the other two irrigation methods, indicating that the soil organic carbon of SD treatment is more stable. Therefore, under straw-returning conditions, drip irrigation can significantly improve the carbon content of soil components and the management index of soil carbon pool, thus significantly increasing the accumulation of soil organic matter. This study discussed the effects of straw returning on soil organic carbon composition and soil carbon pool index under different irrigation methods to provide theoretical and practical bases for the selection and promotion of straw-returning methods and rational irrigation methods in semi-arid areas.

1. Introduction

Corn, a crucial food crop in China, boasts an extensive planting area. However, the Inner Mongolia Autonomous Region faces acute water scarcity, and traditional flood irrigation has triggered large-scale secondary salinization in the region. Concurrently, excessive high-intensity cultivation and inadequate carbon source supplementation have led to a long-term deficit of soil carbon. Addressing how to fully utilize limited water resources, rationalize resource use in large arid areas, implement measures to mitigate carbon release and enhance carbon sequestration, reduce CO2 emissions, boost local agricultural output value and alleviate the greenhouse effect has become a critical challenge for local agricultural production. Additionally, high-intensity continuous cultivation and irrational farming practices have caused a sharp decline in soil organic matter, further exacerbating soil nutrient depletion. Straw incorporation, a globally recognized yield-enhancing practice that recycles straw by returning it to farmland, can increase crop yields and significantly elevate soil active carbon content, thereby improving soil fertility. The dynamic balance of soil organic carbon (SOC) influences soil fertility, which in turn affects crop nutrient uptake and ultimately determines the stability of crop yields. Therefore, increasing soil active organic carbon content is of great significance for enhancing the soil carbon pool and optimizing nutrient status [1,2].
Previous studies have confirmed that soil active organic carbon fractions—such as dissolved organic carbon (DOC), easily oxidizable organic carbon (EOC), particulate organic carbon (POC) and microbial biomass carbon (MBC)—are highly sensitive to agricultural management practices and dominate short-term soil carbon cycling [3,4]. Existing research has clearly established the independent effects of straw incorporation and irrigation on these active carbon fractions. For straw incorporation, as a key measure to supplement soil carbon sources, it directly promotes the accumulation of active carbon fractions. Leaching and decomposition of soluble components in straw can increase DOC content by 15–40% [5,6]. It provides sufficient substrates for soil microorganisms, leading to a 20–50% increase in MBC content compared to non-straw incorporation treatments [7,8]. Semi-decomposed straw residues (especially stem and leaf fragments) serve as important precursors for POC, increasing its content by 8–25% [9,10]. Furthermore, nutrients released during straw decomposition regulate the soil C/N ratio, which further promotes the formation of EOC—a critical active carbon reservoir [11,12]. For irrigation, as a core factor regulating soil moisture in semi-arid regions, it indirectly affects the content and turnover of active carbon: flood irrigation (BI) typically results in excessive soil moisture, causing DOC loss via gravitational water, and the associated anaerobic environment also inhibits microbial activity, reducing MBC content by 15–30% [13,14]; in contrast, drip irrigation maintains soil moisture within the optimal range (18–22% volumetric moisture content), which promotes microbial decomposition of organic matter, increasing EOC availability by 20–35% [15,16] and reduces POC loss from soil erosion, raising its content by 10–18% [17]. However, the interaction between straw incorporation and irrigation on soil active carbon fractions in semi-arid agricultural systems has not been systematically investigated. Existing studies either focus solely on the impact of straw incorporation on soil carbon pools (while neglecting how irrigation-induced moisture changes affect the decomposition efficiency of straw-derived active carbon) or explore irrigation effects without accounting for straw-derived carbon input [18,19]. For instance, it remains unclear whether drip irrigation can mitigate DOC leaching caused by straw decomposition and promote MBC accumulation. Additionally, there is a lack of research on how the combination of straw incorporation and different drip irrigation modes regulates POC formation and EOC stability. Addressing these gaps is critical for optimizing straw and irrigation management to enhance soil carbon sequestration in water-scarce regions.
In agricultural ecosystems, the Soil Carbon Pool Management Index (CPMI) serves as a sensitive and comprehensive indicator for assessing changes in soil organic carbon, as it can quickly and thoroughly reflect the impact of tillage practices on soil organic carbon and fertility characteristics [20,21]. Derived from the Carbon Pool Activity Index (AI) and Soil Carbon Pool Index (CPI), CPMI is used to evaluate the capacity of soil management systems to improve soil quality. By analyzing differences in CPMI across treatments, one can assess the impact of different soil management practices on soil carbon pools [22]. Studying soil CPMI enables a comprehensive analysis of its effects on soil CPI and AI, thereby reflecting dynamic changes in the quantity and quality of soil carbon pools. Soil organic carbon stability can be characterized by soil carbon pool activity (A) [23]; analyzing the oxidation stability coefficient (Kos) allows observation of the decomposition and release degree of soil SOC, which is used to evaluate soil fertility. Soil carbon efficiency (SCE%)—defined as the ratio of soil easily oxidizable organic carbon to total SOC—reflects the rate at which soil organic carbon is decomposed and utilized by microorganisms, and this parameter can be used to analyze the turnover rates of soil organic carbon and nutrients [24]. Therefore, we hypothesize that the combination of straw incorporation and drip irrigation can increase the content of soil active carbon fractions and improve the soil carbon pool management index, thereby promoting the enhancement of soil organic matter. To test this hypothesis, we investigated the effects of different straw treatments and irrigation methods on soil active carbon fractions and CPMI content in 2019 and 2020; this study also explores the short-term dynamic changes in soil carbon pools under different soil management systems, which holds great significance for the development of the corn industry and irrigation sector.

2. Materials and Methods

2.1. Overview of the Experimental Area

The experimental site is located in Tumuji Town, Zhalaite Banner, Xing’an League, Inner Mongolia Autonomous Region (123°00′ E, 46°17′ N), a semi-arid region of northern China characterized by a temperate continental monsoon climate, where the annual average atmospheric temperature is 5.58 °C, the annual average soil temperature is 6.94 °C, the annual average rainfall is about 385 mm and the average annual sunshine duration is 2592 h. Total solar radiation is 163.5 w/m2. The effective accumulated temperature at 10 °C is 2700–3300 °Cd, and carbon dioxide is 439.99 PPM. The frost-free period is 120–140 days. Daily mean temperature and precipitation during the research period were obtained from the meteorological station of the China Meteorological Administration (Figure 1).
The main soil type is chestnut soil. The basic physical and chemical properties of the soil are as follows: organic matter, 17.2 g/kg; alkaline nitrogen, 85.83 mg/kg; available phosphorus, 16.27 mg/kg; available potassium, 64.52 mg/kg; pH, 8.0; conductivity, 0.18 us/cm. The proportions of sand, silt and clay particles in the soil are 49.6%, 26.3% and 24.1%, respectively, with a total salt content of 0.24%. The proportions of sand particles, silt particles and clay particles are 32.5%, 25.2% and 42.3%, respectively.

2.2. Experimental Design and Agronomic Management

In this experiment, three treatments were set up in terms of irrigation methods: flood irrigation (BI), shallow drip irrigation (SD) and film mulched drip irrigation (DP). Two treatments were set up on the straw treatment: straw not returning to the field (CK) and straw returning to the field (CS).
For the film-covered drip irrigation treatment, an agricultural film with a thickness of 0.008 mm and a width of 800 mm was used, at an application rate of approximately 45 kg per hectare. Drip irrigation materials mainly included drip tapes, Φ63 PE hoses and fittings; the usage of drip tapes was about 8000 m per hectare, while that of Φ63 PE hoses was roughly 75 m per hectare. Each plot was equipped with an independent gravity drip irrigation unit, with one drip tape placed in the middle of each narrow row and an emitter spacing of 25 cm. A fertilizer tank (Shanghai, China, Chuanhu Valve Co., Ltd. ZZYP-16C DN50) was installed upstream of the pressure-regulating valve for fertilizer application, and the water flow rate was 30 t/h. For the shallow-buried drip irrigation treatment, plastic film shallow-buried drip pipes were used, but no agricultural film was applied. All other procedures were identical to those of the film-covered drip irrigation treatment. For the flood irrigation treatment, no drip pipes were laid and no agricultural film was used. Fertilization and irrigation were conducted following local farmers’ conventional practices, i.e., flood irrigation with water pipes. The total irrigation amount was consistent across the three treatments (240 mm per hectare), and the irrigation amount applied during the same growth stage was also the same for each treatment. Specifically, 80 mm of irrigation was applied at each corn jointing stage, heading stage and big bell mouth stage. Fertigation (combined water and fertilizer application) was implemented at the corn jointing stage, big bell mouth stage and early tasseling stage. The fertigation process was as follows: first, clear water was dripped for 0.5 h, followed by fertilizer application (which took approximately 2 h). Finally, clear water was dripped again for 0.5 h. The irrigation water used was groundwater, with the following quality characteristics: pH 7.8, total dissolved solids (TDS) 320 mg/L, electrical conductivity (EC) 510 μS cm−1. No heavy metals or harmful microorganisms were detected in the water.
Field experiments were conducted in 2019 and 2020. The corn variety selected was XianYu 027, with a planting density of 79,000 plants per hectare. Sowing was carried out in wide–narrow rows using a modified integrated machine (LuoYang, China, Yituo Group Co., Ltd., 2BMZ-6 (Wide Narrow Row Version)), which simultaneously applied base fertilizer, sowed seeds, covered soil, pressed the soil surface, laid plastic film and installed drip irrigation pipes. The wide–narrow row planting pattern was adopted, with 80 cm for wide rows and 40 cm for narrow rows, and the sowing depth was 4–5 cm. Each treatment was replicated three times, with each experimental plot covering an area of 5 m × 10 m (50 m2), and a randomized complete block design was used for all plots. After corn harvest in October, for the straw non-returning treatment, corn straw was collected and removed from the experimental area. For the straw returning treatment, straw was mechanically crushed to a particle size of <2 cm and returned to the field before the second spring sowing, with a returning rate of 13,600 kg/ha (dry weight). The straw used in 2019 was obtained from the 2018 corn crop harvested in the same experimental field. The straw used in 2020 was sourced from the 2019 corn crop harvested in the same plots; this straw had a carbon content of 42.3%, a nitrogen content of 1.8% and a carbon-to-nitrogen ratio (C/N) of 23.5. After crushing, the straw particles were 1–2 cm in size, free of mold and impurities. The straw returning method adopted was “uniform field application + rotary tillage incorporation”: after crushing, the straw was spread evenly on the soil surface (0–10 cm soil layer), then mixed with the soil via rotary tillage to a depth of 15 cm. Straw was returned to the field 10 days before spring sowing, and no irrigation was conducted during this interval.
Land preparation was carried out in two phases. The first phase was autumn land preparation, which mainly included deep loosening and harrowing, with each operation performed twice. The second phase was spring land leveling, where harrowing was the primary method—consistent with the approach used for autumn leveling. Except for differences in irrigation modes, all other field management measures were identical across all treatments. A 15-15-15 (N-P-K) compound fertilizer was applied as the base fertilizer at a rate of 450 kg/ha. In addition, 46% urea was top-dressed three times: during the maize jointing stage, big bell stage and early tasseling stage, with 30 kg ha−1 applied each time.

2.3. Soil Sample Collection and Preparation

Soil samples in this study were collected from the field experimental plots in May (seedling stage), July (tasseling stage) and September (wax ripening stage) of 2019 and 2020. Sampling was conducted to avoid rainfall, irrigation and fertilization events. For the BI treatment, samples were taken from the outside of the ridges; for drip irrigation treatments (SD and DP), soil samples were collected near the drip irrigation belts. Crop residues, roots and stones were removed from the samples before they were transported back to the laboratory.

2.4. Soil Analyses

The SOC content was determined using the potassium dichromate-sulfuric acid external heating method [25].
The MBC content was determined via the chloroform fumigation + K2SO4 extraction method (using fresh soil samples), with the calculation formula as follows:
MBC = Ec · KEc−1.
MBC—Mass fraction of soil microbial biomass carbon (mg·kg−1). mg·kg−1 is the difference in organic carbon between Ec-fumigated soil sample and non-fumigated soil sample. The proportion of carbon released from microorganisms killed by KEc chloroform fumigation, with a correction factor of 0.38 [26].
The DOC content was determined using 10 g of fresh soil with a soil-to-water ratio of 1:4. The soil sample was shaken at 250 r/min for 30 min. The supernatant was centrifuged at 15,000 r/min for 10 min and filtered through a 0.45 μm cellulose ester filter. Carbon in the extract was analyzed using a Shimadzu Automatic TOC Analyzer (Shanghai, China, Shimadzu Enterprise Management (China) Co., Ltd., TOC-L CSH) [27].
The soil easily oxidizable organic carbon (EOC) was determined via the KMnO4 colorimetric method. A dried soil sample containing 15 mg of carbon was placed into a clean 100 mL plastic bottle, followed by the addition of 25 mL of 333 mmol·L−1 KMnO4 solution. The bottle was tightly sealed, shaken for 1 h (25 r/min) and then centrifuged at low speed (4000 r/min) for 5 min. The supernatant was diluted with deionized water at a ratio of 1:250, and colorimetry was performed using a spectrophotometer at 565 nm [28].
The POC was determined by particle size fractionation. In total, 10 g of dried soil was placed into a 250 mL flask, and 30 mL of 5 g·L−1 sodium hexametaphosphate solution was added; the mixture was shaken horizontally for approximately 18 h. The dispersed sample was then sieved through a 0.053 mm sieve, and the residual material (>0.053 mm) on the sieve was dried in a constant-temperature oven at 60 °C. The organic carbon in the residual material represented the POC content [29].

2.5. Indicator Calculations

This research calculated Carbon Pool Management Index (CPMI), Carbon Pool Index (CPI), Carbon Pool Activity Index (LI) and Carbon Pool Activity (L).
The calculation method for the Carbon Pool Management Index (CPMI) [30] is as follows:
CPMI = CPI × LI × 100.
In the formula, CPI (Carbon pool index, CPI) is the carbon pool index; LI (Productivity Index, LI) is the carbon pool activity index.
The calculation method for the Carbon Pool Index (CPI) is as follows:
CPI = SOCs × SOCr−1.
In the formula, SOCs represent the soil organic carbon content of a certain treatment; SOCr represents the soil organic carbon content of the reference soil, and the reference soil for this experiment is CK.
The calculation method for the Carbon Pool Activity Index (AI) is as follows:
AI = Ls × Lr−1.
In the formula, Ls is the carbon pool activity of a treatment and Lr represents the carbon pool activity of the reference soil (corn planting plots without straw return and irrigation) (CK).
The calculation method for the Carbon Pool Activity (A) is as follows:
A = EOC × NLC−1.
In the formula, EOC represents the content of easily oxidizable organic carbon, non-label carbon (NLC) is the content of non-active organic carbon and NLC is the difference between SOC and EOC.

2.6. Data Processing

Analysis of variance (ANOVA) and multiple comparison tests (Duncan’s new multiple range test, p < 0.05) were used to assess significant differences among different treatments. All statistical analyses were performed using IBM SPSS Statistics 25.0 software. Variation partitioning analysis (VPA) was conducted using the varpart function in the vegan package of R software (4.3.2), and the results were visualized using the plot function.

3. Results

3.1. Soil Organic Carbon Content

As shown in Figure 2, during the two years, different irrigation methods and straw treatment methods had a significant impact on the content of soil organic carbon in each period, while there was a significant interaction between irrigation methods and straw treatment methods in July and September. The content of soil organic carbon in each treatment increased gradually with the advance of growth period. Under the same irrigation mode, compared with CK treatment, CS treatment significantly increased soil SOC content in July and September, with an average increase of 5.8–6.6% and 5.0–5.7%, respectively, while there was no difference in May. At each stage, SD and DP treatments were significantly higher than BI treatments, with an average increase of 2.8–4.6%, 4.0–6.4% and 3.4–4.0%, respectively; there was only a difference between SD and DP processing in July and September 2019.

3.2. Soil Microbial Biomass Carbon

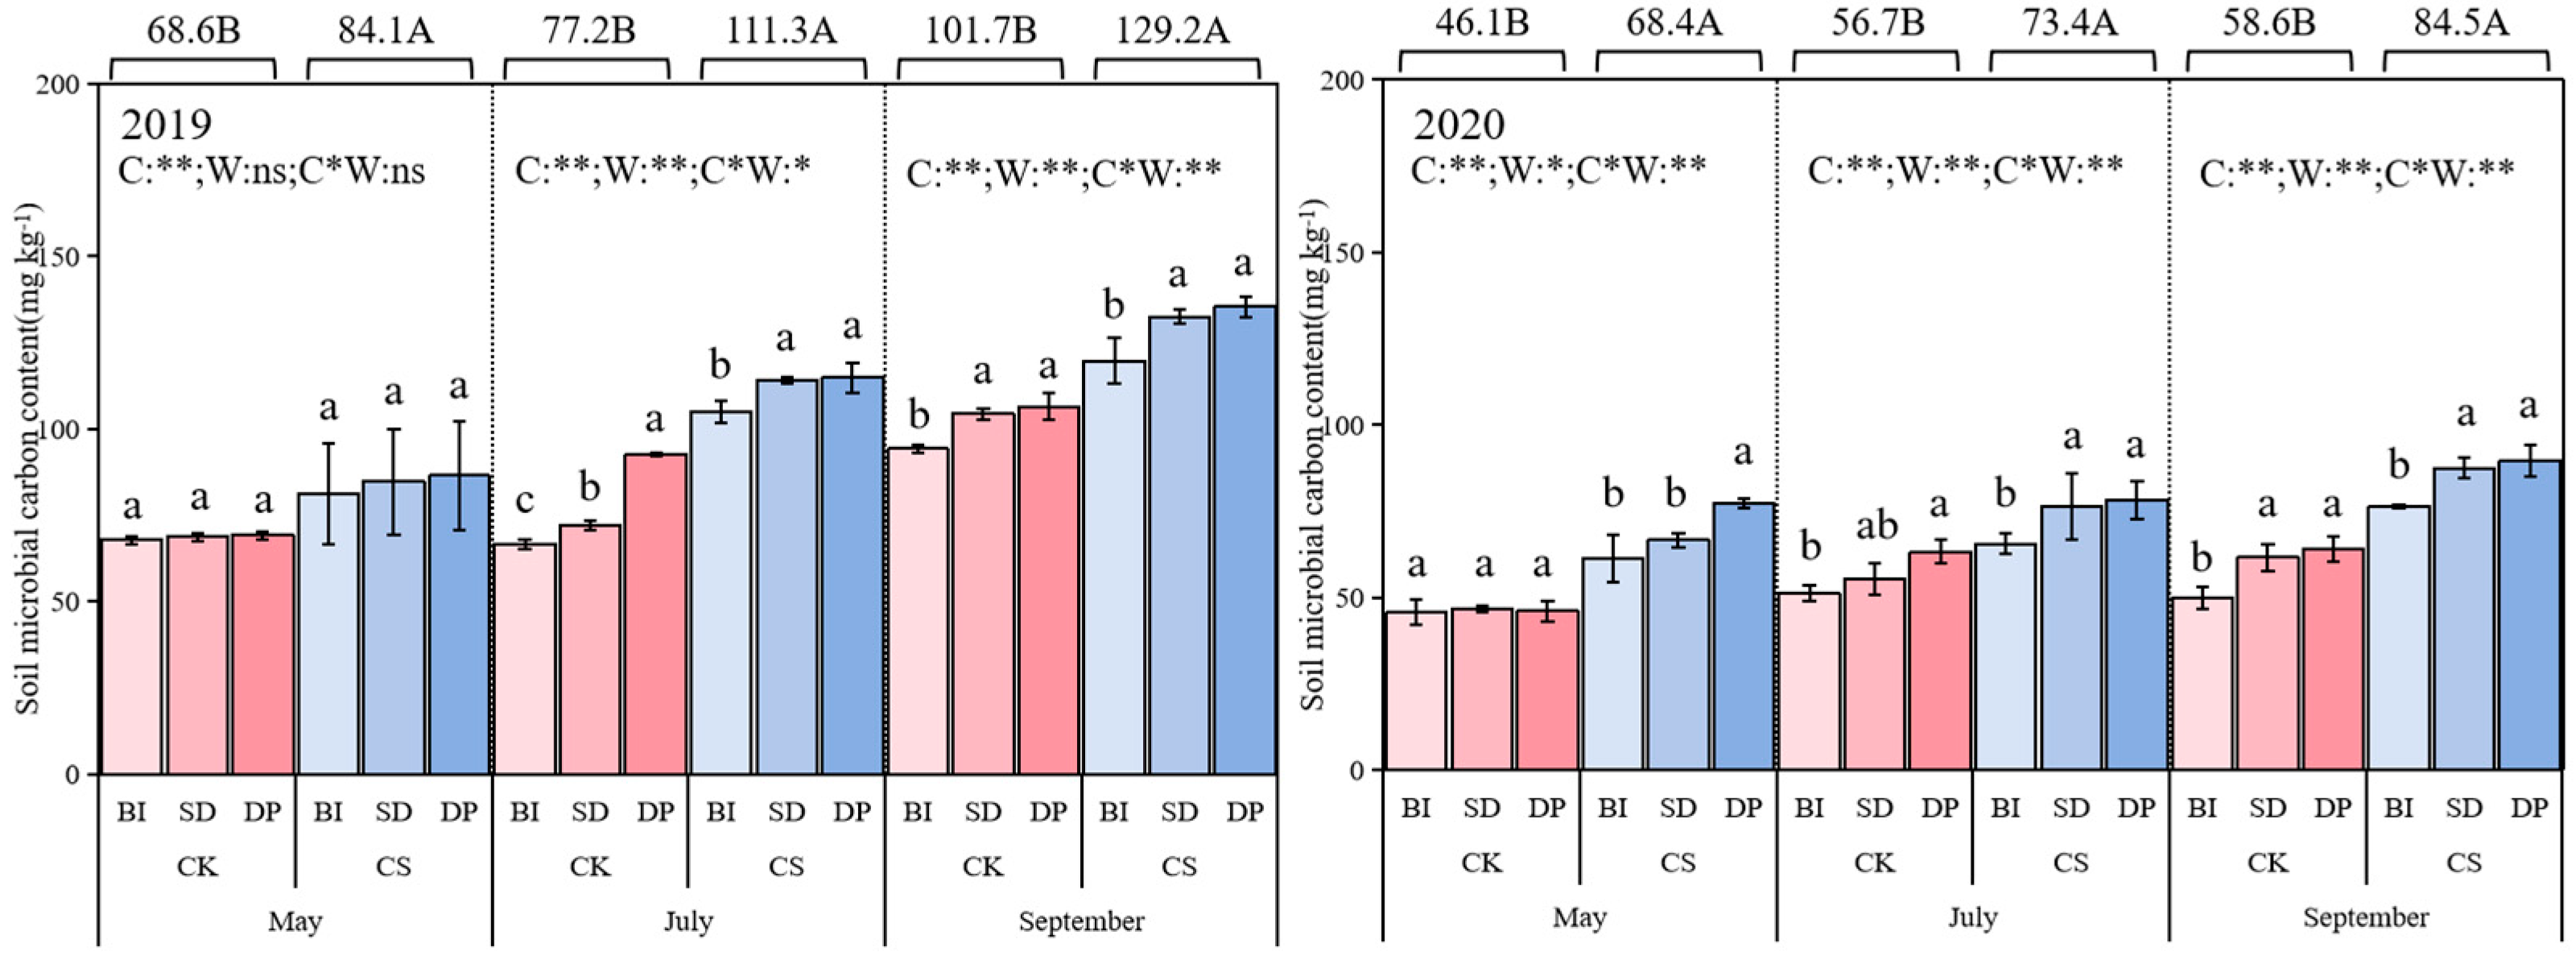
As shown in Figure 3, in the two-year experiment, different irrigation methods and straw treatment methods had no significant impact on soil MBC content in May but had significant impact on soil MBC content in July and September, with significant interaction. The content of MBC in each treatment increased gradually with the advance of growth period. Under the same irrigation mode, the content of MBC in different periods of CS treatment was significantly higher than that of CK treatment, with an average increase of 22.4–48.4%, 29.5–44.2% and 27.0–44.5%, respectively. In different months, the content of MBC in SD and DP treatments was significantly higher than that in BI treatment, with an average increase of 3.8–10.8%, 14.7–17.2% and 11.9–19.8%, respectively, but there was no significant difference between SD and DP treatments.

3.3. Soil Soluble Organic Carbon

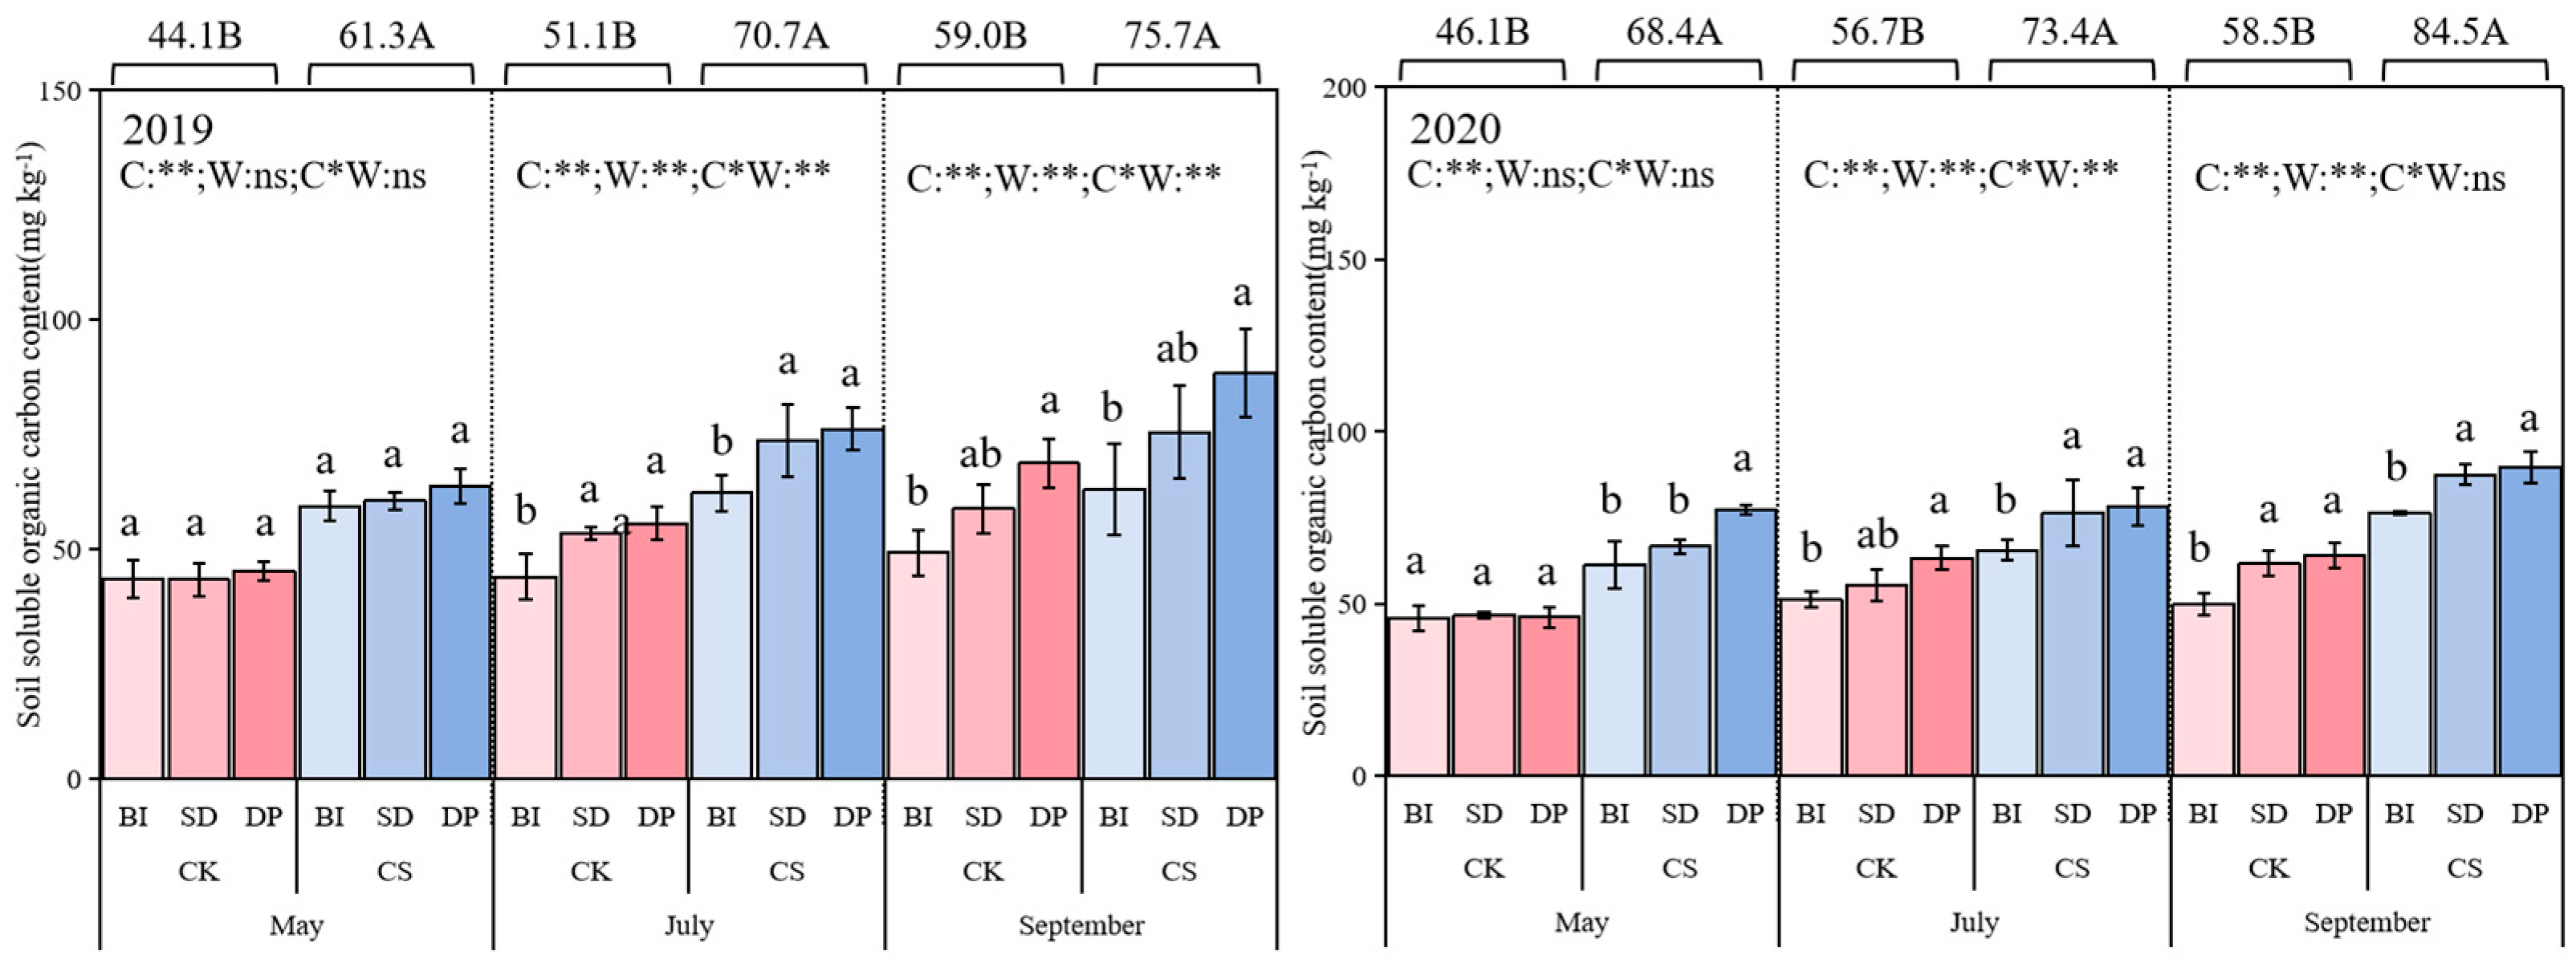
As shown in Figure 4, in the two-year experiment, different irrigation methods and straw treatment methods had significant effects on the soil DOC content in July and September, and there were significant interactions. The DOC content of soil in each treatment increased gradually with the advance of growth period. Under the same irrigation mode, compared with CK, CS treatment increased soil DOC content in different periods by 39.0–48.4%, 29.3–38.4% and 28.4–47.2%, respectively. At each stage, SD and DP treatments were significantly higher than that of BI treatment, with an average increase of 3.4–11.1%, 17.2–22.0% and 19.8–29.8%, respectively, while there was no significant difference between SD and DP treatments.

3.4. Soil Easily Oxidizable Organic Carbon

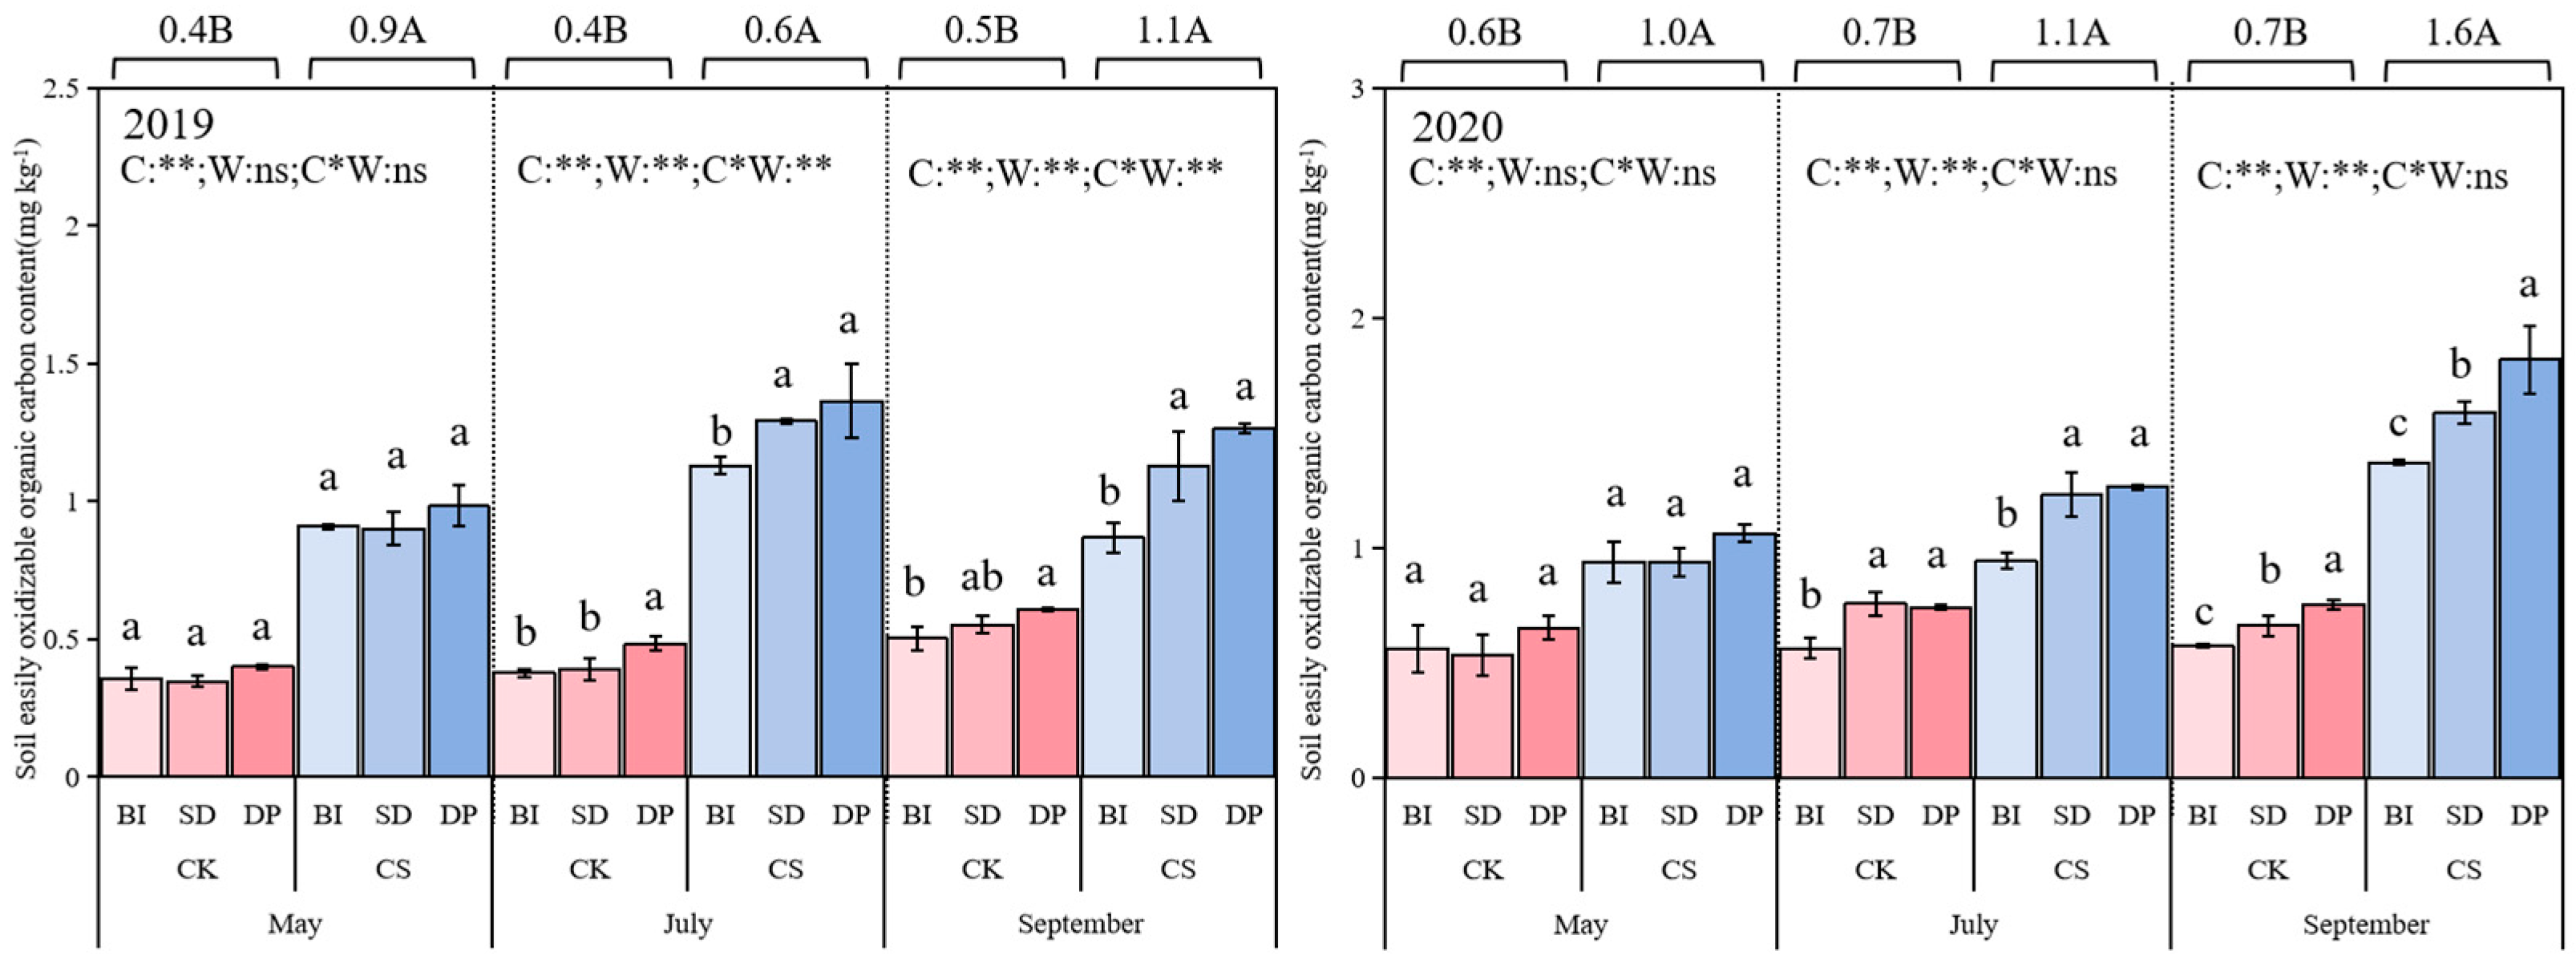
As shown in Figure 5, during the two years, different irrigation methods and straw treatment methods have significant effects on the soil EOC content in July and September, and there are also significant interactions. Under the same irrigation mode, CS treatment significantly increased soil EOC content in different periods, which was 72.8–108.9%, 104.7–173.7% and 108.4–139.3% higher than CK treatment, respectively. Under the same straw treatment level, DP treatment was significantly higher than Bi and SD treatment, with an average increase of 10.7–16.8%, 1.0–9.8% and 11.5–14.3%, respectively.

3.5. Soil Particulate Organic Carbon

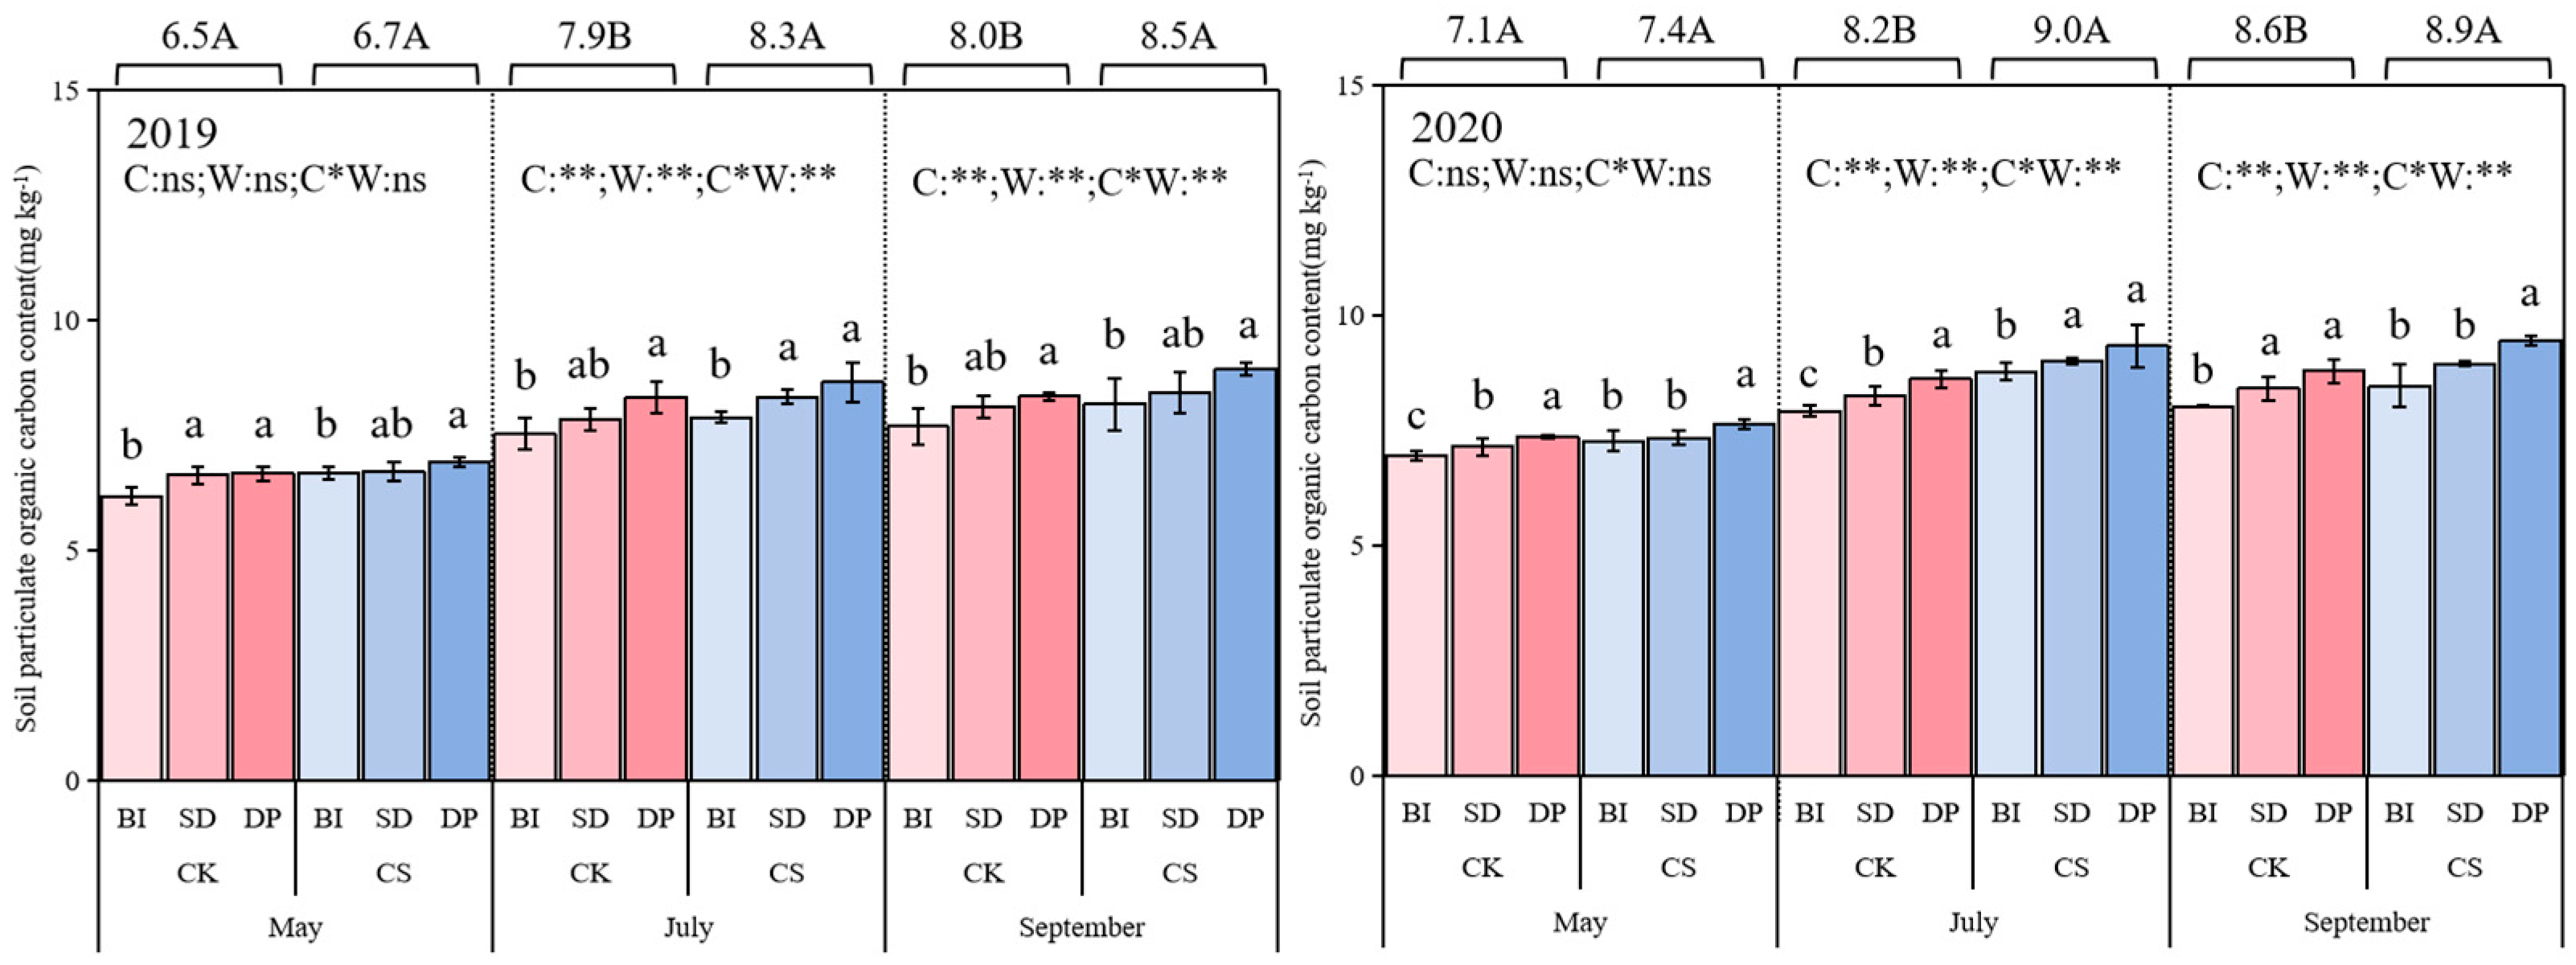
As shown in Figure 6, during the two-year period, different irrigation methods and straw treatment methods had no significant impact on the soil POC content in May but had a significant impact on the soil POC content in July and September, and there was a significant interaction. Compared with CK treatment, CS treatment significantly increased the content of soil POC in different periods, with an average increase of 6.3–5.6%, 3.9–6.4% and 7.1–7.6%, respectively. Under the same straw treatment, the content of soil POC in DP and SD treatments was significantly higher than that in BI treatment; only in July 2020 was there no difference in SD and DP processing.
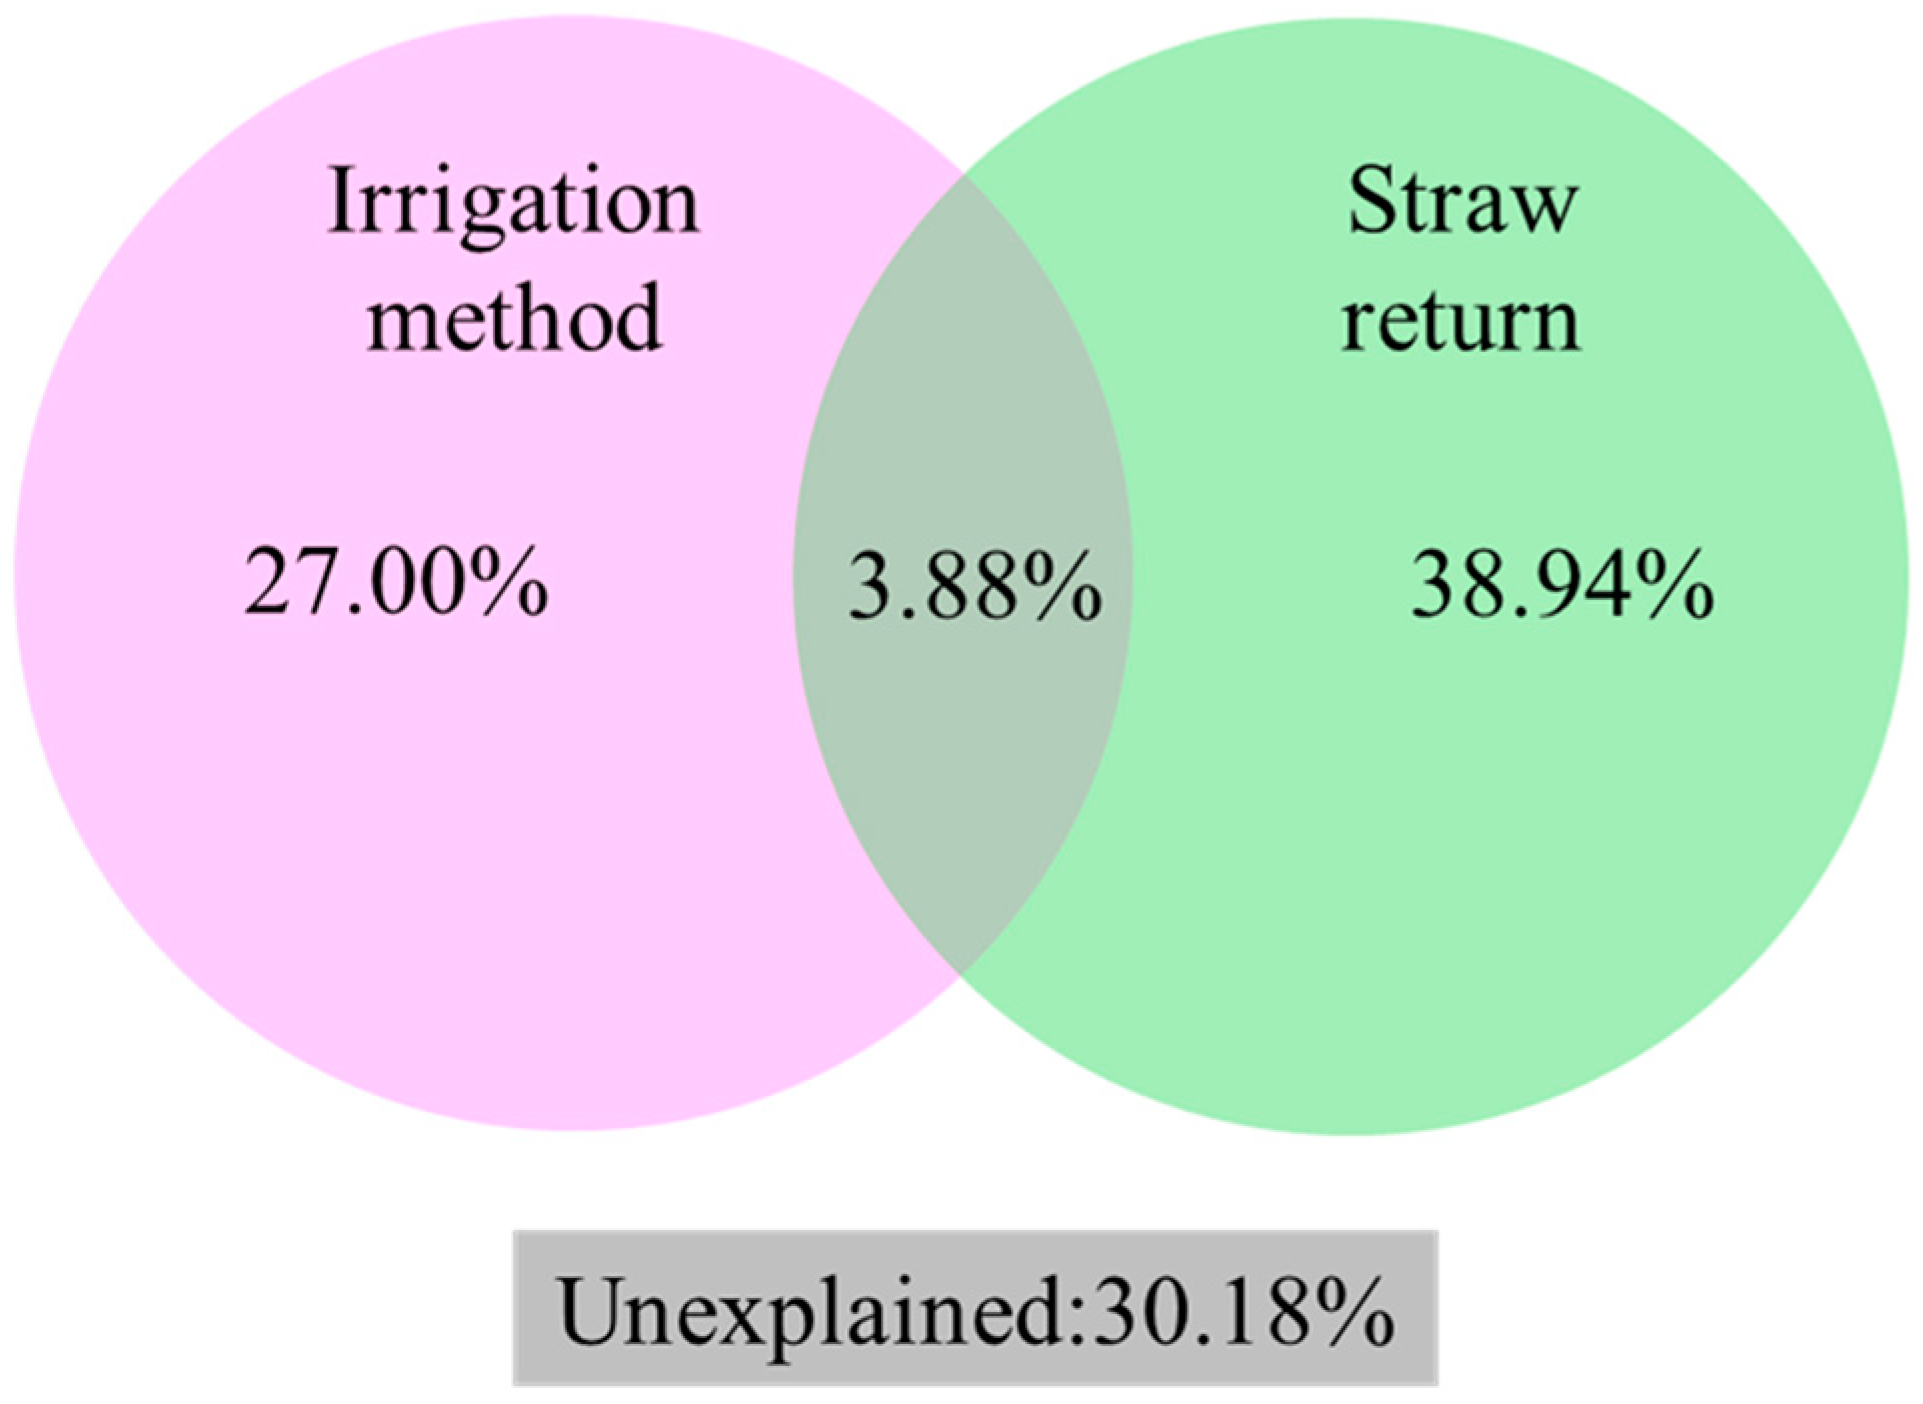
The variance decomposition analysis (VPA) results (Figure 7) of irrigation mode and straw returning on the activated carbon pool showed that in terms of their impact on the activated carbon pool, irrigation mode contributed 27.0%, straw returning contributed 38.9% and both contributed 3.9%, with an overall unexplained rate of 30.2%. Overall, compared to the irrigation mode, straw returning has a greater contribution to the changes in the composition of the activated carbon pool.

3.6. Soil Carbon Storage Management Index and Oxidation Stability Coefficient

As shown in Table 1, in the two-year experiment, different irrigation methods and straw treatment methods had significant effects on CPMI, CPI, AI, A, stable organic carbon and Kos coefficient, but there was only significant interaction between irrigation methods and straw treatment methods in CPMI. Under the same irrigation mode, the CPMI, CPI, AI, A, stable organic carbon and Kos coefficients of CS treatment were significantly higher than those of CK treatment, with an average increase of 201.54–284.99%, 293.10–310.32% and 196.32–275.25%. The CPMI of DP treatment was significantly higher than that of BI treatment, but there was no significant difference compared with SD. From the perspective of Kos, under the same irrigation mode, the Kos of CS treatment decreased by 63.56–74.22% on average compared with CK treatment. Under the same straw treatment, the Kos of SD treatment was significantly higher than that of BI and DP treatment, with an average increase of 34.1–55.5%.

3.7. Soil Active Organic Carbon

As shown in Table 2, different irrigation methods and straw treatment methods have a significant impact on the percentage of soil organic carbon active components in total soil organic carbon, and there is a significant interaction between DOC/SOC and SCE. Under the same irrigation mode, the DOC/SOC, SCE, POC/SOC and qMBC of CS treatment were significantly higher than those of CK treatment, with an average increase of 2.7–5.5%, 11.5–20.9%, 8.9–9.5% and 4.5–9.0%. Under the same straw treatment, DOC/SOC, SCE, POC/SOC and qMBC of DP treatment were significantly higher than those of BI and SD treatment, with an average increase of 1.5–1.9%, 6.7–11.5%, 5.6–10.1% and 4.5–5.5%.

4. Discussion

4.1. Effects of Straw Returning to the Field Under Different Irrigation Modes on Soil Organic Carbon

In arid and semi-arid regions, soil moisture is the primary driver of soil carbon cycling; thus, different irrigation modes play a crucial role in regulating this process. Water-saving irrigation not only reduces the volume of water used for farmland irrigation but also improves water and fertilizer use efficiency and maintains or increases crop yields compared to flood irrigation [31]. Additionally, water-saving irrigation alters soil moisture conditions, enhances soil aeration and modifies redox potential [32]. Consequently, compared to flood irrigation, water-saving irrigation creates distinct soil microenvironments and mitigates greenhouse gas emissions from farmlands [33]. Three irrigation modes were tested in this study: subsurface drip irrigation (DP), shallow-buried drip irrigation (SD) and flood irrigation (BI). The first two treatments exhibited significantly greater effects on increasing soil organic carbon (SOC) than BI. In previous studies conducted in the semi-arid Loess Plateau region, drip irrigation increased SOC content by 8.3–12.1% relative to flood irrigation; moreover, the combination of subsurface drip irrigation and straw returning enhanced SOC by 5.2–7.8% within two years. This aligns with the SOC increase observed in the DP + CS (crop straw returning) treatment of this study, further confirming the universal role of drip irrigation in promoting SOC accumulation in semi-arid maize systems [34,35].
In semi-arid regions, irrigation methods directly influence carbon turnover by modifying the form and availability of soil moisture. Flood irrigation (BI) primarily relies on “free gravitational water,” which easily induces leaching of dissolved organic carbon (DOC) (Figure 4) and creates a short-term anaerobic environment that inhibits microbial activity. In contrast, drip irrigation (SD/DP) maintains a moist state dominated by capillary water, with a pore water filling degree of 30–60%. This meets the “effective water demand” of microorganisms, thereby improving straw decomposition and carbon sequestration efficiency (Figure 2 and Figure 3). Wang et al. (2009) demonstrated that when drip irrigation maintains soil moisture at 18–22%, the microbial decomposition rate of straw is 1.5 times higher than that under flood irrigation [36]. Meanwhile, drip irrigation prevents carbon loss caused by water erosion and, when combined with warming effects, further promotes organic carbon accumulation. Drip irrigation also effectively reduces soil particle erosion induced by high flow velocity and impacts kinetic energy [35]. Additionally, mulching and shallow burial have been shown to positively affect soil thermal conditions, enhance soil microbial activity, increase root exudates and thereby improve soil aggregate stability. Bai et al. (2020) found that shallow drip irrigation increased soil aggregate stability by 18–25% compared to flood irrigation, which is consistent with the results of this study [37]. Furthermore, the combination of mulching and drip irrigation protects soil organic carbon from atmospheric influences and mineralization, while preventing the breakdown of large aggregates caused by raindrops, wind and irrigation. From the perspective of SOC storage, total organic carbon storage increased significantly with the prolonged implementation of DP and SD. However, unlike the findings of Bai et al. (2020)—who reported a continuous increase in SOC under drip irrigation—the two-year data of this study only showed a gradual upward trend in SOC during the growing season [37]. Whether this trend can be sustained over the long term (e.g., 5–10 years) requires verification through long-term monitoring.
Frequent fluctuations in soil moisture may accelerate the mineralization of soil organic carbon, reduce soil bulk density and ultimately decrease SOC content. Under nutrient-rich conditions, increasing soil moisture can alleviate soil drought, promote plant carbon input, microbial decomposition and straw residue turnover—trends that can be mitigated by corn straw returning. Applying corn stover to soil as a carbon source directly increases organic carbon content [38]. Wang et al. (2021) found that returning 10–15 t/ha of corn straw to the field increased SOC by 4.2–6.8%, which is consistent with the results of this study [39]. Straw application also improves soil structure and physicochemical properties (e.g., enhancing soil water storage capacity and nutrient use efficiency), creating a more favorable environment for root growth and the absorption of water and nutrients. In this study, the combination of straw returning and drip irrigation exhibited a synergistic effect on organic carbon enhancement: under the DP mode, the CS treatment increased organic carbon by 5.8–6.6% during certain growth stages compared to the CK (control) treatment—exceeding the sum of the effects of DP alone and CS alone. Han et al. noted that drip irrigation improves soil moisture conditions and facilitates the decomposition of straw into stable organic carbon fractions. Straw mulching and shallow burial in the field create optimal soil temperatures, accelerate straw decomposition, timely release nutrients required by crops and microorganisms to support both, increase microbial populations, enhance metabolic activity and promote microbial carbon accumulation [40]. From a practical production perspective, the SD + CS combination holds greater promotional value than DP + CS for farmers in the semi-arid region of Inner Mongolia (the study site). Although DP and SD exhibit similar effects on enhancing organic carbon, SD avoids the residual film pollution associated with DP. The annual average temperature in this region is relatively low, resulting in slow plastic film degradation. Long-term use of the DP mode may lead to the accumulation of residual film in the 0–15 cm soil layer, which could hinder future crop root growth. In contrast, SD only requires the installation of drip irrigation belts without the need for plastic film, making it more aligned with the needs of sustainable local agricultural development. However, this study has certain limitations. First, the experimental period was only two years; a short time scale makes it challenging to accurately assess the long-term SOC sequestration potential of different treatments. Second, greenhouse gas emissions during the growing season were not measured. While drip irrigation is generally considered to reduce greenhouse gas emissions compared to flood irrigation, straw returning may increase CO2 emissions due to enhanced microbial activity. The combined impact of these two practices on the carbon footprint of agricultural systems remains unclear.

4.2. Different Straw Addition Methods Affect the Decomposition of Straw and Its Components

Soil active organic carbon exerts a significant influence on soil organic carbon (SOC) storage, as well as the stability and function of ecosystems. Characterized by high mobility, rapid variability and susceptibility to oxidation and mineralization, it serves as an excellent indicator for soil fertility management. It also plays a crucial role in supporting vegetation growth and soil microbial activities [41,42]. Typically, soil active organic carbon includes microbial biomass carbon (MBC), dissolved organic carbon (DOC), easily oxidizable organic carbon (EOC) and particulate organic carbon (POC) [43].
The results of this study indicate that soil MBC content—under both straw returning and non-returning conditions—followed the order DP > SD > BI, though no significant difference in MBC content was observed between the DP and SD treatments. Soil moisture conditions regulate carbon decomposition by filtering microbial communities: flood irrigation (BI) creates an anaerobic environment that enriches low-efficiency decomposing bacteria, leading to insufficient accumulation of particulate organic carbon (POC) (Figure 6). In contrast, drip irrigation (SD/DP) fosters an aerobic environment that enriches aerobic decomposing bacteria, which efficiently decompose straw into MBC and DOC (Figure 3 and Figure 4). Additionally, the SD treatment is not constrained by plastic film, allowing microorganisms to more easily aggregate into biofilms; the polysaccharide matrix of these biofilms can slow carbon loss, resulting in the highest oxidation stability coefficient (Kos) for the SD treatment (Table 1) and greater organic carbon stability. However, the plastic film used in the DP treatment may block contact between biofilms and air, making its carbon stability slightly lower than that of SD. As an active component of soil, MBC is primarily influenced by soil microbial biomass. It is a key component of SOC and effectively promotes the formation of soil humus [44,45]. Moreover, MBC provides impetus for soil nutrient transformation and cycling and serves as an important source of soil available nutrients. Soil moisture content is one of the factors affecting soil MBC content [46,47]; appropriate moisture conditions stimulate the growth, reproduction and metabolism of soil microorganisms, thereby increasing MBC content [48]. Drip irrigation combined with straw returning can significantly elevate soil MBC content: straw returning optimizes the living environment of soil microorganisms, increases the input of external nutrients and carbon sources and stimulates microbial growth, reproduction and metabolic activities—all of which contribute to higher MBC content [49,50]. Both DP and SD irrigation methods improve soil moisture and thermal conditions, promote crop root growth and increase the input of root residues and exudates into the soil. Meanwhile, the provision of high-quality substrates further supports soil microbial activities, accelerates straw decomposition and increases soil microbial biomass [51].
In this study, under different straw returning regimes, DOC content in the DP and SD treatments was significantly higher than in the BI treatment, with no significant difference between DP and SD. As the most active component of SOC, DOC is the primary source of energy and materials for soil microorganisms. Although it accounts for only 0.05–0.5% of total organic carbon, it still plays a vital role in soil biochemical processes [52,53]. Through long-term field experiments, Pan et al. found that the combination of water and fertilizer (drip irrigation combined with fertilization) can increase SOC content and significantly elevate DOC content [54]. Similarly, He et al. demonstrated that compared with traditional fertilization, drip irrigation fertigation combined with rational fertilization not only improved SOC but also increased DOC content [55]. Soil DOC can serve as an important indicator for evaluating soil microbial decomposition efficiency and nutrient utilization [56,57]. Research has shown that temperature and soil moisture are key factors influencing DOC content [58]. After irrigation, soil moisture content increases significantly; as the growing season progresses, soil temperature rises gradually—these changes accelerate soil microbial turnover, increase the input of litter-derived organic matter and root exudates into the soil and ultimately lead to a significant increase in DOC content [59,60]. In this study, under the same irrigation mode, straw-returning treatments increased soil DOC content by an average of 23.4–25.6%, 20.1–24.4% and 15.5–25.1% (in July and September, respectively) compared to non-returning treatments. Studies have indicated that straw returning alters soil carbon input, which in turn affects soil aeration, moisture content and pH—ultimately modifying the formation and turnover of DOC [61]. When straw is applied to soil, a portion is directly used as a carbon source and decomposed by microorganisms into SOC; nutrients from the straw itself enter the soil, stimulate root development, increase root exudates and further elevate DOC content [62]. Additionally, both straw returning and mulched drip irrigation can reduce the runoff loss of soil DOC [63,64], which explains why DOC content under mulched irrigation is significantly higher than under flood irrigation. However, the research results suggest that when residual film and straw coexist, small amounts of residual film can impact soil structure. In areas with high residual film accumulation, the film may block the contact area between straw and soil, reducing straw decomposition rates and leading to lower DOC content in cultivated soil [65,66].
In this study, the combination of drip irrigation and straw returning significantly increased soil EOC content. As a potential key source of nutrients and energy for soil microorganisms, EOC is a readily decomposable fraction of SOC [67]. It actively participates in soil biochemical transformation processes, influencing changes in soil fertility, nutrient availability and crop growth [68]. Higher soil EOC content indicates greater stability of carbon decomposed and transformed by soil microorganisms [69]. Compared with traditional fertilization, the integrated technology of drip irrigation combined with rational fertilization has been shown to increase soil EOC content [70]. This is primarily because straw returning increases soil porosity, reduces bulk density and improves permeability; meanwhile, nutrients in the straw regulate the soil C/N ratio. A balanced C/N ratio promotes enzymatic reactions, thereby increasing EOC content [71,72]. While a high C/N ratio can affect soil nitrogen availability and thus crop growth, staged fertilization and drip irrigation can alleviate nitrogen competition caused by corn straw. Both DP and SD treatments significantly increased soil moisture content, stimulating microbial growth and metabolism. Soil microorganisms prioritize the use of easily mineralized EOC, which accelerates the reduction in EOC content. At the same time, the SD treatment maintains good soil aeration and high moisture content, creating a favorable microecological environment that enhances microbial activity. The DP treatment (mulched drip irrigation) provides excellent hydrothermal conditions, supporting high microbial abundance and activity as well as abundant microbial metabolites and root exudates [73,74].

4.3. Impact of Straw Return on Soil Carbon Pool Management Index Under Different Irrigation Modes

Different irrigation methods result in varying soil moisture contents, which in turn affect the soil ecological environment and ultimately influence soil carbon storage management indicators. Drip irrigation yields significantly higher soil carbon pool parameters than flood irrigation; compared with traditional furrow irrigation, it increases soil organic carbon (SOC) content by 9.27%, indicating that drip irrigation maintains a favorable internal soil ecological environment and is more conducive to enhancing soil fertility [75]. Beyond altering soil moisture content, irrigation methods indirectly impact SOC mineralization and root degradation: appropriately increasing soil moisture elevates soil easily oxidizable organic carbon (EOC), thereby reducing the stability of the soil carbon pool. In this study, the shallow-buried drip irrigation without straw returning (SDCK) treatment exhibited the lowest Carbon Pool Management Index (CPMI) and the highest oxidation stability coefficient (Kos), primarily due to its low soil EOC content.
Differences in the Carbon Pool Management Index (CPMI) stem from the coupling effect of water-microbial-carbon turnover. Drip irrigation (SD/DP) combined with straw returning not only enhances microbial activity via optimal soil moisture but also reduces excessive carbon mineralization through microbial community regulation. The SD treatment exhibited the highest oxidation stability coefficient (Kos) (Table 1); although its CPMI was lower than that of DP, it showed greater stability. Due to potential risks associated with residual plastic film, DP has fewer long-term advantages in carbon management compared to SD. Flood irrigation (BI) had significantly lower CPMI than drip irrigation, attributed to low water availability and weak microbial decomposition—this further confirms the core role of drip irrigation (especially the SD treatment) in enhancing soil carbon pools in semi-arid regions. Straw returning increases soil porosity, reduces soil bulk density, improves soil permeability and regulates soil C/N ratio, all of which drive changes in CPMI. A balanced C/N ratio promotes enzymatic reactions, leading to higher soil easily oxidizable organic carbon (EOC) and CPMI (Figure 5 and Table 1). Organic fertilizers can improve surface soil active organic carbon and soil carbon pool management indicators to varying degrees. Singh et al. found that combining fertilizer application with straw returning resulted in higher soil active organic carbon content; meanwhile, CPMI is significantly positively correlated with active organic carbon. Increased nitrogen input promotes straw decomposition, further enhancing the activity of soil organic carbon (SOC) and increasing EOC content, thereby elevating CPMI. Different irrigation methods alter soil moisture content. Jianwei et al. noted that soil moisture affects SOC mineralization and root degradation: appropriately increasing soil moisture can raise EOC content, which in turn reduces the stability of the soil carbon pool. Consistent with this finding, the shallow-buried drip irrigation without straw returning (SDCK) treatment in this study had the lowest CPMI and highest Kos, primarily due to its low soil EOC content.
The proportion of active organic carbon in soil organic carbon (SOC)—also referred to as the active organic carbon distribution ratio or carbon efficiency—more sensitively and intuitively reflects the impact of different treatments on SOC content, stability and quality. A higher ratio indicates greater availability of SOC, easier decomposition, lower stability, better soil quality and higher fertility. Although dissolved organic carbon (DOC) accounts for a relatively small fraction of SOC, it serves as a directly utilizable carbon source for soil microorganisms. It influences the processes of soil organic-inorganic transformation and the degradation of soil organic matter, making it one of the most sensitive indicators for evaluating how agricultural management practices affect SOC content. The DOC/SOC ratio reflects the activity of SOC: a higher percentage of DOC in SOC means greater SOC activity, easier utilization by organisms and thus higher soil fertility.
MBC/SOC*100%—also known as microbial entropy (qMBC)—can effectively characterize the conversion efficiency of microbial carbon and soil carbon loss and can be used to infer the effectiveness and stability of carbon. The higher the microbial entropy, the higher the utilization rate of organic carbon. In this research, under the same irrigation treatment, the qMBC of straw returning to the field was higher than that of not returning to the field, indicating that straw returning to the field contributes to the production and growth of microorganisms and promotes the formation of MBC. Under the same straw returning treatment, the size of qMBC is film covered drip irrigation > shallow buried drip irrigation > flood irrigation. There are significant differences among the three irrigation treatments when there is no straw returning to the field. When straw is returned to the field, there is only a significant difference between film mulching drip irrigation and flood irrigation. The qMBC values of DPCS and SDCS were significantly higher than those of other treatments, but the difference between the two was not significant. Therefore, the combination of drip irrigation and straw returning can improve soil quality, which is consistent with existing research results. In BICK treatment, there was no significant correlation between MBC and CPMI, but there was a significant negative correlation between MBC and Kos, indicating that although the increase in soil MBC reduced Kos, it had no significant effect on improving soil fertility. DOC and EOC are significantly positively correlated with CPMI and significantly negatively correlated with K. This indicates that in BICK treatment, with the increase in DOC and EOC content, soil organic carbon activity and soil fertility can be improved. In BICS, DOCK and DPCS, an increase in soil EOC content can enhance soil organic carbon activity and soil fertility. In SDCK, an increase in DOC, EOC and MBC content can enhance soil organic carbon activity and soil fertility. The increase in EOC and POC content in SDCS can enhance soil organic carbon activity and soil fertility. In this research, there is a significant or extremely significant correlation between soil organic carbon, soil active organic carbon, active organic carbon allocation ratio, CPMI and Kos, which interact with each other and are consistent with a large number of existing research results.

5. Conclusions

This study focused on the effects of different irrigation modes and straw treatment methods on soil organic carbon, soil active organic carbon components, soil active carbon allocation ratio, carbon pool management index (CPMI) and oxidation stability coefficient (Kos) under arid and semi-arid climate conditions. The main conclusions are as follows:
(1)
As the growth period of corn advances, the combination of straw returning and drip irrigation provides sufficient carbon sources by accelerating straw decomposition, significantly increasing soil active organic carbon content, thereby enhancing soil active carbon storage and, ultimately, significantly increasing soil organic carbon (SOC) content. This indicates that the synergistic effect of straw returning and drip irrigation mode can help improve soil fertility and organic carbon levels and achieve soil fertilization.
(2)
From the perspective of soil carbon pool index, under the same straw treatment conditions, the Kos of shallow buried drip irrigation (SD) was significantly higher than that of flood irrigation (BI) and subsurface drip irrigation (DP), while the CPMI was lower than the latter two irrigation methods, indicating that SD treatment is beneficial for the accumulation of soil organic carbon and active organic carbon, while improving soil fertility.
(3)
In terms of soil active carbon content and soil carbon pool index, there was no significant difference between film mulching drip irrigation (DP) and shallow burying drip irrigation (SD), but the residual film produced by film mulching in DP treatment would cause a certain degree of soil pollution. Therefore, from the dual dimensions of enhancing soil active carbon pool and soil environmental sustainability, SD treatment has more significant comprehensive advantages.

Author Contributions

Conceptualization, methodology, X.D. and Y.G. data curation, formal analysis, J.W. and W.C.; resources, investigation, writing—original draft preparation, W.C.; funding acquisition, J.W. and X.M. All authors have read and agreed to the published version of the manuscript.

Funding

This research was funded by the Key Technologies and Equipment Research and Development for the Pyrolysis and Resource Utilization of Urban Perishable Waste (No. 20240304173SF); the National Natural Science Foundation of China (42307438).

Data Availability Statement

The original contributions presented in this study are included in the article. Further inquiries can be directed to the corresponding author.

Conflicts of Interest

The authors declare no conflicts of interest.

References

  1. Poeplau, C.; Begill, N.; Liang, Z.; Schiedung, M. Root litter quality drives the dynamic of native mineral-associated organic carbon in a temperate agricultural soil. Plant Soil 2023, 491, 439–456. [Google Scholar] [CrossRef]
  2. Liu, X.; Dong, W.; Si, P.; Zhang, Z.; Chen, B.; Yan, C.; Zhang, Y.; Liu, E. Linkage between soil organic carbon and the utilization of soil microbial carbon under plastic film mulching in a semi-arid agroecosystem in China. Arch. Agron. Soil Sci. 2019, 65, 1788–1801. [Google Scholar] [CrossRef]
  3. Wang, X.; Min, F.; Yu, D.; Xin, Z.; Li, L.; Li, X.; Sun, X.; Pan, J. Mean residence times of active and slow soil organic carbon pools in croplands across China. Catena 2021, 202, 105271. [Google Scholar] [CrossRef]
  4. Ma, P.; Nan, S.; Yang, X.; Qin, Y.; Ma, T.; Li, X.; Yu, Y.; Bodner, G. Macroaggregation is promoted more effectively by organic than inorganic fertilizers in farmland ecosystems of China-A meta-analysis. Soil Tillage Res. 2022, 221, 105394. [Google Scholar] [CrossRef]
  5. Fliessbach, A.; Hany, R.; Rentsch, D.; Frei, R.; Eyhorn, F. DOC trail: Soil organic matter quality and soil aggregate stability in organic and conventional soils. In Proceedings of the 13th International IFOAM Scientific Conference, vdf Hochschulverlag, Zürich, Switzerland, 28–31 August 2000. [Google Scholar]
  6. Rodriguez, A.F.; Daroub, S.H.; Gerber, S.; Jennewein, S.P.; Singh, M.P. Water management effect on soil oxidation, greenhouse gas emissions, and nitrogen leaching in drained peat soils. Soil Sci. Soc. Am. J. 2021, 85, 814–828. [Google Scholar] [CrossRef]
  7. Gougherty, S.W.; Bauer, J.E.; Pohlman, J.W. Exudation rates and delta C-13 signatures of tree root soluble organic carbon in a riparian forest. Biogeochemistry 2018, 137, 235–252. [Google Scholar] [CrossRef]
  8. Sun, H.; Li, X.; Jin, L.; Su, X.; Li, C.; Kou, J. Effects of biological soil crusts on soil labile organic carbon of patchy alpine meadows in the Source Zone of the Yellow River, West China. Catena 2023, 220, 106715. [Google Scholar] [CrossRef]
  9. Yang, Y.; Liu, S.; Schindlbacher, A.; Wang, J.; Li, Z.; Wang, H.; Ming, A.; Lu, L.; Li, Z. Topsoil organic carbon increases but its stability declines after five years of reduced throughfall. Soil Biol. Biochem. 2021, 156, 108221. [Google Scholar] [CrossRef]
  10. Ren, T.; Liao, J.; Delgado-Baquerizo, M.; Ni, J.; Li, Y.; Jin, L.; Ruan, H. Organic fertilization promotes the accumulation of soil particulate organic carbon in a 9-year plantation experiment. Land Degrad. Dev. 2023, 34, 4741–4750. [Google Scholar] [CrossRef]
  11. dos Santos, L.H.; Loss, A.; Canton, L.; Souza, M.; Ferreira, G.W.; Kurtz, C.; Brunetto, G.; Lourenzi, C.R.; Lovato, P.-E.; Comin, J.-J. Carbon and nitrogen content in granulometric fractions of organic matter in soil aggregates under no-tillage and conventional tillage planting systems for onions. Idesia 2018, 36, 2. [Google Scholar] [CrossRef]
  12. ur Rehman, S.; Ijaz, S.S.; Raza, M.A.; Din, A.M.U.; Khan, K.S.; Fatima, S.; Raza, T.; Mehmood, S.; Saeed, A.; Ansar, M. Soil organic carbon sequestration and modeling under conservation tillage and cropping systems in a rainfed agriculture. Eur. J. Agron. 2023, 147, 126840. [Google Scholar] [CrossRef]
  13. Zhang, J.; Zhang, F.; Chang, H. Duration of continuous cropping with straw return affects soil organic carbon. Soil Use Manag. 2023, 39, 1096–1108. [Google Scholar] [CrossRef]
  14. Son, Y.B.; Gardner, W.D.; Mishonov, A.V.; Richardson, M.J. Model-based remote sensing algorithms for particulate organic carbon (POC) in the Northeastern Gulf of Mexico. J. Earth Syst. Sci. 2009, 118, 1–10. [Google Scholar] [CrossRef]
  15. Major, J.; Lehmann, J.; Rondon, M.; Goodale, C. Fate of soil-applied black carbon: Downward migration, leaching and soil respiration. Glob. Change Biol. 2010, 16, 1366–1379. [Google Scholar] [CrossRef]
  16. Ruf, T.; Emmerling, C. Soil organic carbon allocation and dynamics under perennial energy crops and their feedbacks with soil microbial biomass and activity. Soil Use Manag. 2020, 36, 646–657. [Google Scholar] [CrossRef]
  17. Lupwayi, N.Z.; Clayton, G.W.; O’dOnovan, J.T.; Harker, K.N.; Turkington, T.K.; Rice, W.A. Soil microbiological properties during decomposition of crop residues under conventional and zero tillage. Can. J. Soil Sci. 2004, 84, 411–419. [Google Scholar] [CrossRef]
  18. Kooch, Y.; Ehsani, S.; Akbarinia, M. Stoichiometry of microbial indicators shows clearly more soil responses to land cover changes than absolute microbial activities. Ecol. Eng. 2019, 131, 99–106. [Google Scholar] [CrossRef]
  19. Arora, S.; Sahni, D.; Arora, S.; Sehgal, M.; Srivastava, D.; Singh, A. Soil microbial biomass C and microbial activity as influenced by pesticide use in Paddy. In Proceedings of the International Conference on Natural Resource Management for Food Security and Rural Livelihoods, New Delhi, India, 10–13 February 2015. [Google Scholar]
  20. Wang, W.; Lai, D.Y.F.; Wang, C.; Pan, T.; Zeng, C. Effects of rice straw incorporation on active soil organic carbon pools in a subtropical paddy field. Soil Tillage Res. 2015, 152, 8–16. [Google Scholar] [CrossRef]
  21. Chen, Z.; Wang, Q.; Wang, H.; Bao, L.; Zhou, J. Crop yields and soil organic carbon fractions as influenced by straw incorporation in a rice–wheat cropping system in southeastern China. Indian Med. J. 2018, 112, 61–73. [Google Scholar] [CrossRef]
  22. Blair, G.; Lefroy, R.; Lisle, L. Soil carbon fractions based on their degree of oxidation, and the development of a carbon management index for agricultural systems. Aust. J. Agric. Res. 1995, 46, 1459–1466. [Google Scholar] [CrossRef]
  23. Moharana, P.C.; Biswas, D.R.; Ghosh, A.; Sarkar, A.; Bhattacharyya, R.; Meena, M.D. Effects of crop residues composts on the fractions and forms of organic carbon and nitrogen in subtropical Indian conditions. Soil Res. 2019, 58, 95–108. [Google Scholar] [CrossRef]
  24. Helfrich, M.; Flessa, H.; Dreves, A.; Ludwig, B. Is thermal oxidation at different temperatures suitable to isolate soil organic carbon fractions with different turnover? J. Plant Nutr. Soil Sci. 2010, 173, 61–66. [Google Scholar] [CrossRef]
  25. Dong, L.; Yang, X.; Shi, L.; Shen, Y.; Wang, L.; Wang, J.; Li, C.; Zhang, H. Biochar and nitrogen fertilizer co-application changed SOC content and fraction composition in Huang-Huai-Hai plain, China. Chemosphere 2022, 291, 132925. [Google Scholar] [CrossRef]
  26. Wei, L.; Ge, T.; Zhu, Z.; Ye, R.; Peñuelas, J.; Li, Y.; Lynn, T.M.; Jones, D.L.; Wu, J.; Kuzyakov, Y. Paddy soils have a much higher microbial biomass content than upland soils: A review of the origin, mechanisms, and drivers. Agric. Ecosyst. Environ. 2022, 326, 107798. [Google Scholar] [CrossRef]
  27. Jiang, P.; He, S.; Xiao, L.; Li, L.; Liu, M. Effects of Drought on Dissolved Organic Carbon Content in Grassland and Forest Soils. Russ. J. Ecol. 2023, 54, 516–525. [Google Scholar] [CrossRef]
  28. Xiao, Y.; Huang, Z.; Lu, X. Changes of soil labile organic carbon fractions and their relation to soil microbial characteristics in four typical wetlands of Sanjiang Plain, Northeast China. Ecol. Eng. 2015, 82, 381–389. [Google Scholar] [CrossRef]
  29. Yu, M.; Wang, Y.-P.; Deng, Q.; Jiang, J.; Cao, N.; Tang, X.; Zhang, D.; Yan, J. Soil acidification enhanced soil carbon sequestration through increased mineral protection. Plant Soil 2024, 503, 529–544. [Google Scholar] [CrossRef]
  30. Ma, L.; Lv, X.; Cao, N.; Wang, Z.; Zhou, Z.; Meng, Y. Alterations of soil labile organic carbon fractions and biological properties under different residue-management methods with equivalent carbon input. Appl. Soil Ecol. 2020, 161, 103821. [Google Scholar] [CrossRef]
  31. Chen, P.; Nie, T.; Chen, S.; Zhang, Z.; Qi, Z.; Liu, W. Recovery efficiency and loss of 15N-labelled urea in a rice-soil system under water saving irrigation in the Songnen Plain of Northeast China. Agric. Water Manag. 2019, 222, 139–153. [Google Scholar] [CrossRef]
  32. Souza, R.; Yin, J.; Calabrese, S. Optimal drainage timing for mitigating methane emissions from rice paddy fields. Geoderma 2021, 394, 114986. [Google Scholar] [CrossRef]
  33. Bass, A.M.; O’Grady, D.; Leblanc, M.; Tweed, S.; Nelson, P.N.; Bird, M.I. Carbon Dioxide and Methane Emissions from a Wet-Dry Tropical Floodplain in Northern Australia. Wetlands 2014, 34, 619–627. [Google Scholar] [CrossRef]
  34. Haynes, R.J.; Swift, R.S. Stability of soil aggregates in relation to organic constituents and soil water content. J. Soil Sci. 1990, 41, 73–83. [Google Scholar] [CrossRef]
  35. Santos, F.L.; Reis, J.L.; Martins, O.C.; Castanheira, N.L.; Serralheiro, R.P. Comparative Assessment of Infiltration, Runoff and Erosion of Sprinkler Irrigated Soils. Biosyst. Eng. 2003, 86, 355–364. [Google Scholar] [CrossRef]
  36. Wang, F.-X.; Feng, S.-Y.; Hou, X.-Y.; Kang, S.-Z.; Han, J.-J. Potato growth with and without plastic mulch in two typical regions of Northern China. Field Crops Res. 2009, 110, 123–129. [Google Scholar] [CrossRef]
  37. Bai, Y.; Zhou, Y.; He, H. Effects of rehabilitation through afforestation on soil aggregate stability and aggregate-associated carbon after forest fires in subtropical China. Geoderma 2020, 376, 114548. [Google Scholar] [CrossRef]
  38. Han, Y.; Zhang, Z.; Li, T.; Chen, P.; Nie, T.; Zhang, Z.; Du, S. Straw return alleviates the greenhouse effect of paddy fields by increasing soil organic carbon sequestration under water-saving irrigation. Agric. Water Manag. 2023, 287, 108434. [Google Scholar] [CrossRef]
  39. Wang, Q.; Liu, X.; Li, J.; Yang, X.; Guo, Z. Straw application and soil organic carbon change: A meta-analysis. Soil Water Res. 2021, 16, 112–120. [Google Scholar] [CrossRef]
  40. Ribeiro, P.L.; Bamberg, A.L.; Pereira, I.d.S.; Monteiro, A.B.; Potes, M.d.L.; de Lima, C.L.R. Water treatment residuals for ameliorating sandy soils: Implications in environmental, soil and plant growth parameters. Geoderma 2022, 407, 115537. [Google Scholar] [CrossRef]
  41. Seneviratne, S.I.; Viterbo, P.; Lüthi, D.; Schär, C. Inferring Changes in Terrestrial Water Storage Using ERA-40 Reanalysis Data: The Mississippi River Basin. J. Clim. 2004, 17, 2039–2057. [Google Scholar] [CrossRef]
  42. Liu, X.; Guo, K.; Huang, L.; Ji, Z.; Jiang, H.; Li, H.; Zhang, J. Responses of absolute and specific enzyme activity to consecutive application of composted sewage sludge in a Fluventic Ustochrept. PLoS ONE 2017, 12, e0177796. [Google Scholar] [CrossRef]
  43. Lan, J. Responses of soil organic carbon components and their sensitivity to karst rocky desertification control measures in Southwest China. J. Soils Sediments 2021, 21, 1–12. [Google Scholar] [CrossRef]
  44. Hao, X.; Han, X.; Wang, S.; Li, L.-J. Dynamics and composition of soil organic carbon in response to 15 years of straw return in a Mollisol. Soil Tillage Res. 2022, 215, 105221. [Google Scholar] [CrossRef]
  45. Xu, C.; Xia, B. Response of microbial activity in the rhizosphere of maize seedlings (Zea mays L.) to pyrene contamination. Acta Ecol. Sin. 2010, 30, 1296–1305. [Google Scholar] [CrossRef]
  46. Chen, X.; Zhang, H.; Yao, X.; Zeng, W.; Wang, W. Latitudinal and depth patterns of soil microbial biomass carbon, nitrogen and phosphorus in grasslands of an agro-pastoral ecotone. Land Degrad. Dev. 2021, 32, 3833–3846. [Google Scholar] [CrossRef]
  47. Noori, Z.; Delavar, M.A.; Safari, Y.; Alavi-Siney, S.M. Reclamation of a calcium carbonate sodium soil with combined amendments: Interactive effects of chemical and organic materials on soil chemical properties. Arab J Geosci. 2021, 14, 166. [Google Scholar] [CrossRef]
  48. Dachraoui, M.; Sombrero, A. Soil organic carbon accumulation and carbon dioxide emissions during a 6-year research in irrigated continuous maize under two tillage systems in semiarid Mediterranean conditions. Span. J. Agric. Res. 2021, 19, e1102. [Google Scholar] [CrossRef]
  49. Li, J.; Chi, F.Q.; Wei, D.; Jin, L.; Li, Y.M.; Guo, W.Y.; Xu, M. Effects of Different Organic Materials Returning to Field on the Content of Active Organic Carbon in Black Soil. Soybean Sci. 2016, 35, 975–980. [Google Scholar]
  50. Rühlmann, J.; Ruppel, S. Effects of organic amendments on soil carbon content and microbial biomass-results of the long-term box plot experiment in Grossbeeren. Arch. Agron. Soil Sci. 2005, 51, 163–170. [Google Scholar] [CrossRef]
  51. Beare, M.H.; Wilson, P.E.; Fraser, P.M.; Butler, R.C. Management Effects on Barley Straw Decomposition, Nitrogen Release, and Crop Production. Soil Sci. Soc. Am. J. 2002, 66, 848. [Google Scholar] [CrossRef]
  52. Chen, X.J.; Wu, X.H.; Jian, Y.; Yuan, H.Z.; Zhou, P.; Ge, T.D.; Tong, C.L.; Zou, D.S.; Wu, J.S. Carbon Dioxide Assimilation Potential, Functional Gene Amount and RubisCO Activity of Autotrophic Microorganisms in Agricultural Soils. Huan Jing Ke Xue 2014, 35, 1144–1150. [Google Scholar]
  53. Wang, F.L.; Bettany, J.R. Influence of Freeze-Thaw and Flooding on the Loss of Soluble Organic Carbon and Carbon Dioxide from Soil. J. Environ. Qual. 1993, 22, 709–714. [Google Scholar] [CrossRef]
  54. Pan, G.; Zhou, P.; Li, Z.; Smith, P.; Li, L.; Qiu, D.; Zhang, X.; Xu, X.; Shen, S.; Chen, X. Combined inorganic/organic fertilization enhances N efficiency and increases rice productivity through organic carbon accumulation in a rice paddy from the Tai Lake region, China. Agric. Ecosyst. Environ. 2009, 131, 274–280. [Google Scholar] [CrossRef]
  55. He, Y.T.; He, X.H.; Xu, M.G.; Zhang, W.J.; Yang, X.Y.; Huang, S.M. Long-term fertilization increases soil organic carbon and alters its chemical composition in three wheat-maize cropping sites across central and south China. Soil Tillage Res. 2018, 177, 79–87. [Google Scholar] [CrossRef]
  56. Han, L.; Zhang, Y.-L.; Jin, S.; Wang, J.; Wei, Y.-Y.; Cui, N.; Wei, W. Effect of Different Irrigation Methods on Dissolved Organic Carbon and Microbial Biomass Carbon in the Greenhouse Soil. Agric. Sci. China 2010, 9, 1175–1182. [Google Scholar] [CrossRef]
  57. Zen, Q.C.; Li, X.; Dong, Y.H.; Li, Y.Y. Soil microbial biomass nitrogen and carbon, water soluble nitrogen and carbon under different arbors forests on the Loess Plateau. Acta Ecol. Sin. 2015, 35, 3598–3605. [Google Scholar] [CrossRef]
  58. Aminiyan, M.M.; Sinegani, A.A.S.; Sheklabadi, M. The effect of zeolite and some plant residues on soil organic carbon changes in density and soluble fractions: Incubation research. Agric. Adv. 2016, 5, 74–83. [Google Scholar] [CrossRef]
  59. Hassan, W.; Bano, R.; Khatak, B.U.; Hussain, I.; Yousaf, M.; David, J. Temperature Sensitivity and Soil Organic Carbon Pools Decomposition under Different Moisture Regimes: Effect on Total Microbial and Enzymatic Activity. Clean Soil Air Water 2014, 43, 391–398. [Google Scholar] [CrossRef]
  60. Shaver, G.R.; Giblin, A.E.; Nadelhoffer, K.J.; Thieler, K.K.; Downs, M.R.; Laundre, J.A.; Rastetter, E.B. Carbon turnover in Alaskan tundra soils: Effects of organic matter quality, temperature, moisture and fertilizer. J. Ecol. 2010, 94, 740–753. [Google Scholar] [CrossRef]
  61. Li, Z.; Shen, Y.; Zhang, W.; Zhang, H.; Liu, L.; Wang, Z.; Gu, J.; Yang, J. Effects of long-term straw returning on rice yield and soil properties and bacterial community in a rice-wheat rotation system. Field Crops Res. 2023, 291, 108800. [Google Scholar] [CrossRef]
  62. Badri, D.V.; Vivanco, J.M. Regulation and function of root exudates. Plant Cell Environ. 2010, 32, 666–681. [Google Scholar] [CrossRef]
  63. Wen, Y.; Liu, J.; Zhang, J.; Li, W.; Ayantobo, O.O.; Wang, Z. Effects of macro-plastics on soil hydrothermal environment, cotton yield, and fiber quality under mulched drip irrigation in the arid region of Northwest China. Field Crops Res. 2023, 302, 109060. [Google Scholar] [CrossRef]
  64. Zhang, M.; Song, D.; Pu, X.; Dang, P.; Qin, X.; Siddique, K.H. Effect of different straw returning measures on resource use efficiency and spring maize yield under a plastic film mulch system. Eur. J. Agron. 2022, 134, 126461. [Google Scholar] [CrossRef]
  65. Aitkenhead, J.A.; McDowell, W.H. Soil C:N ratio as a predictor of annual riverine DOC flux at local and global scales. Glob. Biogeochem. Cycles 2000, 14, 127–138. [Google Scholar] [CrossRef]
  66. Rogers, R.S. Local Coexistence of Deciduous-Forest Groundlayer Species Growing in Different Seasons. Ecology 1985, 66, 701. [Google Scholar] [CrossRef]
  67. Bu, X.; Gu, X.; Zhou, X.; Zhang, M.; Guo, Z.; Zhang, J.; Zhou, X.; Chen, X.; Wang, X. Extreme drought slightly decreased soil labile organic C and N contents and altered microbial community structure in a subtropical evergreen forest. For. Ecol. Manag. 2018, 429, 18–27. [Google Scholar] [CrossRef]
  68. Zhang, M.; Bai, X.; Wang, Y.; Li, Y.; Cui, Y.; Hu, S.; Jonathan, M.A.; Dong, L.; Yu, X. Soil microbial trait-based strategies drive the storage and stability of the soil carbon pool in Robinia pseudoacacia plantations. Catena 2023, 222, 106894. [Google Scholar] [CrossRef]
  69. Zhao, C.; Zhang, Y.; Liu, X.; Ma, X.; Meng, Y.; Li, X.; Quan, X.; Shan, J.; Zhao, W.; Wang, H. Comparing the Effects of Biochar and Straw Amendment on Soil Carbon Pools and Bacterial Community Structure in Degraded Soil. Nat. Rev. Cancer 2020, 20, 751–760. [Google Scholar] [CrossRef]
  70. Wu, P.P.; Wang, J.J.; Li, L.J. Responses of labile organic carbon components to different fertilization practices in white soil. Univ. Glasg. 2015, 34, 3734. [Google Scholar]
  71. Chaganti, V.N.; Ganjegunte, G.; Somenahally, A.; Hargrove, W.L.; Ulery, A.; Enciso, J.M.; Flynn, R. Response of soil organic carbon and soil health indicators to treated wastewater irrigation in bioenergy sorghum production on an arid soil. Land Degrad. Dev. 2021, 32, 2197–2209. [Google Scholar] [CrossRef]
  72. Huang, T.; Yang, H.; Huang, C.; Ju, X. Effects of nitrogen management and straw return on soil organic carbon sequestration and aggregate-associated carbon. Eur. J. Soil Sci. 2018, 69, 913–923. [Google Scholar] [CrossRef]
  73. Ji, J.H.; Zhang, Y.L.; Zhang, Y.L.; Yu, N.; Wand, W.C. Effect of irrigation methods on mineralization of soil organic nitrogen in protected field. Acta Pedol. Sin. 2009, 46, 869–877. [Google Scholar]
  74. Singh, K.; Ghoshal, N.; Singh, S. Soil carbon dioxide flux, carbon sequestration and crop productivity in a tropical dryland agroecosystem: Influence of organic inputs of varying resource quality. Appl. Soil Ecol. 2009, 42, 243–253. [Google Scholar] [CrossRef]
  75. Xie, H.; Li, J.; Zhu, P.; Peng, C.; Wang, J.; He, H.; Zhang, X. Long-term manure amendments enhance neutral sugar accumulation in bulk soil and particulate organic matter in a Mollisol. Soil Biol. Biochem. 2014, 78, 45–53. [Google Scholar] [CrossRef]
Figure 1. Temperature and precipitation in the experimental area in 2020 and 2021.
Applsci 15 11006 g001
Figure 2. Effect of straw return on soil organic carbon (SOC) under different irrigation conditions. Note: W represents different irrigation methods, C represents different straw treatment methods. CK represents straw not returning to the field, CS represents straw returning to the field. BI: Flood irrigation; SD: Shallow buried drip irrigation; DP: mulching drip irrigation. The data is expressed as mean ± standard error (n = 3). Lowercase letters represent the differences between different irrigation modes under the same straw treatment method, while uppercase letters represent the differences between different straw treatment methods under the same irrigation mode (p < 0.05).
Applsci 15 11006 g002
Figure 3. The effect of straw return on MBC under different irrigation conditions. Note: W represents different irrigation methods, C represents different straw treatment methods. CK represents straw not returning to the field, CS represents straw returning to the field. BI: Flood irrigation; SD: Shallow buried drip irrigation; DP: mulching drip irrigation. The data is expressed as mean ± standard error (n = 3). Lowercase letters represent the differences between different irrigation modes under the same straw treatment method, while uppercase letters represent the differences between different straw treatment methods under the same irrigation mode (p < 0.05).
Applsci 15 11006 g003
Figure 4. The effect of straw return on DOC under different irrigation conditions. Note: W represents different irrigation methods, C represents different straw treatment methods, CK represents straw not returning to the field and CS represents straw returning to the field. BI: Flood irrigation; SD: Shallow buried drip irrigation; DP: mulching drip irrigation. The data is expressed as mean ± standard error (n = 3). Lowercase letters represent the differences between different irrigation modes under the same straw treatment method, while uppercase letters represent the differences between different straw treatment methods under the same irrigation mode (p < 0.05).
Applsci 15 11006 g004
Figure 5. The effect of straw return on EOC under different irrigation conditions. Note: W represents different irrigation methods, C represents different straw treatment methods, CK represents straw not returning to the field and CS represents straw returning to the field. BI: Flood irrigation; SD: Shallow buried drip irrigation; DP: mulching drip irrigation. The data is expressed as mean ± standard error (n = 3). Lowercase letters represent the differences between different irrigation modes under the same straw treatment method, while uppercase letters represent the differences between different straw treatment methods under the same irrigation mode (p < 0.05).
Applsci 15 11006 g005
Figure 6. Effect of straw return on POC under different irrigation conditions. Note: W represents different irrigation methods, C represents different straw treatment methods, CK represents straw not returning to the field and CS represents straw returning to the field. BI: Flood irrigation; SD: Shallow buried drip irrigation; DP: mulching drip irrigation. The data is expressed as mean ± standard error (n = 3). Lowercase letters represent the differences between different irrigation modes under the same straw treatment method, while uppercase letters represent the differences between different straw treatment methods under the same irrigation mode (p < 0.05).
Applsci 15 11006 g006
Figure 7. Decomposition of variance analysis (VPA) of irrigation mode and straw return on activated carbon storage.
Applsci 15 11006 g007
Table 1. The effect of straw returning to the field under different irrigation conditions on CPMI and Kos value.
TreatmentCPMI (%)CPIAIAStable Organic Carbon
(g/kg)
Kos
201920202019202020192020201920202019202020192020
CKBI68.8 ± 7.2 Bb77.6 ± 8.2 Bb1.1 ± 0.0 Ba1.1 ± 0.0 Bb0.7 ± 0.1 Bb0.7 ± 0.0 Bb0.02 ± 0 Bb0.03 ± 0 Bb16.4 ± 0.5 Aa16.2 ± 0.2 Ab42.0 ± 2.2 Ab37.0 ± 2.2 Ab
q60.8 ± 1.3 Bb62.0 ± 1.3 Bc1.1 ± 0.0 Ba1.1 ± 0 Bab0.6 ± 0.0 Bb0.6 ± 0.0 Bc0.02 ± 0 Bb0.02 ± 0 Bc16.5 ± 0.3 Aa16.8 ± 0.03 Aa47.3 ± 0.5 Aa47.5 ± 0.6 Aa
DP85.3 ± 4.8 Ba94.0 ± 4.3 Ba1.1 ± 0.0 Ba1.1 ± 0.0 Ba0.8 ± 0.1 Ba0.9 ± 0.0 Ba0.03 ± 0 Ba0.03 ± 0 Ba16.4 ± 0.1 Aa17.0 ± 0.2 Aa33.9 ± 1.2 Ac32.0 ± 1.2 Ab
CSBI207.4 ± 6.2 Ab298.9 ± 9.1 Ab1.1 ± 0.0 Ac1.123 ± 0.0 Ab1.9 ± 0.1 Aa2.7 ± 0.1 Aa0.07 ± 0 Aa0.10 ± 0.1 Aa15.8 ± 0.1 Ab16.2 ± 0.3 Aa14.0 ± 0.3 Ba10.2 ± 0.2 Bb
SD238.9 ± 2.1 Aab254.4 ± 2.4 Ab1.1 ± 0.0 Ab1.2 ± 0.02 Aab2.2 ± 0.03 Aa2.2 ± 0.0 Ab0.08 ± 0 Aa0.08 ± 0.1 Ab16.0 ± 0.1 Bb16.8 ± 0.2 Aa12.4 ± 0.1 Ba12.2 ± 0.2 Ba
DP252.9 ± 27.1 Aa352.9 ± 38.5 Aa1.1 ± 0.0 Aa1.2 ± 0.0 Aa2.2 ± 0.2 Aa3.0 ± 0.2 Aa0.08 ± 0.0 Aa0.11 ± 0.01 Aa16.7 ± 0.2 Ba16.9 ± 0.1 Ba12.3 ± 0.8 Ba9.2 ± 0.56 Bb
ANOVA
W*********************
C************************
W × C****nsnsnsnsnsnsnsnsnsns
Note: W represents different irrigation methods, C represents different straw treatment methods, CK represents straw not returning to the field and CS represents straw returning to the field. BI: Flood irrigation; SD: Shallow buried drip irrigation; DP: mulching drip irrigation. The data is expressed as mean ± standard error (n = 3). Lowercase letters represent the differences between different irrigation modes under the same straw treatment method, while uppercase letters represent the differences between different straw treatment methods under the same irrigation mode (p < 0.05). ** Indicates significant difference at the 1% level, * indicates significant difference at the 5% level, and ns indicates no significant difference.
Table 2. Percentage of active organic carbon on soil organic carbon (%).
TreatmentDOC/SOC (%)SCEPOC/SOC (%)qMBC
CKBI0.28 ± 0.00 Bb3.01 ± 0.11 Bb45.0 ± 1.0 Ba0.49 ± 0.01 Bc
SD0.31 ± 0.01 Bb2.47 ± 0.08 Bc45.5 ± 0.2 Ba0.54 ± 0.01 Bb
DP0.33 ± 0.01 Ba3.66 ± 0.04 Ba46.3 ± 0.4 Ba0.58 ± 0.01 Ba
CSBI0.39 ± 0.01 Ac6.7 ± 0.17 Ab46.7 ± 0.8 Ab0.60 ± 0.01 Ab
SD0.43 ± 0.00 Ab6.6 ± 0.07 Ab48.3 ± 0.5 Aab0.67 ± 0.02 Aab
DP0.47 ± 0.00 Aa7.9 ± 0.31 Aa50.0 ± 0.2 Aa0.70 ± 0.02 Aa
ANOVA
W*******
C********
W × C****nsns
Note: W represents different irrigation methods, C represents different straw treatment methods, CK represents straw not returning to the field and CS represents straw returning to the field. BI: Flood irrigation; SD: Shallow buried drip irrigation; DP: mulching drip irrigation. The data is expressed as mean ± standard error (n = 3). Lowercase letters represent the differences between different irrigation modes under the same straw treatment method, while uppercase letters represent the differences between different straw treatment methods under the same irrigation mode (p < 0.05). ** Indicates significant difference at the 1% level, * indicates significant difference at the 5% level, and ns indicates no significant difference.
Disclaimer/Publisher’s Note: The statements, opinions and data contained in all publications are solely those of the individual author(s) and contributor(s) and not of MDPI and/or the editor(s). MDPI and/or the editor(s) disclaim responsibility for any injury to people or property resulting from any ideas, methods, instructions or products referred to in the content.