Abstract
Eucalyptus nitens (H. Deane & Maiden) Maiden is a widely planted hardwood species in Australia, particularly in Tasmania, where it occupies approximately 168,000 ha. Although primarily managed for pulp production, the species is attracting interest for sawn and engineered wood applications. Previous evaluations of its properties have relied on destructive testing; however, non-destructive evaluation (NDE) techniques provide a viable alternative for industrial applications. This study examined the use of acoustic-based NDE to assess plantation-grown E. nitens logs sourced from two Tasmanian harvesting sites, focusing on the relationship between dynamic modulus of elasticity (DMOE), static MOE, and modulus of rupture (MOR) across radial positions from pith to bark. The results indicated that core samples exhibited stronger correlations with static MOE and MOR compared with middle and outer samples. DMOE consistently overestimated static MOE by 10.81% and 24.66% at the two sites, with variation evident across radial positions. These findings demonstrate the effectiveness of acoustic NDE for evaluating wood stiffness, highlighting the importance of sample location within logs.
1. Introduction
Tasmania has Australia’s largest plantation-grown hardwood estate, with around 28% of the nation’s overall plantation area [], and contributes 35% of the national supply of plantation hardwood pulp and sawlogs. Shining gum (E. nitens) makes up 89% of Tasmania’s plantation hardwood area, covering approximately 168,000 ha of the total hardwood plantation estate of 192,000 ha []. E. nitens is a frost-hardy species with better growth performance at higher altitude than the state’s second most grown plantation species, the more frost-prone southern blue gum (E. globulus). Currently, E. nitens is managed for fibre production under unthinned and unpruned regimes with a 15–18-year age rotation. However, due to a reduction in native sawlog supply, plantation-grown E. nitens is gaining attention as a potential feedstock for solid and engineered wood product manufacture []. As noted in previous studies, these fibre-managed logs have the potential for conversion to structural and other engineered wood products [,]. However, variable wood density and regular strength-reducing features (SRFs) impact product performance and encourage the development of accurate grading and material batching methods at both the log and sawn board levels []. Visual stress grading (VSG) to grading rules in the Australian Standard (AS 2082:2007) is standard practice for sorting sawn structural hardwood board, but this standard has not been adjusted to provide reliable results for the performance of the younger and faster-grown wood common in a plantation resource []. Also, it is only available for grading boards. In contrast, NDE offers a faster, scalable alternative and the potential for streaming material earlier in the production process.
Grading is a process that categorises logs, sawn boards, and other wood products based on form (size, shape, and straightness) and visible structural properties or appearance characteristics by applying established grading rules/standards. It aims to ensure that materials are suitable for their intended end applications, support fair trade, and address wood’s natural variability. In construction, particularly for beams and columns, strength and stiffness are critical []. For plantation wood, especially fibre-managed E. nitens, grading is essential to manage the impact of SRFs and maintain product value. Early grading of unseasoned boards allows low-strength material to be diverted to lower-grade production pathways, reducing processing costs and potential waste []. To improve production accuracy, NDE methods are increasingly being used to assess the log, board, and veneer characteristics during processing [,]. NDE tools can estimate key properties such as stiffness, density, moisture content (MC), and the presence of SRFs, such as knots and holes. Unlike VSG, which classifies material, NDE provides detailed measurements for evaluation, making it a valuable complement to modern data-driven wood processing techniques. In previous studies, NDE by use of stress wave velocity (SWV) and in combination with pin penetration (PD) on Sitka spruce to pre-sort material showed reduced variability in MOE []. A high correlation value was found between AWV and the mechanical properties of laminated veneer lumber (LVL) from E. nitens, supporting AWV’s use for efficient log selection and improved product quality []. Using two parameters, such as density and DMOE, E. nitens logs were segregated, and the study’s findings stated that older trees (13–15 years old) yielded better structural properties than younger ones (8 years old), with middle logs having a higher DMOE than butt logs []. The NDE of tropical hardwoods using resonance- and ultrasonic-based tools concludes that DMOE is density-dependent and generally overestimates static MOE. At the same time, MOR correlates well with both static MOE and density []. The comparison between VSG and AWV results on 21-year-old E. nitens concluded that AWV had lower error rates in stiffness-based segregation (45.2%) than VSG (82.5%), with log position affecting board quality []. The vibration-based NDE of Chilean E. nitens showed that a longitudinal vibration slightly overestimates static MOE, and in the transverse direction, it slightly underestimates static MOE results. Vibration methods proved reliable in the presence of SRFs []. Additionally, AWV and green density effectively predict static MOE, reinforcing AWV as a robust and non-invasive grading tool [].
Genetics and site conditions strongly influence pulp yield, density, and stiffness. In E. nitens, basic density shows a negative genetic correlation with tree diameter and cellulose content. At the same time, fibre length positively correlates with both diameter and cellulose content but varies with basic density []. In North-East Tasmania, high-elevation sites with greater rainfall yielded trees with higher wood stiffness. Conversely, drier regions produced trees with larger diameters and higher density. Interestingly, stiffness declined with increasing site productivity, reflecting soil structure, fertility, and site quality [].
Wood properties vary along both radial and longitudinal axes. Density is relatively stable from base to mid-height but differs significantly from bark to sapwood. Radially, it changes more from bark to sapwood than from pith to heartwood []. Stiffness is typically highest in middle logs longitudinally and greater in sapwood than heartwood radially. Strength decreases from base to top, with mature wood in the lower section exhibiting higher values []. The microfibril angle (MFA) trends from high near the pith to lower values near the bark. Bark-adjacent MFA ranged from 20 to 30° regardless of height in 15-year-old trees []. Fibre length is generally constant from the base to mid-height but declines sharply toward the top [].
This study varies from previous studies. Previous studies from the last 20 years have used AWV-based tools to assess the wood properties of logs, aiming to produce a correlation with batches of products, such as sawn boards or veneer. This study established a correlation between AWV with specific characteristics of the logs and recovered samples based on the location of samples inside the logs, with the following objectives:
- To analyse the potential of the AWV tool to examine the characteristics of different-aged logs and recovered small clear samples.
- To analyse the correlation between the DMOE of the harvested logs with the stiffness (static MOE) of small clear samples recovered from them.
- To analyse the correlation between DMOE results and static MOE results based on the location of samples in the logs in green and dry condition.
2. Materials and Methods
The material used for this study was E. nitens logs, primarily fibre-managed for pulp wood and collected from two different harvesting sites. Six 18-year-old butt logs were sourced from Site 1: Neville Smith Forest Products log yard in Southern Tasmania (Figure 1). Five 16-year-old butt logs were sourced from Site 2: Forico Future Fibre Private Limited harvesting site at Surrey Hills, North-West Tasmania (see Figure 1). The length of the logs was 5 m, and both end diameters were measured at the harvesting site, with the small end diameter (SED) ranging from 20.5 cm to 27.5 cm. In the Site 1 logs, different colour patterns were used and in Site 2 logs a serial number was marked on each log for further identification and milling (see Figure 2).

Figure 1.
Harvested logs sourced from Site 1 located in Southern Tasmania (18-year-old logs) (A) and (B) logs sourced from Site 2 located in North-West Tasmania.
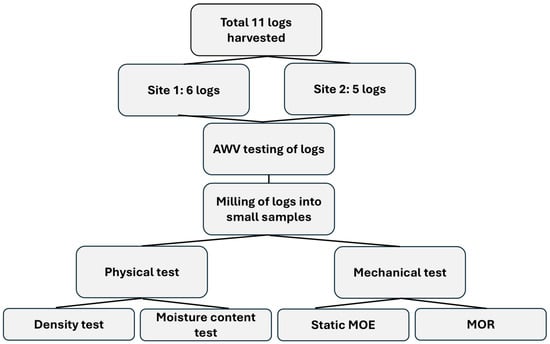
Figure 2.
Methodology flow chart of the logs and small clear samples for non-destructive and destructive testing.
Site conditions and sample handling impacted the moisture content (MC) of tested samples. At Site 1, the sample logs were recovered from log yard storage well after harvesting and transport. Then, delays occurred after the logs were cut into sawn boards and converted into small clear samples. In both these cases, MC was lost. At Site 2, logs were freshly harvested, and the moisture content was controlled during sawing and sample recovery. To recognise this MC differential between sites, both green and basic density are taken into account in the analysis.
2.1. Non-Destructive Evaluation of Harvested Logs
The AWV of each log was taken at the small end with the Hitman 200TM tool (see Figure 3) based on acoustic resonance. In a test, a device-integrated hammer causes stress waves to be applied to the log small end in the longitudinal direction. When the log is placed on the raised surface, waves go to the other end and then return to the affected end. A sensor built within the gadget measures the oscillation’s temporal history. The signal was examined in terms of the piece’s inherent frequency when it is vibrating longitudinally. The frequency data provided by the tool were combined with the log’s green density to calculate its DMOE, using the following formula:
where p = green/basic density (kg/m3) of the log, and the AWV of the log is in km/s.
DMOE = p × (AWV)2
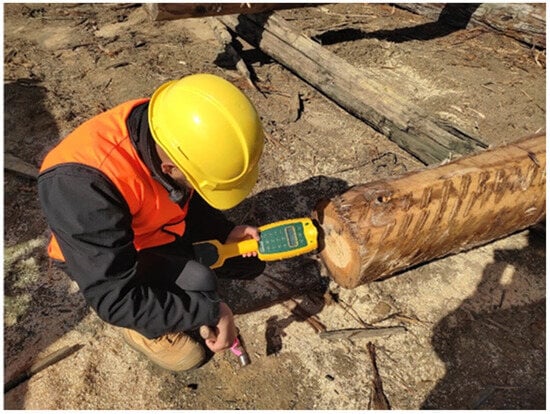
Figure 3.
On-site AWV testing by Hitman 200TM on the small end of a butt log.
After NDE data collection from each log, a 1 m length of log was docked from the small end for further milling in the sawmill.
2.2. Log Conversion and Small Sample Preparation
To assess the logs’ actual wood properties, small clear samples were recovered from various positions in each log. These samples were 400 mm length and 20 × 20 mm in cross-section according to AS/NZ: 4063.1:2010 [].
To recover the small clear samples, the logs were cut on portable band saws to generate three to four 25 mm radial sawn boards through the core based on the recovery and diameter of the logs (see Figure 4).
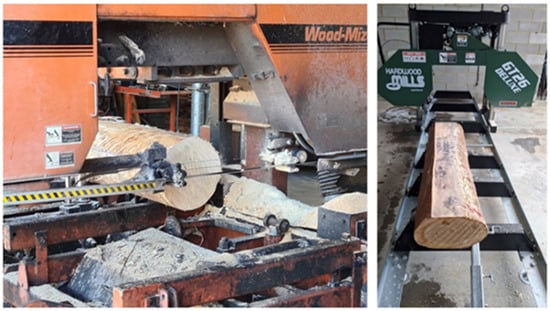
Figure 4.
Milling of a 1 m log at the sawmill to recover sawn boards and small clear samples.
These sawn boards were then ripped longitudinally to recover core, middle, and outer location samples (see Figure 5).
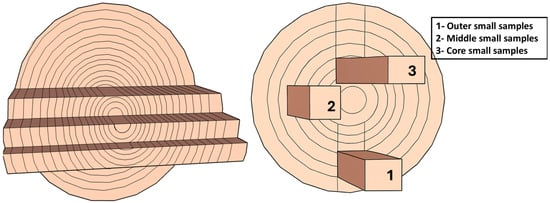
Figure 5.
Three-dimensional presentation of sawn board and small clear sample locations inside the log after milling.
From the Site 1 and Site 2 logs, 135 and 86 small clear samples were recovered, respectively. In the milling process, from each sawn board, six samples were recovered. However, after the conversion, some samples included SRFs, and they were discarded from the study.
2.3. Density (kg/m3) and Moisture Content (MC%) Measurement
The density and MC samples were recovered from the small clear samples and calculated by using the oven-dry moisture content calculation method (see Figure 6); samples were dried for 24 h at a temperature of 103 ± 2 °C. The cross-sectional size of the density samples was 20 × 20 mm with a nominal length of 25 mm using AS/NZ: 1080.1 [].
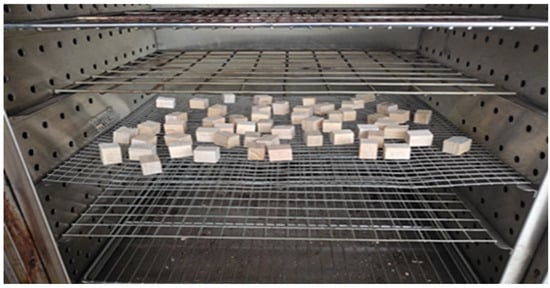
Figure 6.
Density and moisture content samples for oven-drying based on AS/NZ: 1080.1 [].
2.4. Static Bending Test
The small clear samples were tested for their mechanical properties using a universal testing machine (UTM) (see Figure 7). After the testing, static MOE and MOR were calculated according to the methods included in AS/NZS 4063.1:2010 [].
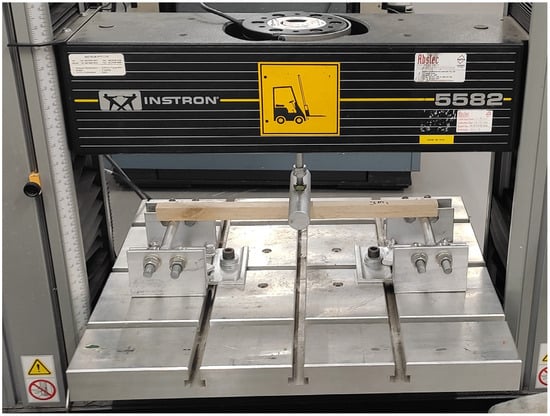
Figure 7.
Destructive testing of the small clear samples of cross-section size 20 × 20 mm in the laboratory based on AS/NZS 4063.1:2010 [].
2.5. Data Analysis and Statistical Methods
The results of the test were analysed using the IBM SPSS Statistics 29 software. Based on the correlation and regression analysis, the relationship between predicted stiffness (DMOE) and actual stiffness (MOE) was investigated. Additionally, the relationship between AWV, density, and DMOE was examined to determine the effects of density and AWV on DMOE values in terms of sample location in the log. In the final analysis, the overvalue/undervalue between the DMOE and static MOE as a percentage was examined.
3. Results
The average values of the AWV (km/s), density (kg/m3), DMOE (GPa), static MOE (GPa), and MOR (MPa) of Site 1 and 2 logs based on the recovered small clear samples are summarised in Table 1 and Table 2, respectively.

Table 1.
Site 1—AWV, average green density, average basic density, DMOE, static MOE, and MOR of logs.

Table 2.
Site 2—AWV, average green density, average basic density, DMOE, static MOE, and MOR of logs.
Table 1 summaries the mechanical characteristics of the Site 1 logs and samples. The AWV ranged from 3.47 to 4.32 km/s, with corresponding green density between 769 and 571 kg/m3, which is lower than that of Site 2 logs. The basic densities between 532.76 and 661.14 kg/m3 are higher than those of Site 2 logs. A general trend was observed in which higher AWV and basic density were associated with increased DMOE values, ranging from 5.87 to 12.34 GPa. Notably, log 2 exhibited the highest AWV (4.32 km/s), basic density (661 kg/m3), DMOE (12.34 GPa), static MOE (12.82 GPa), and MOR (92.39 MPa), indicating superior mechanical performance. Conversely, log 3 recorded the lowest AWV (3.47 km/s) and basic density (487 kg/m3), corresponding to the lowest DMOE (5.87 GPa). While the static MOE values generally followed the same trend as DMOE, some deviations were evident, such as in log 1, which displayed a lower static MOE (7.82 GPa) than its DMOE would suggest.
In Table 2, five log sources from Site 2, characterised by higher green densities ranging from 996 to 1033 kg/m3 and low basic density ranging from 437 to 525 kg/m3, were analysed to assess their average acoustic velocity and mechanical behaviour. The AWV varied from 2.99 to 3.41 km/s, notably lower than in the first data set, despite the higher densities. Correspondingly, the DMOE ranged from 8.95 to 11.58 GPa, while the static MOE varied between 7.18 and 9.71 GPa. Interestingly, the highest DMOE (11.58 GPa) was observed for log 5, which had the highest AWV (3.41 km/s) but the lowest green density (996 kg/m3) within this group, highlighting that AWV may play a stronger role than density in influencing DMOE. In contrast, log 2, with the highest density (1033 kg/m3), exhibited one of the lowest mechanical values across DMOE, static MOE, and MOR, suggesting that high green density alone does not guarantee higher mechanical performance. The MOR values were relatively close, ranging from 53.14 to 62.95 MPa, with log 1 outperforming others despite having a moderate AWV. In both sites, AWV showed similar trends: the higher the AWV, the higher the DMOE and static MOE in the green and dry condition.
3.1. Static Bending Test Findings
The results in Figure 8 the first boxplot, which compares static MOE, reveals that samples from Site 1 consistently outperform those from Site 2 across all sample locations.
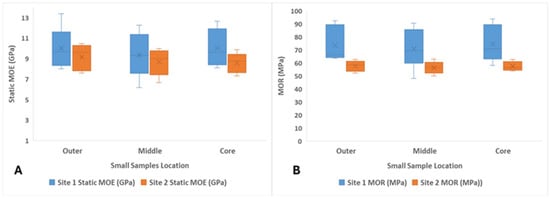
Figure 8.
Comparison between Site 1 and 2 small clear sample static bending test results (GPa) based on the sample location. (A) shows the comparison between Site 1 and 2 small sample static MOE results; (B) shows the comparison between Site 1 and 2 small sample MOR results.
For Site 2, outer and middle location samples showed higher static MOE values (with medians above 9 GPa), gradually decreasing towards the core direction. Site 1 samples showed the highest and more clustered static MOE values, with medians close to 10.5 GPa or above across sample locations. The wider spread and higher data range in Site 1 indicate more variability in mechanical performance, but also a greater presence of higher-quality wood with high stiffness.
Similarly, the second boxplot illustrates that MOR values for Site 1 are significantly higher than those from Site 2, regardless of location, and showed median MOR values close to or exceeding 80 MPa, whereas Site 2 values remain clustered around 60 MPa or below. The trend of decreasing strength from outer to core location is more evident in Site 1, reflecting typical radial variations in wood properties in dry condition of samples. Site 2 samples not only show lower median values but also exhibit less variability, potentially reflecting more uniform but lower-quality wood characteristics since MC over the fibre saturation point makes little difference to MOE/MOR.
Overall, the results demonstrate that Site 1 yields superior mechanical performance in both stiffness and strength across all locations of the log.
3.2. Non-Destructive Testing (NDT) Findings
In the comparison between NDE DMOE results of Sites 1 and 2 shown in Figure 9, the Site 1 samples consistently demonstrate higher DMOE values compared to Site 2.
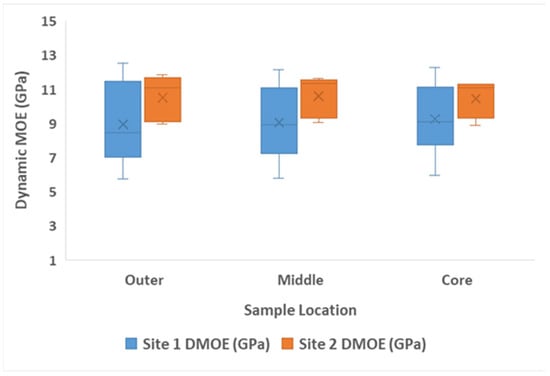
Figure 9.
Comparison between Site 1 and 2 small clear sample DMOE based on the sample location inside the log.
The median DMOE values for Site 1 are notably greater with high variability across all locations of samples, suggesting superior DMOE and material performance. In contrast, Site 2 samples display relatively lower and more uniform DMOE values, suggesting more consistent but mechanically inferior wood. A decreasing trend in DMOE from the outer to core location is observed in both sites, reinforcing the influence of radial position on DMOE results. These differences suggest significant effects of site-specific growing conditions on wood mechanical behaviour despite the moisture difference in the samples.
4. Discussion
4.1. Correlation Between MOR and Static MOE of the Logs
The results in Figure 10 show a consistently positive relationship between static MOE and MOR across all samples, though the strength of this correlation varies between logs.
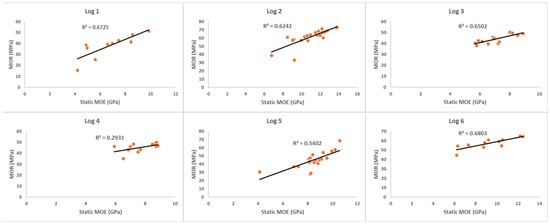
Figure 10.
Correlation between static MOE and MOR of Site 1 logs. The static MOE and MOR of small samples are shown on the X-axis and Y-axis, respectively.
Log 6 demonstrates a strong linear correlation (R2 = 0.68), indicating that as static MOE increases, MOR also increases proportionally. The Site 1 logs showed a correlation range from 0.29 to 0.68, which supports the reliability of static MOE as a predictor of MOR in these cases. Further validation across more logs and sites could strengthen the predictive robustness of this relationship.
The results in Figure 11 show that, among the five logs, log 2 suggests the strongest positive correlation (R2 = 0.7874), indicating a strong linear relationship where an increase in static MOE is associated with a corresponding rise in MOR. In contrast, logs 4 and 5 show weak correlations, with R2 values of 0.2262 and 0.074, respectively. These low R2 values suggest considerable variability and indicate that, for these logs, static MOE is not a reliable predictor of MOR.
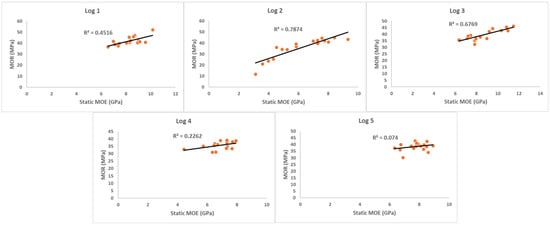
Figure 11.
Correlation between static MOE and MOR of Site 2 logs. The static MOE and MOR of small samples are shown on the X-axis and Y-axis, respectively.
This difference in the static MOE values came with different factors apart from the age, such as site, presence of SRFs, environmental factors, and other tree-related factors []. Similar correlation results are observed, with a correlation of 0.92 between MOR and static MOE for hardwood []. Overall, the analysis suggests that while static MOE can be a valuable indicator of MOR for some logs, its predictive reliability is not consistent across all samples.
4.2. Correlation Between DMOE and Static MOE of Logs
The results in Figure 12 show a correlation between static MOE and DMOE of Site 1 logs based on the small clear samples data; the R2 values across all logs are relatively low, indicating weak correlations between static and DMOE at the individual log level.
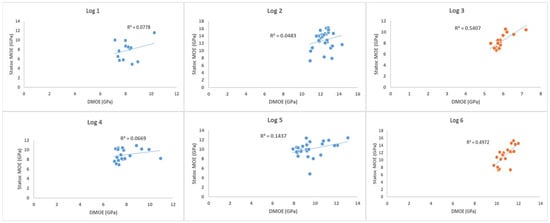
Figure 12.
Correlation between static MOE and DMOE of Site 1 logs. The DMOE of the log and the static MOE of small samples are shown on the X-axis and Y-axis, respectively.
Logs 3 and 6 exhibit the strongest correlations, with an R2 of 0.5407 and 0.4972, suggesting a moderate positive relationship between DMOE and static MOE. This indicates that log 3 and 6 DMOE could somewhat reliably predict static MOE. In contrast, other logs showed a much weaker correlation (R2 ranging from 0.048 to 0.1437), implying that for these logs, DMOE has limited predictive capability for estimating static MOE based on the DMOE of the log.
The results in Figure 13 show the correlation between static MOE and DMOE of Site 2 logs based on the small clear sample data. Logs 1, 2, and 3 demonstrate very low R2 values of 0.2189, 0.018, and 0.0488, respectively, indicating negligible correlation between DMOE and static MOE. These weak relationships suggest that NDE may not effectively predict static stiffness for these logs by averaging the data based on small clear samples. Log 4 shows a slightly improved R2 of 0.1507 but still falls within a low correlation range, indicating limited reliability. Only log 5 exhibits a moderate correlation, with an R2 value of 0.5485, implying a reasonably consistent linear relationship.
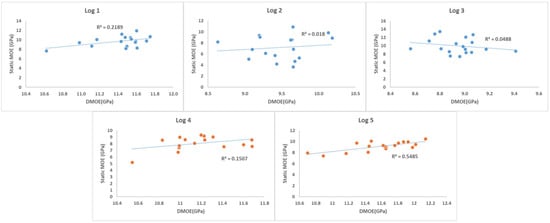
Figure 13.
Correlation between static MOE and DMOE of Site 2 logs. The DMOE of the log and the static MOE of small samples are shown on the X-axis and Y-axis, respectively.
4.3. Correlation Between DMOE and Static MOE of Small Clear Samples Based on the Sample Location in the Log
Using the location of small clear samples inside the log, the correlation between small clear sample DMOE and static MOE is shown in Figure 14. In the outer location, both sites exhibit relatively low R2 values, with Site 1 showing a slightly higher correlation than Site 2.
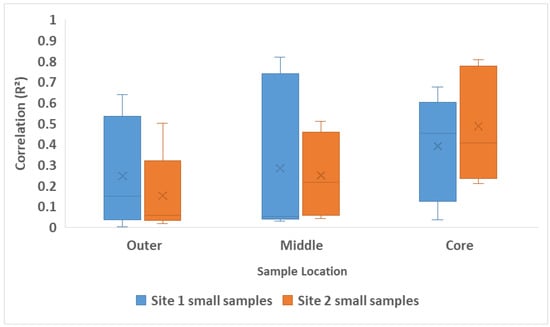
Figure 14.
Correlation between Site 1 and 2 small clear sample DMOE (GPa) and static MOE (GPa) based on the sample location inside the log.
Site 1 also demonstrates a broader variability, indicating inconsistencies in the relationship between DMOE and static MOE. Site 2 samples, while slightly more consistent, reflect a lower predictive capability, with R2 values clustering closer to the bottom end of the scale (around 0.1 to 0.4).
For the middle location sample, both sites continue to show moderate-to-high correlations. However, Site 1 once again outperforms Site 2 with a higher median R2 value and a wider range extending up to approximately 0.85. The broader spread in Site 1 suggests variability among individual samples but also indicates the potential for strong correlations. In contrast, Site 2 exhibits a narrower and lower distribution.
A significant shift is observed in the core samples, where both sites demonstrate strong correlations with wide range between DMOE and static MOE. Site 2 shows very high R2 values, ranging from around 0.3 to 0.75, indicating a highly reliable predictive relationship at this site. Site 1 also showed an improved performance in the core location, with moderate-to-high R2 values. The consistently stronger correlation observed in the core samples across both sites suggests that the core location samples may exhibit more uniform mechanical behaviour, enhancing the reliability of DMOE for the prediction of static MOE. In a previous study of E. nitens sawn boards, a similar trend was observed where the AWV-based DMOE correlation with static MOE was 0.74, indicating a high correlation []. The genetic variation observed in the plantation-grown E. nitens trees is influenced by site, age, tree, and environmental factors, which affect density, MFA, and stiffness due to both within and between-site effects [,]. In the studies, it is shown that ultrasonic DMOE has a high correlation (R2 = 0.704) with core samples in longitudinal directions []. Also, the impact of the test direction on the growth rings is very important and a better method for understanding the correlation [].
4.4. Correlation Between DMOE and MOR of Small Samples Based on Sample Location in the Log
The results in Figure 15 indicate variability in the strength of correlation between DMOE and MOR of small clear samples across both sites, based on the location of samples in the log.
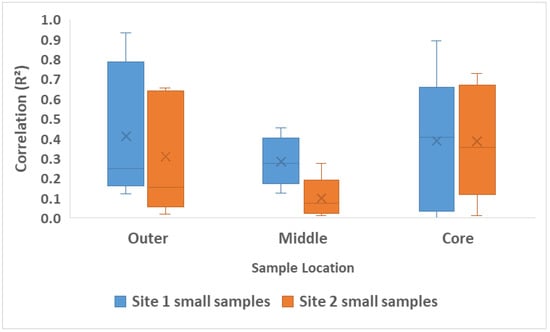
Figure 15.
Correlation between Site 1 and 2 small clear sample DMOE (GPa) and MOR (MPa) based on the location of samples inside the log.
For the outer samples, Site 1 displays a higher median R2 value and high variability compared to Site 2, suggesting a more consistent and a strong relationship between DMOE and MOR in that location for Site 1. This may indicate inconsistencies in the mechanical behaviour of the outer location samples. In contrast, middle samples from both sites show weaker correlations, with Site 2 exhibiting a narrower range of R2 values.
Interestingly, core samples from both sites show the highest average correlation values like outer location samples, with Site 1 exhibiting slightly greater variability but comparable median performance to Site 2. This indicates that DMOE can serve as a reasonably strong predictor of MOR in the outer and core location, where the material properties are often more uniform.
In conclusion, while correlation strengths vary, the results suggest that DMOE shows the highest predictive reliability for MOR in the outer and core region, particularly for Site 1. The outer location samples offer strong potential, especially for Site 1, whereas the middle zone appears least reliable for both sites. These findings are valuable for refining NDT strategies by emphasising radial position as a key variable in predictive modelling of wood strength properties. In the literature, a high correlation of 0.94 was observed between DMOE and MOR for tropical African hardwood solid lumber and 0.94 for finger-jointed lumber [].
4.5. Comparative Analysis of DMOE and Static MOE
A comparative analysis of DMOE against static MOE across two log sourcing sites highlights the tendency of NDE methods to systematically overestimate the stiffness properties of logs, as shown in Figure 16.
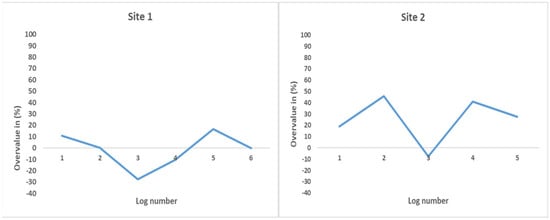
Figure 16.
Comparison between Sites 1 and 2 log static MOE overvalue (%) by DMOE results.
At Site 1, the overestimation of DMOE relative to static MOE exhibited substantial variability across six logs, with overvalue/undervalue percentages ranging from −27.65% to 16.46%. The observed negative deviation in logs 3 and 4 indicates a rare case of underestimation by the NDE method, which deviates from the general trend. Logs 3 and 5 recorded the highest overvaluation/undervaluation, at around −27.65% and 16.46%, respectively, followed by a gradual increase in overvaluation after log 4. This progression suggests that while DMOE generally over- or underpredicts stiffness, the magnitude of this discrepancy is not uniform and is influenced by log-specific properties such as the density distribution, MC, and age of the logs. In a previous study, 18.3% overestimation and 25% underestimation of the static MOE results over DMOE (AWV-based) results for E. nitens sawn boards were reported, with a total of 43.3% difference between the two []. Also, a 22–32% difference was reported for North American hardwoods [] and 29% for E. delgatensis []. The study showed 15% overestimation of DMOE (resonance-flexure-based) over the static MOE of clear wood samples, and 14% for decayed Tasmanian oak wood samples [].
In contrast, Site 2 demonstrated more pronounced and continuous fluctuations in DMOE overvaluation, with values ranging from −7.51% to 45.75%. The highest overestimation occurred in logs 2 and 4, with values exceeding 40%. The observed negative deviation in log 3 indicates a rare case of underestimation by the NDE method, which deviates from the general trend by −7.51%. In studies, overestimation of static MOE by DMOE using longitudinal resonance methods was observed at 31.05% and by flexural resonance methods at nearly 20.6% [], which is similar to the results in this study and supports the results. In contrast, the use of the ultrasound method resulted in 17 to 20% overestimation between DMOE and static MOE []. The magnitude and variability of the overestimation observed at Site 2 indicate a more substantial divergence between DMOE and static MOE, implying potential site-specific differences in wood characteristics or moisture content.
The evaluation of DMOE overestimation relative to static MOE for small clear samples from Site 1 reveals a minimal but consistent influence of location within the log cross-section. The overvalue percentages for the outer, middle, and core locations remain within a narrow range of approximately −7% to 5.34%, indicating relatively stable performance of the DMOE estimation method across radial positions as compared to average log-based data. Specifically, the outer samples show an overvaluation close to −7%, with a slight incremental increase observed toward the middle location, which reaches around 5.34%. In contrast, in Site 2, similar kinds of trends were observed: the overvalue ranges from approximately 19.81% in the outer location to around 28.35 in the core, followed by a slight incline near 27.82% in the middle location.
The results in Figure 17 suggest that the DMOE slightly overpredicts stiffness more in the core and middle locations samples of the log compared to the outer location. However, the relatively small variation in overestimation across locations implies that NDE testing remains reasonably robust across different radial positions within small clear samples, at least under controlled sample conditions. Nevertheless, the consistent overvaluation across all locations highlights the inherent limitations of DMOE as a standalone predictor of static mechanical properties. The DMOE by longitudinal vibration test of plantation-grown E. nitens sawn boards from the 19-year-old stand showed overestimation of static MOE by 8.7%, while the transverse vibration mean stiffness was 8.9% lower than the static MOE []. Also in the studies, it was observed that DMOE overestimates the static MOE by approximately 20% for testing the plantation-grown E. nitens recovered veneer of 6-foot-long grain [].
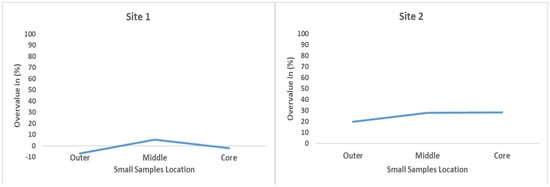
Figure 17.
Comparison between Site 1 and 2 small clear sample static MOE overvalue (%) by DMOE results based on the location of samples in the log.
The results in Figure 18 indicate a noticeable difference in the degree of overestimation between Sites 1 and 2. At Site 1, DMOE overvalues static MOE by approximately 10.81%, whereas at Site 2, the overvalue increases to about 24.66%. This upward trend suggests that the discrepancy between NDE and static testing methods results from site-specific factors, age, moisture content, density variation, or environmental conditions.
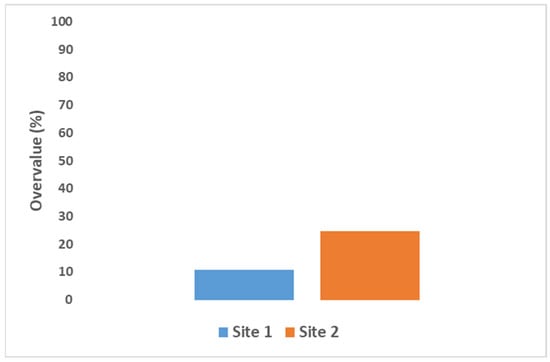
Figure 18.
Comparison between Site 1 and 2 small clear sample static MOE overvalue (%) by DMOE results.
5. Conclusions
This study assessed the mechanical and physical properties of Eucalyptus nitens logs and small clear samples from two Tasmanian harvesting sites using both non-destructive and destructive testing methods. Logs from Site 1 exhibited superior performance, with higher acoustic wave velocity (AWV), dynamic modulus of elasticity (DMOE), static MOE, and modulus of rupture (MOR), as well as stronger and more consistent correlations among these parameters. DMOE systematically overestimated static MOE by 10.81% at Site 1 and 24.66% at Site 2, with variation observed across radial positions. Core samples demonstrated the strongest correlations between DMOE, static MOE, and MOR, indicating that NDE is more reliable at this location. In contrast, Site 2 produced logs with more uniform yet generally lower mechanical properties and weaker correlations.
In conclusion, the findings confirm that AWV-based NDE methods provide a simple, rapid, and reliable means of assessing wood stiffness without damaging the material. Moreover, consideration of radial sample location enhances the interpretation of NDE–mechanical property relationships. Overall, Site 1 outperformed Site 2 in mechanical strength, while the greater NDE overestimation at Site 2 likely reflects differences in age, moisture content, and density.
Author Contributions
N.S.S.: Conceptualisation, methodology, validation, formal analysis, data curation, writing—original draft preparation, and visualisation. G.N.: Conceptualisation, methodology, validation, writing—review and editing, resources, supervision, project administration, and funding acquisition. N.K.: Conceptualisation, methodology, validation, writing—review and editing, resources, supervision, and project administration. A.T.: Conceptualisation, methodology, validation, writing—review and editing, and supervision. All authors have read and agreed to the published version of the manuscript.
Funding
This research was funded by the Regional Research Collaboration (RRC) program with support from the Centre for Sustainable Architecture with Wood (CSAW) and the School of Architecture and Design, University of Tasmania.
Institutional Review Board Statement
Not applicable.
Informed Consent Statement
Not applicable.
Data Availability Statement
Data set available on request from the authors.
Acknowledgments
The authors acknowledge support from the Australian Government’s Regional Research Collaboration Program, and the Centre for Sustainable Architecture with Wood (CSAW) in the School of Architecture and Design, University of Tasmania. The authors appreciate the technical support and sample preparation from the CSAW, Island Speciality Timber, and the University of Tasmania School of Architecture and Design. The authors highly acknowledge industry partners Forico Future Fibre Private Limited and Neville Smith Forest Products Private Limited.
Conflicts of Interest
The authors report no conflicts of interest. The funding bodies were not involved in the study design, data collection, analysis, or the decision to publish the findings.
Abbreviations
The following abbreviations are used in this manuscript:
| ABARES | Australian Bureau of Agricultural and Resource Economics and Sciences |
| AWV | Acoustic Wave Velocity |
| DMOE | Dynamic Modulus of Elasticity |
| LVL | Laminated Veneer Lumber |
| MLR | Modulus Linear Regression |
| MOE | Modulus of Elasticity |
| MOR | Modulus of Rupture |
| NDE | Non-Destructive Evaluation |
| NDT | Non-Destructive Testing |
| SRFs | Strength-Reducing Features |
| SWV | Stress Wave Velocity |
| MFA | Microfibril Angle |
| PD | Penetration Depth |
| VSG | Visual Stress Grading |
| AS | Australian Standard |
| SED | Small End Diameter |
| MC | Moisture Content |
| UTM | Universal Testing Machine |
References
- ABARES. Australian Plantation Statistics 2022–23 Update; Australian Goverment Department of Agriculture, Fisheries and Forestry: Canberra, Australia, 2024.
- Hou, J.; Taoum, A.; Nolan, G.; Kotlarewski, N. Study of the relationship between flatwise and edgewise modulus of elasticity of plantation fibre-managed E. nitens sawn boards. Constr. Build. Mater. 2022, 349, 128774. [Google Scholar] [CrossRef]
- Derikvand, M.; Kotlarewski, N.; Lee, M.; Jiao, H.; Chan, A.; Nolan, G. Visual stress grading of fibre-managed plantation Eucalypt timber for structural building applications. Constr. Build. Mater. 2018, 167, 688–699. [Google Scholar] [CrossRef]
- Balasso, M.; Hunt, M.; Jacobs, A.; O’reilly-Wapstra, J. Development of non-destructive-testing based selection and grading strategies for plantation Eucalyptus nitens sawn boards. Forests 2021, 12, 343. [Google Scholar] [CrossRef]
- Walker, J.C. Primary Wood Processing: Principles and Practice; Springer Science & Business Media: Berlin/Heidelberg, Germany, 2006. [Google Scholar]
- Rayner, T.; Grams, W.; Scheinman, E. An automated log grading system based on computed tomography. In Proceedings of the First International Precision Forestry Cooperative Symposium, Seattle, WA, USA, 17–20 June 2001. [Google Scholar]
- Palma, P.; Steiger, R. Structural health monitoring of timber structures–Review of available methods and case studies. Constr. Build. Mater. 2020, 248, 118528. [Google Scholar] [CrossRef]
- Taskhiri, M.S.; Hafezi, M.H.; Harle, R.; Williams, D.; Kundu, T.; Turner, P. Ultrasonic and thermal testing to non-destructively identify internal defects in plantation eucalypts. Comput. Electron. Agric. 2020, 173, 105396. [Google Scholar] [CrossRef]
- Simic, K.; Gendvilas, V.; O’rEilly, C.; Harte, A.M. Predicting structural timber grade-determining properties using acoustic and density measurements on young Sitka spruce trees and logs. Holzforschung 2019, 73, 139–149. [Google Scholar] [CrossRef]
- Blackburn, D.; Vega, M.; Nolan, G. Using acoustic wave velocity to select fibre-managed plantation Eucalyptus nitens logs for laminated veneer lumber products. South. For. 2019, 81, 223–234. [Google Scholar] [CrossRef]
- Farrell, R.; Innes, T.C.; Harwood, C.E. Sorting Eucalyptus nitens plantation logs using acoustic wave velocity. Aust. For. 2012, 75, 22–30. [Google Scholar] [CrossRef]
- Shakti Chauhan, S.C.; Anil Sethy, A.S. Differences in dynamic modulus of elasticity determined by three vibration methods and their relationship with static modulus of elasticity. Maderas-Cienc. Tecnol. 2016, 18, 373–382. [Google Scholar]
- Opazo-Vega, A.; Rosales-Garcés, V.; Oyarzo-Vera, C. Non-destructive assessment of the dynamic elasticity modulus of eucalyptus nitens timber boards. Materials 2021, 14, 269. [Google Scholar] [CrossRef]
- Chauhan, S.; Walker, J. Variations in acoustic velocity and density with age, and their interrelationships in radiata pine. For. Ecol. Manag. 2006, 229, 388–394. [Google Scholar] [CrossRef]
- Kube, P.D.; Raymond, C.A.; Banham, P.W. Genetic parameters for diameter, basic density, cellulose content and fibre properties for Eucalyptus nitens. For. Genet. 2001, 8, 285–294. [Google Scholar]
- Balasso, M.; Hunt, M.; Jacobs, A.; O’REilly-Wapstra, J. Characterisation of wood quality of Eucalyptus nitens plantations and predictive models of density and stiffness with site and tree characteristics. For. Ecol. Manag. 2021, 491, 118992. [Google Scholar] [CrossRef]
- Gendvilas, V.; Neyland, M.; Rocha-Sepúlveda, M.F.; Downes, G.M.; Hunt, M.; Jacobs, A.; Williams, D.; Vega, M.; O’rEilly-Wapstra, J. Effects of thinning on the longitudinal and radial variation in wood properties of Eucalyptus nitens. Forestry 2022, 95, 504–517. [Google Scholar] [CrossRef]
- Wimmer, R.; Downes, G.; Evans, R. Temporal variation of microfibril angle in Eucalyptus nitens grown in different irrigation regimes. Tree Physiol. 2002, 22, 449–457. [Google Scholar] [CrossRef]
- Raymond, C.A.; Schimleck, L.R.; Muneri, A.; Michell, A.J. Nondestructive sampling of Eucalyptus globulus and E. nitens for wood properties. III. Predicted pulp yield using near infrared reflectance analysis. Wood Sci. Technol. 2001, 35, 203–215. [Google Scholar] [CrossRef]
- AS/NZS 4063.1; Characterisation of Structural Timber: Part 1. TestMethods. Standards Australia: Sydney, NSW, Australia, 2010.
- AS/NZS 1080.1; Timber—Methods of Test Moisture Content. Standards Australia: Sydney, NSW, Australia, 2012.
- Karlinasari, L.; Wahyuna, M.; Nugroho, N. Non-destructive ultrasonic testing method for determining bending strength properties of Gmelina wood (Gmelina arborea). J. Trop. For. Sci. 2008, 20, 99–104. [Google Scholar]
- Ettelaei, A.; Taoum, A.; Nolan, G. Assessment of different measurement methods/techniques in predicting modulus of elasticity of plantation Eucalyptus nitens timber for structural purposes. Forests 2022, 13, 607. [Google Scholar] [CrossRef]
- Blackburn, D.; Hamilton, M.; Harwood, C.; Innes, T.; Potts, B.; Williams, D. Stiffness and checking of Eucalyptus nitens sawn boards: Genetic variation and potential for genetic improvement. Tree Genet. Genomes 2010, 6, 757–765. [Google Scholar] [CrossRef]
- Vega Rivero, M. Characterisation of Eucalyptus nitens Plantations for Veneer Production. Ph.D. Thesis, University of Tasmania, Hobart, TAS, Australia, 2016. [Google Scholar]
- Bucur, V. An ultrasonic method for measuring the elastic constants of wood increment cores bored from living trees. Ultrasonics 1983, 21, 116–126. [Google Scholar] [CrossRef]
- Jaskowska-Lemańska, J.; Wałach, D. Impact of the direction of non-destructive test with respect to the annual growth rings of pine wood. Procedia Eng. 2016, 161, 925–930. [Google Scholar] [CrossRef]
- Ayarkwa, J.; Hirashima, Y.; Sasaki, Y. Predicting modulus of rupture of solid and finger-jointed tropical African hardwoods using longitudinal vibration. For. Prod. J. 2001, 51, 85–92. [Google Scholar]
- Smulski, S.J. Relationship of stress wave-and static bending-determined properties of four northeastern hardwoods. Wood Fiber Sci. 1991, 23, 44–57. [Google Scholar]
- Ilic, J. Relationship among the dynamic and static elastic properties of air-dry Eucalyptus delegatensis R. Baker. Holz Roh-Und Werkst. 2001, 59, 169–175. [Google Scholar] [CrossRef]
- Yang, J.-L.; Ilic, J.; Wardlaw, T. Relationships between static and dynamic modulus of elasticity for a mixture of clear and decayed eucalypt wood. Aust. For. 2003, 66, 193–196. [Google Scholar] [CrossRef]
- Baar, J.; Tippner, J.; Rademacher, P. Prediction of mechanical properties-modulus of rupture and modulus of elasticity-of five tropical species by nondestructive methods. Maderas. Cienc. Tecnol. 2015, 17, 239–252. [Google Scholar]
- De Oliveira, F.G.R.; De Campos, J.A.O.; Pletz, E.; Sales, A. Assessment of mechanical properties of wood using an ultrasonic technique. In Proceedings of the 13th International Symposium on Non-Destructive Testing of Wood, Berkeley, CA, USA, 19–21 August 2002; University of California, Berkeley Campus: Berkeley, CA, USA, 2002. [Google Scholar]
Disclaimer/Publisher’s Note: The statements, opinions and data contained in all publications are solely those of the individual author(s) and contributor(s) and not of MDPI and/or the editor(s). MDPI and/or the editor(s) disclaim responsibility for any injury to people or property resulting from any ideas, methods, instructions or products referred to in the content. |
© 2025 by the authors. Licensee MDPI, Basel, Switzerland. This article is an open access article distributed under the terms and conditions of the Creative Commons Attribution (CC BY) license (https://creativecommons.org/licenses/by/4.0/).