Abstract
Three-dimensional ground-penetrating radar can quickly visualize the internal condition of the road; however, it faces challenges such as data splicing difficulties and image noise interference. Scanning antenna and lane size differences, as well as equipment and environmental interference, make the radar image difficult to interpret, which affects disease identification accuracy. For this reason, this paper focuses on road radar image splicing and noise reduction. The primary research includes the following: (1) We make use of backward projection imaging algorithms to visualize the internal information of the road, combined with a high-precision positioning system, splicing of multi-lane data, and the use of bilinear interpolation algorithms to make the three-dimensional radar data uniformly distributed. (2) Aiming at the defects of the low computational efficiency of the traditional adaptive median filter sliding window, a Deep Q-learning algorithm is introduced to construct a reward and punishment mechanism, and the feedback reward function quickly determines the filter window size. The results show that the method is outstanding in improving the peak signal-to-noise ratio, compared with the traditional algorithm, improving the denoising performance by 2–7 times. It effectively suppresses multiple noise types while precisely preserving fine details such as 0.1–0.5 mm microcrack edges, significantly enhancing image clarity. After processing, images were automatically recognized using YOLOv8x. The detection rate for transverse cracks in images improved significantly from being undetectable in mixed noise and original images to exceeding 90% in damage detection. This effectively validates the critical role of denoising in enhancing the automatic interpretation capability of internal road cracks.
1. Introduction
In recent years, with the rapid development of China’s highway network, public transportation has become increasingly facilitated. Nevertheless, under the influence of heavy loads and environmental factors, various hidden defects such as cracks and loosening have developed severely within road structures [1,2]. Traditional road damage detection methods typically rely on visual inspection or core drilling, which fail to assess the development of hidden defects within road structures directly. Additionally, these methods are characterized by low detection accuracy, high costs, and significant damage to the integrity of road structures, making it challenging to comprehensively evaluate the internal structural condition of roads [3]. As a non-destructive testing technology, three-dimensional ground-penetrating radar (3D GPR) can accurately detect hidden defects within road structures over large areas and has been widely applied in the detection of internal road damage [4,5].
Ground-penetrating radar (GPR) emits high-frequency electromagnetic waves and utilizes the reflection and transmission characteristics of electromagnetic waves at interfaces between media with different dielectric properties. Reflected wave signals are received and processed (including filtering and gain adjustment), and frequency-domain signals are converted into time-domain signals. The arrival time and amplitude intensity of electromagnetic waves are recorded, ultimately generating two-dimensional or three-dimensional ground-penetrating radar images of the underground structure of roads [6,7]. For instance, in longitudinal section GPR images, the interfaces between different structural layers of the road surface appear as nearly horizontal, continuous, and strongly amplified in-phase axes. However, at locations with latent defects in the road surface structural layers, characteristics of strongly amplified and abnormal reflection signals are observed. These image characteristics serve as key reference criteria for identifying and distinguishing different types of latent defects [8]. Research on the automatic identification of latent defects in structural layers or structural reflection wave characteristics in pavement GPR images using deep learning technology is growing. Intelligent recognition algorithm models have raised the quality requirements for GPR base images of different latent defects [9,10,11,12,13].
However, during the detection process, owing to discrepancies between the scanning antenna and the actual lane dimensions, full coverage of the road cannot be achieved via a single scan. Unlike visible light images, electromagnetic wave signals are susceptible to noise during the echo process due to interference from internal receiver equipment and external environmental factors, resulting in distortion of the target signal [14,15]. Such interference hinders the precise identification of structural features, thereby reducing the efficiency of subsequent identification [16]. Consequently, conducting image denoising preprocessing on 3D-GPR images of the road is particularly crucial for improving image quality and enhancing the prominence of abnormal areas across various scenarios, which in turn facilitates subsequent detection tasks [17]. In Huang [18] et al.’s study, to enhance multi-lane GPR data stitching accuracy, a trajectory smoothing method based on azimuth-angle analysis is proposed to mitigate GPS signal drift caused by urban building occlusion, reducing jump points and improving spatial alignment reliability.
In recent years, ground-penetrating radar (GPR) image denoising has remained a significant research focus. Several scholars have contributed to enhancing the quality and interpretability of GPR images. Song [19] utilized GPR to measure the thickness and detect defects in the expanded and renovated road surface. By integrating the signal characteristics of 3D GPR with the Crossed Coincident Mid-Point method, clear images of the road structure were obtained, enabling accurate determination of the locations of internal road defects. Wu et al. [20] tackled the issue of GPR signals being prone to noise interference by proposing a signal processing method based on a wavelet adaptive threshold algorithm. Adaptive quantization was achieved by improving the selection method and threshold function of the wavelet threshold, as well as by determining the threshold using different subband lengths. Luo et al. [21] proposed a multi-scale convolutional autoencoder that combines wavelet transform and multi-wavelet transform for denoising GPR B-scan images. They assessed the denoising effectiveness using metrics such as peak signal-to-noise ratio (PSNR); however, this method only addresses random noise and fails to consider the removal of clutter caused by multi-target interference. Yahya et al. [22] proposed a method based on adaptive filtering technology to replace the single threshold filtering used in the traditional three-dimensional filtering algorithm. This method achieves optimal noise reduction performance while preserving the spatial frequency details of images. Nevertheless, it involves excessive computational complexity and cannot be processed in real time.
In recent years, with the rapid development of deep learning technology [23], complex relationships between different image qualities can be trained using deep learning to identify noise and achieve image denoising effects quickly. Zhou [24] proposed a denoising method based on multi-noise sub-supervision learning, which constructs supervision data using various types of noise to enhance the robustness and detail processing capabilities of the denoising network, thereby significantly improving the clarity of GPR images and the prominence of anomaly region features. Feng et al. [25] proposed a novel network architecture for convolutional denoising autoencoders to address various issues in GPR noise processing, including the size of the local receptive field and vanishing gradient problems, which significantly enhances noise attenuation performance. In denoising models, overfitting frequently occurs during training, leading to a significant decline in denoising performance when the type of test noise changes slightly [26]. In addition to the aforementioned techniques, researchers have explored numerous other methods to reduce noise interference in GPR images, such as maximum likelihood estimation [27], Markov models [28], Kalman filters [29], and wavelet transforms [30]. These approaches typically rely on the hyperbolic characteristics of targets but often require prior knowledge of target information. However, since road infrastructure constitutes concealed engineering, such target information is frequently inaccessible.
To achieve rapid and non-destructive interpretation and extraction of cracks in radar images of road structures, improve the clarity of radar images, enhance the visual effects of images, and facilitate subsequent computer processing and analysis, this study employs a high-precision positioning system combined with latitude and longitude information from the central lane to stitch multiple data streams. Interpolation algorithms are then utilized to reconstruct complete road information. By integrating traditional adaptive median filtering algorithms with Deep Q-learning (DQL) algorithms, a reward-punishment mechanism is established to determine the optimal sliding window size rapidly. This study will compare the noise reduction effects of different denoising algorithms on radar image quality to identify the optimal image denoising method.
2. Radar Image Mosaicking
2.1. Radar Imaging Model
In comparison to conventional visible light imaging techniques, radar imaging systems are less susceptible to interference from external light sources. Additionally, electromagnetic waves have strong penetrating properties, allowing them to pass through all layers of the road surface and form images of targets buried underground. When the system parameters remain unchanged, choosing a suitable radar imaging method holds crucial significance. Standard radar imaging algorithms include time-domain imaging, frequency-domain imaging, and analytical imaging algorithms. Among these, time-domain imaging exhibits better algorithm stability but involves significant computational complexity due to the extensive superposition of frequency shifts. Frequency-domain imaging algorithms utilize the Fast Fourier Transform (FFT) and butterfly operations to reduce the computational load, yet they impose stringent requirements on antenna arrays. Analytical imaging algorithms employ greedy search and Bayesian search to reverse-engineer scene information, thus generating imaging results. Although this approach can improve imaging quality when the sample quantity is limited, it still suffers from high computational load and stability issues. The implementation process of the method described in this paper is illustrated in Figure 1.
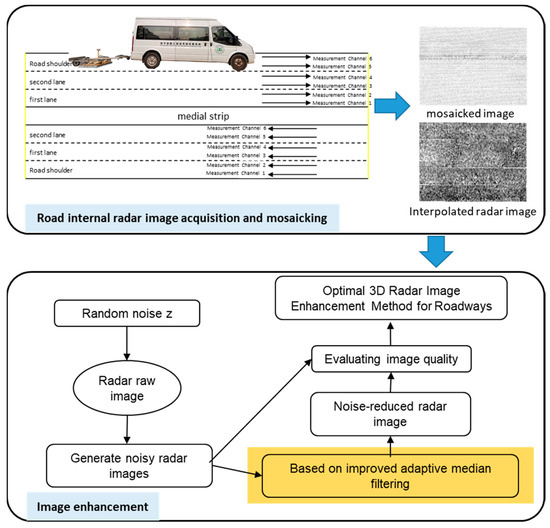
Figure 1.
Radar image Mosaicking and noise reduction.
Back projection (BP) imaging algorithms are a category of typical near-field imaging algorithms. They are capable of precisely compensating for the echoes produced when electromagnetic waves refract on the surfaces of various media during radar detection. The BP method is characterized by a straightforward processing procedure that involves minimal approximation operations. Moreover, it does not impose special demands on the arrangement of array elements, which is why it has been widely utilized in radar imaging technology.
The operational principle of the BP imaging algorithm involves backward propagation of the received echo signals and their projection onto the imaging area. In the course of imaging, the imaging area is gridded. Then, the time interval between the transmitted and received signals is calculated to ascertain the amplitude and phase of the echo distance of the corresponding channel at the pixel points in the image. By cycling through all channels and pixel coordinates and superimposing the findings, the imaging scene is formed, as shown in Figure 2. The X-axis represents the ground plane, with the upper layer being air and the lower layer being the road structure layer.
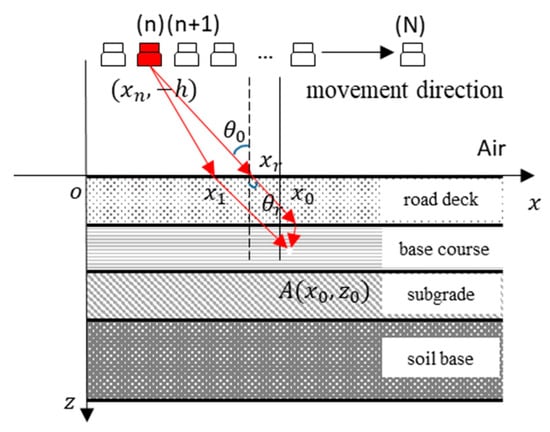
Figure 2.
GPR Detection Principle.
When the electromagnetic waves sent out by the nth antenna refract at the point (, 0), considering that the transmitting and receiving antennas of the GPR are positioned very close to each other, the round-trip delay can be roughly taken as twice the incident delay. After splitting the imaging area into P × Q imaging points, the round-trip time delay of the echo detected by the nth antenna at point A can be stated as follows:
where h denotes is the distance between the antenna and the ground; c represents the propagation speed of electromagnetic waves in free space; and stands for the relative permittivity of uniform soil. By summing the corresponding amplitudes at point A for each antenna, the final two-dimensional imaging pattern of A can be obtained, as shown in Figure 3. The three-dimensional imaging result is
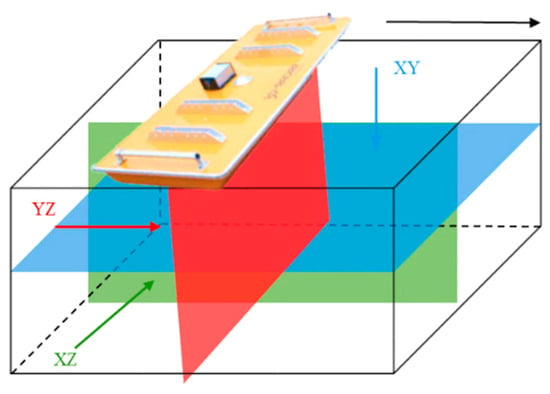
Figure 3.
Three-dimensional GPR data slicing mode.
Here, refers to the radar echo distance image that the qth receiving antenna obtains from the pth transmitting antenna; is the position of the scanned pixel point, while and represent the positions of the pth transmitting antenna and the qth receiving antenna, respectively. The received electromagnetic wave signals are stored in the image pixels, which serve as the basis for subsequent radar image processing.
2.2. Radar Image Cutting and Splicing
The 3D GPR system is mainly composed of a central unit, a real-time dynamic positioning system, and a multi-channel antenna array. The effective scanning width of the multi-channel antenna array is 1.5 m. Through the setup of multiple detection channels and integration with a high-precision positioning system, multiple data streams are stitched to achieve full cross-sectional coverage of the road. During the radar data processing process, key sections are selected for extraction, allowing for an intuitive display of the extent of internal damage to the road surface structure.
An XYZ three-dimensional coordinate system is established, where the movement direction of the antenna during radar detection is defined as the X-axis, the depth direction perpendicular to the ground as the Z-axis, and the direction perpendicular to the XZ plane as the Y-axis, as illustrated in Figure 3. This setup enables the acquisition of mutually perpendicular XY slices (blue), YZ slices (red), and XZ slices (green).
The radar image dataset utilized in this study comprises XY cross-sections generated via GPR imaging. Owing to a certain deviation between the width of the radar antenna and the actual lane width, images from each measurement lane require Mosaicking after scanning to obtain a complete road radar image. The Mosaicking results are illustrated in Figure 4. The raw data acquired from 3D GPR scanning consists of discrete point cloud data. This point cloud data is obtained by applying signal processing methods to electromagnetic signals to remove noise. Subsequently, the system stitches the point cloud data to form the image to be detected. The specific steps are as follows: (1) The latitude and longitude information of the point cloud recorded along the travel direction is matched with the positioning information of the central measurement lane to calculate and construct a complete data point cloud matrix. (2) The spatial range of the stitched image is determined based on the size of the point cloud matrix. (3) After determining the spatial range, distances are calculated according to latitude and longitude coordinates, and data points from adjacent measurement lanes are searched for in the remaining files. (4) Operations such as translation and rotation are performed on the data points to map them to the grayscale range [0, 255], thereby completing the pixelization conversion.
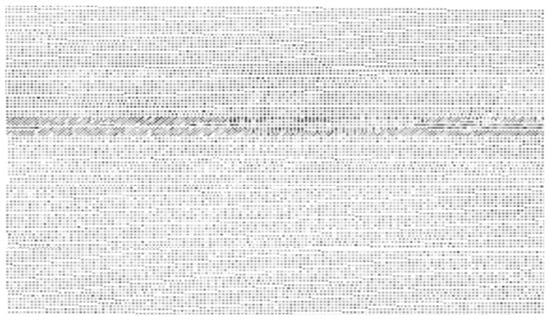
Figure 4.
Radar image after Mosaicking.
In the actual three-dimensional radar data matrix, the lateral (y) spacing is 0.071 m, the forward (x) spacing is 0.025 m, and the depth (z) spacing is approximately 0.009 m. To ensure the uniform distribution of the data matrix, interpolation is required for the lateral (y) and forward (x) directions to align their spacing with that of the depth direction, thus ensuring that the spacing between points in all three dimensions x, y, z is 0.009 m. Due to the high density and high noise characteristics of ground-penetrating radar data, bilinear interpolation is adopted in this paper to enhance computational efficiency and maintain good stability. The interpolation calculation method is illustrated in Figure 5.
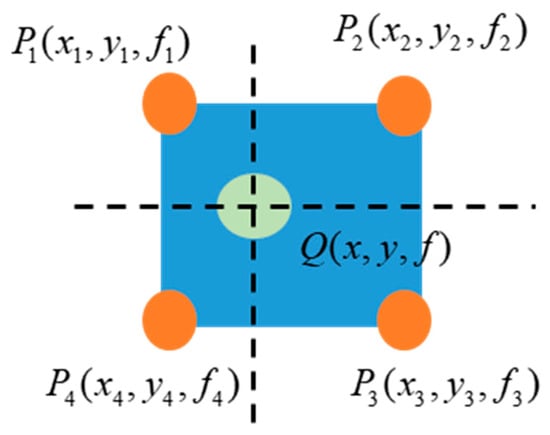
Figure 5.
Schematic diagram of bilinear interpolation.
For any adjacent detection data points , , and , insert a point at any position within the rectangular region, using the four points as its corners. The formula for calculating the function value of this point is
Based on Equation (3), radar data values can be calculated at any coordinate. Following interpolation processing of the data, the crack signals appear in three mutually perpendicular slice signal forms. It can be observed that the crack signals generated by the cracking of the road surface structure are more pronounced in the XY plane.
3. Determination of Filter Window Based on Deep Q-Learning
In practical applications, the distance between the transmitter and receiver antennas of ground-penetrating radar is relatively short (typically several centimeters to tens of centimeters). The direct signal from the transmitter antenna directly couples to the receiver antenna, creating “near-field interference” with an intensity far exceeding that of subsurface echoes, resulting in significant noise. Differential GPR systems and hardware configurations, such as transmitter-receiver-transmitter, are commonly employed to enhance signal processing capabilities. For such noise, data preprocessing is typically applied: first, converting the time domain to the frequency domain via the Fourier transform to distinguish noise spectra, and then optimizing the data through antenna calibration and time-domain gating correction. This provides high signal-to-noise ratio data for subsequent target identification.
During the 3D GPR echo imaging process, the extremely rough interfaces of most objects within road structures at the wavelength scale cause signals from numerous scatterers to interact with each other, leading to interference and the formation of speckle. The overlapping waveforms of speckle signals result in irregularly distributed bright and dark spots in the image, which severely degrade radar image quality and exert adverse effects on the subsequent interpretation of image structures. To enhance the system’s detection accuracy, noise suppression is particularly crucial. By employing specific methods to transform the additional information or data in the image, it becomes possible to selectively and more effectively interpret the features of interest in the image. For the spatial domain composed of pixels after imaging, image denoising can be applied directly to enhance the pixels. After processing, the pixel values can be expressed by the following equation:
where g(x,y) is the processed image, I(x,y) is the original image, and EH represents image enhancement technology processing.
3.1. Traditional Adaptive Median Filtering Method
Median filtering is an effective nonlinear filtering method that preserves image edge information. It employs a sliding window of a selected size to traverse each pixel in the image, replacing the pixel value at that point with the median value of the pixels within the sliding window region. This method can effectively eliminate isolated noise points in the image, and its mathematical expression is
where k is the number of pixels in the sliding window; n is the sequence of grayscale values sorted within the corresponding window; x is the horizontal coordinate of the pixel; and y is the vertical coordinate of the pixel.
In the traditional median filtering algorithm, the size of the sliding window determines the selection range of the pixel sequence. However, the window is unable to distinguish internal noise points. When the proportion of invalid noise points within the window exceeds 50%, the terminal point value within the window will be adopted as the noise point pixel value, thereby degrading image quality. Consequently, the adaptive adjustment of the sliding window based on different pixel values has become a key component of the adaptive median filtering algorithm.
In the adaptive median filtering algorithm, the extreme values of pixels within the window serve as the basis for distinguishing noise points from real points in the image. For a pixel value at a specific point in an image I(x,y), the maximum, minimum, and median values of the image grayscale within the filtering window are denoted as , , and , respectively. The corresponding operation process is illustrated in Figure 6.
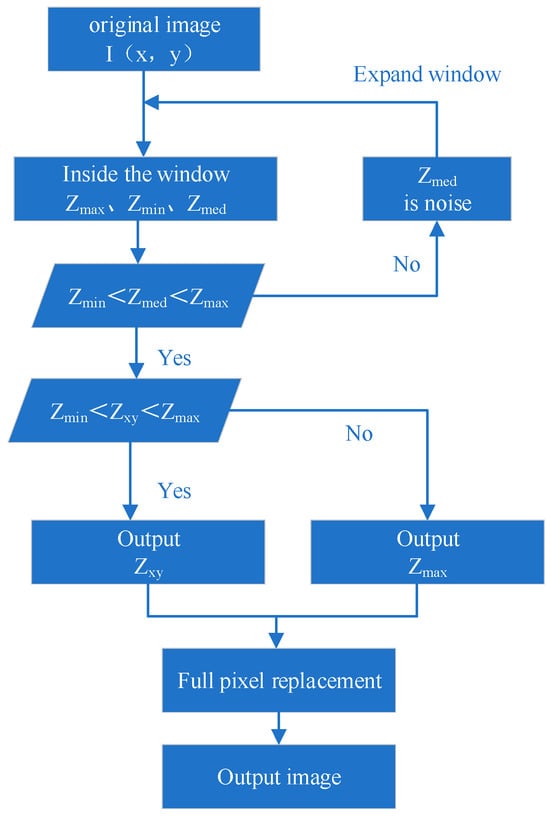
Figure 6.
Schematic diagram of section.
3.2. Window Discrimination Based on Reinforcement Learning
Traditional adaptive median filtering adjusts the window based on predefined rules, and the computational load can vary significantly depending on the changes in the shape and size of the filtering window. When the initial window size is small and noise points account for a large proportion, multiple iterations are often required to determine the appropriate window size. Conversely, when the window size is considerable, exceeding the inherent size of image features, it not only impairs the algorithm’s execution efficiency but also risks losing the structural information of the target object. In batch image processing, the initial window size often requires iterative testing to determine the optimal size. Therefore, reasonably determining the window shape parameters and size specifications according to the specific requirements of the image processing task is crucial.
Within the framework of reinforcement learning, the DQL algorithm exhibits significant generalization capabilities. By analyzing historical experience data within a specified window size, the algorithm can derive universal decision-making strategies based on radar image features, thereby effectively adapting to varying environmental conditions. The environmental adaptability of DQL originates from the iterative updating of its value function rather than reliance on specific environmental states, rendering it suitable for optimizing radar image noise processing in complex environments. Specifically, DQL evolves with the time series t, and the specific evolution formula is as follows:
where and represent the environmental states at the current and next time steps, respectively; at denotes the action strategy adopted; and indicates the reward value obtained. Accordingly, we propose a radar image noise classification method based on deep Q-learning, in which the radar images of the road interior collected by GPR are treated as environmental states, and the iterative adjustment of the adaptive window size at a specific point is regarded as the agent’s action. During the training process, a reward function is established based on the determination of the window size. By predicting the Q-value, the system can quickly converge to a reasonable size range of the window, reducing the number of incremental expansions in traditional adaptive median filtering windows and improving computational efficiency.
3.3. Sliding Window Discrimination Based on Deep Q-Learning
A method for determining the sliding window of an adaptive median filter based on deep Q-learning is proposed. In this method, the radar image to be denoised is treated as the environmental state in reinforcement learning. The actions available to the agent involve selecting filter windows of different sizes. During training, an immediate reward function is established based on the noise reduction effect achieved after filtering with a specific window size selected by the agent, as evaluated via professional image interpretation. Through iterative training, the agent learns the mapping strategy from the state to the optimal window size selection, ultimately forming a deep reinforcement learning model that can dynamically determine the optimal window size based on local image characteristics. The specific execution process is illustrated in Figure 7.
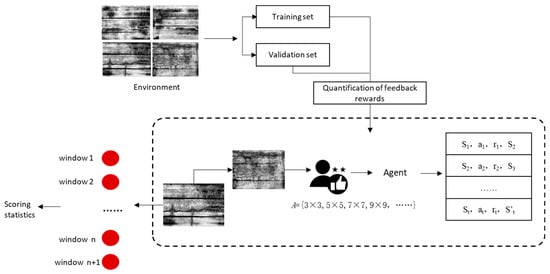
Figure 7.
Determination of filter window based on deep Q-learning.
Through repeated interactions with the environment, the agent uses the information obtained to continuously train and update the value function, ultimately training the optimal sliding window size. The function iteration update equation is shown in Equation (7):
In the equation, α is the learning rate, δt is the time difference error, as shown in Equation (8):
where γ is a discount factor that reflects the importance placed on future rewards; rt+1 is the immediate reward obtained after executing the action; is the maximum value among the Q values corresponding to all possible actions in the next stage; is the Q value corresponding to the action executed by the current Q network in state t.
During this process, the DQN network receives image features as input data. These features are processed through three fully connected layers (with neuron counts of 64, 128, and 64) and ultimately output Q-values corresponding to each candidate window size. During training, the agent interacts with the environment at the pixel level of the image. Leveraging experience replay and Bellman optimal equations, it continuously optimizes network parameters to learn a strategy that adaptively selects optimal filter windows based on local image features. The reward function integrates professional image quality evaluation criteria, specifically: 50% weighting for regional professional scoring (comprehensive evaluation of noise suppression, detail preservation, edge sharpness, and regional consistency); and 20% weighting for spatial consistency reward (encouraging smooth transitions between filtered results and neighboring pixels). This algorithm implements adaptive median filter window size selection using a DQN framework. Key hyperparameters are set as follows: learning rate of 1 × 10⁻⁴ to balance convergence speed and training stability; discount factor of 0.95 to weigh current and future rewards; exploration rate ε initialized at 1.0, decaying at a rate of 0.995 per step to 0.01, effectively balancing exploration and exploitation. The batch size is 64, and the target network updates every 10 training epochs.
A total of 500 rounds of training were conducted using 1000 512 × 512 radar images. It is randomly divided into a training set and a validation set with an 80%/20% ratio, ensuring that images from the same road section or adjacent spatial locations do not appear in both sets simultaneously, thereby strictly preventing information leakage caused by spatial correlation.
A total of 500 rounds of training were conducted using 1000 512 × 512 radar images. It is randomly divided into a training set and a validation set in an 80%/20% ratio. It ensures that images from the same road section or adjacent spatial locations are not included in both the training set and validation set simultaneously, thereby strictly preventing information leakage caused by spatial correlation.
All experiments were set with fixed random seeds to ensure the reproducibility of the results. The computing platform is an NVIDIA RTX 3080 GPU (NVIDIA, Santa Clara, CA, USA). Under typical field conditions (vehicle speed 60 km/h, sampling interval 0.025 m), about 1500 images are collected per kilometer. After optimization, the model takes approximately 0.8 s to process a single image on average, equivalent to about 20 min of data processing time per kilometer. This efficiency has the potential to be integrated into on-board real-time processing systems.
As shown in Table 1, under different noise ratio conditions, the adaptive median filtering method based on deep Q-learning requires fewer total window calls than the traditional adaptive median filtering method. The proposed method precisely selects filtering windows based on image characteristics, significantly reducing the number of operations while effectively mitigating over-smoothing and residual noise issues. Particularly in radar images with complex textures, the proposed method demonstrates more pronounced advantages in both visual quality and quantitative metrics.

Table 1.
Comparison of Window Invocation Counts.
4. Image Quality Assessment
4.1. Image Quality Assessment Indicators
After noise reduction processing, the quality of radar images needs to be evaluated. Image quality assessment can effectively quantify the effectiveness of image noise reduction. In the evaluation of image quality, human visual perception and quantitative indicators must be combined to meet subsequent segmentation requirements. Image quality assessment is primarily divided into two components: subjective evaluation and objective evaluation.
Subjective evaluation primarily relies on observers’ visual perception to assess the quality of an image. It involves comparing standard images with processed images based on subjective experience to determine image quality. This method enables quick judgment and the generation of evaluation results; however, its accuracy and reliability are low. It is also affected by various factors, including the observer’s viewing distance, display device, lighting conditions, visual ability, and mood. Consequently, this method can only provide a rough assessment of image quality and is not widely applicable.
Objective evaluation employs mathematical models to provide quantitative values for images, which are not affected by external factors or observers’ subjective perceptions. Through the establishment of precise mathematical models, image quality is quantitatively assessed from three aspects: pixel statistics, information theory, and structural information. Commonly used image quality assessment metrics include Mean Squared Error (MSE), Peak Signal-to-Noise Ratio (PSNR), and Structure Similarity Index Measure (SSIM).
If the pixel value of the original image is and the pixel value of the processed image is , then the error value between the images is . The mean square error can be expressed as
Peak signal-to-noise ratio is often used as a method for evaluating image quality in image denoising. It is defined as
where is the maximum pixel value of the processed image. MSE and PSNR measure image quality by calculating the global pixel error between the original image and the processed image. The higher the PSNR value, the lower the image distortion and the better the image quality. Conversely, the lower the MSE value, the better the image quality. The method for calculating the peak signal-to-noise ratio (PSNR) starts with global pixel statistics of the image, is simple and easy to implement, and is widely applied in image denoising.
4.2. Result Analysis
Images are often disturbed by various types of noise during their formation, which affects and reduces image quality. Since noise itself is unpredictable, its causes, distributions, and magnitudes vary widely. The presence of noise is unavoidable; it is a type of random error that blurs images and obscures their features. Therefore, the probability distribution function and probability density function of random processes are commonly used to quantify noise in images. To capture the random signal characteristics of interwoven materials, such as road aggregates, noise with various probability distributions is added. These distributions include Gaussian noise, impulse noise, Rayleigh noise, gamma noise, exponential noise, and uniform noise. Once added to the radar image, a random noise simulation is performed.
An assessment of existing pavement damage was conducted on an old section of a highway undergoing expansion and renovation in Guangdong Province. A 3D GPR was employed to scan the old road, with a scanning speed of 60 km/h, a lateral sampling interval of 0.071 m, a longitudinal sampling interval of 0.025 m, and a vertical sampling interval of 0.009 m, to implement a full-section, large-area radar scan of the road’s internal structure. The acquired radar images were segmented into independent, complete sub-images, each with a standard length of 10 m.
This paper introduces different types of noise with a mean of 0.01 and a variance of 0.08 into radar images. As shown in Figure 8. The images are preprocessed using the method proposed in this paper and common image denoising methods, including Gaussian filtering, bilateral filtering, Wiener filtering, non-local mean denoising, and denoising autoencoder. To evaluate the quality of the denoised images, the PSNR difference is employed to measure the image processing results. The results are illustrated in Figure 9.
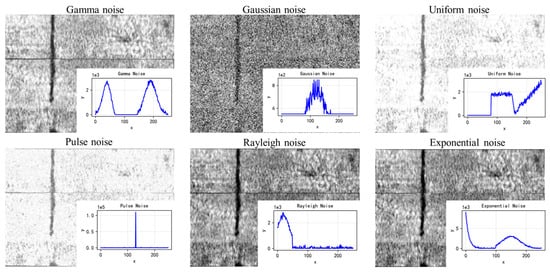
Figure 8.
Radar image after adding noise.
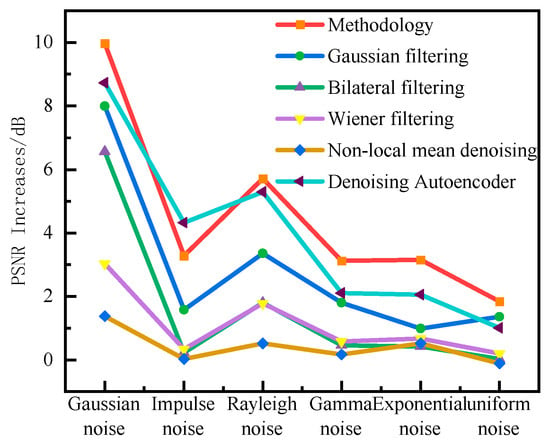
Figure 9.
PSNR quality assessment.
Standard filtering methods demonstrate strong noise removal capabilities when processing radar images, effectively reducing interference from potential noise sources. The improved adaptive median filtering method proposed in this paper achieves the highest PSNR improvement across three noise environments, exhibiting outstanding robustness. For Gaussian noise, all methods effectively enhance PSNR, with the proposed method achieving the best improvement of 9.97 dB. Denoising autoencoders and Gaussian filters also demonstrate good PSNR enhancement, indicating that both deep learning-based and traditional filtering methods can effectively suppress additive Gaussian noise. For impulse noise, the proposed method demonstrated the most significant advantage with a ΔPSNR of 3.28 dB, outperforming other comparison methods by approximately 2–7 times. Methods such as bilateral filtering, Wiener filtering, and non-local mean showed minimal effectiveness against this noise type, primarily because they inherently perform weighted averaging on neighboring pixels. The extreme points of pulse noise severely contaminate the weighted calculations.
In contrast, the proposed method, based on the core principle of adaptive median filtering, effectively identifies and replaces these anomalous pixels, leading to its outstanding performance. For exponential noise, the proposed method also maintains the highest performance. While traditional filtering methods tend to oversmooth details while smoothing this noise, the proposed method achieves a better balance between smoothing noisy regions and preserving feature-rich intervals through its window-learning decision mechanism.
To further evaluate the noise reduction and enhancement effects of the proposed method on images depicting crack damage within road surfaces, an automated recognition comparison experiment was conducted using the YOLOv8 model. During this process, a dataset comprising 1500 radar images featuring cracks was selected. Annotation was performed using LabelImg 5.0.1, with training conducted on a Windows 10 system equipped with an NVIDIA RTX 3080 GPU. Crack target detection was performed on both pre-denoised and post-denoised radar images. As shown in Figure 10, in untreated images contaminated by mixed noise, transverse cracks were completely undetected. The detection rate for transverse cracks in the initially acquired untreated images was only 48%, with a false positive rate of 8%. However, after processing with the method proposed in this paper, the detection rate for transverse cracks in both types of images increased to over 90%. In radar images processed by the proposed method, the completeness of crack target identification significantly outperformed that of the original images, validating the positive impact of denoising on enhancing the automatic interpretation capability of internal road cracks.
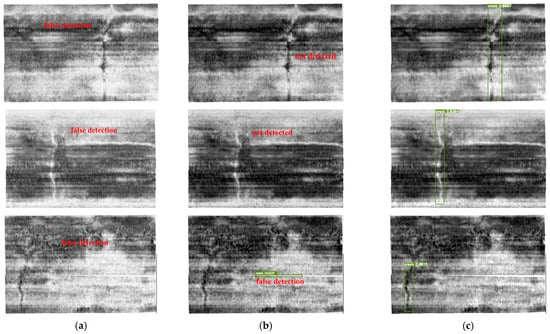
Figure 10.
Comparison of automatic recognition results before and after processing. (a) Image recognition results after mixing multiple types of noise; (b) Original image recognition results; (c) Image recognition results after noise reduction using the method described in this paper.
5. Conclusions
This paper examines road-embedded 3D radar imaging systems and their key technologies, with the primary objective of improving the quality and interpretability of radar image data. First, to address incomplete radar scan coverage, a method is proposed that combines adjacent lane stitching with adaptive image length segmentation. Second, to overcome the inefficiency of traditional adaptive median filter window selection, a Q-learning algorithm is introduced to establish a reinforcement learning-driven intelligent window decision mechanism, enabling rapid adaptive determination of window size.
Regarding road radar image stitching and interpolation processing, the proposed method offers the following advantages: (1) It effectively resolves incomplete scan coverage caused by mismatched radar antenna size and lane width. By stitching adjacent lane data and applying adaptive image length segmentation, it achieves comprehensive visualization of internal road structures, significantly reducing information loss rates. (2) It employs bilinear interpolation to process 3D radar data, uniformly standardizing spatial intervals to 0.009 m. This ensures data uniformity while precisely preserving minute road details, such as 0.1–0.5 mm microcracks, thereby laying a robust data foundation for subsequent defect identification.
The deep Q-learning-based intelligent window decision mechanism demonstrates a significant advantage over the traditional adaptive median filtering approach’s “trial-and-error” window selection method. In large-scale radar image processing, our method reduces window invocation by over 30%, with precise quantitative comparison results. Across diverse noise scenarios, using the peak signal-to-noise ratio as the evaluation metric, the method achieves a PSNR improvement of 9.97 dB for Gaussian noise and 3.28 dB for impulse noise, demonstrating denoising performance that is 2–7 times more superior than conventional algorithms. For radar images initially captured from an old section of a highway and images contaminated with specific mixed noise, an automatic damage identification test was conducted using the YOLOv8 object detection network. In unprocessed images contaminated with mixed noise, transverse cracks were completely undetected. The detection rate for transverse cracks in unprocessed, initially collected images was only 48%, with a false positive rate of 8%. However, after processing with the method described in this paper, the detection rate for transverse cracks in both types of images increased to over 90%, achieving accurate and complete identification of transverse cracks.
6. Future Work and Limitations
Future research efforts will focus on the following areas: (1) Further optimizing the existing technical framework to enhance the algorithm’s adaptability and stability in complex engineering scenarios (e.g., varying pavement materials, adverse environmental interference); (2) advancing integration and testing of this method with real-time data processing systems to validate its performance in actual road inspection scenarios; and (3) deepening the engineering implementation of the technology, prioritizing the enhancement of system integration capabilities to better align with practical road inspection requirements, thereby providing more efficient technical support for road health monitoring.
Author Contributions
Conceptualization, C.L.; methodology, C.L. and Z.H.; software, C.L. and Z.H.; writing—original draft preparation, Z.H. and B.Z.; writing—review and editing, B.Z. and H.Y. All authors have read and agreed to the published version of the manuscript.
Funding
The financial support from Guangdong Basic and Applied Basic Research Foundation (2022A1515011607, 2022A1515011537 and 20231515030287) and the Fundamental Research Funds for the Central Universities (2022ZYGXZR056) are sincerely acknowledged.
Data Availability Statement
The original contributions presented in the study are included in the article; further inquiries can be directed to the corresponding author.
Acknowledgments
Thanks to all those who contributed to the articles. Also, thanks for the support of the existing pavement inspection and evaluation project of the airport Expressway reconstruction and expansion project.
Conflicts of Interest
Author Changrong Li was employed by the company Guangzhou Expressway Co., Ltd. The remaining authors declare that the research was conducted in the absence of any commercial or financial relationships that could be construed as a potential conflict of interest.
Abbreviations
The following abbreviations are used in this manuscript:
| GPR | Ground-penetrating radar |
| 3D GPR | three-dimensional ground-penetrating radar |
| FFT | Fast Fourier Transform |
| BP | Back projection |
| MSE | Mean Squared Error |
| PSNR | Peak Signal-to-Noise Ratio |
| SSIM | Structure Similarity Index Measure |
| DQL | Deep Q-Learning |
References
- Zang, G.S.; Sun, L.J.; Chen, Z.; Li, L. A non-destructive evaluation method for semi-rigid base cracking condition of asphalt pavement. Constr. Build. Mater. 2018, 162, 892–897. [Google Scholar] [CrossRef]
- Guo, M.; Zhu, L.; Huang, M.; Ji, J.; Ren, X.; Wei, Y.X.; Gao, C.T. Intelligent extraction of road cracks based on vehicle laser point cloud and panoramic sequence images. J. Road Eng. 2024, 4, 69–79. [Google Scholar] [CrossRef]
- Luo, C.X.; Zhang, X.N.; Yu, J.M.; Li, W.X.; Huang, Z.Y. Analysis of Factors Affecting the Thickness Detection of Asphalt Pavement Based on 3D Ground-Penetrating Radar. Highway 2021, 66, 95–99. [Google Scholar]
- Zou, L.; Li, Y.; Munisami, K.; Alani, A.M. Bridging Theory and Practice: A Review of AI-Driven Techniques for Ground Penetrating Radar Interpretation. Appl. Sci. 2025, 15, 8177. [Google Scholar] [CrossRef]
- Sui, X.Z.; Du, Y.Q.; Shi, H.; Wang, X.Q.; Sun, Z.B.; Liu, C.Y. Numerical Simulation and Instantaneous Attribute Analysis of Ground Penetring Radar Wave Field for Road Subgrade Void Disease. Sci. Technol. Eng. 2024, 24, 782–788. [Google Scholar]
- Liu, H.; Yang, Z.F.; Yue, Y.P.; Meng, X.; Liu, C.; Cui, J. Asphalt pavement characterization by gpr using an air-coupled antenna array. NDT E Int. 2023, 133, 102726. [Google Scholar] [CrossRef]
- Zhang, J.; Li, H.W.; Yang, X.K.; Cheng, Z.; Zou, P.X.W.; Gong, J.; Ye, M. A novel moisture damage detection method for asphalt pavement from gpr signal with cwt and cnn. NDT E Int. 2024, 145, 103116. [Google Scholar] [CrossRef]
- Liu, Z.; Yeoh, J.K.W.; Gu, X.Y.; Dong, Q.; Chen, Y.H.; Wu, W.X.; Wang, L.T.; Wang, D.Y. Automatic pixel-level detection of vertical cracks in asphalt pavement based on gpr investigation and improved mask r-cnn. Autom. Constr. 2023, 146, 104689. [Google Scholar] [CrossRef]
- Tong, Z.; Gao, J.; Yuan, D. Advances of deep learning applications in ground-penetrating radar: A survey. Constr. Build. Mater. 2020, 258, 120371. [Google Scholar] [CrossRef]
- Cano-Ortiz, S.; Pascual-Muñoz, P.; Castro-Fresno, D. Machine learning algorithms for monitoring pavement performance. Autom. Constr. 2022, 139, 104309. [Google Scholar] [CrossRef]
- Sui, X.; Leng, Z.; Wang, S. Machine learning-based detection of transportation infrastructure internal defects using ground-penetrating radar: A state-of-the-art review. Intell. Transp. Infrastruct. 2023, 2, liad004. [Google Scholar] [CrossRef]
- Li, C.; Pu, T.; Cai, N.; Yang, X.; Liu, H.; Wang, L. Tunnel Lining Recognition and Thickness Estimation via Optical Image to Radar Image Transfer Learning. Appl. Sci. 2025, 15, 7306. [Google Scholar] [CrossRef]
- Su, H.; Wang, X.; Han, T.; Wang, Z.; Zhao, Z.; Zhang, P. Research on a U-Net Bridge Crack Identification and Feature-Calculation Methods Based on a CBAM Attention Mechanism. Buildings 2022, 12, 1561. [Google Scholar] [CrossRef]
- Li, J.; Liu, C.; Zeng, Z.F.; Chen, L.N. GPR signal denoising and target extraction with the CEEMD method. IEEE Geosci. Remote Sens. Lett. 2015, 12, 1615–1619. [Google Scholar]
- Tess, X.H.L.; Wallace, W.L.L.; Ray, K.W.C.; Dean, G. GPR imaging criteria. J. Appl. Geophys. 2019, 165, 37–48. [Google Scholar] [CrossRef]
- He, Y.C.; Duan, Z.X.; Gao, J. A Method for Pavement Crack Segmentation Based on Multi-scale Cavity Convolution Structure. J. Highw. Transp. Res. Dev. 2024, 41, 1–9+17. [Google Scholar]
- Wang, Y.; Zhang, S.; Jia, Y.; Tang, L.; Tao, J.; Tian, H. Forward Simulation and Complex Signal Analysis of Concrete Crack Depth Detection Using Tracer Electromagnetic Method. Buildings 2024, 14, 2644. [Google Scholar] [CrossRef]
- Huang, Z.Y.; Xu, G.Y.; Zhang, X.N.; Zang, B.; Yu, H.Y. Three-dimensional ground-penetrating radar-based feature point tensor voting for semi-rigid base asphalt pavement crack detection. Dev. Built Environ. 2025, 21, 100591. [Google Scholar] [CrossRef]
- Song, L. Measurement of Pavement Diseases by GPR Using Extended Common Midpoint Method. J. Highw. Transp. Res. Dev. 2017, 34, 34–43. [Google Scholar]
- Wu, X.L.; Wang, Z.Z.; Xi, B.Q.; Zhen, R. Ground-penetrating Radar Denoising Based on Wavelet Adaptive Thresholding Method. Sci. Technol. Eng. 2023, 23, 4686–4692. [Google Scholar]
- Luo, J.B.; Lei, W.T.; Hou, F.F.; Wang, C.H.; Ren, Q.; Zhang, S.; Luo, S.G.; Wang, Y.W.; Xu, L. GPR B-Scan Image Denoising via Multi-Scale Convolutional Autoencoder with Data Augmentation. Electronics 2021, 10, 1269. [Google Scholar] [CrossRef]
- Yahya, A.A.; Tan, J.Q.; Su, B.Y.; Hu, M.; Wang, Y.B.; Liu, K.; Hadi, A.N. BM3D image denoising algorithm based on an adaptive filtering. Multimed. Tools Appl. 2020, 79, 20391–20427. [Google Scholar] [CrossRef]
- Zang, B.; Peng, X.; Zhong, X.G.; Zhao, C.; Zhou, K. The Size Distribution Measurement and Shape Quality Evaluation Method of Manufactured Aggregate Material Based on Deep Learning. J. Test. Eval. 2023, 51, 4476–4492. [Google Scholar] [CrossRef]
- Zhou, W.L. Research on Ground-Penetrating Radar Image Enhancement Technology Based on Deep Neural Networks. Ph. D. Thesis, Chengdu University of Technology, Chengdu, China, 2023. [Google Scholar]
- Feng, D.S.; Wang, X.Y.; Wang, X.; Ding, S.Y.; Zhang, H. Deep Convolutional Denoising Autoencoders with Network Structure Optimization for the High-Fidelity Attenuation of Random GPR Noise. Remote Sens. 2021, 13, 1761. [Google Scholar] [CrossRef]
- Qi, W.; Jia, C.X.; Li, J. Application of lmproved Non-local Mean Filtering in lmage Denoising. J. Taiyuan Univ. (Nat. Sci. Ed.) 2023, 41, 59–64. [Google Scholar] [CrossRef]
- Ho, K.; Gader, P.D. A linear prediction land mine detection algorithm for handheld ground penetrating radar. IEEE Trans. Geosci. Remote Sens. 2002, 40, 1374–1384. [Google Scholar] [CrossRef]
- Gader, P.D.; Mystkowski, M.; Zhao, Y. Landmine Detection with Ground Pene-Trating Radar Using Hidden Markov Models; IEEE: New York, NY, USA, 2001; Volume 39, pp. 1231–1244. [Google Scholar]
- Zoubir, A.M.; Chant, I.J.; Brown, C.L.; Barkat, B.; Abeynayake, C. Signal processing techniques for landmine detection using impulse ground penetrating radar. IEEE Sens. J. 2022, 2, 41–51. [Google Scholar] [CrossRef]
- Abujarad, F.; Jostingmeier, A.; Omar, A. Clutter removal for landmine using different signal processing techniques. In Proceedings of the Tenth International Conference on Grounds Penetrating Radar (GPR), Delft, The Netherlands, 21–24 June 2004; IEEE: New York, NY, USA, 2004; Volume 41, pp. 697–700. [Google Scholar]
Disclaimer/Publisher’s Note: The statements, opinions and data contained in all publications are solely those of the individual author(s) and contributor(s) and not of MDPI and/or the editor(s). MDPI and/or the editor(s) disclaim responsibility for any injury to people or property resulting from any ideas, methods, instructions or products referred to in the content. |
© 2025 by the authors. Licensee MDPI, Basel, Switzerland. This article is an open access article distributed under the terms and conditions of the Creative Commons Attribution (CC BY) license (https://creativecommons.org/licenses/by/4.0/).