1. Introduction
Excessive heat load negatively affects the human body [
1]. Exposure to high temperatures disrupts the operation of the thermoregulatory system [
2]. It also increases the core temperature significantly above 38 °C, which can lead to hyperthermia and, consequently, to death. A hot environment also affects human psychomotor functions [
3]. Pilcher et al. [
4] showed that, for wet bulb and globe temperature (WBGT) values greater than 32.2 °C, psychomotor efficiency decreased by up to 15% compared to that at a thermoneutral temperature. A study by Rastegar et al. [
5], featuring the participation of petrochemical workers, revealed the negative effects of high air temperature on reaction speed and working memory. A similar relationship was observed for foundry workers [
6]: the higher the thermal load, the longer the reaction time and the greater the number of errors made. These studies, conducted in real work environments, confirmed the impairment of cognitive functions under heat stress [
6]. Therefore, in order to guarantee safety of workers exposed to a high-temperature microclimate, the WBGT Index was proposed for evaluation of thermal load.
The wet bulb and globe temperature index was conceived in the 1950s by C. P. Yaglou and C. D. Minard. Its name refers to the sensors used to measure the underlying parameters: the wet state temperature (a wet bulb sensor) and the temperature of a black sphere (a globe sensor) [
7]. Originally intended for military purposes, it has been adopted in occupational health and safety [
8]. It gained international significance in 1982, when the ISO 7243 standard was introduced [
7]. For assessing thermal load on workers, an effective WBGT (WBGT
eff) index is used, which also includes the effect of the clothing used through a Clothing Adjustment Value (CAV) [
9].
The procedure of a thermal load test on a worker can be divided into three stages [
10]:
- (1)
Measurements at the workplace (a general evaluation of thermal conditions, microclimate parameters, work intensity, and the clothing used);
- (2)
Calculation of WBGT and WBGTeff based on the data from stage (1);
- (3)
Result interpretation, encompassing comparison of the calculated WBGTeff with reference values (limits).
According to EN ISO 7243 [
11], WBGT is a function of two or three microclimate parameters: black globe temperature (t
g), natural wet bulb temperature (t
nw) and, in the case of direct incident radiation from the sun, air temperature (t
a). They should be measured over a representative period of about 1 h at the most demanding moment of work, that is, during the summer, preferably in the middle of the day or during the highest possible exposure. After the measurements, the metabolic rate should be estimated and assigned to one of five classes: (0) resting metabolic rate, (1) low metabolic rate, (2) moderate metabolic rate, (3) high metabolic rate, or (4) very high metabolic rate. EN ISO 7243 [
11] also lists CAVs for different types of clothing. It is important to properly identify the clothing that workers are wearing at the particular workplace where the measurements are taken. Based on all the above data, WBGT
eff is finally calculated.
The methodology described above provides valuable data that can be used to assess and counteract the harmful effects of heat load on workers. Nevertheless, it has some limitations, which primarily include the periodic assessment of WBGT. Even if procedures are followed, it may be the case that measurements are not taken under maximum load, for example, due to the variability of atmospheric conditions. Moreover, the suitability of WBGT alone to assess heat load is limited by the lack of consideration of individual workers’ characteristics, such as their age, gender, physical condition, or health status [
12,
13,
14], which can lead to an underestimation of exposure levels [
13,
15]. In these contexts, Internet of Things technologies are very promising, as they can be used to develop systems that evaluate individual workers’ heat load and counteract its effects in real time [
16].
Glassworks are an example of the many environments where workers are exposed to hot microclimates directly related to the technological processes they are performing. Particularly exposed to hot microclimates are metallurgists, who work in the immediate vicinity of the glass bath from where they take molten glass mass, the temperature of which is between 1000 °C and 1200 °C. The air temperature is highest close to these glass baths, and it can reach 50 °C. Due to the nature and intensity of the technological processes, collective protection measures, such as installation of air conditioning or fans, may be insufficient. In such cases, the heat load of individual workers may be reduced directly with personal cooling garments.
This paper presents recent achievements in the development of a system where WBGT is measured in the workplace in real time and thermal load is counteracted through the use of active clothing equipped with electronically controlled coolers based on thermoelectric modules (TEMs). The functionality of the developed system has been tested in a microclimate chamber using a thermal manikin. In addition to this innovative system, this paper also presents a novel methodology developed to evaluate such systems under simulated conditions of use in a controlled environment.
2. Materials and Methods
2.1. Tested Object
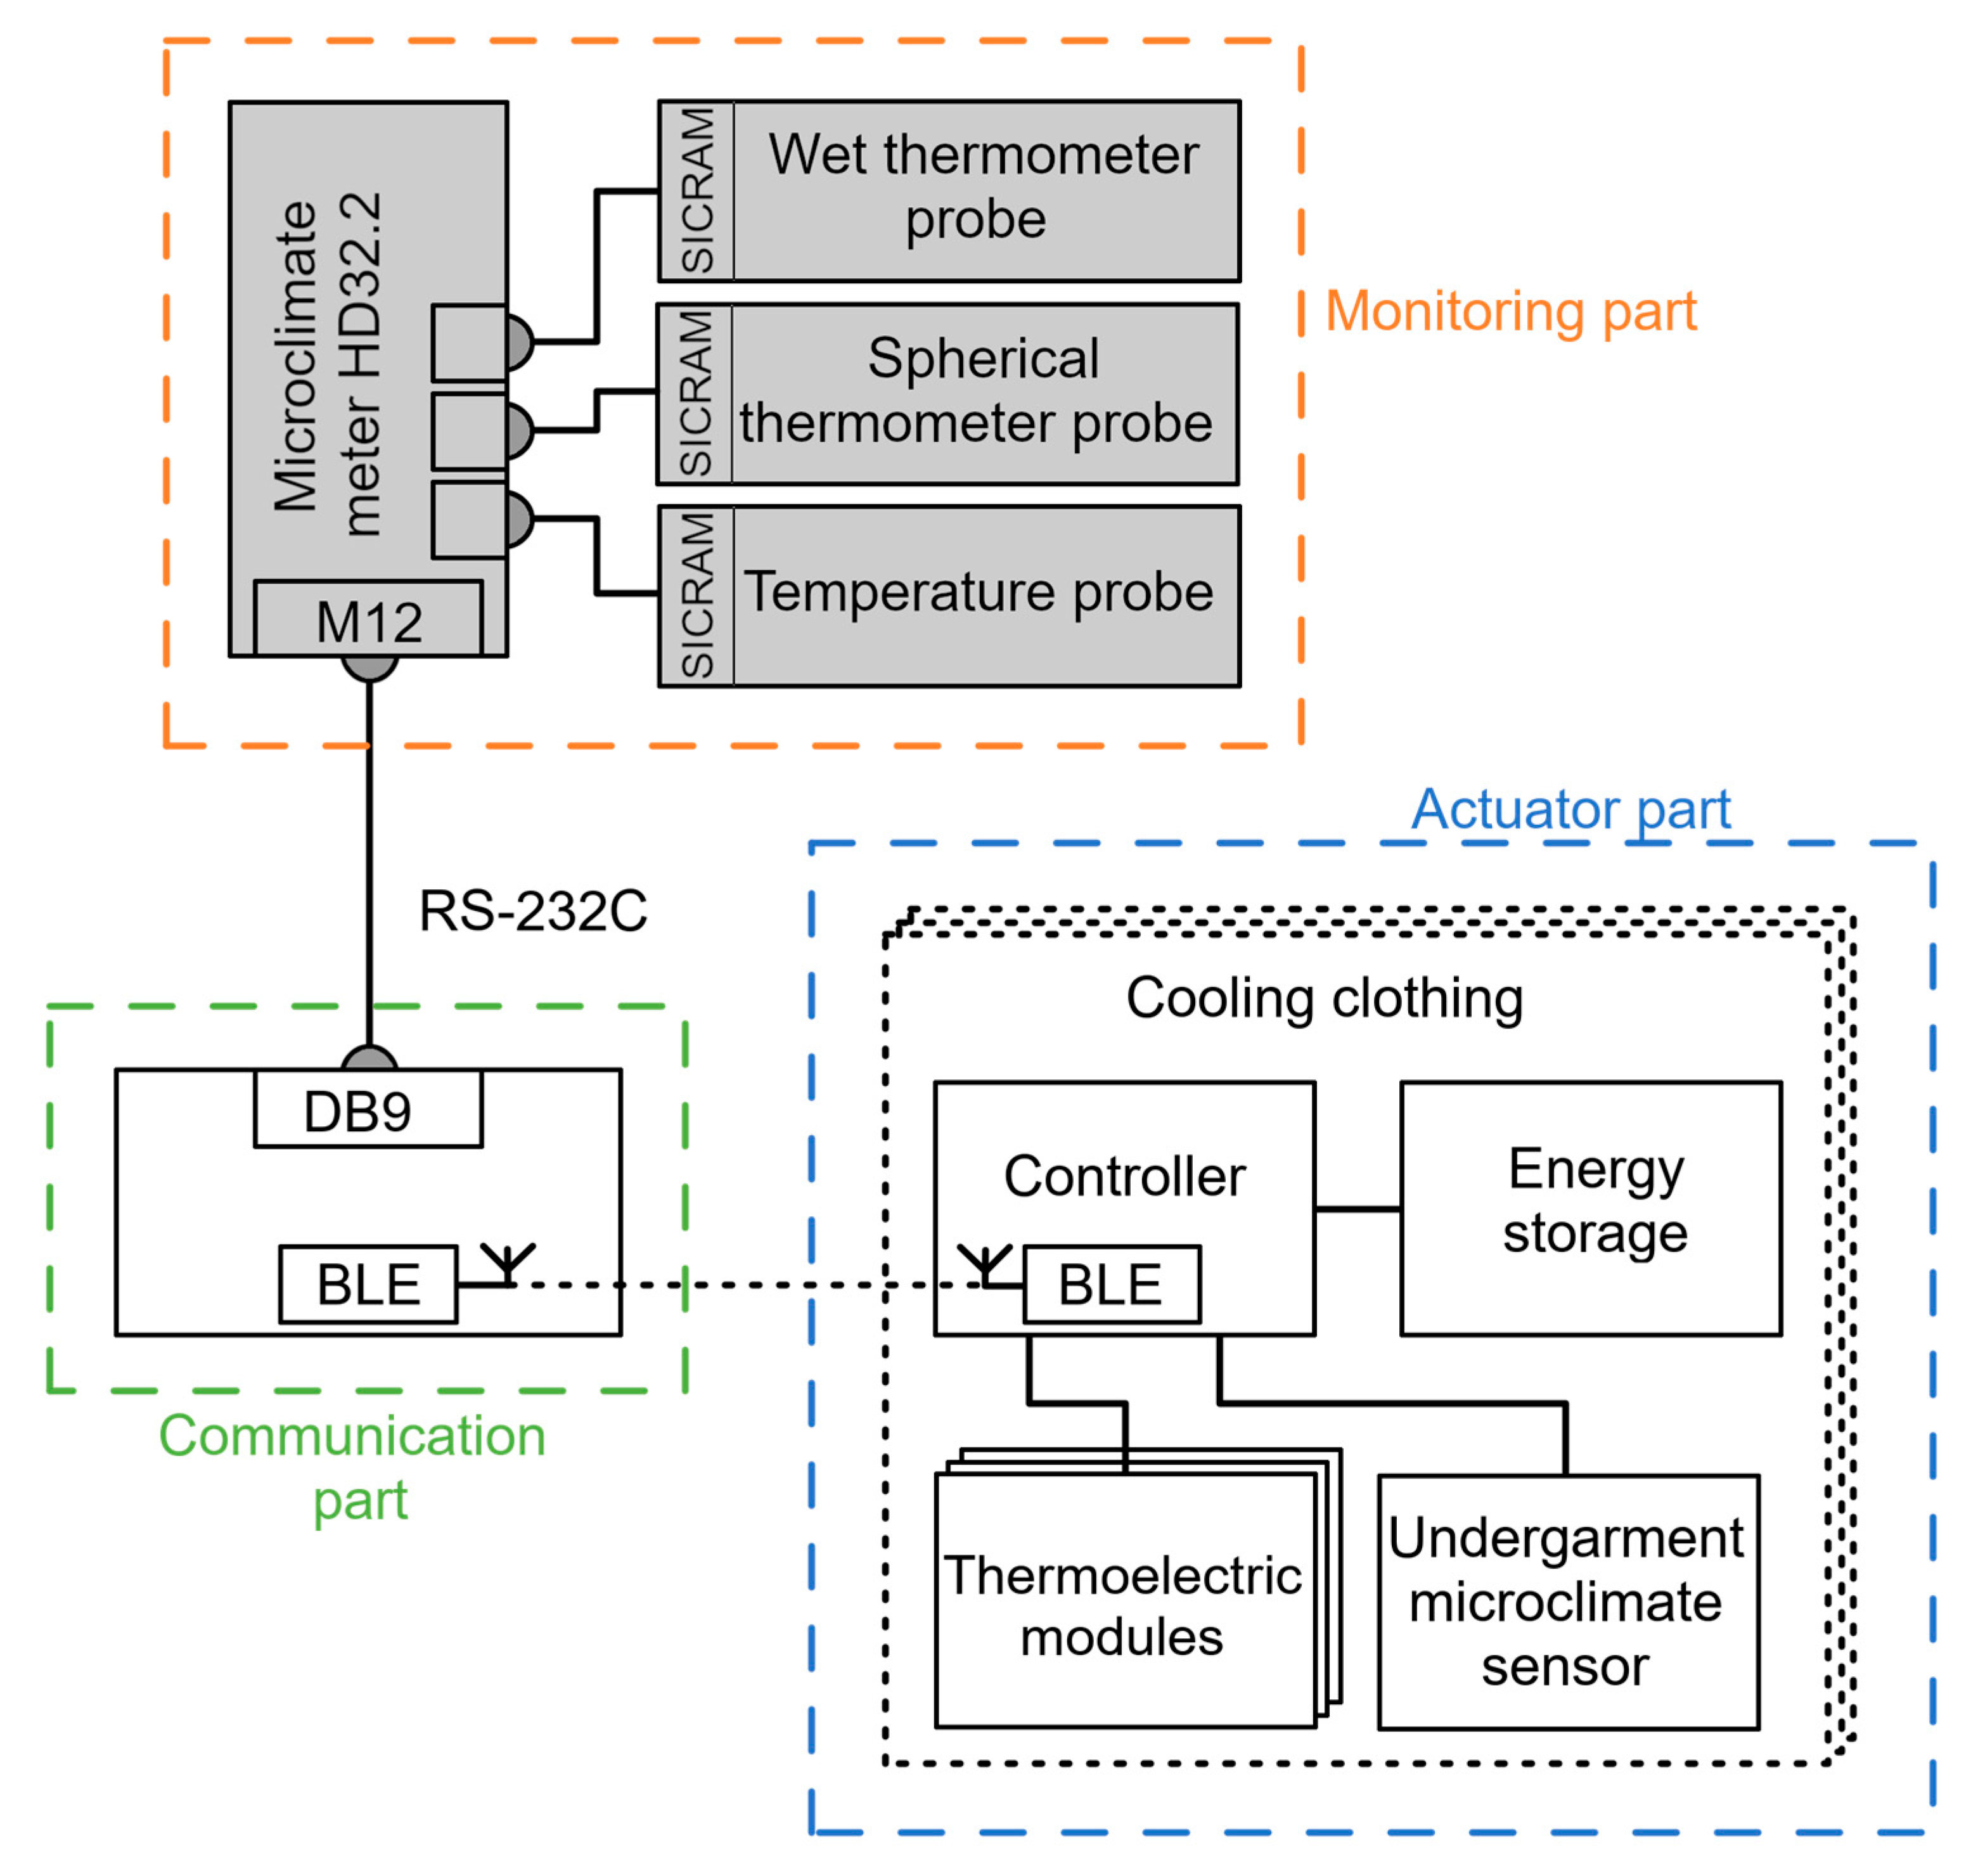
A system was developed to monitor and prevent the heat load of workers in hot microclimate hazard conditions, consisting of three parts: the monitoring, communication, and actuator parts. The various parts of the system were integrated in such a way so as to ensure full mobility of the system, thus enabling its use in different workplaces. The monitoring part and the communication part of the system communicate with each other in a wired way, and in turn, the transmission of information between the communication part and the actuator part is carried out wirelessly.
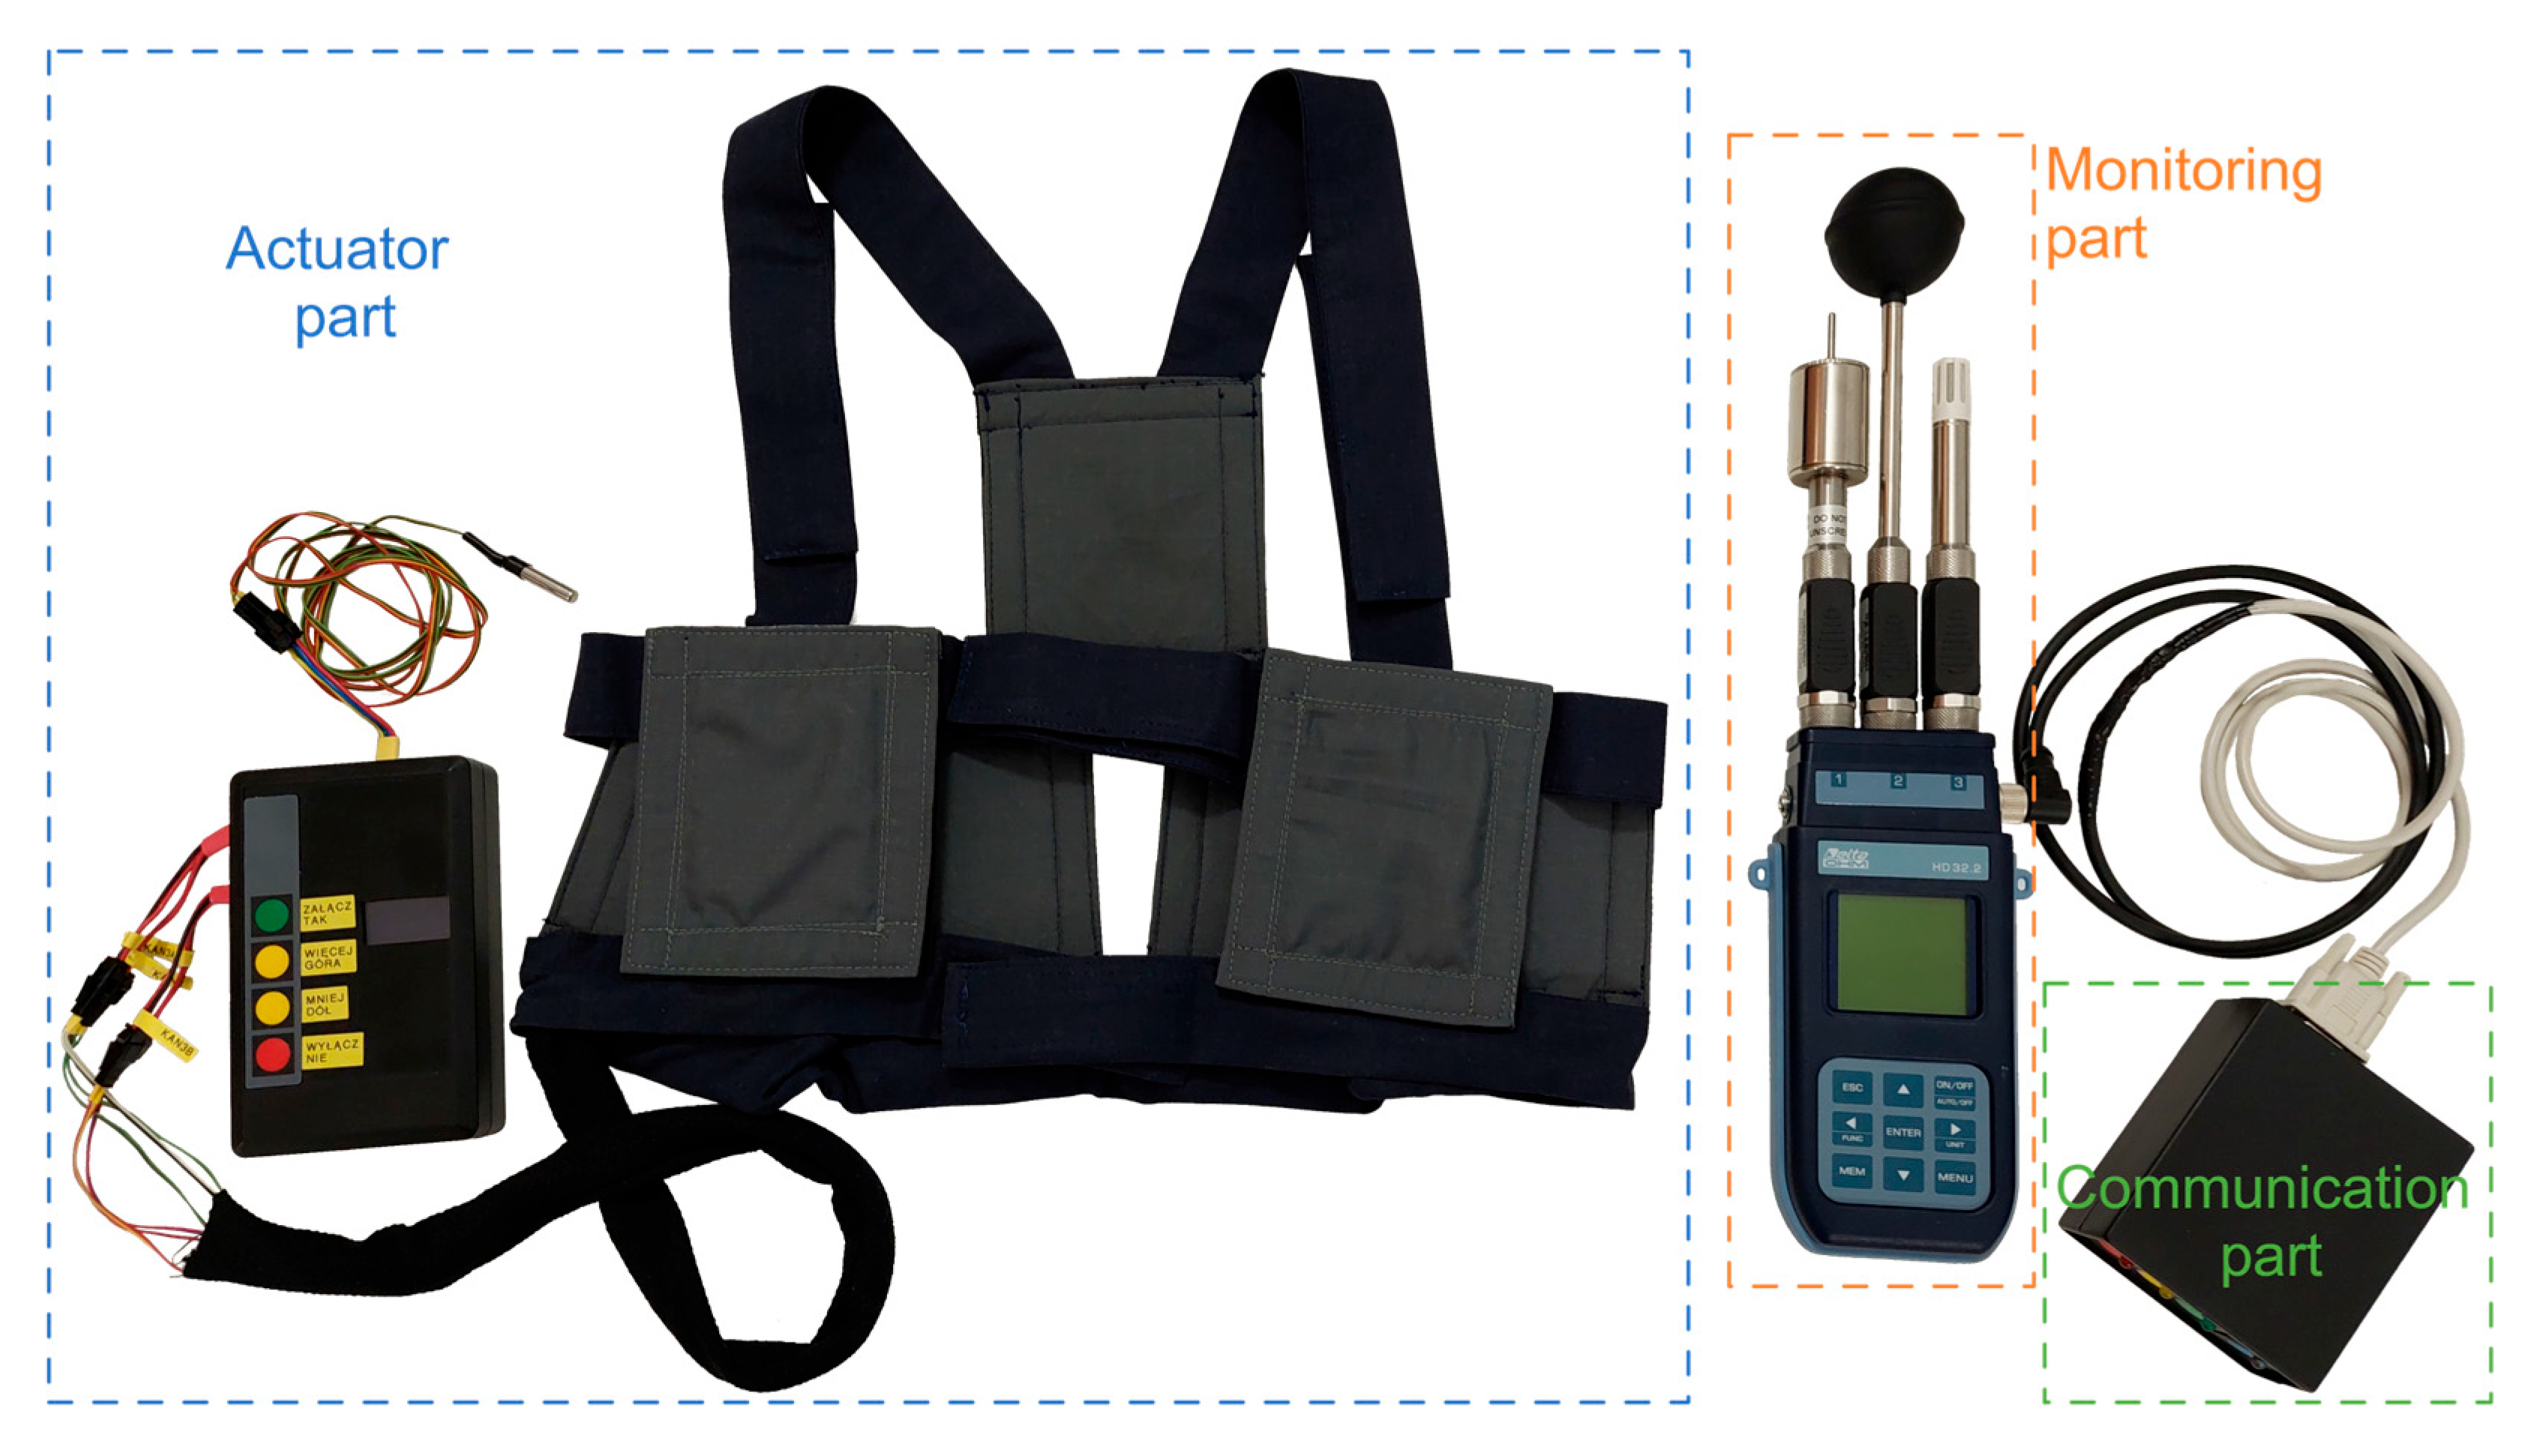
Figure 1 shows a schematic diagram of the developed system for monitoring and preventing heat load, showing the layout of the connections in the system between the different parts. A image of the model is shown in
Figure 2.
The monitoring part is responsible for measuring WBGT in the workplace in real time. For this purpose, a mobile microclimate meter from Delta Ohm HD32.2 (Senseca Delta Ohm, Selvazzano Dentro, Italy) is applied with a measuring range of −40 °C to 100 °C. Three probes are used in conjunction with this meter: a temperature probe TP3207.2, a wet thermometer probe HP3201.2, and a spherical thermometer probe TP3276.2 (all from Senseca Delta Ohm Selvazzano Dentro, Italy).
An important component of the developed system is the communication module that enables one-way communication between the monitoring part and the actuator part. Its task is to periodically read data from the microclimate meter and pass it to the cooling clothing controllers. The two-way data transmission between the communication module and the microclimate meter uses the built-in port of the latter the RS232C protocol and a set of plain text commands implemented by the meter’s manufacturer. The communication module then sends the relevant data to the cooling clothing controllers (the actuator part) via a Bluetooth Low Energy (BLE) wireless interface. An up-to-date WBGT value is obtained and sent about every second. The communication module can be simultaneously connected to, at most, three controllers. The connection is established automatically when the controllers are available, and it can be restored either automatically or manually if it is temporarily lost. The wireless communication range is approximately 10 m inside buildings, which is usually sufficient in the considered workplace. It can be extended to 15 m by increasing the transmit power of the devices (from 0 dBm to +4 dBm). The alternative application of another wireless communication standard, such as WiFi, could result in a longer range, but such solutions were not adopted due to the need for the minimization of electric power consumption by the controllers.
The actuator part of the system is a cooling clothing in the form of a vest. The clothing is equipped with a temperature sensor for the undergarment microclimate and seven S169A068085 thermoelectric modules (Tegway, Daejeon, Republic of Korea) that provide the cooling function, with a total area of 405 cm2. The heat from the hot side of the modules is dissipated by custom-designed heat sinks made from the Technical Absorbents SAF Fabric 2644 superabsorbent nonwoven fabric (Technical Absorbents, Grimsby, North East Lincolnshire, United Kingdom). This nonwoven fabric was covered on both sides with the TK-1598 multi-protective fabric. The dimensions of the heat sinks corresponded to the dimensions of the thermoelectric modules. These heat sinks dissipate heat both by evaporation and convection. An important part of the clothing is the electronic controller that allows you to control the electrical power supplying the thermoelectric modules, which is possible in two ways. The first mode is manual control, which involves the user directly setting the value of the supplied power. The second mode is automatic control, where the appropriate power is derived based on the temperature from the undergarment microclimate sensor and the WBGT from the microclimate meter. Regardless of the control mode, the controller supplies the thermoelectric modules alternately in two phases. The power determined as described above is applied in the “active” phase. On the other hand, in the “rest” phase, the power is constant at a low value unless an even lower one is momentarily dictated by the automatic control. The duration of each phase is 60 s.
To counteract heat load effects, taking into account the real working conditions in glassworks, cooling should start before WBGT reaches 28 °C. In the developed system, the reference value of WBGT, which, if exceeded, results in the activation of the thermoelectric modules, was set to 24 °C.
The automatic control algorithm involves two regulators. The first regulator is a proportional derivative (PD), one based on the locally measured undergarment temperature. Its reference temperature can be increased or decreased by the user with two buttons on the controller’s case, in order to adjust it to the user’s preferences. The second regulator is a proportional one based on the WBGT index measured by the single microclimate meter and received through the communicator module. The reference WBGT is invariable at 24 °C. The proportional coefficient is set so that the regulator commands the maximum TEM supply power when the reference is exceeded by 2 °C and the command from the temperature regulator is zero. The command outputs from the two regulators are added arithmetically, yielding a new value for the TEM supply power.
The TEM supply power is regulated by a separate proportional regulator. If neither an up-to-date undergarment temperature nor a WBGT reading is available, the controller’s output is set to zero. The user can also manually switch the controller to a direct power control mode where undergarment temperature and WBGT measurements are ignored and the user directly sets the TEM supply power with buttons.
2.2. Testing Methodology
2.2.1. Research Apparatus
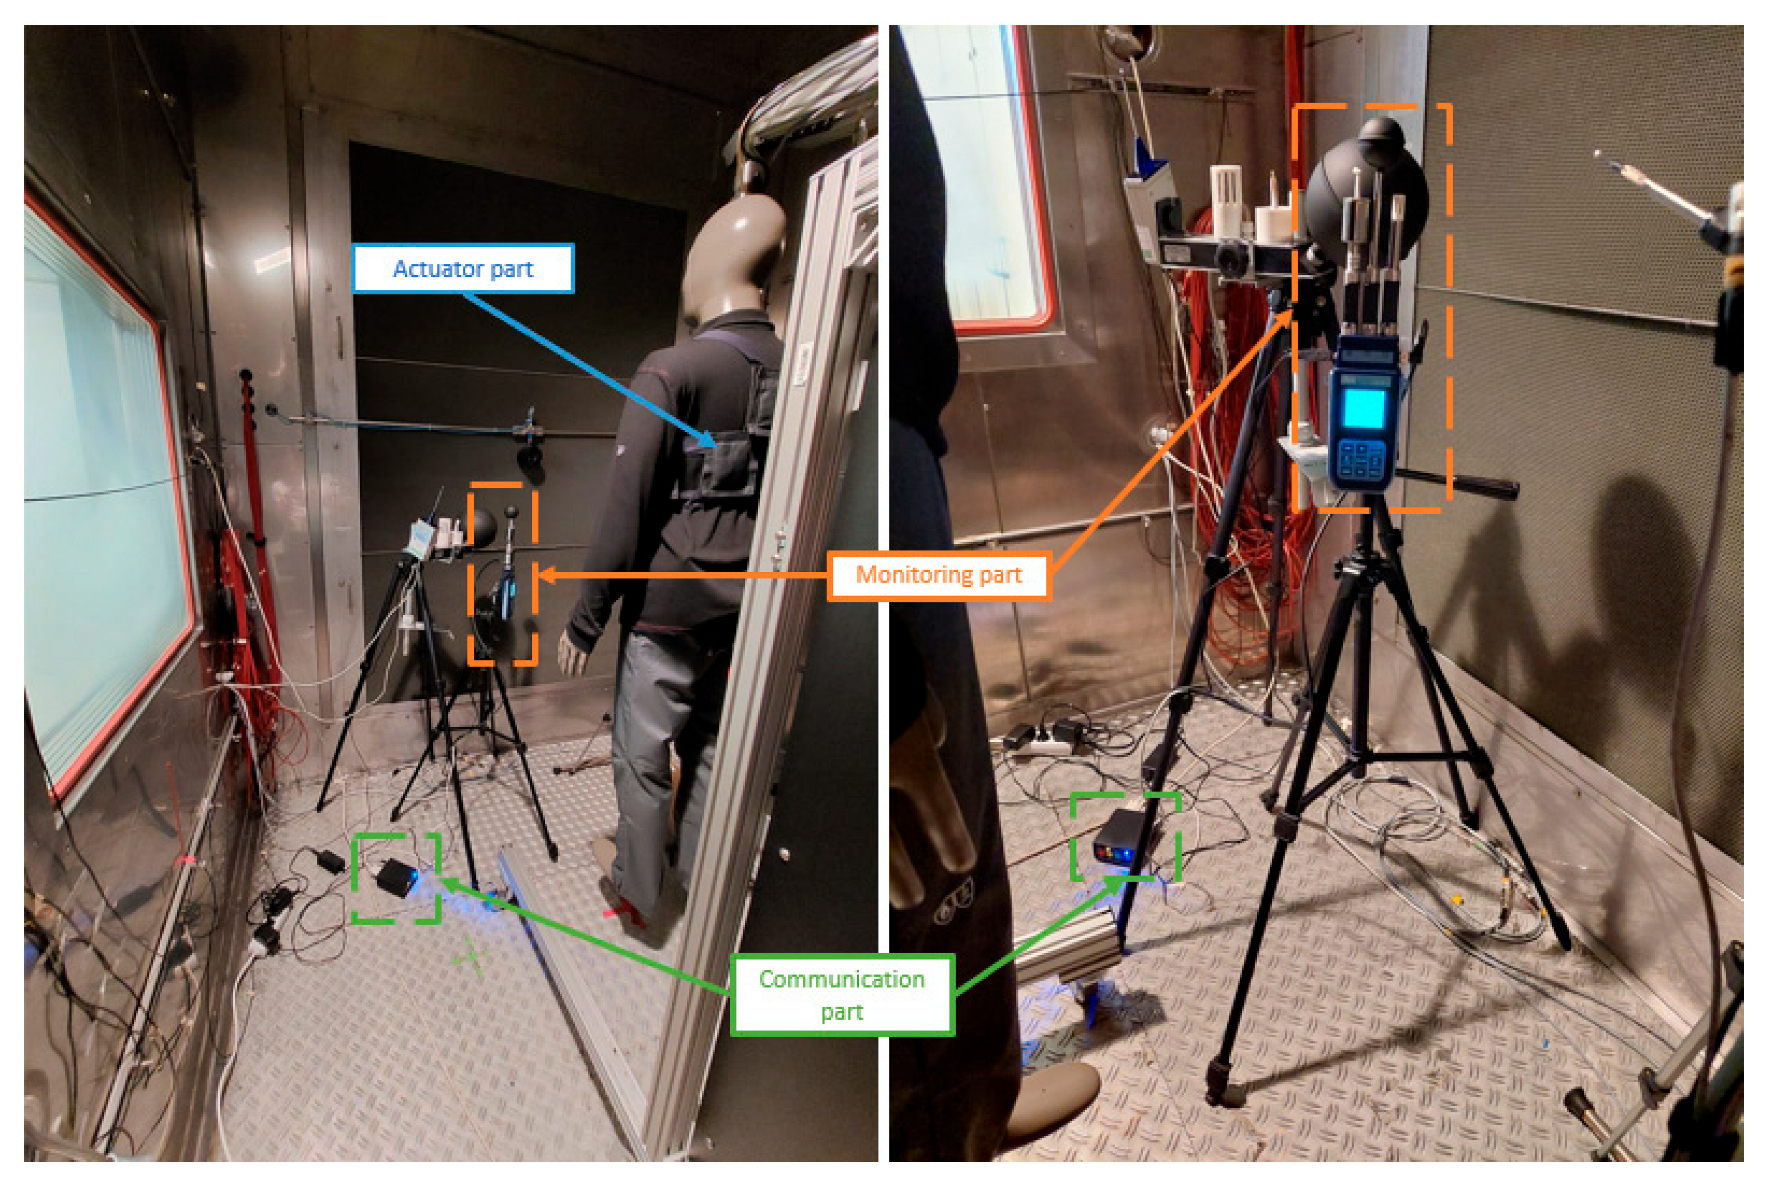
Functional tests of the developed system were conducted in a microclimate chamber using a thermal manikin. A walk-in chamber type WK23′ (Weiss, Buchen, Germany) that could produce air temperatures ranging from −40 °C to +70 °C, with a horizontal air flow, was used.
A Newton-type thermal manikin (Measurement Technology Northwest, Seattle, WA, USA) was applied, composed of 34 segments, and it was positioned so that it faced the air flow. The manikin operated in its constant shell temperature mode with a regulation accuracy of 0.01 °C. On the other hand, heat flux densities from the individual manikin segments were varied and automatically adjusted so as to maintain the constant shell temperature; these flux densities were then measured with an accuracy of 0.1 W/m2.
To validate the results from the mobile microclimate meter that was part of the developed system, WBGT was also measured using an MM104 calibrated professional microclimate meter (Ekohigiena, Poland), together with calibrated probes for air temperature (with an accuracy of 0.01 °C), relative humidity (with an accuracy of 0.01%), air flow velocity (with an accuracy of 0.01 m/s), black globe temperature (with an accuracy of 0.01 °C), and natural wet bulb temperature (with an accuracy of 0.01 °C).
2.2.2. Research Conditions
The tests were conducted in the microclimate chamber at air temperatures ranging from 20 °C to 35 °C, depending on the applied procedure and the stage of tests, and a relative humidity of 65%, in a steady state. The air velocity was (0.4 ± 0.1) m/s. The thermal manikin was dressed in trousers used in glassworks, workplaces exposed to hot microclimates. The developed cooling clothing consisted of a long-sleeved shirt made of flame-retardant knitted fabric (depending on the test procedure; see
Table 1). The microclimate meter that was part of the developed system was placed close to the thermal manikin.
Figure 3 shows the developed model of the system during the tests.
2.2.3. Research Procedure
The tests were aimed at evaluating the functionality of the developed system. They were conducted in two stages, each one following a different procedure, as presented in
Table 1. To determine the effect of the cooling function, the system was tested with this function both on and off within each procedure.
The objective of Procedure 1 was to evaluate the effect of ambient temperature on the operation of the developed system, including the point of activation of the cooling function and the TEM supply power applied. The cooling clothing controller operated in its automatic mode, as described in
Section 2.1. As presented in
Figure 4, ambient temperature was increased by 5 °C every 1.5 h.
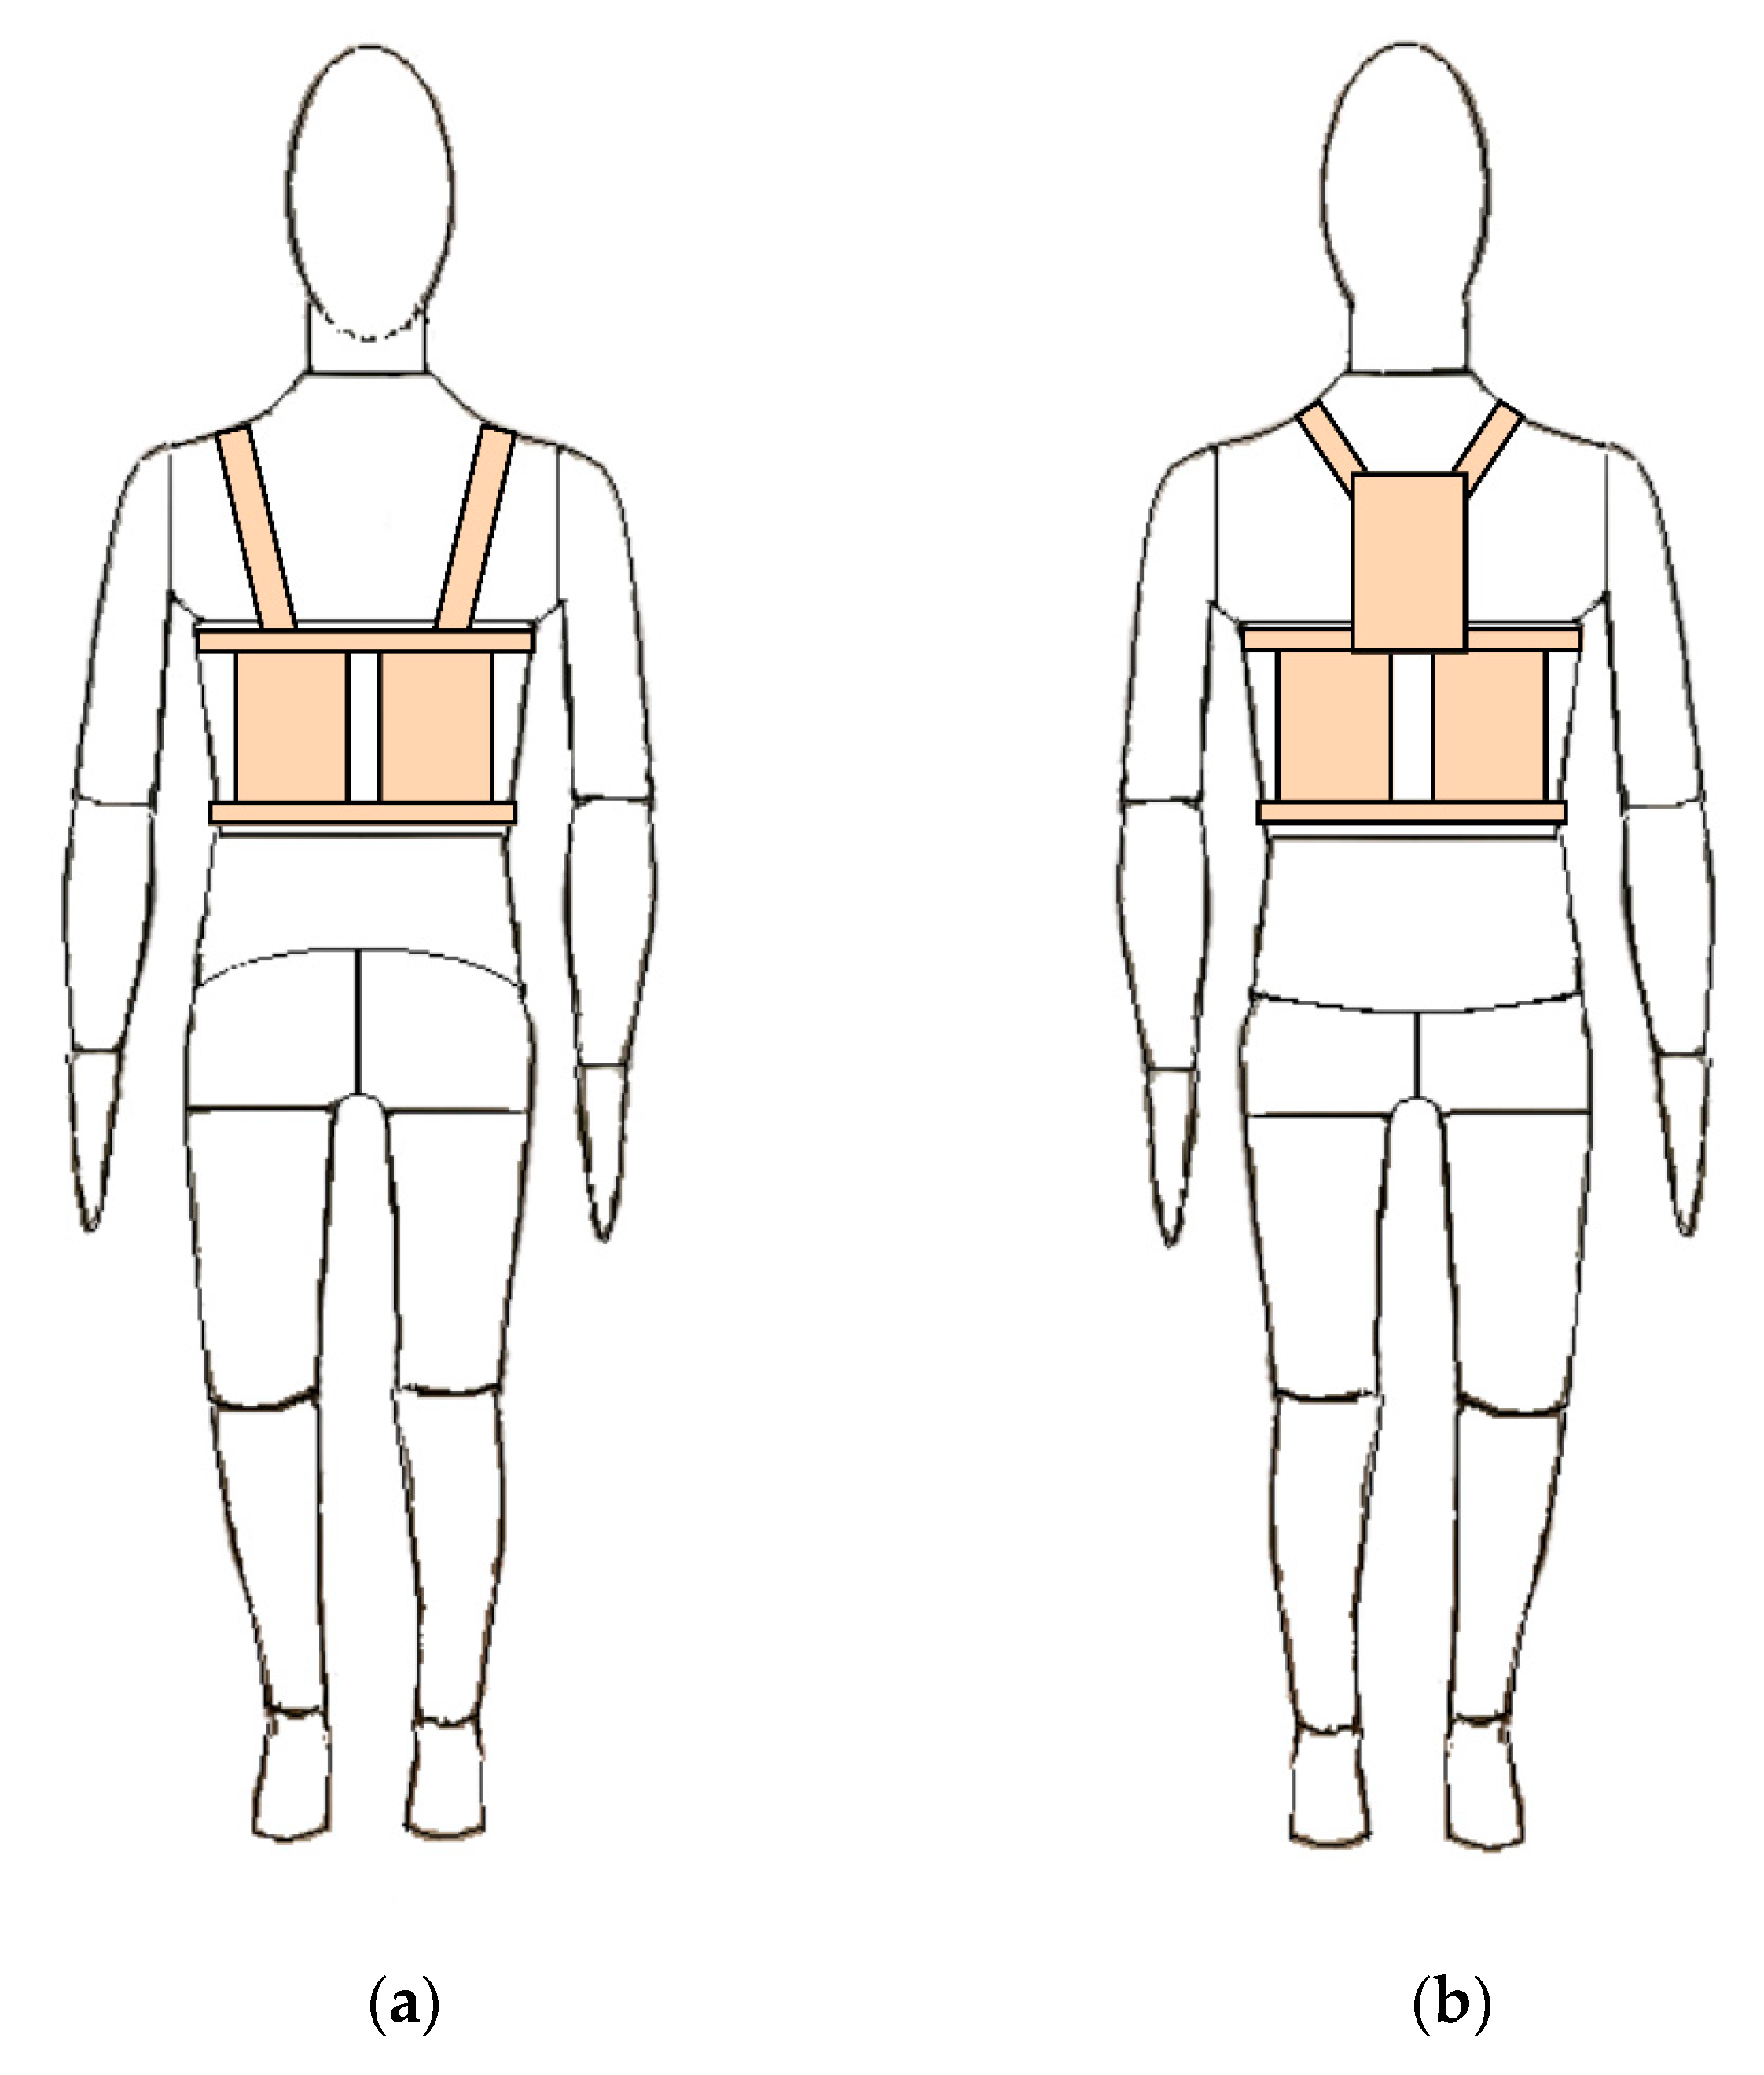
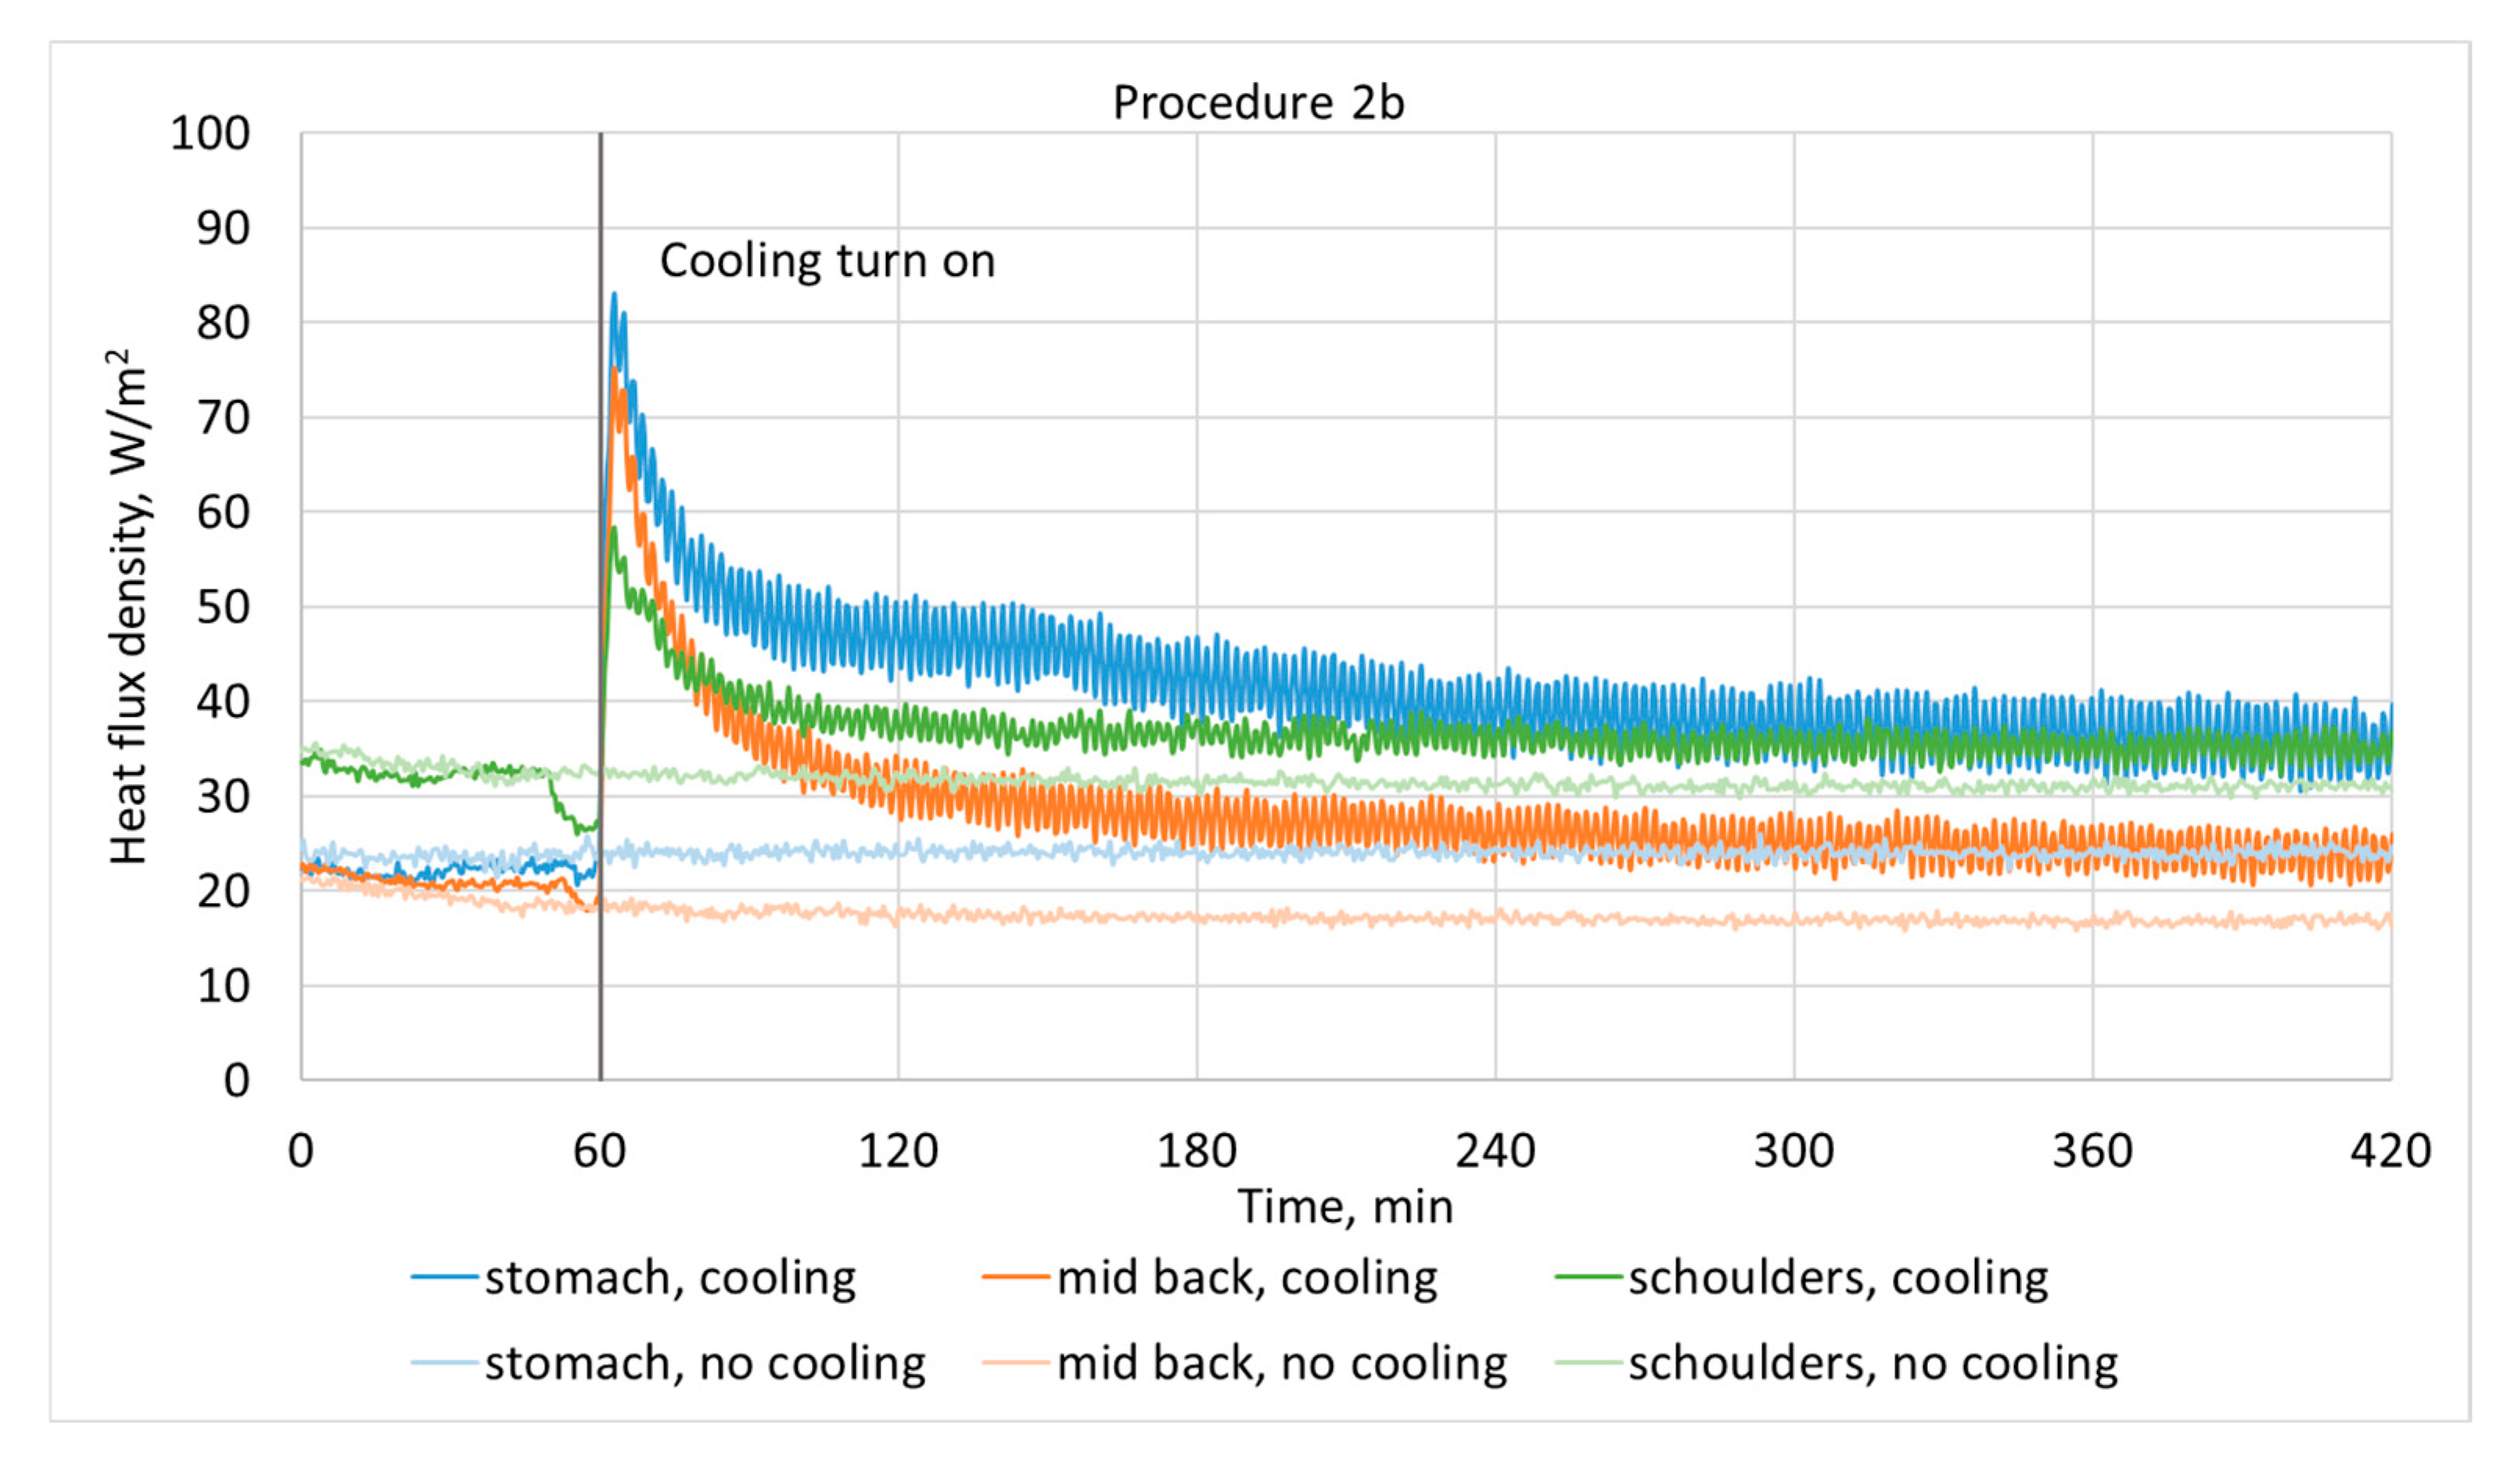
The aim of Procedure 2 was to assess the effectiveness of the cooling function in a constant thermal environment. The cooling clothing controller operated in its manual mode, with the TEM supply power set to its maximum value of 1.5 W per module (thus, we used 10.5 W in total). This procedure had two variants: with the cooling garment applied over the long-sleeved shirt (Procedure 2a) and applied directly to the manikin’s surface (Procedure 2b).
The constant temperature of the thermal manikin’s shell was set at 34 °C. After reaching a steady state, the local values of heat loss flux densities on selected manikin segments were recorded. The segments chosen were those directly affected by cooling: stomach, shoulders, and mid-back. The coverage of the thermal manikin’s segments by the cooling clothing is shown in
Figure 5.
During tests, the parameters measured by the developed system itself were also recorded, including the TEM supply power and the WBGT. The latter quantity was also measured by the professionally calibrated microclimate meter.
3. Results
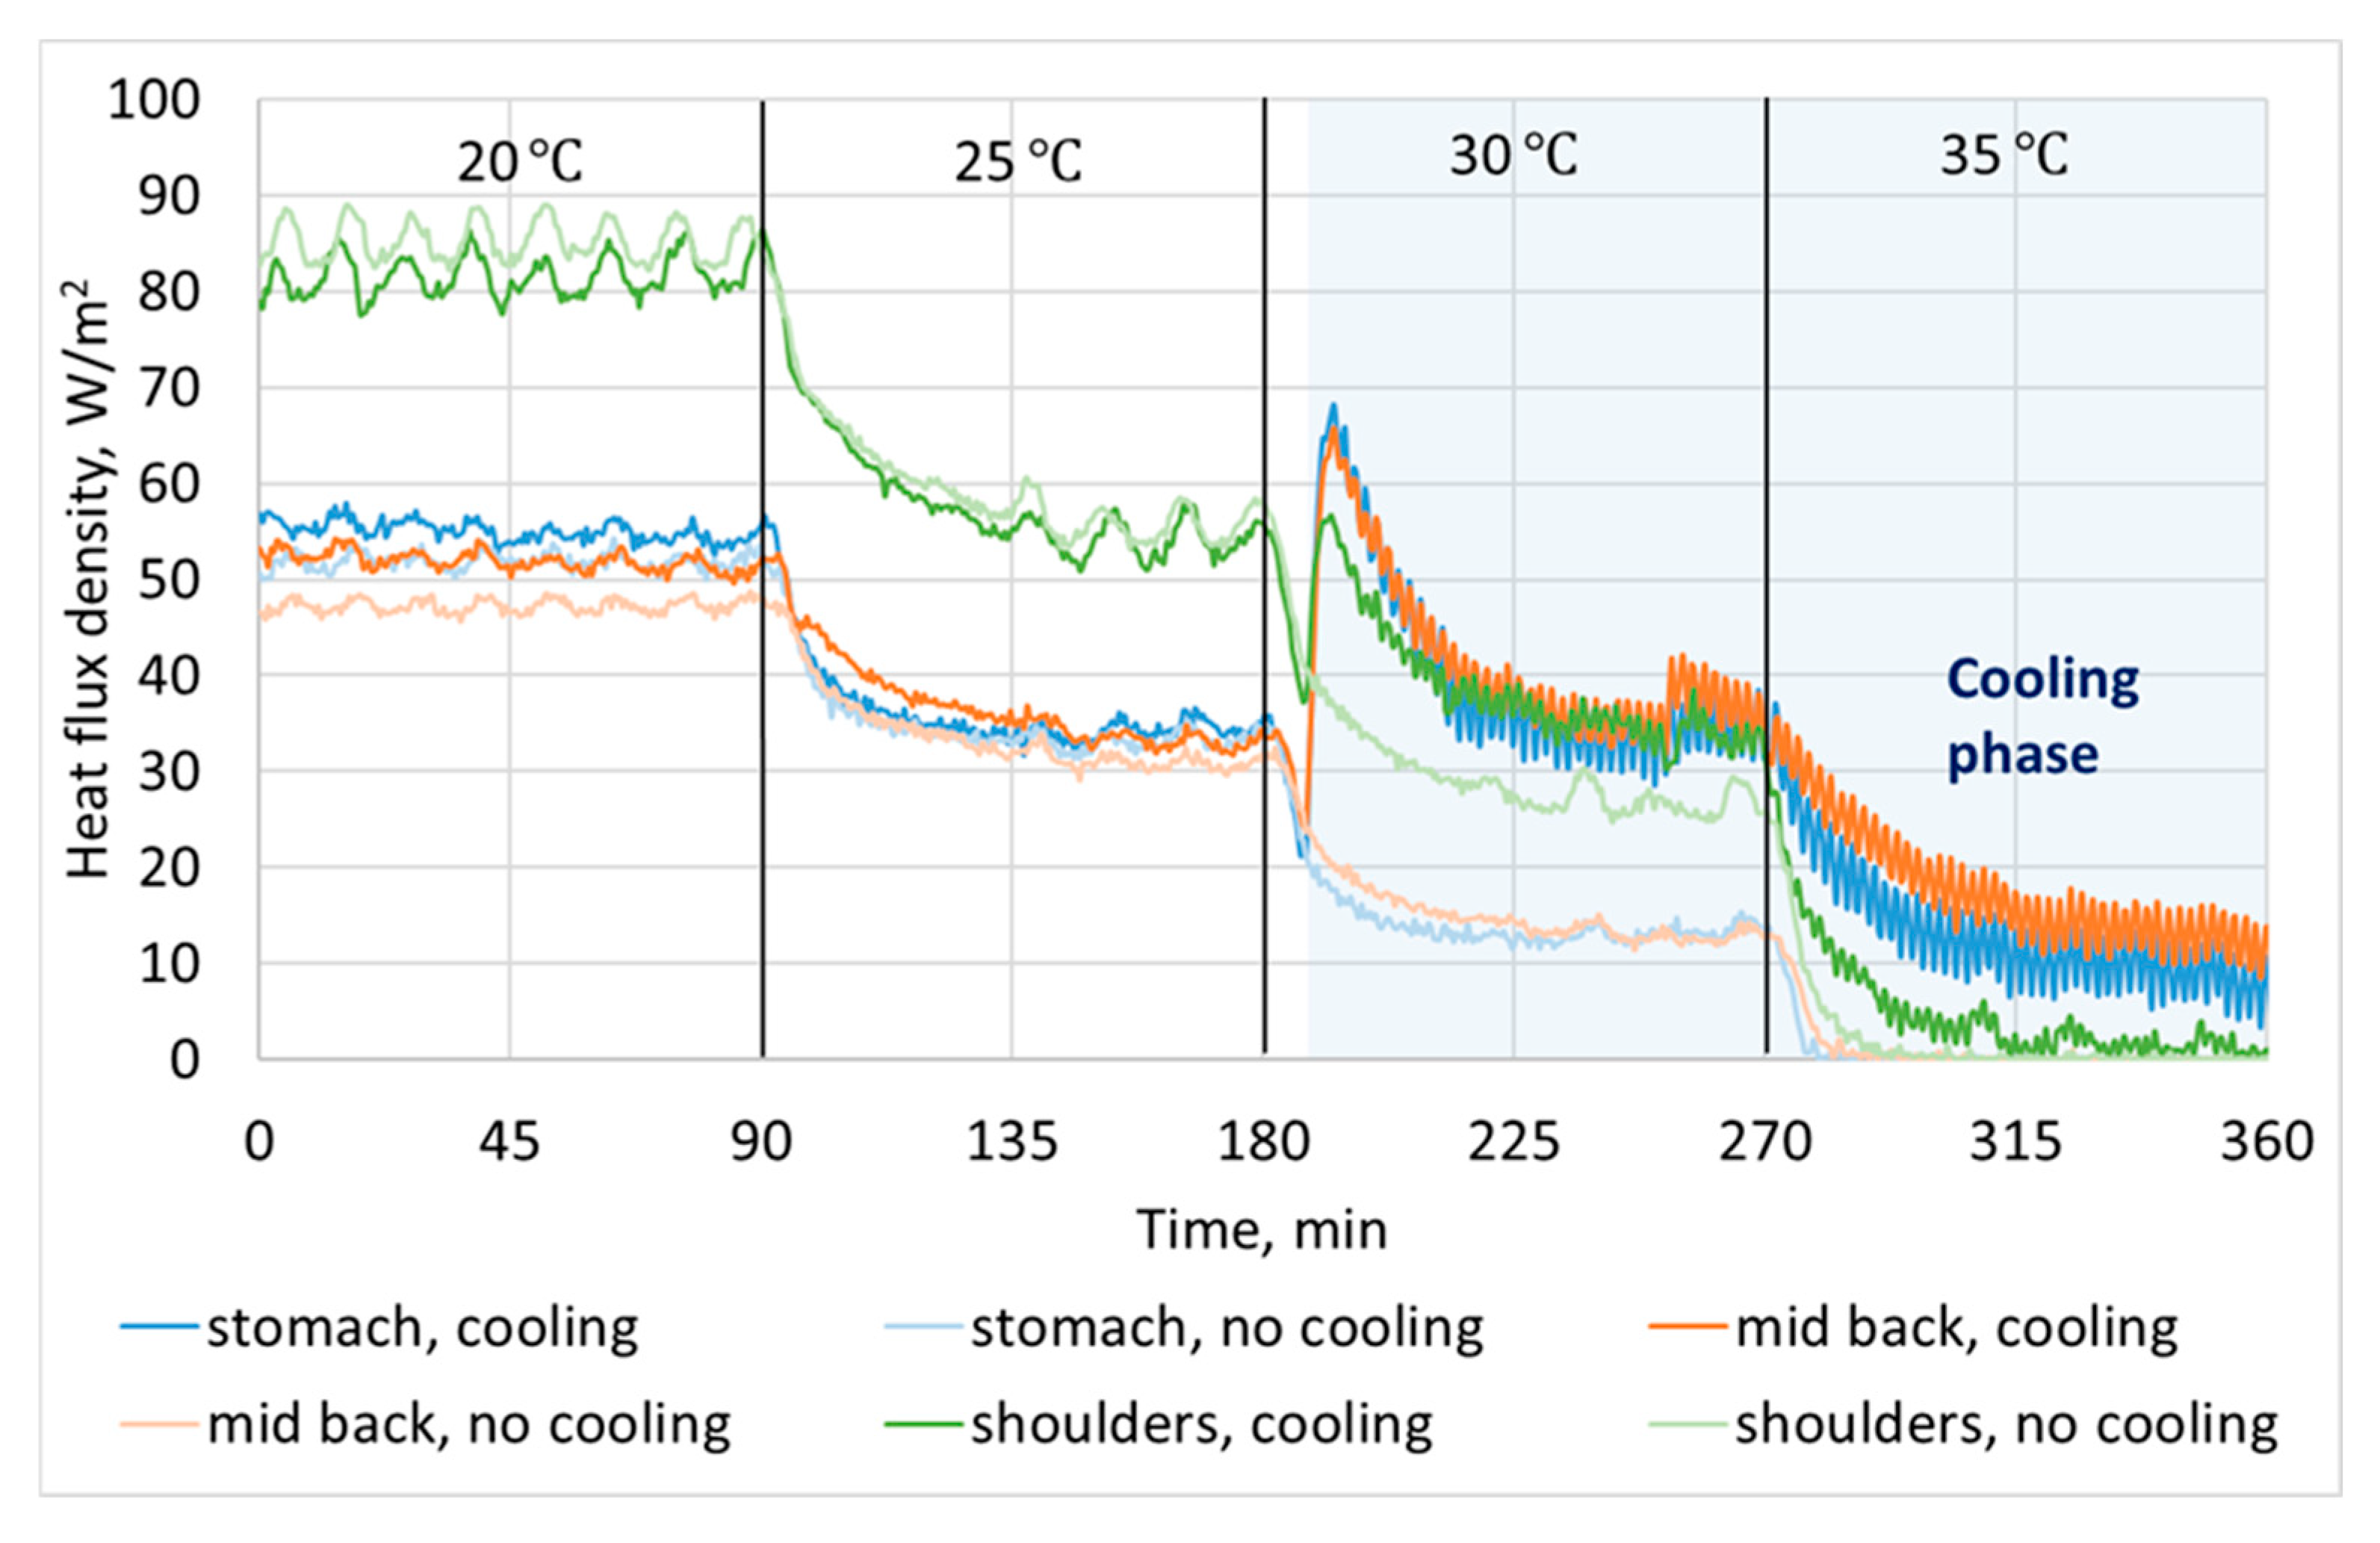
Figure 6 shows heat flux densities from the analyzed manikin segments, as obtained from Procedure 1. At ambient temperatures of 20 °C and 25 °C, turning the cooling function on did not affect heat flux densities. This was because, in these conditions, the reference WBGT value was not yet reached, so the thermoelectric modules were not supplied by the electronic controller.
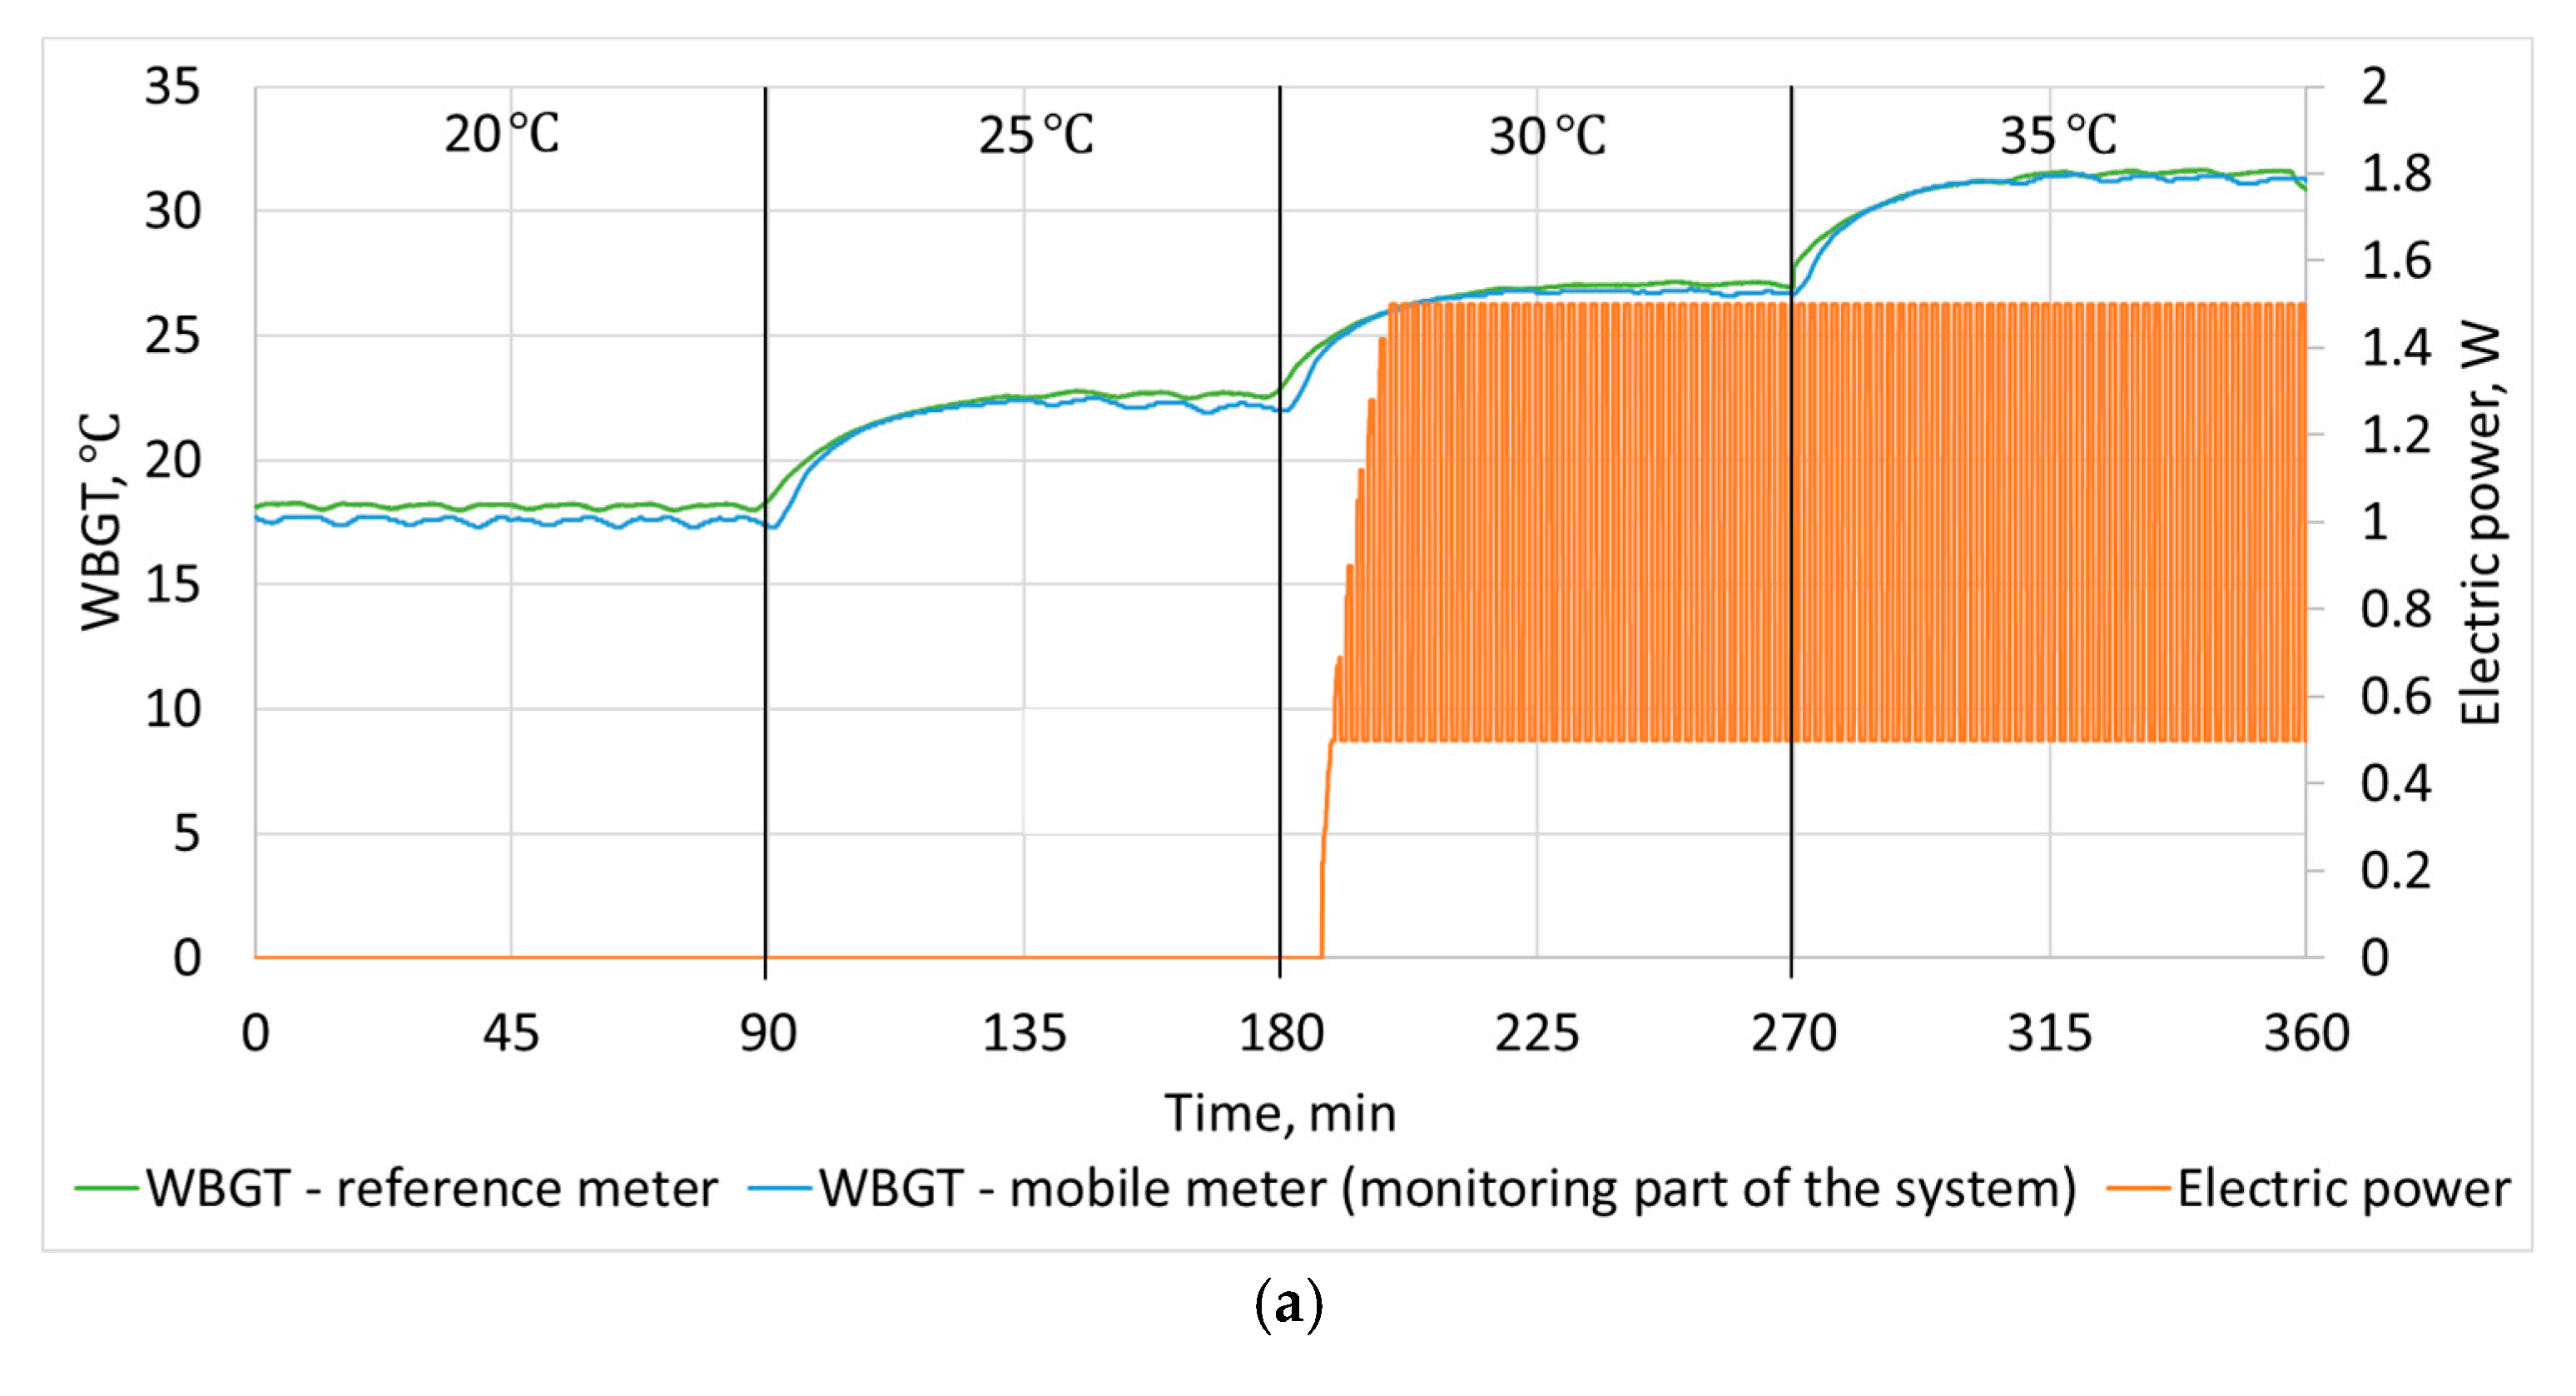
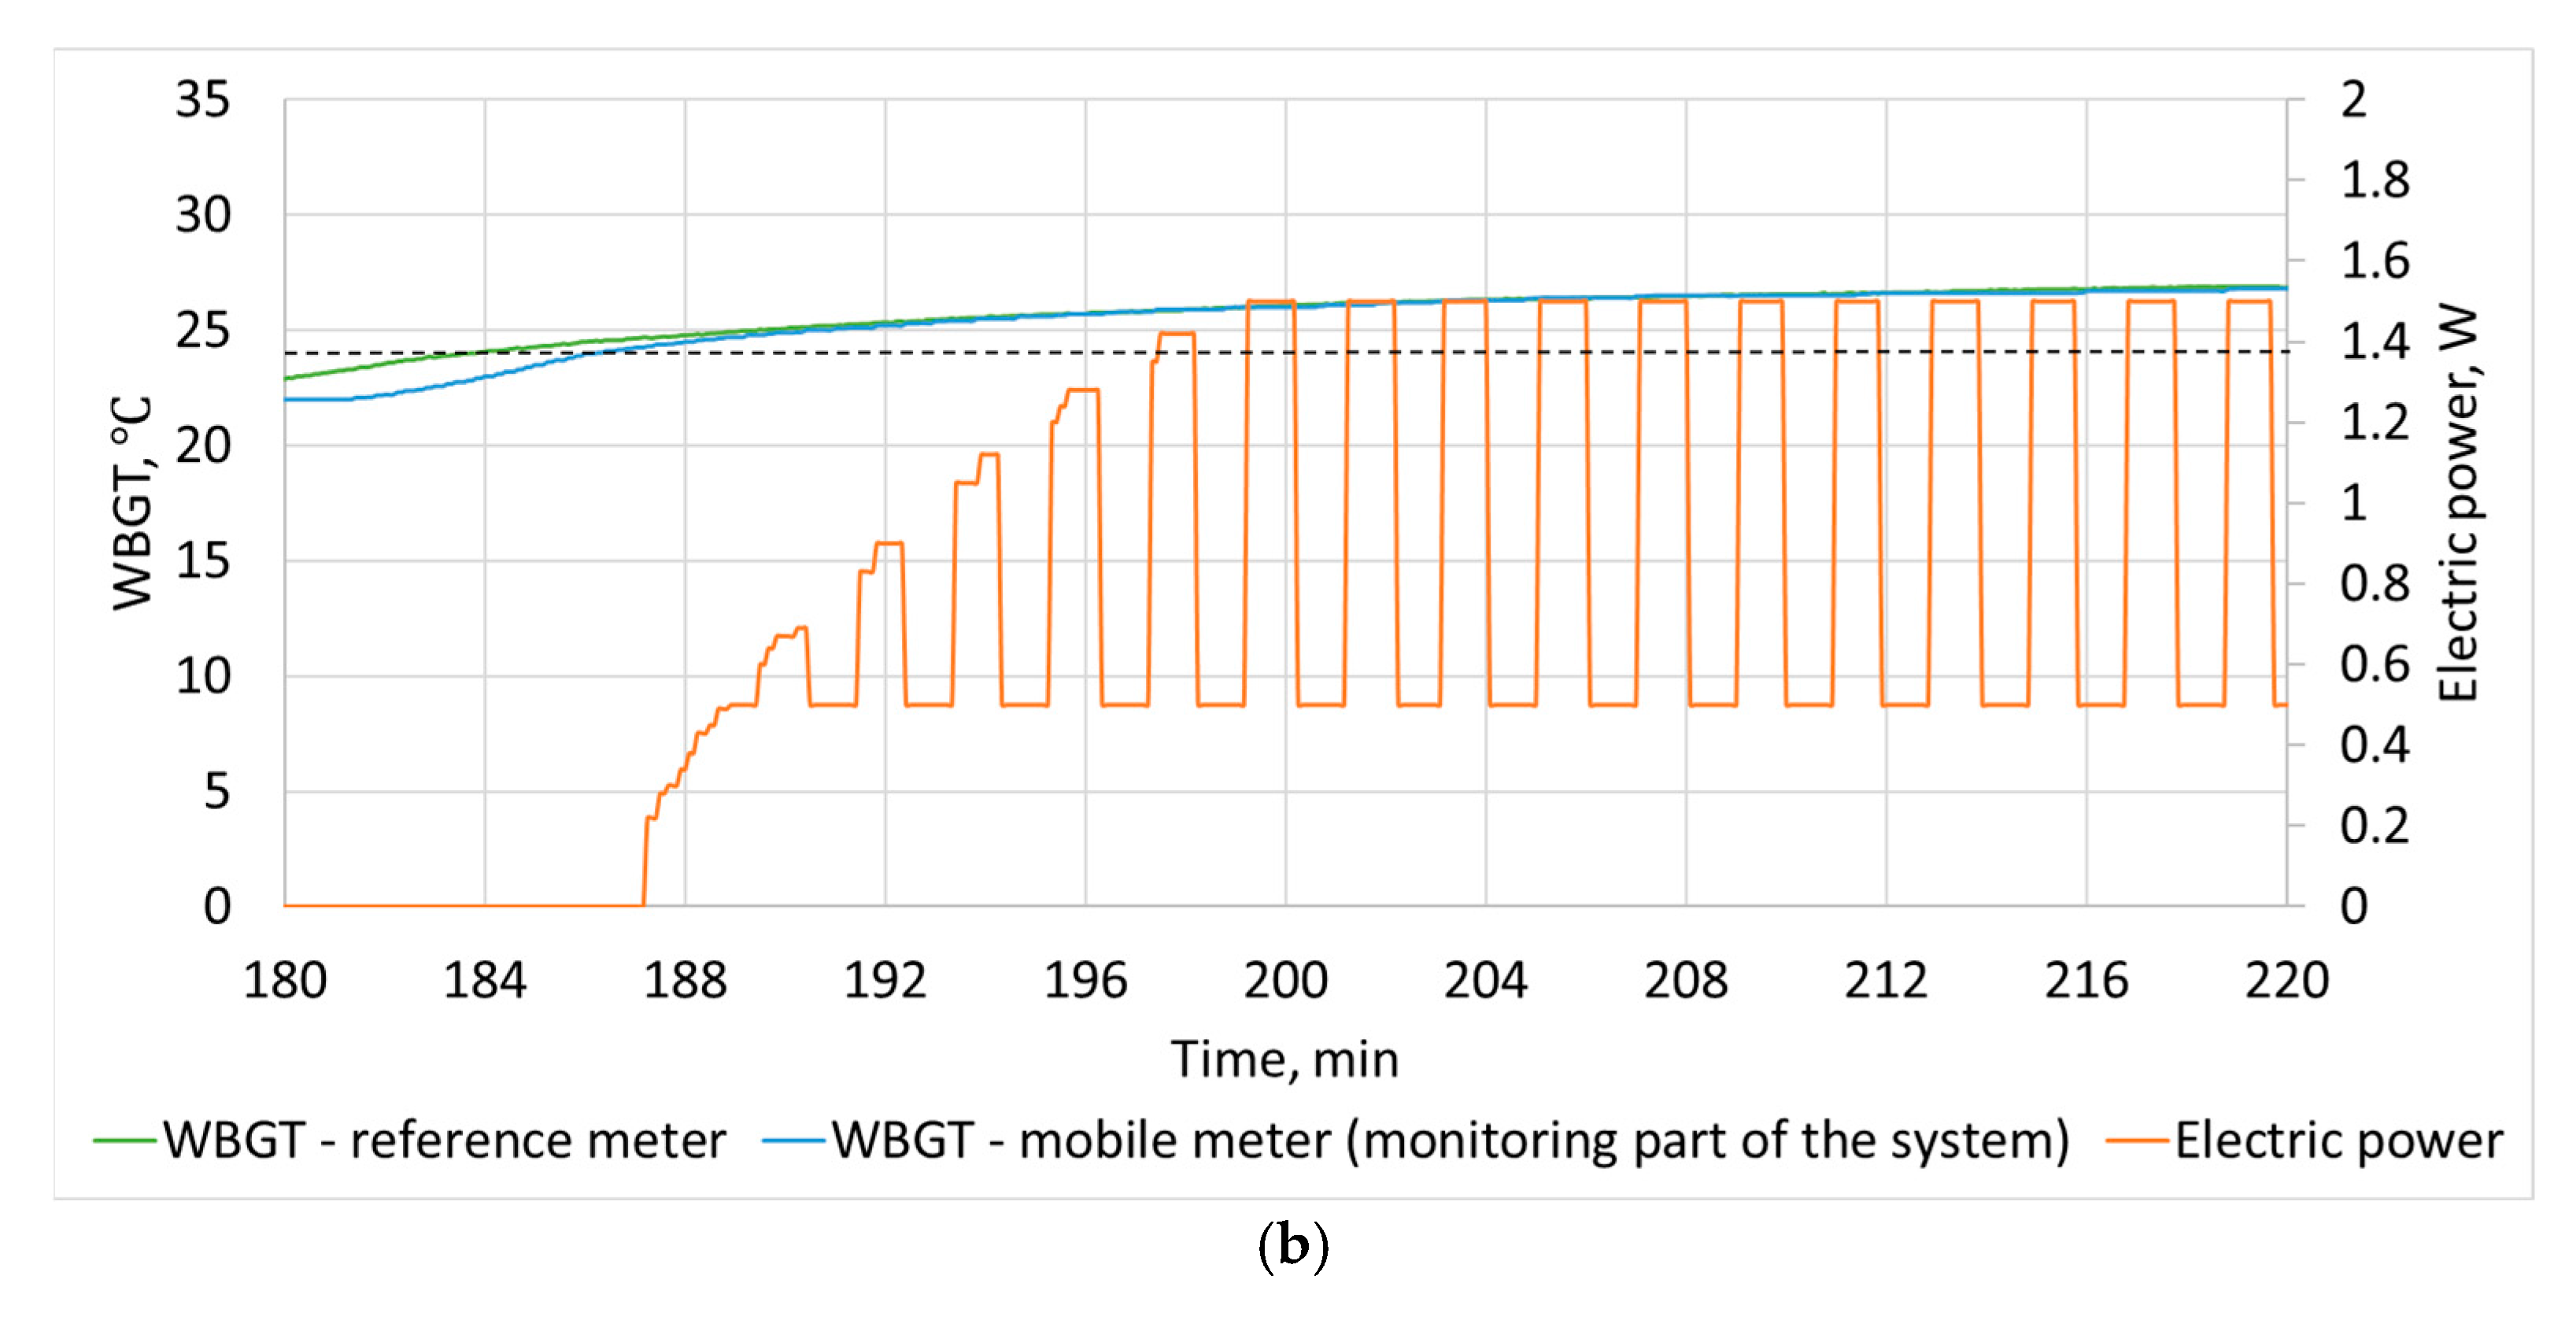
Figure 7 shows the time variation of WBGT, as measured by the monitoring part of the system, together with the TEM supply power applied by the controller. WBGT reached 24 °C around the 187th minute of the test, which is when the controller automatically activated cooling while adjusting the cooling intensity to the current conditions by gradually increasing the TEM supply power. In line with the algorithm described in
Section 2.1, the maximum supply power of 1.5 W was reached at about the 201st minute of the test, when the WBGT was 26 °C (
Figure 7b). In
Figure 7a, the readings of the mobile WBGT meter, which forms the monitoring part of the developed system, are also compared against those of the calibrated professional meter. This figure shows very good agreement between them, except for the lowest air temperature of 20 °C, where cooling is not needed. The mobile meter is therefore fit for application in the developed system.
At the activation point of thermoelectric cooling (around the 187th minute of the test), the heat flux density graph (
Figure 6) shows a clear jump in the heat flux density (by about 44 W/m
2) from the analyzed manikin segments. The extra heat flux density (which is the difference between heat flux with the cooling function on and heat flux with this function off) then gradually decreased until reaching about 30 W/m
2 for the mid-back and stomach segments at the end of the 30 °C interval. As the ambient temperature was increased to 35 °C, the heat flux from the manikin decreased even more, due to less efficient heat dissipation from the heat sinks by convection. It is worth noting, however, that the air temperature of 35 °C was higher than the set temperature of the manikin (34 °C). Consequently, with the cooling function off, the measured heat flux density from the manikin was 0 W/m
2, which represented the heating of the manikin (a negative effective heat flux that could not be measured by the apparatus used). On the other hand, with the cooling function on, the analyzed heat flux densities were still positive at about 15 W/m
2 for the mid-back and stomach segments, which shows that these segments were still effectively cooled.
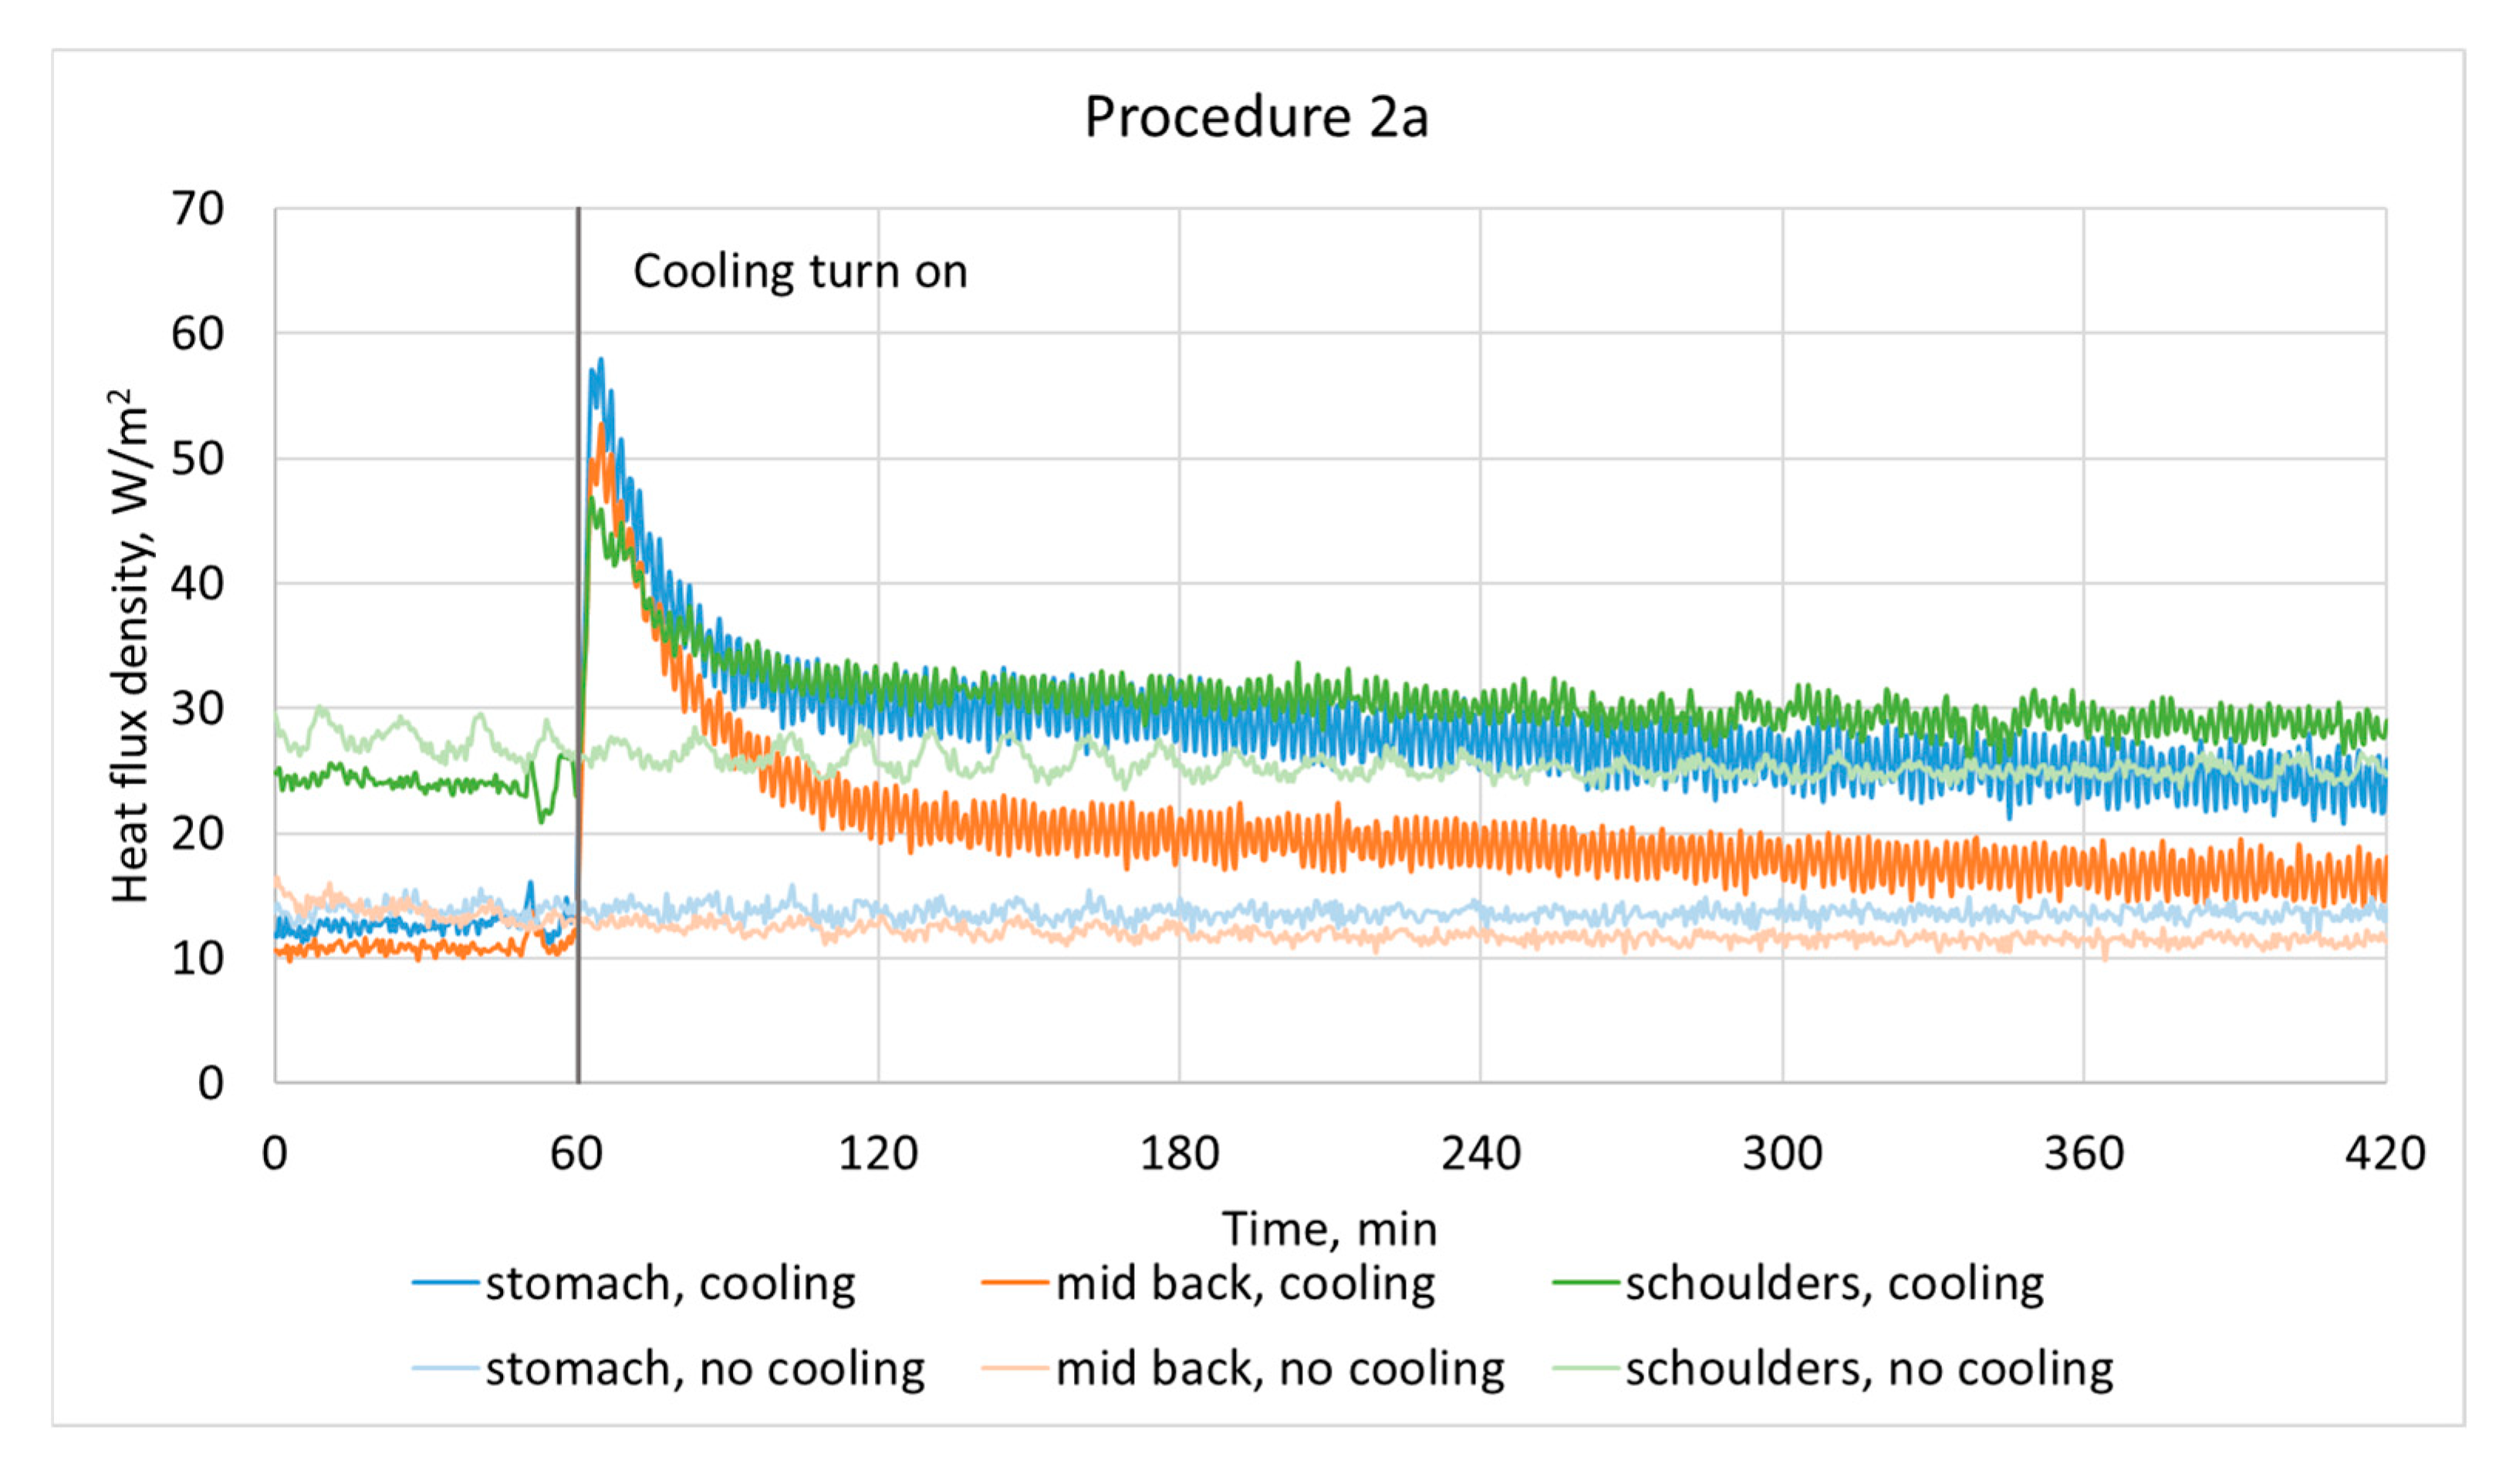
Figure 8 and
Figure 9 present heat flux densities from the analyzed manikin segments during tests conducted according to Procedures 2a and 2b. A greater increase in heat flux density from the thermal manikin due to the activation of thermoelectric cooling was observed with Procedure 2b (where no shirt was applied) than with Procedure 2a (where the cooling clothing was applied over the shirt). In particular, at the beginning of the test, the extra heat flux densities obtained with Procedure 2b were approximately 59 W/m
2, 55 W/m
2, and 31 W/m
2 for the stomach, mid-back, and shoulder segments, respectively, while they were approximately 44 W/m
2, 40 W/m
2, and 23 W/m
2, respectively, with Procedure 2a. In both cases, however, the heat flux density from the manikin at the end of the test was higher with the cooling function on than with this function off. These results confirm the operability of the cooling system for at least 6 h. Nevertheless, cooling intensity decreased over time. By the end of the experiment, the strongest cooling effect was observed in the stomach segment, where the extra heat flux density was approximately 14 W/m
2.
4. Discussion
Up to now, several attempts at monitoring workers’ safety in hot microclimates have been made. Kim et al. [
17] focused on an overall heat load assessment by means of a smart band, achieving an error of less than 1%. Buller et al. [
18] discussed real-time physiological status monitoring for exertional heat illness mitigation within a military context. New sensors [
19] and algorithms [
20,
21] were presented for monitoring purposes such as the estimation of core temperature based on heart rate measurements. However, in relation to prevention, these solutions only provided immediate medical alerts. In contrast, the results presented in
Section 3 demonstrate that the novel system presented in this work can provide both heat load monitoring and real-time active reduction of related risks by conducting extra heat out of the human body, also under air temperatures higher than body temperature. A similar approach was also verified by an analysis performed by Antwi-Afari et al. [
22], who focused on sensing and warning-based technology applications to improve occupational health and safety.
Significant progress in thermoelectric module technology, including the development of flexible TEMs, has enabled their application in clothing (mainly vests) for cooling purposes. In [
23,
24,
25,
26], the efficiency of this technology in reducing thermal load in hot microclimates was demonstrated. The proposed solutions included, e.g., maintaining the skin temperature within its thermal comfort zone, tested in a hot microclimate (40 °C) [
26]. The efficiency evaluation of these solutions was usually based on human trials [
27], while thermal manikins were applied in only a few works [
28]. Lou et al. [
28] indicated a total cooling power of 15.5 W, which is a similar level to what was achieved with the system presented in this work. The importance of an appropriate testing protocol while using thermal manikins to evaluate cooling clothing efficiency was highlighted by Kim et al. [
29]. They showed that, depending on the testing method, the efficiency of the same cooling vest varied from 1.0 W to 114.8 W. This means that direct comparison of cooling vests using different thermal manikins may be almost impossible. Nevertheless, proper selection of test conditions corresponding to the predicted use conditions is necessary.
In the developed solution, cooling intensity decreased over time, as reflected in the decreasing heat flux density. This effect is due to the operating principle of the heat sinks used. Some heat is conducted to the heat sink due to the initially low temperature of the water contained in the superabsorbent fabric. The accumulated heat is partly dissipated to the environment by evaporation, which reduces the amount of water in the fabric, decreasing the heat absorption capacity.
5. Conclusions
In this work, a new system for monitoring and prevention of thermal load has been presented. Although it is dedicated to glassworks, its potential area of application is much wider. The system includes three parts: the monitoring part, which is a commercial mobile microclimate meter; the actuator part, which consists of cooling clothing with thermoelectric modules and a dedicated electronic controller; and a communication part, which is a separate module responsible for data transmission between the monitoring and actuator parts. Thanks to real-time WBGT monitoring in the work environment and the cooling function, it is possible to actively prevent the worker from thermal overload.
In addition, a unique methodology for evaluation of the system’s functionality was proposed, allowing for complex evaluation of both the system’s functionality and cooling efficiency. It involves using a thermal manikin in a microclimate chamber. The tests performed showed that the system was able to conduct as much as 59 W/m2 (depending on the conditions) of extra heat from the body when WBGT exceeded a reference value. As compared to a calibrated professional microclimate meter, the mobile microclimate meter applied provides sufficient accuracy for this purpose. The system operated efficiently for at least 6 h. Nevertheless, the highest cooling intensity is observed at the beginning of the cooling process, which is due to the operation principles of the heat sinks used. Further research will be focused on increasing heat flux density, as well as making it more stable over time.
The developed system fits with the vision of a smart working environment where humans are supported by technologies that monitor their safety and actively limit the occupational risk by means of smart personal protective equipment. It is also in alignment with the Industry 5.0 concept, where the application of technologies such as the Internet of Things is focused on human needs.
