Featured Application
From a clinical perspective, the proposed fast-track pathway is specifically designed to address the needs of complex patients, who typically account for a significant proportion of resource consumption in emergency departments. By targeting this high-impact population, the pathway contributes to optimising care delivery, reducing delays, and ensuring that resources are utilised more efficiently. This approach not only enhances patient outcomes but also mitigates operational challenges, making it a valuable tool for improving the overall efficiency of emergency services.
Abstract
Emergency department overcrowding disproportionately affects complex patients, such as older adults and those with comorbidities, who consume significant resources and experience prolonged delays. This study integrates process mining and predictive simulation to identify key factors influencing length of stay and to propose a data-driven solution: a tailored fast-track pathway for high-risk patients. Using data from 94,489 emergency episodes, a predictive formula was developed based on clinically relevant variables, including age (>65 years); triage levels (II and III); frequent emergency department visits; need for mobility aids; and specific reasons for consultation such as dyspnea, abdominal pain, and poor general condition. Simulation results demonstrated that implementing this fast-track pathway reduces length of stay by up to 21% and emergency department saturation by 35%, even with minimal resource allocation (five beds). The manual predictive formula showed comparable prediction performance to machine learning models while maintaining transparency and traceability, ensuring greater acceptability among healthcare professionals. This approach represents a paradigm shift in emergency department management, offering a scalable tool to optimise resource allocation, improve patient outcomes, and reduce operational inefficiencies. Future multicenter validations could establish this model as an essential component of emergency department management strategies.
1. Introduction
Emergency department (ED) visits in Spain have seen a significant increase, reaching 31.15 million in 2022. This figure represents the highest recorded since 2010, highlighting a growing demand for emergency healthcare services [1]. The sharp rise in ED visits has a ripple effect on various aspects of the healthcare system, including patient outcomes, the overall cost of care, and the workload of healthcare professionals [2,3]. These challenges underscore the importance of efficient time management in ensuring the delivery of high-quality care [4,5,6]. A crucial aspect of this growing demand is the impact on complex patients [2], a group that includes older adults, individuals with multiple comorbidities, and those reliant on mobility aids [7]. These patients face unique challenges in the ED, often experiencing longer waiting times and requiring more extensive resources to address their needs [7]. As a result, their presence contributes significantly to the congestion and operational strain of emergency departments [7]. Addressing the needs of such complex patient populations is essential for improving both individual outcomes and the overall efficiency of emergency care systems. Tailored interventions, designed specifically for these vulnerable groups, can help mitigate delays, optimize resource allocation, and ultimately enhance the quality of care provided in emergency settings [8].
ED overcrowding poses a significant and ongoing problem for healthcare systems worldwide. Length of stay, the time from patient arrival to discharge, is a key indicator of ED congestion. Increased LOS is linked to poorer patient outcomes, including higher rates of illness and death, and reduced satisfaction for both patients and staff [9,10,11]. Because extended LOS can lead to treatment delays, increased complications, and more patients leaving without being seen [2,12,13], it serves as an indirect measure of quality of care, having healthcare systems, including Spain’s, often aim to discharge or admit at least 90% of ED patients within 4 h [13]. Elderly patients (65 and older) are particularly vulnerable, with prolonged LOS increasing their risk of adverse events like delirium [14,15]. Factors such as care flows, patient characteristics (e.g., age, comorbidities, triage level), or the reason for consultation influence prolonged LOS [16,17,18]. Advanced age, high triage levels (II or III), arrival by stretcher or ambulance [19,20], chronic disease, hemodynamic instability, and functional deterioration all contribute to greater complexity in care and increased resource utilisation. Identifying and treating these patients as early as possible is crucial to mitigating delays and complications [21,22,23].
One common strategy to address ED overcrowding is the implementation of fast-track (FT) pathways, designed to expedite care for patients with less urgent needs, specific complaints, or defined care pathways [24,25]. Although the literature typically associates the concept of ‘fast track’ with the treatment of less complex patients, we propose a novel approach by introducing the idea of ‘pre-admission’ for more complex cases. While we acknowledge that this terminology might lead to confusion, as these patients often require longer stays, we chose the term ‘fast track’ to emphasise the fact that their pre-admission process is expedited, saving critical time for their recovery.
While FTs have demonstrated success in improving overall ED throughput for low-acuity patients, their effectiveness for complex patients at high risk of prolonged LOS remains limited [26]. Existing FT protocols often lack the flexibility to adapt resource allocation to the specific needs of these patients, potentially leading to bottlenecks and suboptimal outcomes. Triage nurses, based on their clinical experience and initial assessment, can often identify patients at risk for prolonged LOS, considering factors such as the patient’s overall appearance, level of distress, and perceived need for immediate intervention. However, this subjective assessment is not always consistently applied or effectively translated into resource allocation decisions [27].
To address these limitations, this article proposes a novel, algorithm-driven approach to triage, using a predictive model to identify patients at high risk of prolonged LOS and to direct them to a tailored fast-track pathway. Our predictive model will be trained on historical data, using routinely collected triage information (e.g., age, vital signs, medical history) to predict the probability of a patient exceeding a 4 h LOS threshold. Patients with a predicted probability above a pre-defined threshold will be considered “high risk” and will be eligible for the targeted FT pathway. Triage nurses will receive alerts generated by the predictive model, providing them with actionable information to guide resource allocation and pathway assignment. This approach aims to optimise resource allocation and mitigate bottlenecks, especially those related to test result turnaround times.
This study will contribute to the field by providing a data-driven framework for optimising ED resource allocation and improving outcomes for complex patients.
The rest of the paper is followed by the Materials and Methods Section, which details the research’s methodology, including the use of retrospective data from a hospital in Valencia, the specific process mining algorithms applied, and the metrics used to evaluate the new protocol. The Results Section then presents the quantitative findings, demonstrating that the implementation of the process mining-designed Fast Track successfully reduced patient stay durations and decreased saturation levels in the emergency department. In the Discussion, the authors interpret these results, highlighting the practical benefits of their approach, comparing their findings to existing literature, and addressing the study’s limitations. Finally, the Conclusions section summarizes the key takeaway—that process mining is an effective tool for improving ED efficiency—and outlines potential directions for future research in this area.
2. Materials and Methods
To gain a deeper understanding of patient flow and identify potential targets for intervention, we utilised interactive process mining technologies (IPM) [28], which uniquely incorporates healthcare professionals (HCPs) into the process learning methodology. Unlike traditional approaches, IPM not only discovers but also co-creates processes with HCPs, ensuring that the resulting interactive process indicators (IPIs) [29] are highly relevant, credible, and seamlessly integrated into their daily workflows.
2.1. Interactive Process Mining
In the IPM methodology, IPIs are defined as process representations designed to understand, measure, or evaluate the characteristics or evolution of a specific event or fact. These navigable models combine process mining techniques with domain-specific key performance indicators (KPIs) [30], offering a continuous, interactive, and comprehensible representation of real-world healthcare processes. For example, in emergency departments, IPIs can incorporate KPIs such as patient length of stay [31,32]. By integrating KPIs with process analysis, IPIs provide a holistic approach that not only identifies root causes but also delivers deeper insights compared to standalone KPIs.
The IPM methodology relies on Interactive Process Data Rodeos, a central component designed to build IPIs. A Data Rodeo is a highly collaborative, multidisciplinary process aimed at developing process indicators that objectively and comprehensively analyse, quantify, and qualify healthcare processes and their changes.
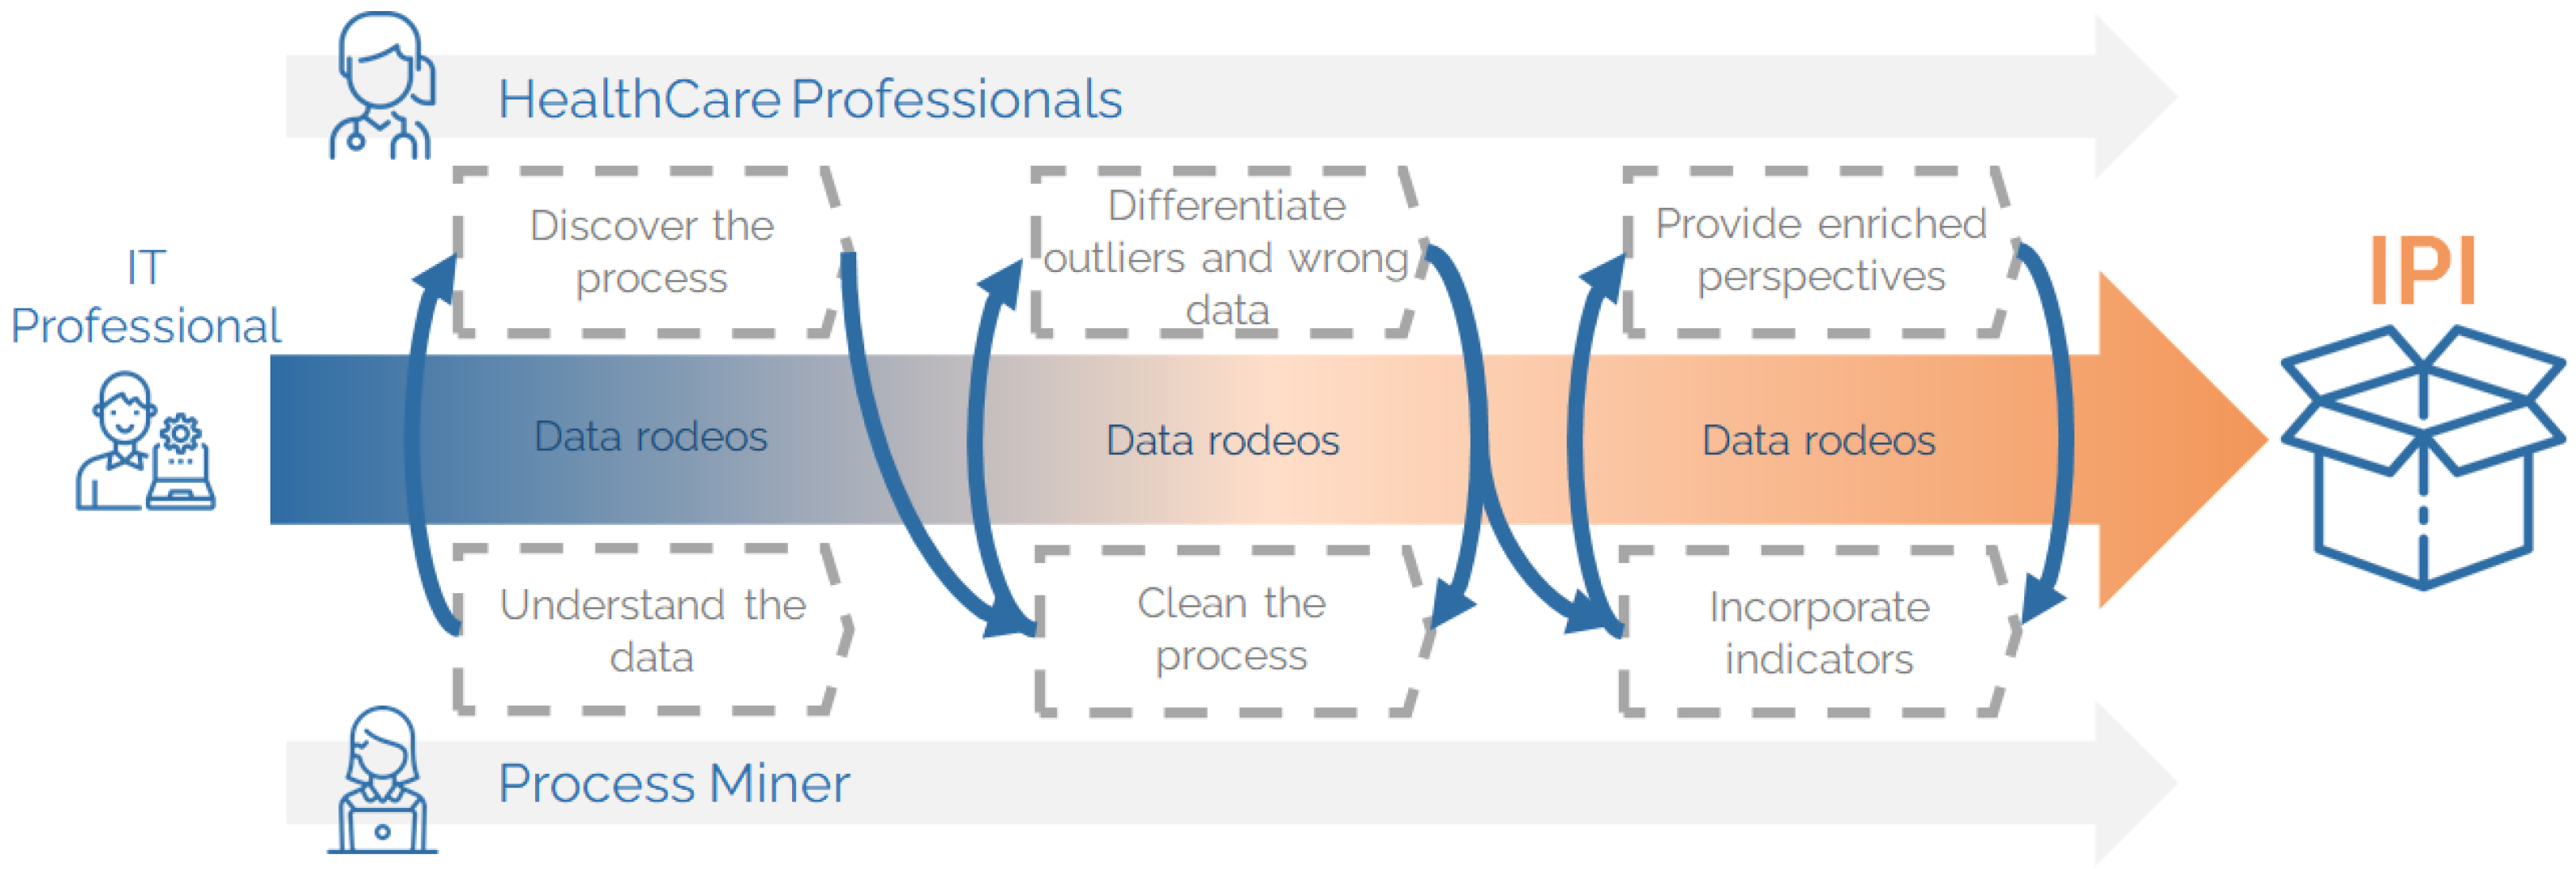
The IPM methodology unfolds in three key phases: Preparation, where the multidisciplinary team aligns objectives and defines research goals; Research, involving iterative Data Rodeos to develop the IPI. These iterative sessions (Interactive Process Data Rodeos or Data Rodeo) involve co-curating data, co-creating process indicators, and validating them through collaboration between HCPs and IT experts. Facilitated by interactive process miners (PM experts), these Data Rodeos are critical to the development of IPIs and the advancement of co-creation in healthcare process analysis [33]. Finally, it is the Production phase, where the finalised IPI is validated and utilised for analysis.
As illustrated in Figure 1, the Research phase includes multiple Data Rodeos, starting with data exploration to identify process steps and timestamps. This is followed by data cleaning, where collaborative efforts correct or exclude data that deviates from standard processes. Discarded data are revisited to distinguish between genuine outliers and errors, offering valuable insights. The resulting process representation is enriched with additional metrics, such as averages and medians. Finally, process mining enhancement techniques are applied to integrate indicators and develop a comprehensive representation, ensuring the generated IPI is both practical and insightful.
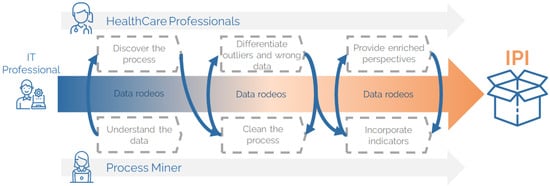
Figure 1.
Interactive process indicators of the emergency department.
2.2. Analysing Emergency Department Performance with Process Mining
To understand the specific drivers of ED overcrowding, we applied the IPM methodology to analyse patient flow and resource utilisation by evaluating the current performance of the emergency department, with a focus on determining the underlying causes of service saturation. With this in mind, an IPI of the ED was defined, following the IPM methodology with the Process Mining Application (PMApp) Toolkit [34]. To carry out this analysis, a multidisciplinary team was created and followed several Data Rodeos sessions until the IPI was totally defined, where information regarding the patient in relation to each of the steps that make up the process in the ED was collected. These steps were admission, triage, first attention, hospitalisation, and discharge destination, where triage and attention are divided into five levels according to the Manchester triage standard [35] and discharge destination into six possible destinations (home, voluntary discharge, exitus (when a patient passes away), hospitalisation, administrative admission, and others).
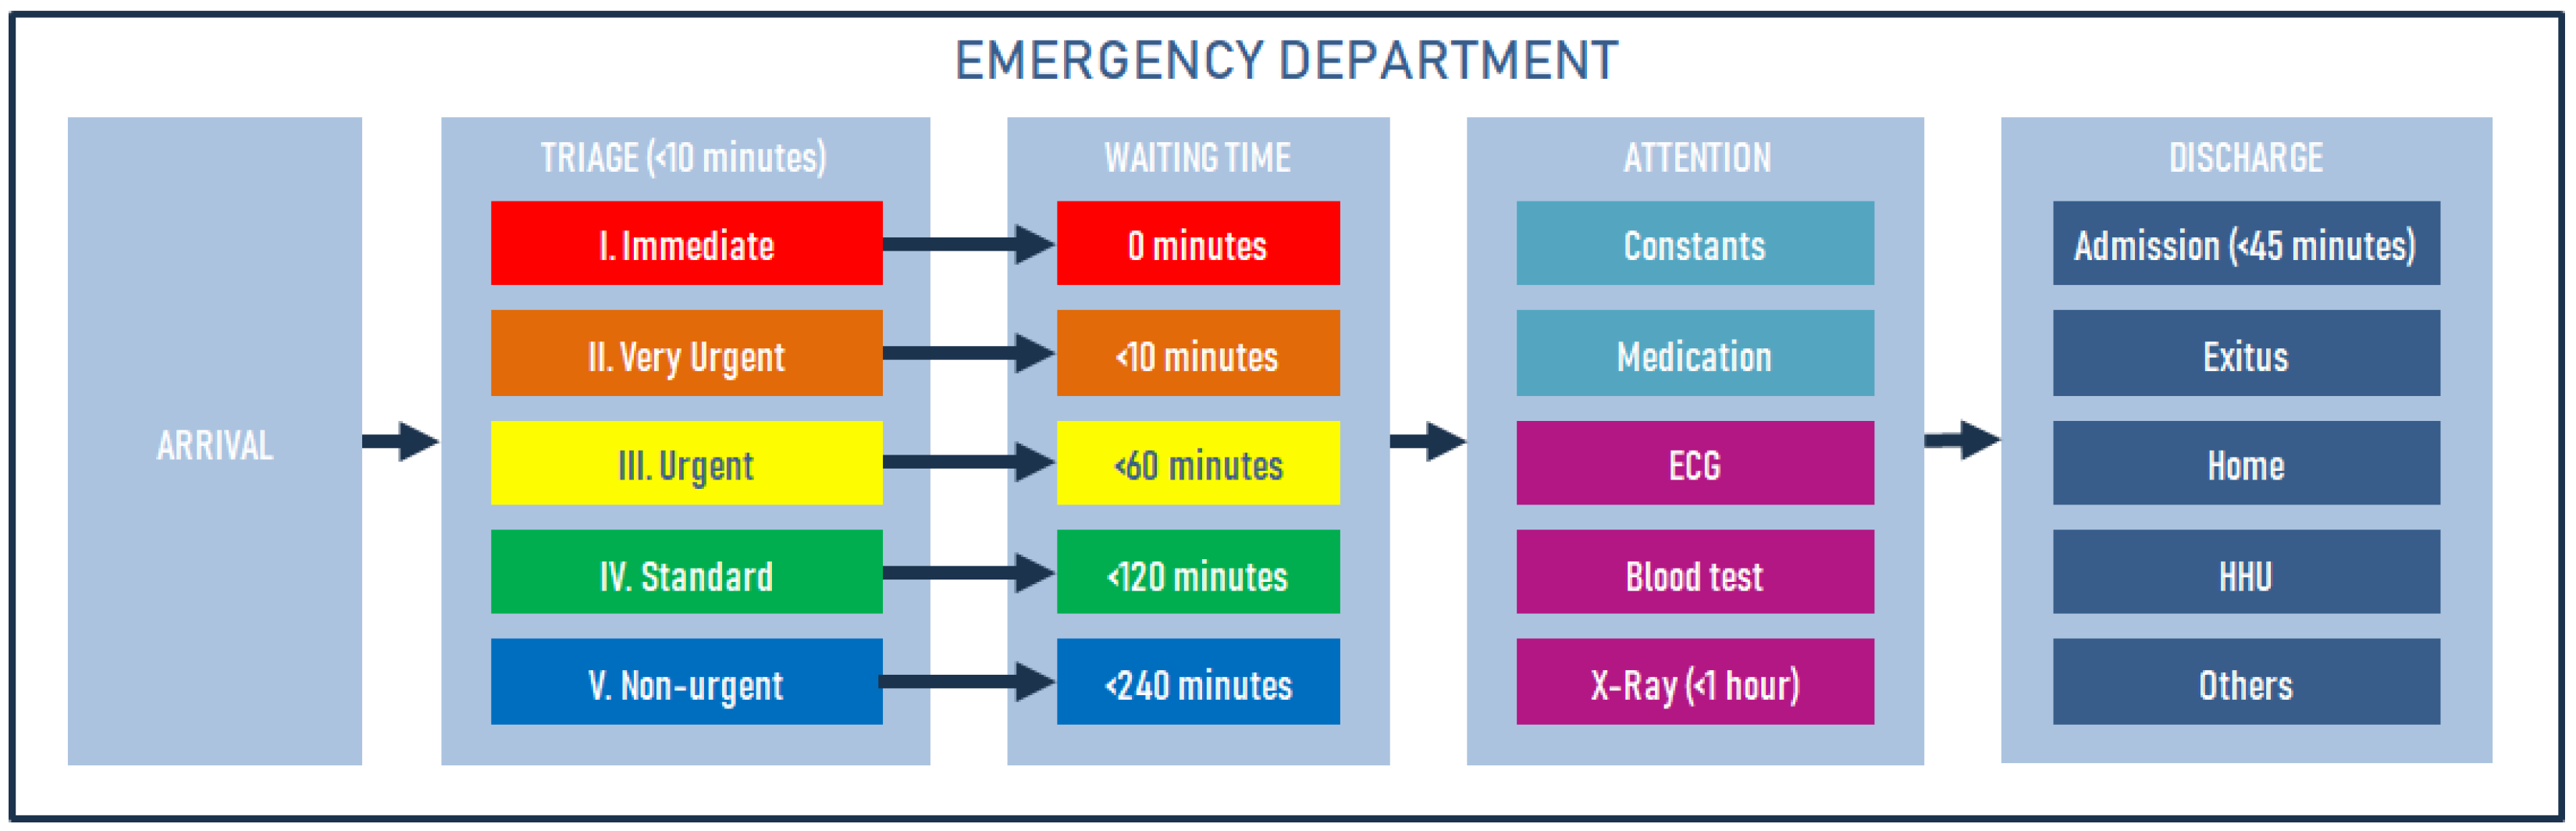
Triage is the structured, rapid classification process that allows for clinical risk management and care prioritisation in the ED. A key indicator of its quality is the pre-triage time, the interval from the patient’s arrival to their triage classification, the standard of which is ≤10 min. Five-level structured systems have proven to be the safest, sharing very similar time margins and clinical criteria. In triage, each patient is assigned one of the five levels with maximum times that mark the clinical process: Level I (Resuscitation): a situation that requires immediate attention because there is cardiorespiratory arrest, shock, or an imminent life-threatening condition. At this level, the triage step may occur after clinical care, with this clinical pathway organised without triage due to the extreme urgency of care; Level II (Emergency): a very urgent situation with life-threatening condition, hemodynamic instability, or unbearable pain, which should be assessed in ≤15 min; Level III (Urgent): a stable patient but at potential risk (e.g., chest pain, suspected sepsis) who will likely require diagnostic testing, requiring medical contact within ≤60 min; Level IV (Least Urgent): a pathology with no apparent life-threatening condition (sprains, rashes, chronic symptom control) that allows for a wait of up to 120 min; and Level V (Not Urgent): administrative procedures or minor, very low-complexity conditions, with a wait time of ≤240 min (Figure 2). This grading ensures that resources are focused first on critical conditions without neglecting the rest through periodic reassessments [36,37].
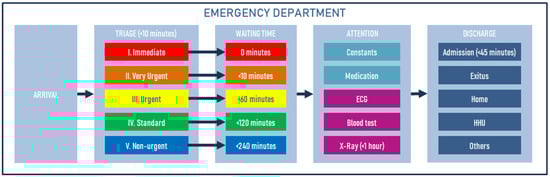
Figure 2.
Manchester triage standard.
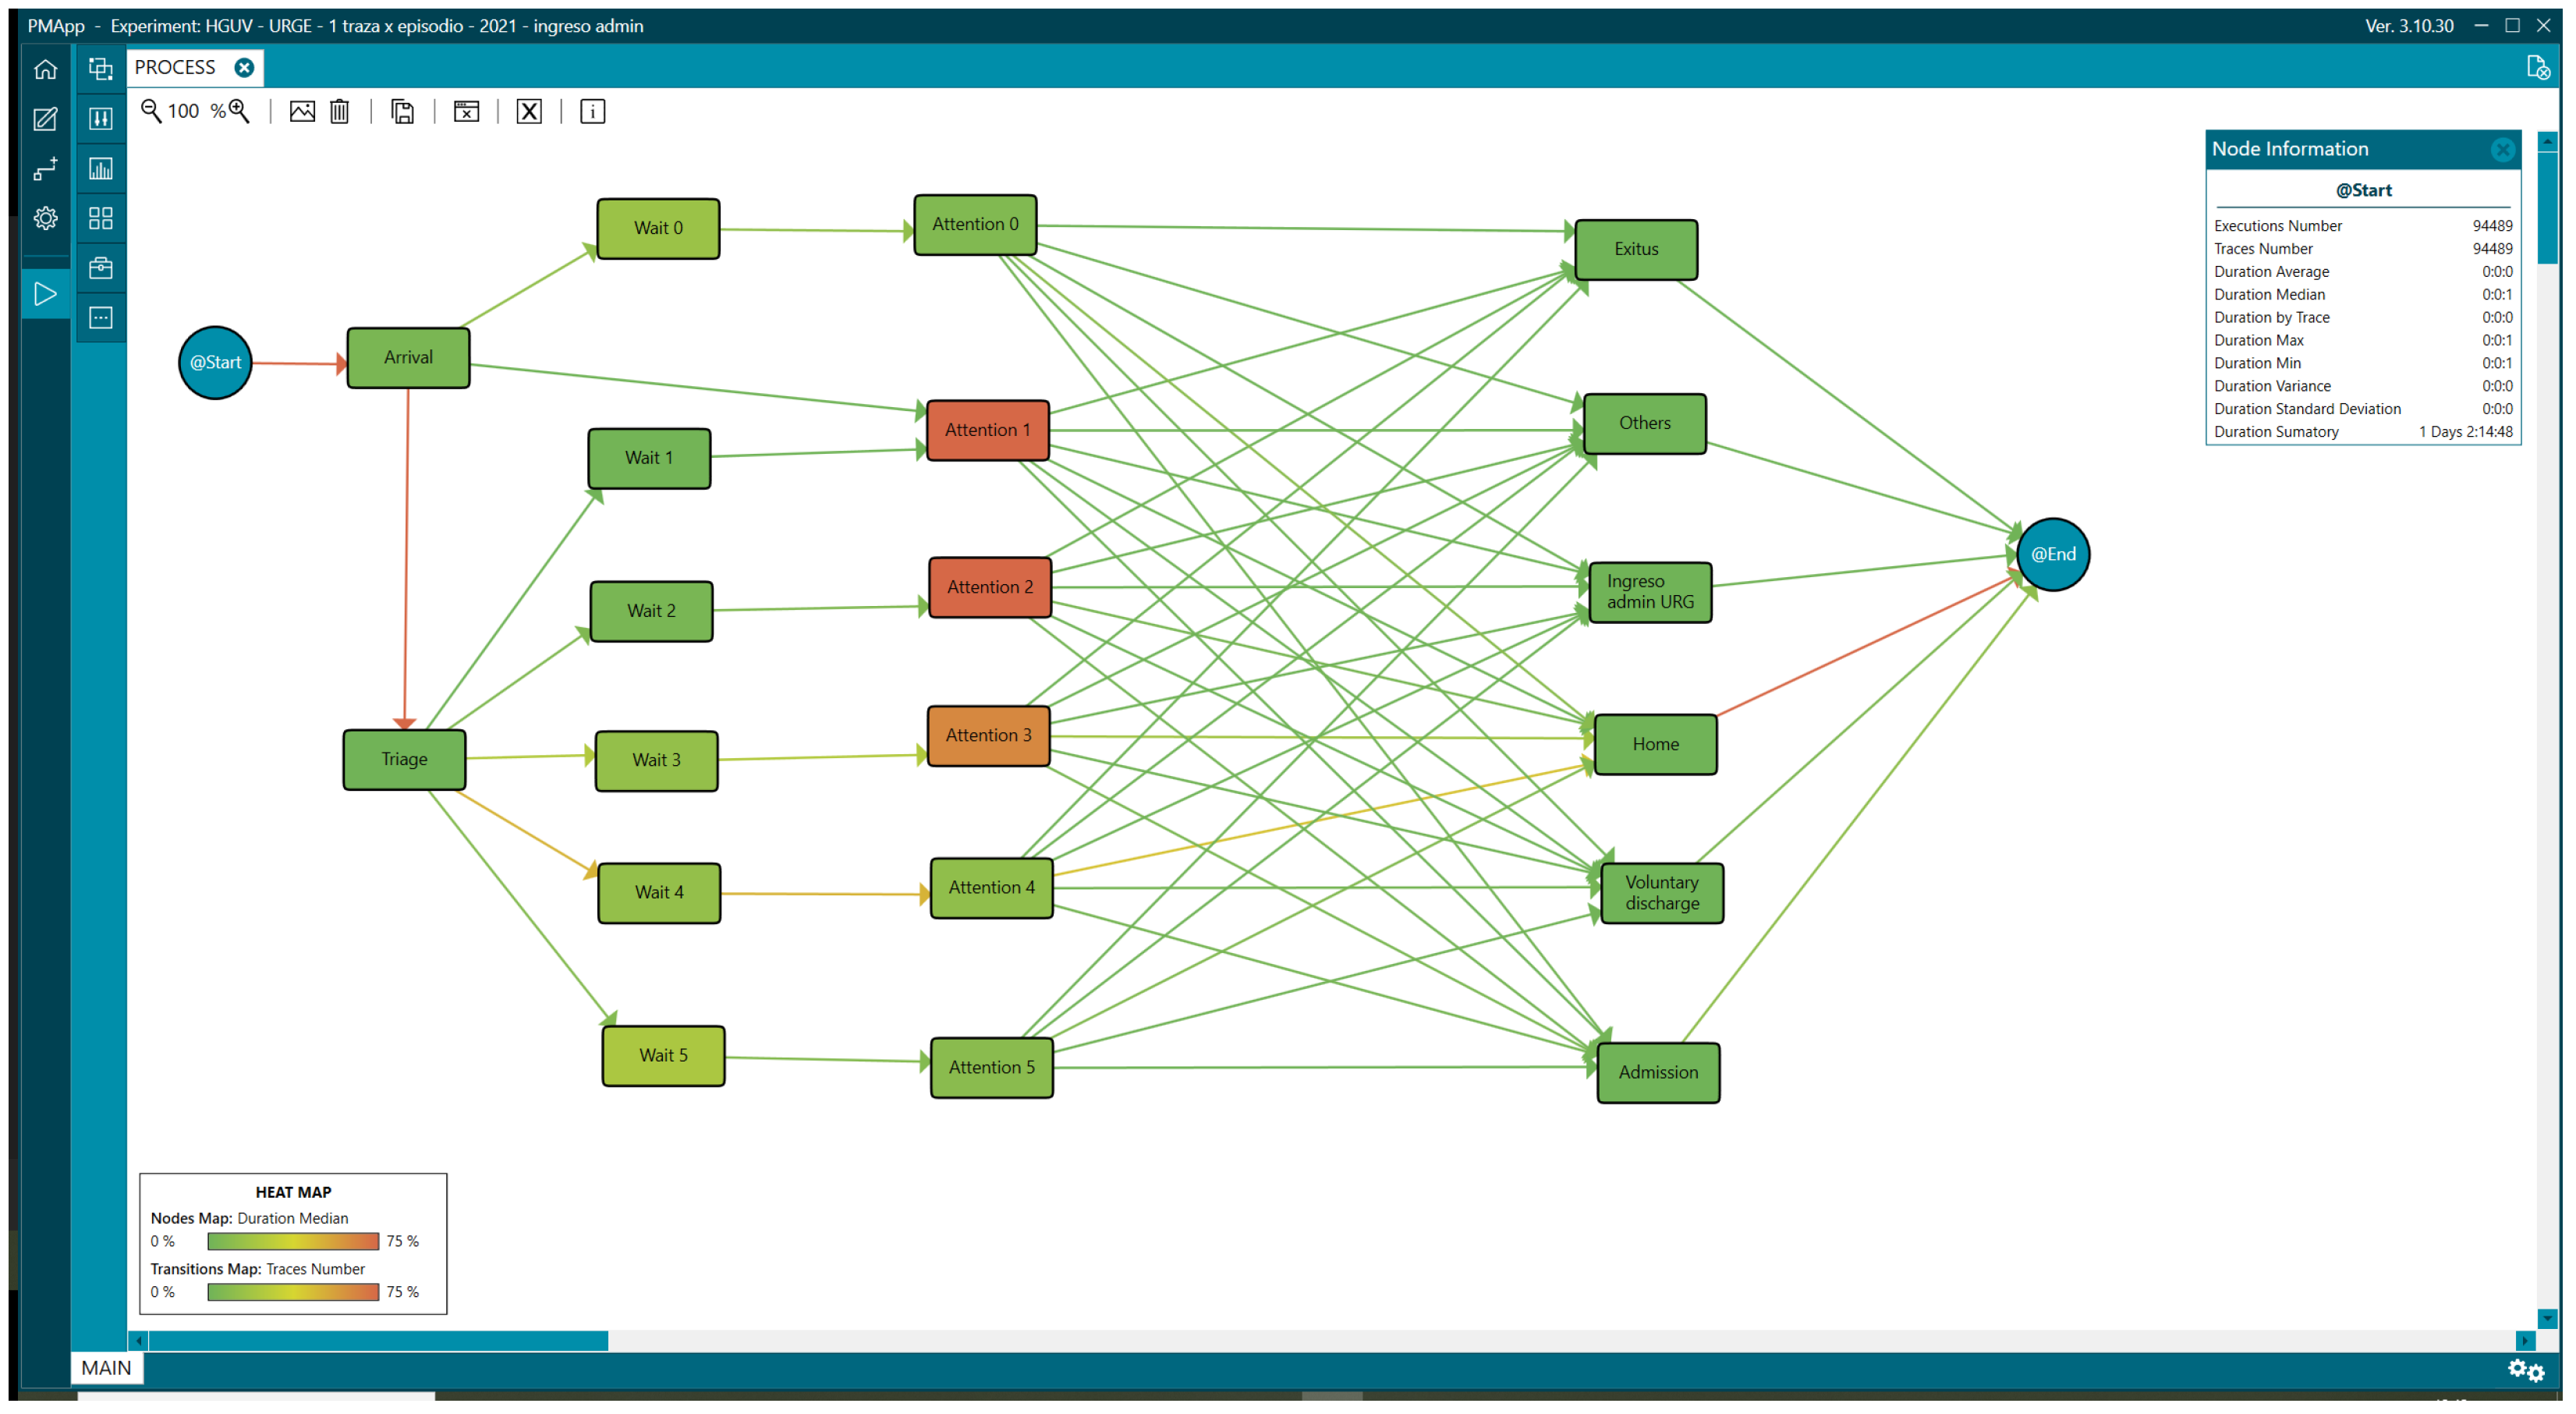
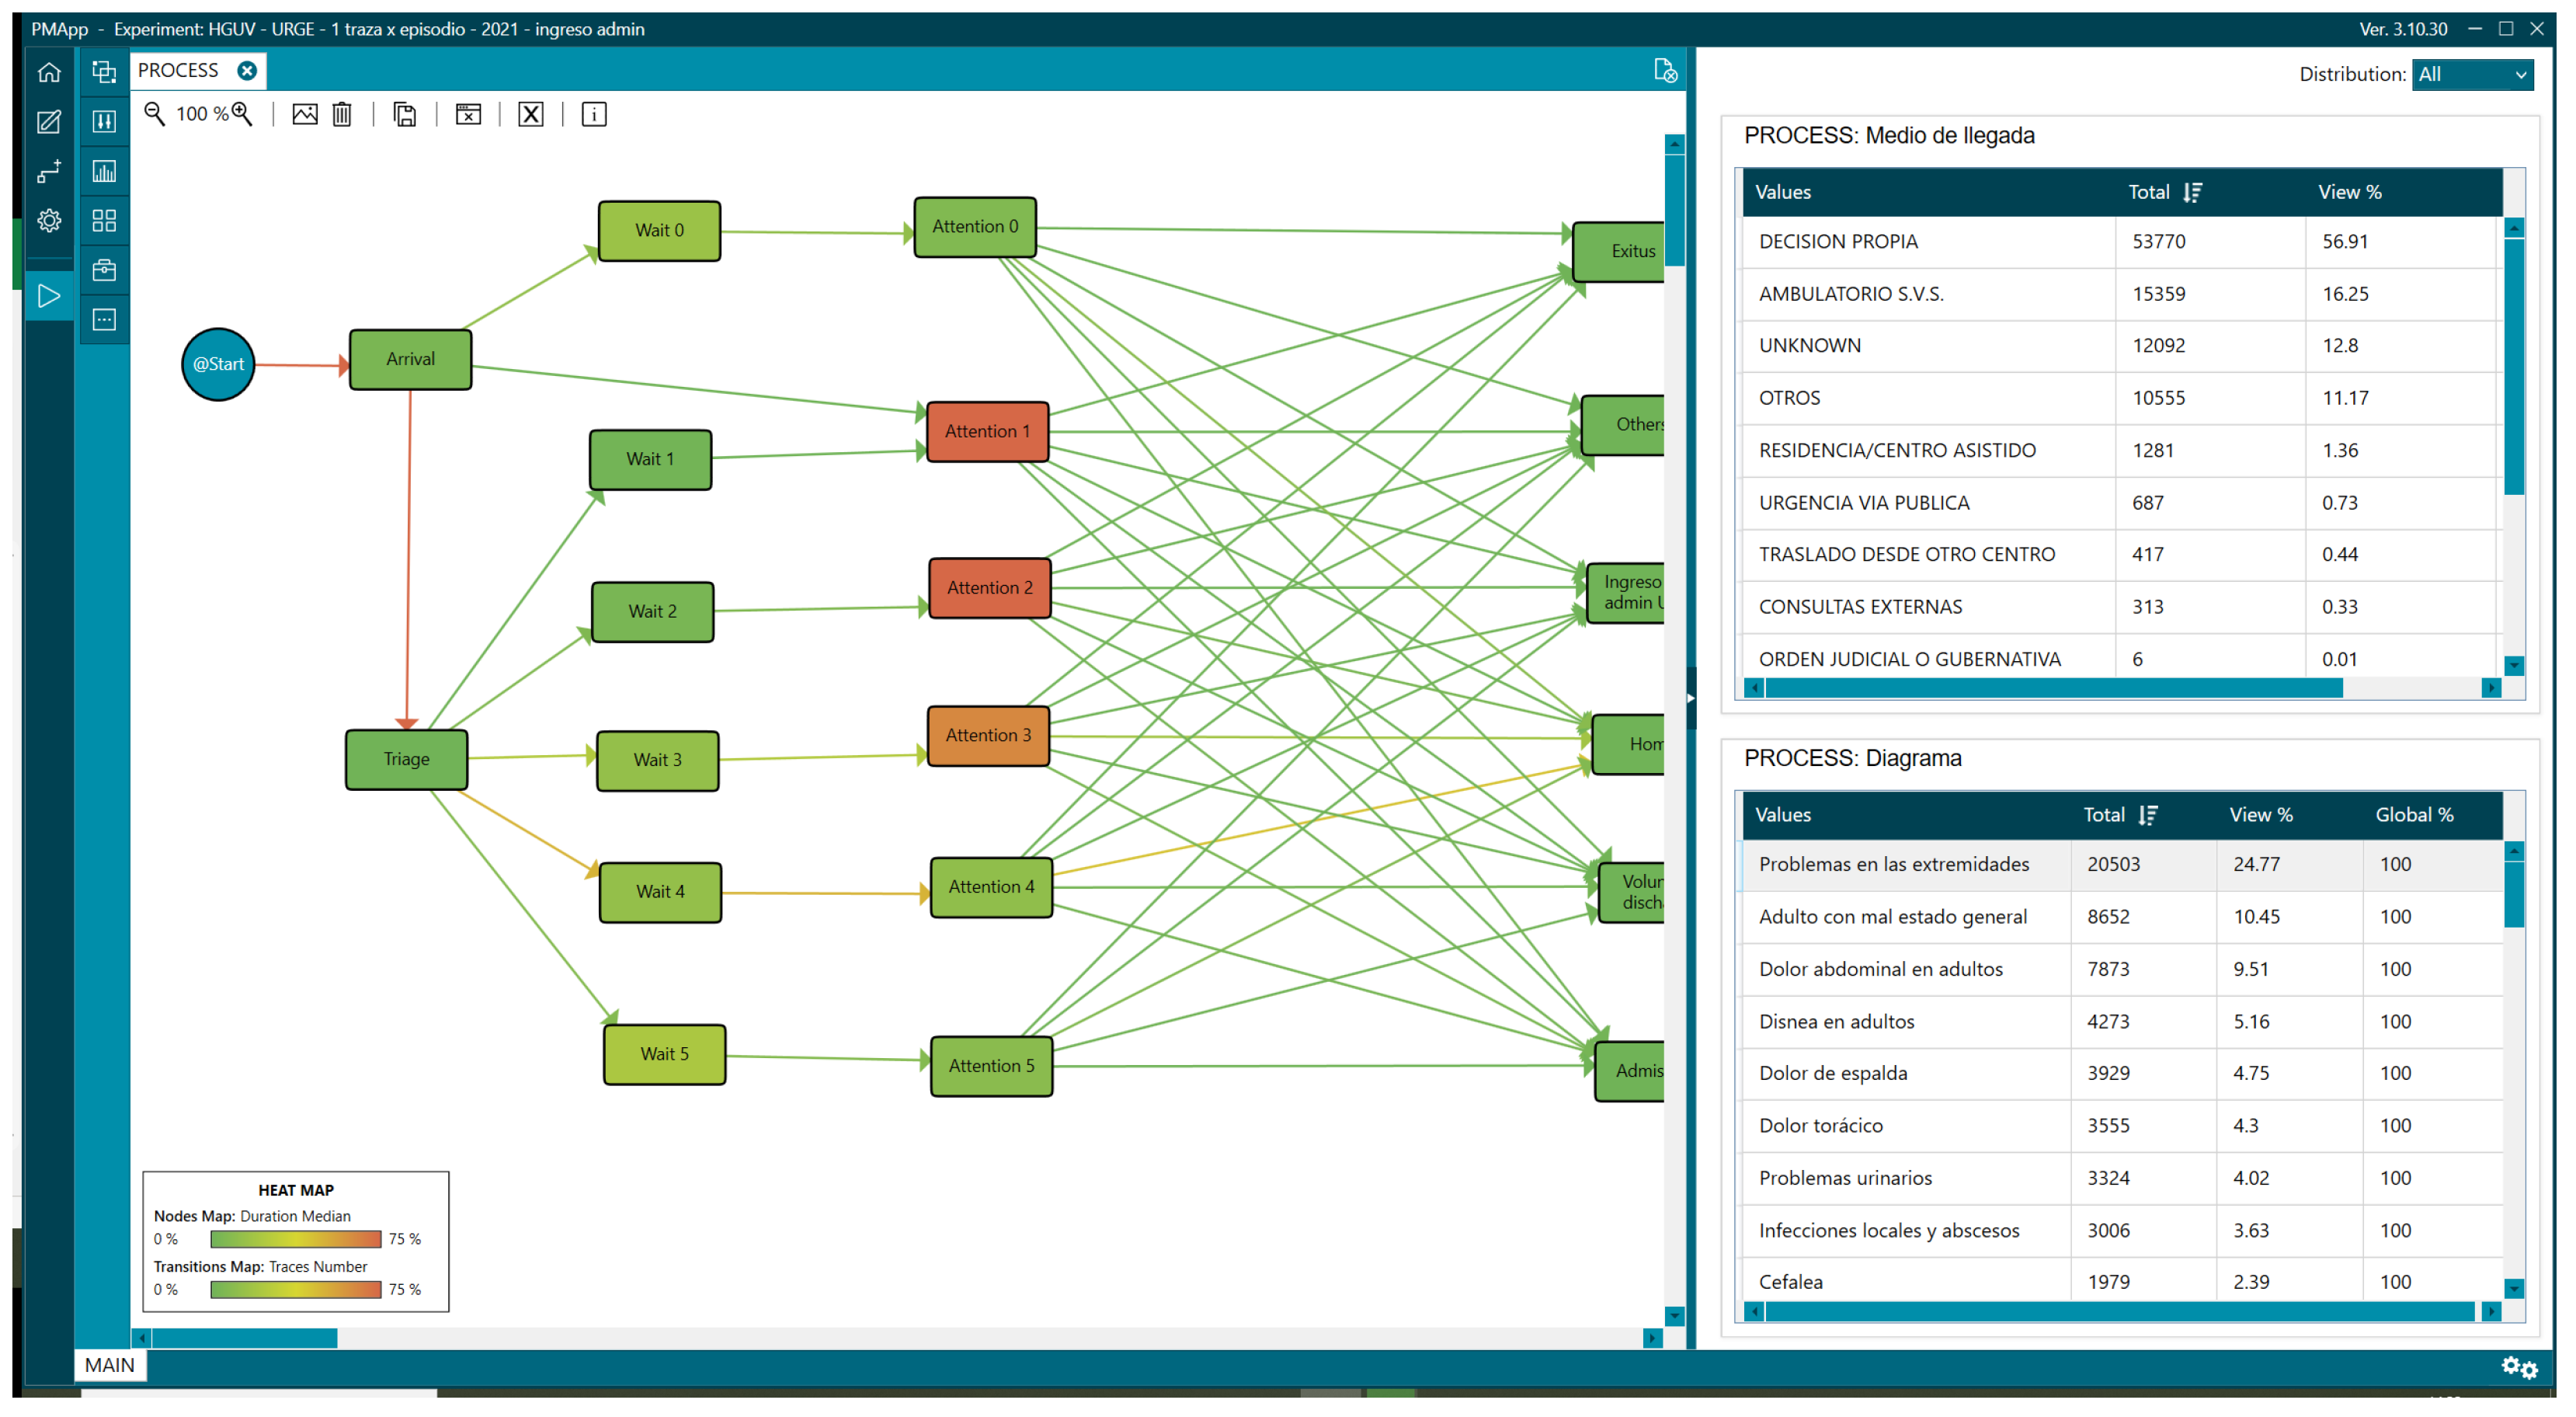
It should be noted that in addition to the standard process, two more circuits were identified in the IPI within the ED. It was derived from the characteristics of the process mining analysis, which allows for the discovery of real processes. Thus, the first was named Level 0 for patients who have not been triaged but have a waiting time until first attention (Wait 0, Attention 0). It occurred because, in this context, external outpatients go through the ED when they visit the hospital. The second circuit corresponds to those Level I patients who have been attended to directly without having registered in the triage system. The representation of this process can be seen in Figure 3, where it is observed that Level I and II patients spend more time in attention (appearing redder than the rest of the steps), which is logical because they are patients who require more care. The information represented in each step (rectangle or node) was complemented with statistics and other variables to subsequently understand the profile of the patients according to the duration of their stay in the ED and thus identify the most frequent characteristics in the general population and by subgroups, facilitating the understanding of the patient profiles and their needs for the definition of FTs.

Figure 3.
Interactive process indicators of the emergency department.
Nonetheless, the visualisation of the ED process, structured into circuits and urgency/triage categories, proved instrumental in narrowing the scope of the problem and directing investigative efforts toward the profiles of patients with the most significant potential to aggravate service saturation.
2.3. Strategies for Addressing Emergency Department Overcrowding
Before detailing our data-driven approach to triage, it is important to understand the current landscape of ED overcrowding strategies. This section reviews existing methods, providing a foundation for understanding the potential impact of our proposed method. Several strategies address ED overcrowding, often focusing on reducing length of stay by improving the time to first attention. Advanced triage systems [38], which incorporate detailed assessments and decision-making tools, are one example of this approach, aiming to enhance triage accuracy and efficiency. This may lead to the activation of FT, another strategy aimed at low-complexity patients [39,40]. Strategies such as early test ordering, the use of point-of-care testing (POCT) devices, and early treatment administration have been associated with shorter overall lengths of stay and faster decision-making [41,42]. Rapid Assessment Units (RAUs), similar to FTs, are a focused strategy to accelerate assessment, diagnostic workup, and treatment for patients with specific medical conditions without increasing the required infrastructure [43,44]. However, RAUs, which aim for rapid assessment, might not always be equipped to handle the complexity required for this patient profile, potentially leading to misdiagnosis or incomplete assessments. Thus, because FTs have proven to be among the most effective strategies for reducing LOS in non-complex patients [24], our proposed approach builds upon this foundation to address LOS in more complex cases.
3. Study Methodology
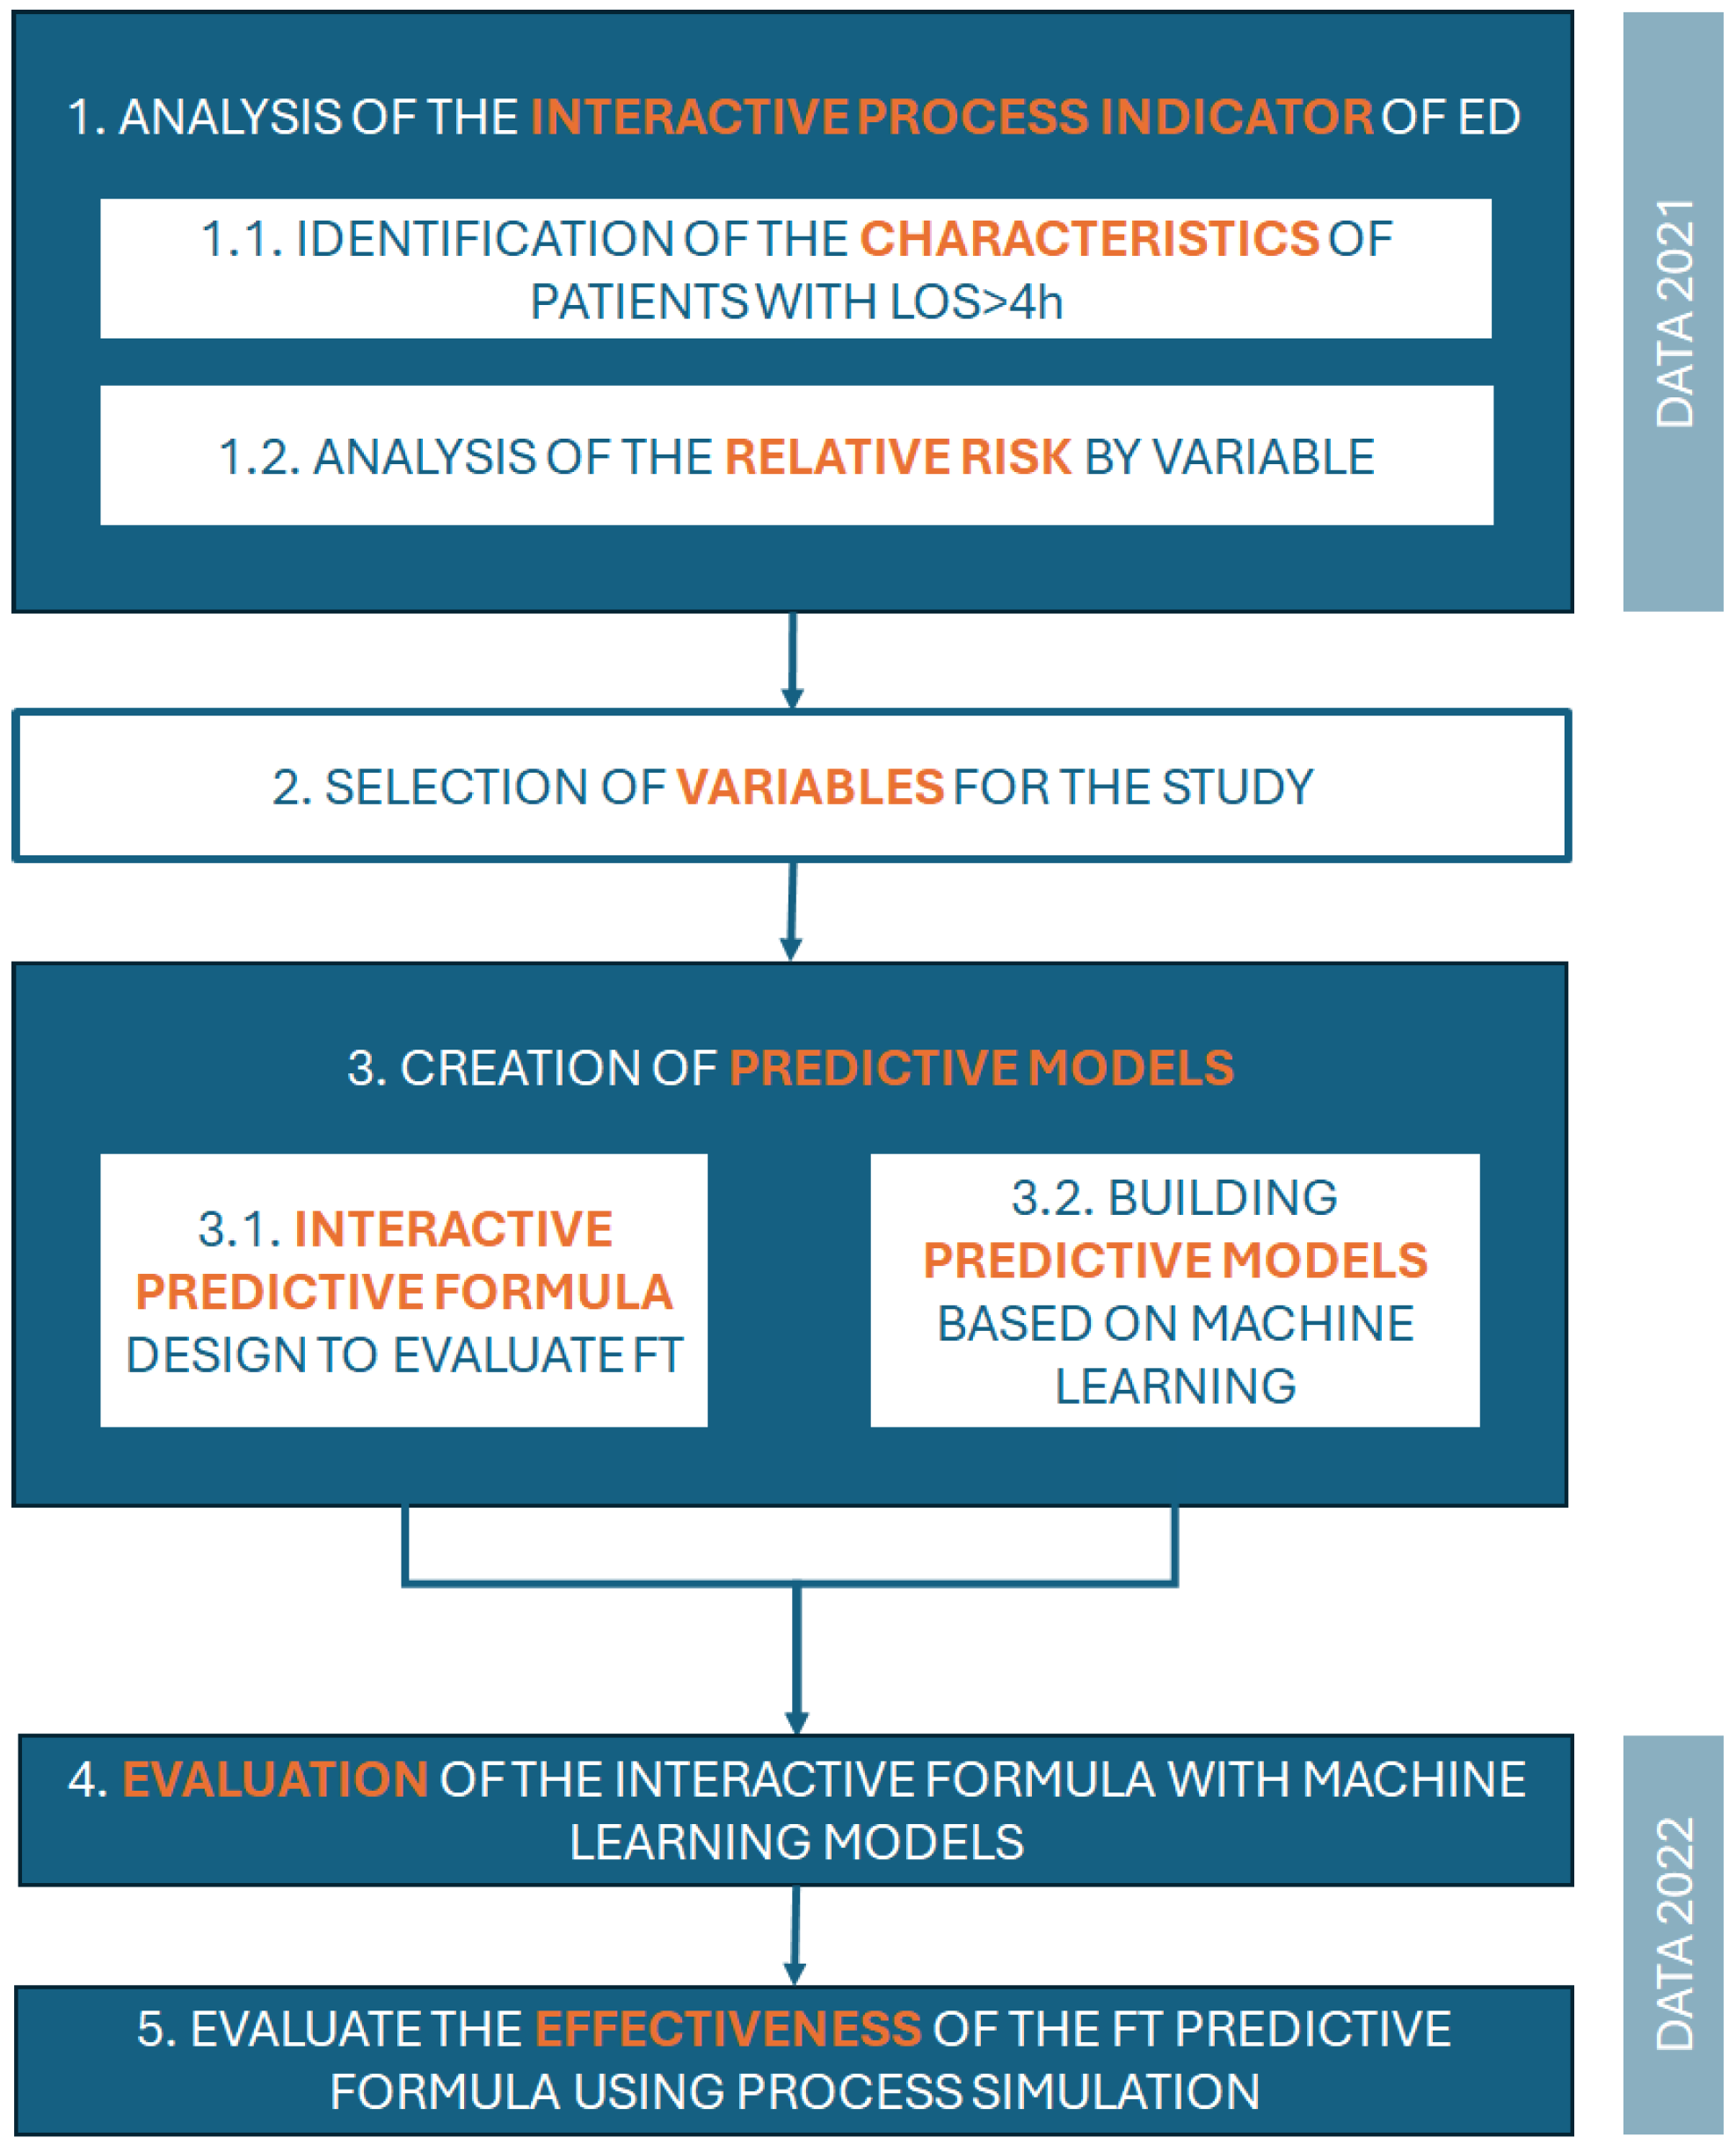
Building upon the IPI described in the previous sections, a methodology was established to initially enable the characterisation of patients who are likely to contribute to ED overcrowding. From this characterisation, the risk rate was then calculated from the identified variables to determine which have the most significant influence on a prolonged stay (>4 h) in the ED, and thus design a fast-track care pathway to reduce times and possible adverse events. Figure 4 shows this methodology and the different phases in it:
- Analysis of the Interactive Process Indicator of the Emergency Department: This initial stage, based on data from 2021, involved two primary steps: (1.1) identification of the characteristics of patients with a length of tay exceeding 4 h (LOS > 4 h) and (1.2) analysis of the relative risk associated with various variables.
- Selection of Variables for the Study: This stage involved selecting relevant variables based on their clinical relevance, statistical significance (as measured by the relative risk), and prevalence in the patient population.
- Creation of Predictive Models: This stage encompassed the development of two distinct predictive models: (3.1) an interactive predictive formula designed to evaluate fast-track implementation, and (3.2) predictive models built using machine learning techniques.
- Evaluation of the Interactive Formula with Machine Learning Models: This stage focused on assessing the performance of the interactive formula in conjunction with the machine learning models. Data from 2022 were used in this stage.
- Evaluation of the Effectiveness of the FT Predictive Formula Using Process Simulation: The final stage involved evaluating the effectiveness of the fast-track predictive formula through process simulation techniques.
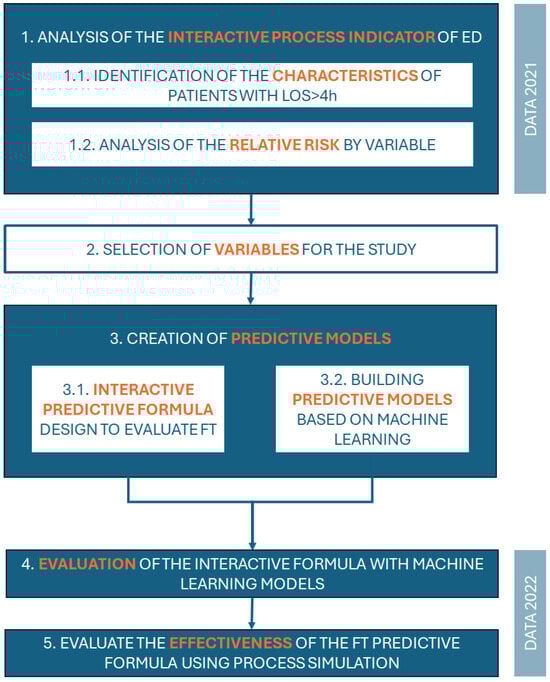
Figure 4.
Methodology of the study.
Figure 4.
Methodology of the study.
In the context of predicting prolonged LOS in EDs, there is an ongoing debate regarding the choice of predictive tools, particularly between manual formulas developed by clinical experts and machine learning (ML)-based systems. While ML systems provide advanced capabilities for processing large datasets and producing highly accurate models, the use of a manual predictive formula offers significant advantages in terms of traceability, transparency, and clinical relevance, especially in critical and sensitive environments such as EDs.
One of the major limitations of ML models lies in their black box [45] nature, meaning that the decision-making process is often opaque and difficult to interpret. This lack of traceability can generate uncertainty and reduce trust among healthcare professionals, who need to justify clinical decisions based on understandable and verifiable parameters. In contrast, a manual formula designed by a group of clinical experts ensures full traceability of decisions. Each variable included in the formula is carefully selected based on its clinical relevance, statistical association with prolonged LOS (measured using the relative risk, RR), and prevalence in the patient population. This approach allows HCPs to understand the rationale behind each prediction, facilitating clinical validation and ensuring compliance with ethical principles such as fairness and equity in care.
In addition, ML systems tend to prioritise model accuracy over the clinical relevance of the variables used, potentially leading to decisions that are impractical or inapplicable in a real-world healthcare setting. For example, variables with high statistical correlation but minimal clinical applicability may be included by an ML model, complicating its implementation in real-time scenarios. By contrast, the manual design of the formula allows experts to select only those variables that are both statistically significant and clinically impactful. In this case, the selected variables included advanced age (>65 years); frequent ED visits; triage levels (II and III); need for a stretcher or wheelchair; and prevalent reasons for consultation such as dyspnea, abdominal pain, and general poor condition. These variables are not only clinically relevant but also easily identifiable at the time of triage, ensuring their operational feasibility.
In our scenario, a manual formula is particularly valuable, where decisions must be made quickly and accurately. Although ML models are effective, they require advanced technical infrastructure and continuous training and validation processes, which can hinder their real-time implementation, particularly in resource-limited hospitals. On the other hand, a manual formula can be seamlessly integrated into triage workflows, activating automatically upon the patient’s arrival. For example, the formula developed in this study allows for the immediate identification of patients at risk of prolonged LOS, facilitating the activation of FT pathways. Moreover, the simplicity of the manual model reduces dependence on advanced technologies, ensuring its accessibility across a wide range of hospital environments.
The transparency and traceability of manual formulas are also essential for ensuring that clinical decisions are fair and equitable. In critical settings, resource prioritisation processes (e.g., bed allocation or fast-track access) must be based on comprehensible and defensible criteria. ML systems, due to their lack of clear traceability, may produce biased outcomes that are difficult to detect and rectify. For this reason, the manual formula developed in this study is based on variables selected through expert consensus, integrating statistical evidence with ethical and clinical considerations. This ensures that decisions are consistent with the fundamental values of the healthcare system.
Although ML models are often associated with high levels of accuracy, this study demonstrated that a well-designed manual formula can achieve comparable results. Using the train-test technique, the results of the manual formula showed an appropriate balance between sensitivity and specificity, similar to the performance of advanced automated algorithms. This highlights the validity of manual formulas as effective predictive tools, particularly when simplicity and traceability are prioritised.
The development of a manual predictive formula allows for the integration of clinical expertise with statistical analysis, providing a robust, transparent, and real-time applicable tool. While ML systems have a role in large-scale research and prediction, in critical settings such as EDs—where trust, traceability, and clinical relevance are paramount—a manual formula designed by experts emerges as a more suitable alternative. Thus, the use of consensus formulas ensures understanding and acceptance by healthcare professionals while guaranteeing that clinical decisions are ethically defensible and aligned with principles of fairness in patient care.
However, it is essential to ensure that the developed formula is capable of producing accurate and reliable results. To this end, this study compared the outcomes generated by the manual predictive formula with those obtained through commonly used machine learning systems, such as Random Forest, Support Vector Machines, and Multi-Layer Perceptron. This comparison evaluated the performance of the manual formula in terms of precision, sensitivity, and specificity, determining whether it could achieve results comparable to automated models. Similar to the approach outlined by Devnath et al. [46], who demonstrated the efficacy of ensemble learning and Grad-CAM visualisation for pneumoconiosis detection in chest X-rays, this study emphasises the importance of traceability and clinical relevance. Unlike complex machine learning models, the manual formula ensures transparency and interpretability, which are critical in healthcare settings, particularly in environments such as emergency departments where decisions must be made quickly and justifiably. By validating the manual approach as a robust and effective alternative, we highlight its potential to integrate seamlessly into existing workflows while maintaining high levels of accuracy and operational efficiency.
The variables with the highest risk and frequency were used to design both a manual predictive formula and to build the different machine learning predictive models and thus evaluate how implementing an FT pathway affects the total stay. The predictive models used included Random Forest [47], Multi-Layer Perceptron [48], Naive Bayes [49], Quadratic Discriminant Analysis [50] and Ada Boost [51], Decision Tree [52], and Support Vector Machines [53]. The effectiveness of each model was evaluated in terms of accuracy, sensitivity, and specificity to identify patients at risk of prolonged stay.
The models were validated using cross-validation techniques, and the model or combination of models that demonstrated the greatest effectiveness in predicting and managing prolonged stays, optimising the use of resources, and reducing ED saturation was selected. The train-test technique was used to evaluate model performance.
Study Data
This retrospective observational study includes all patients who attended the ED of a Spanish tertiary care hospital in Spain between 1 January 2021 and 31 December 2022. The data were extracted from the hospital information systems, which were anonymised and hosted on a secure server at the hospital.
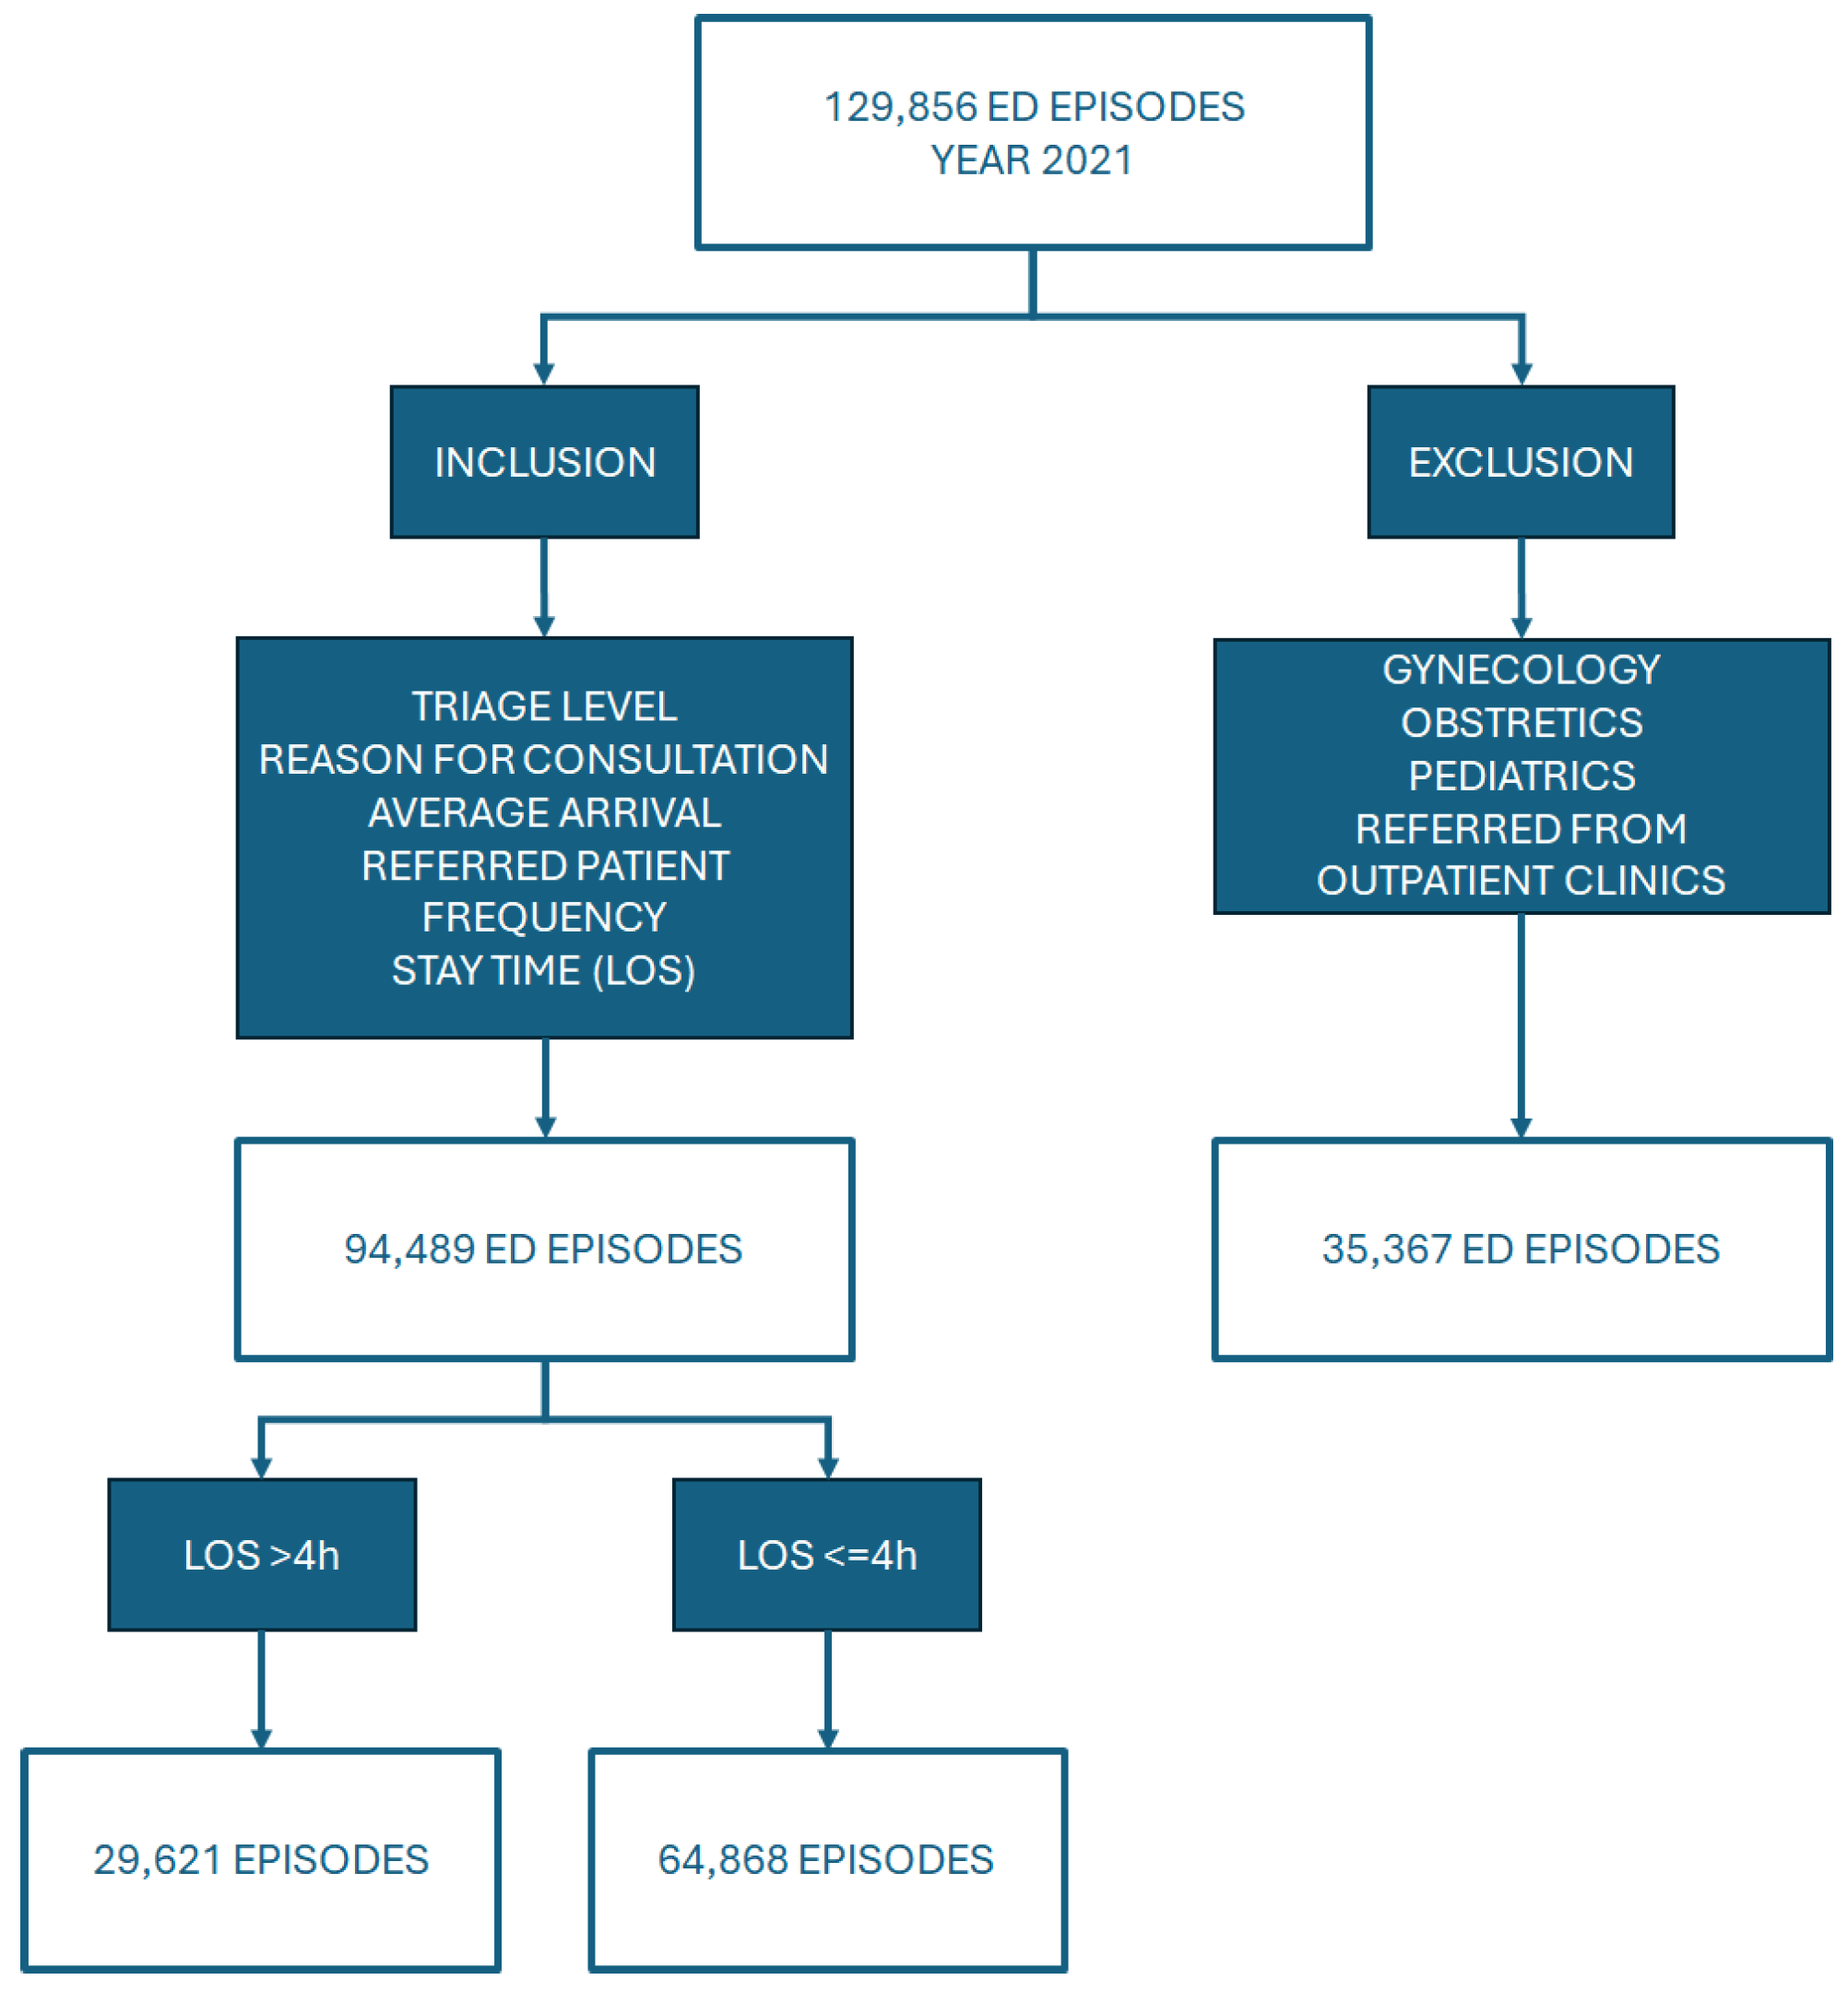
In step 1 of the study methodology (Figure 4), data from the year 2021 were used. Of the 129,856 episodes that met the inclusion criteria specified in the flow chart (Figure 5), 94,489 emergency episodes were selected. To facilitate comparative analysis, the resulting sample was divided into two groups based on their LOS, greater than or less than 4 h. Obstetric, gynaecological, and paediatric patients were excluded because they are introduced into the ED system differently, constituting in many cases the most frequent diagnosis in a hospital [54]. Furthermore, sometimes, they require a long observation time, which could introduce bias in the analysis. However, it should be noted that in the following sections, it is possible to identify data related to paediatric patients that correspond to children who did not follow the paediatric circuit but were traumatology patients. Likewise, those patients who visited the ED for an emergency were referred directly to outpatient clinics from admission or triage, which leaves them outside the studied ED circuit.
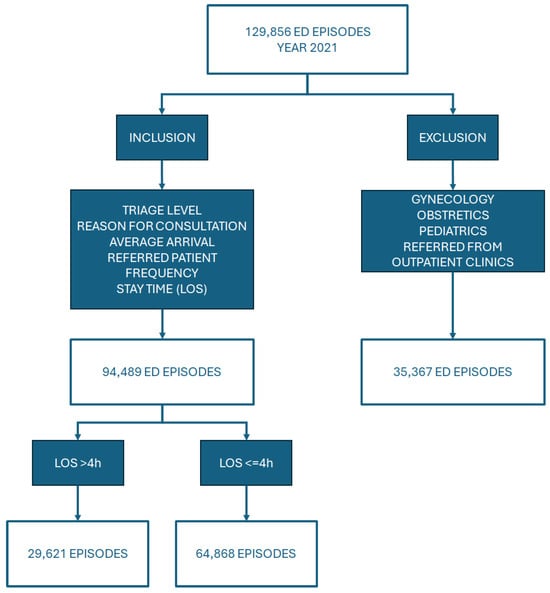
Figure 5.
Inclusion-exclusion criteria.
The variables selected for the study were demographic data (age and sex) and clinical data such as classification level, reason for consultation, arrival method, length of stay in the ED, and whether the patient has been referred to the ED by another professional or by their own decision. On this occasion, since the identification of variables was performed with retrospective data, outcome variables such as final destination upon discharge and annual frequency of visits to the ED [55] were also taken into account. These variables are helpful in elucidating how the rest of the variables affect patient outcomes. To categorise the latter, the following criteria were defined: Nonfrequenters (1 visit per year), Lowfrequenters (2–4 visits per year), Hyperfrequenters (5–10 visits per year), and Superfrequenters (>10 visits per year). LOS was defined as the total length of stay in the ED, from the time the patient arrives at the hospital until discharge from the ED. The patient’s arrival was taken as the first administrative record in the hospital, and their exit from the process was the discharge record from the ED in any of its possible exits.
4. Results
At the first stage, the purpose of the observational study was to understand the patient flow and identify potential delays through the analysis of the ED process with PMApp. The IPI represented the behaviour of patients in the ED. We examined the median length of stay for each step (node) and transition (arrows) to identify the delay at each step of the process, as well as different elements to characterise the behavioural pattern of the patients.
4.1. Analysis of the Interactive Process Indicators of the Emergency Department
Continuing with the methodology, we analysed the clinical profile of ED patients with a total of 94,489 episodes, where 29.89% (28,221) were over 65 (Table 1), with the most common triage level considered Level IV, accounting for more than 49.46% of the total-process tab (Figure 6).

Table 1.
Age values analysed with PMApp.
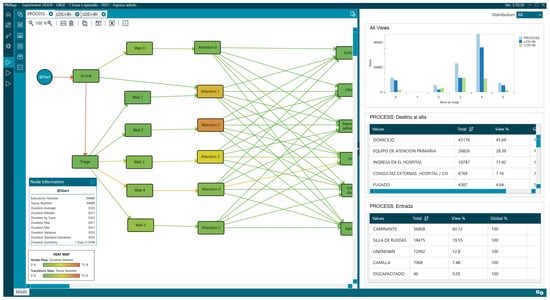
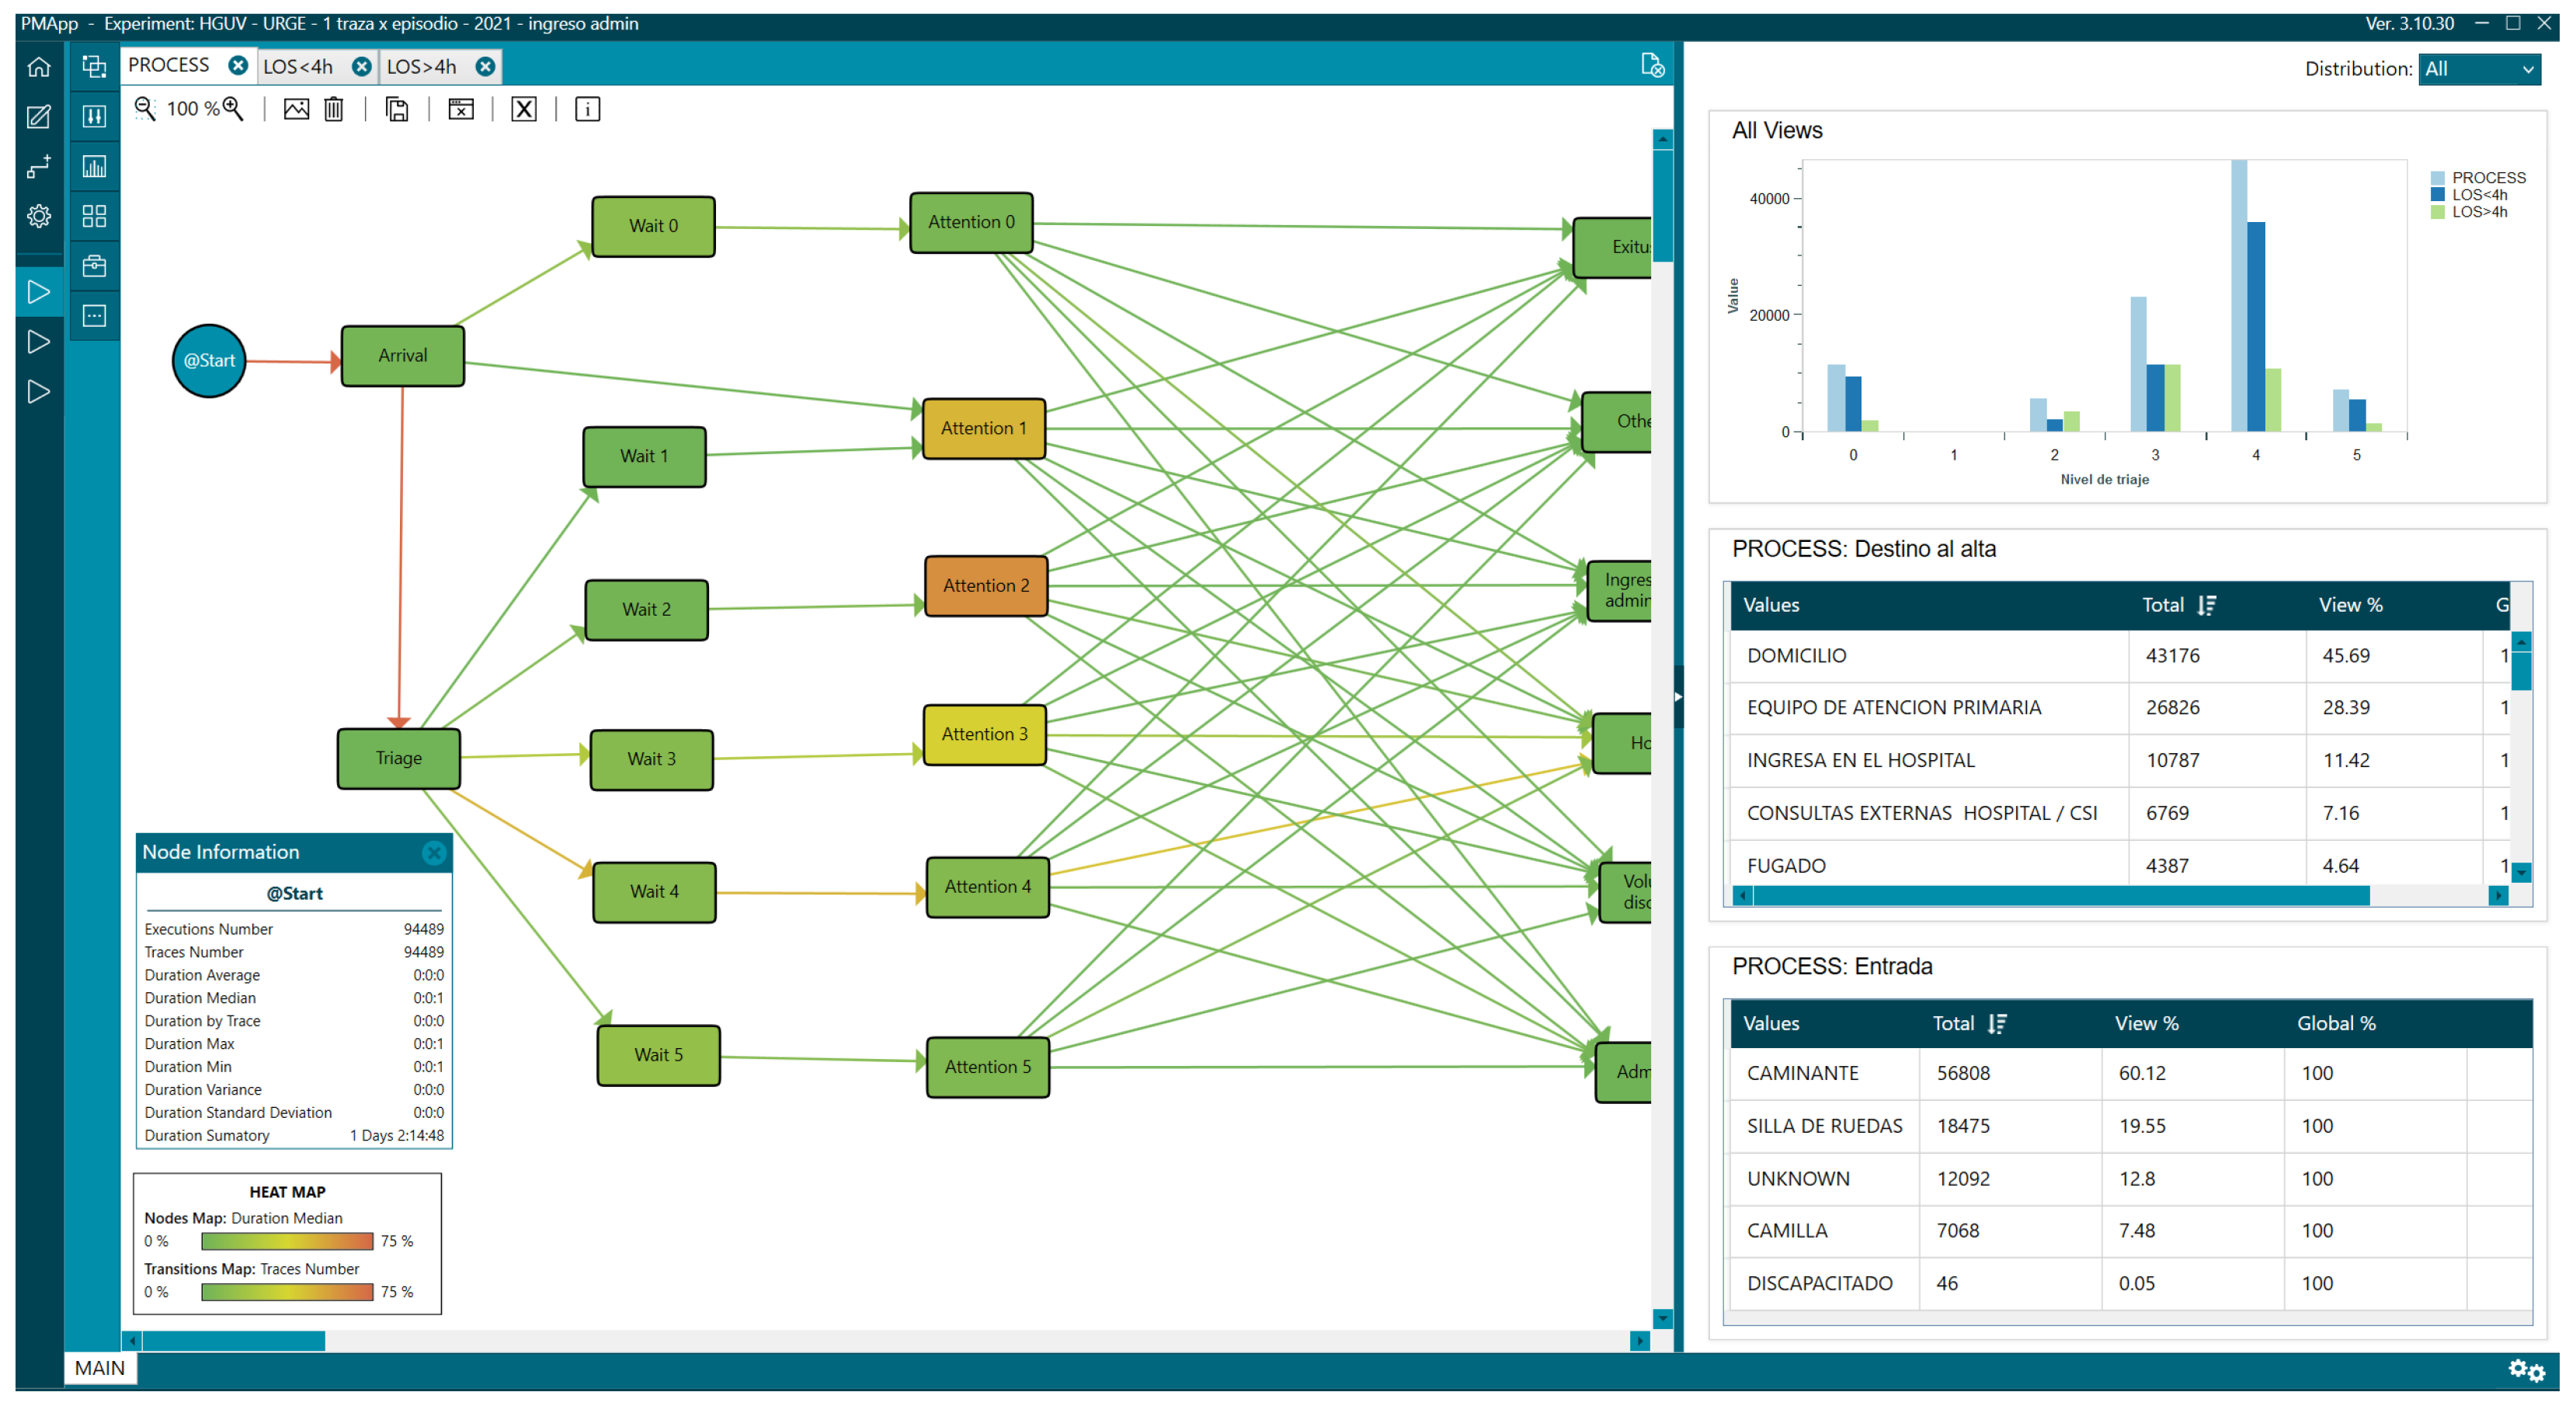
Figure 6.
General process with triage distribution.
Notably, 68.98% the most frequent reasons for consultation were grouped into nine triage diagrams, where the first three were extremity problems [“Problemas en las extremidades”] (24.77%), adults with poor general condition [“Adulto con mal estado general”] (10.45%), and abdominal pain [“Dolor abdominal en adultos”] (9.51%). Overall, 56.91% (53,770) of the patients presented to the ED on their own initiative [“Decision propia”] (Figure 7), with the admission rate being 11.42% (10,787).
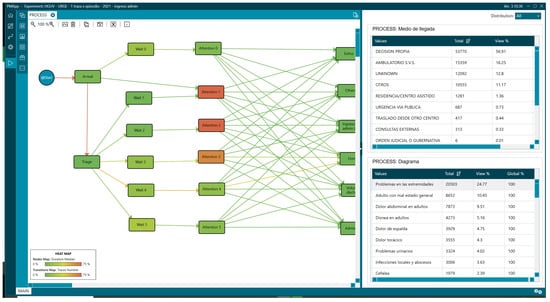
Figure 7.
General process with attention diagrams and mean of arrival statistics.
These data help us understand the ED case mix, as there is believed to be a causal relationship between the distribution of triage levels and their complexity and severity. This is where the concept of “fingerprint” comes into play. The fingerprint gives us information about the percentage of patients in each triage level. Therefore, if we compare two EDs, those with a higher proportion of Levels I, II, and III will be more complex services with greater resource needs. Other factors that have been shown to influence ED complexity include age, reason for consultation, and the percentage of patients admitted to the hospital from the ED [56,57,58].
Although there is no universal standard, the National Health System reported in 2023 that 10.3% of episodes treated in EDs ended in hospital admission, with minimal variations between autonomous communities. This percentage is a highly valuable strategic indicator: it allows for comparison of the performance of emergency departments, serves as a proxy for the complexity of care for patients treated, and guides resource planning, given that approximately 60–65% of all hospitalisations originate in these departments [59,60].
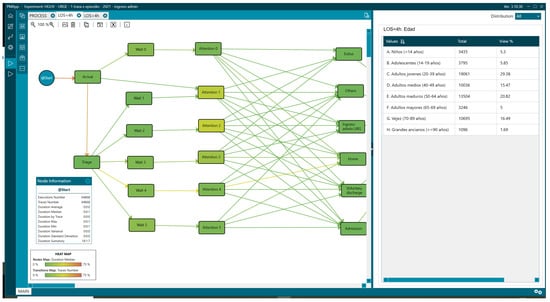
Figure 8.
Statistics associated with LOS less than 4 h.
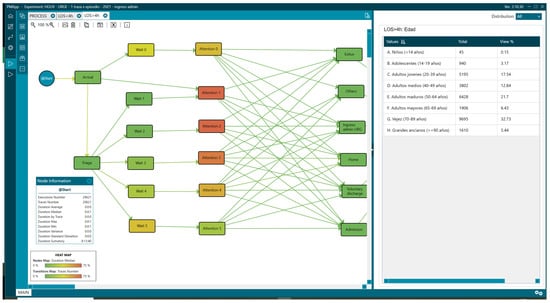
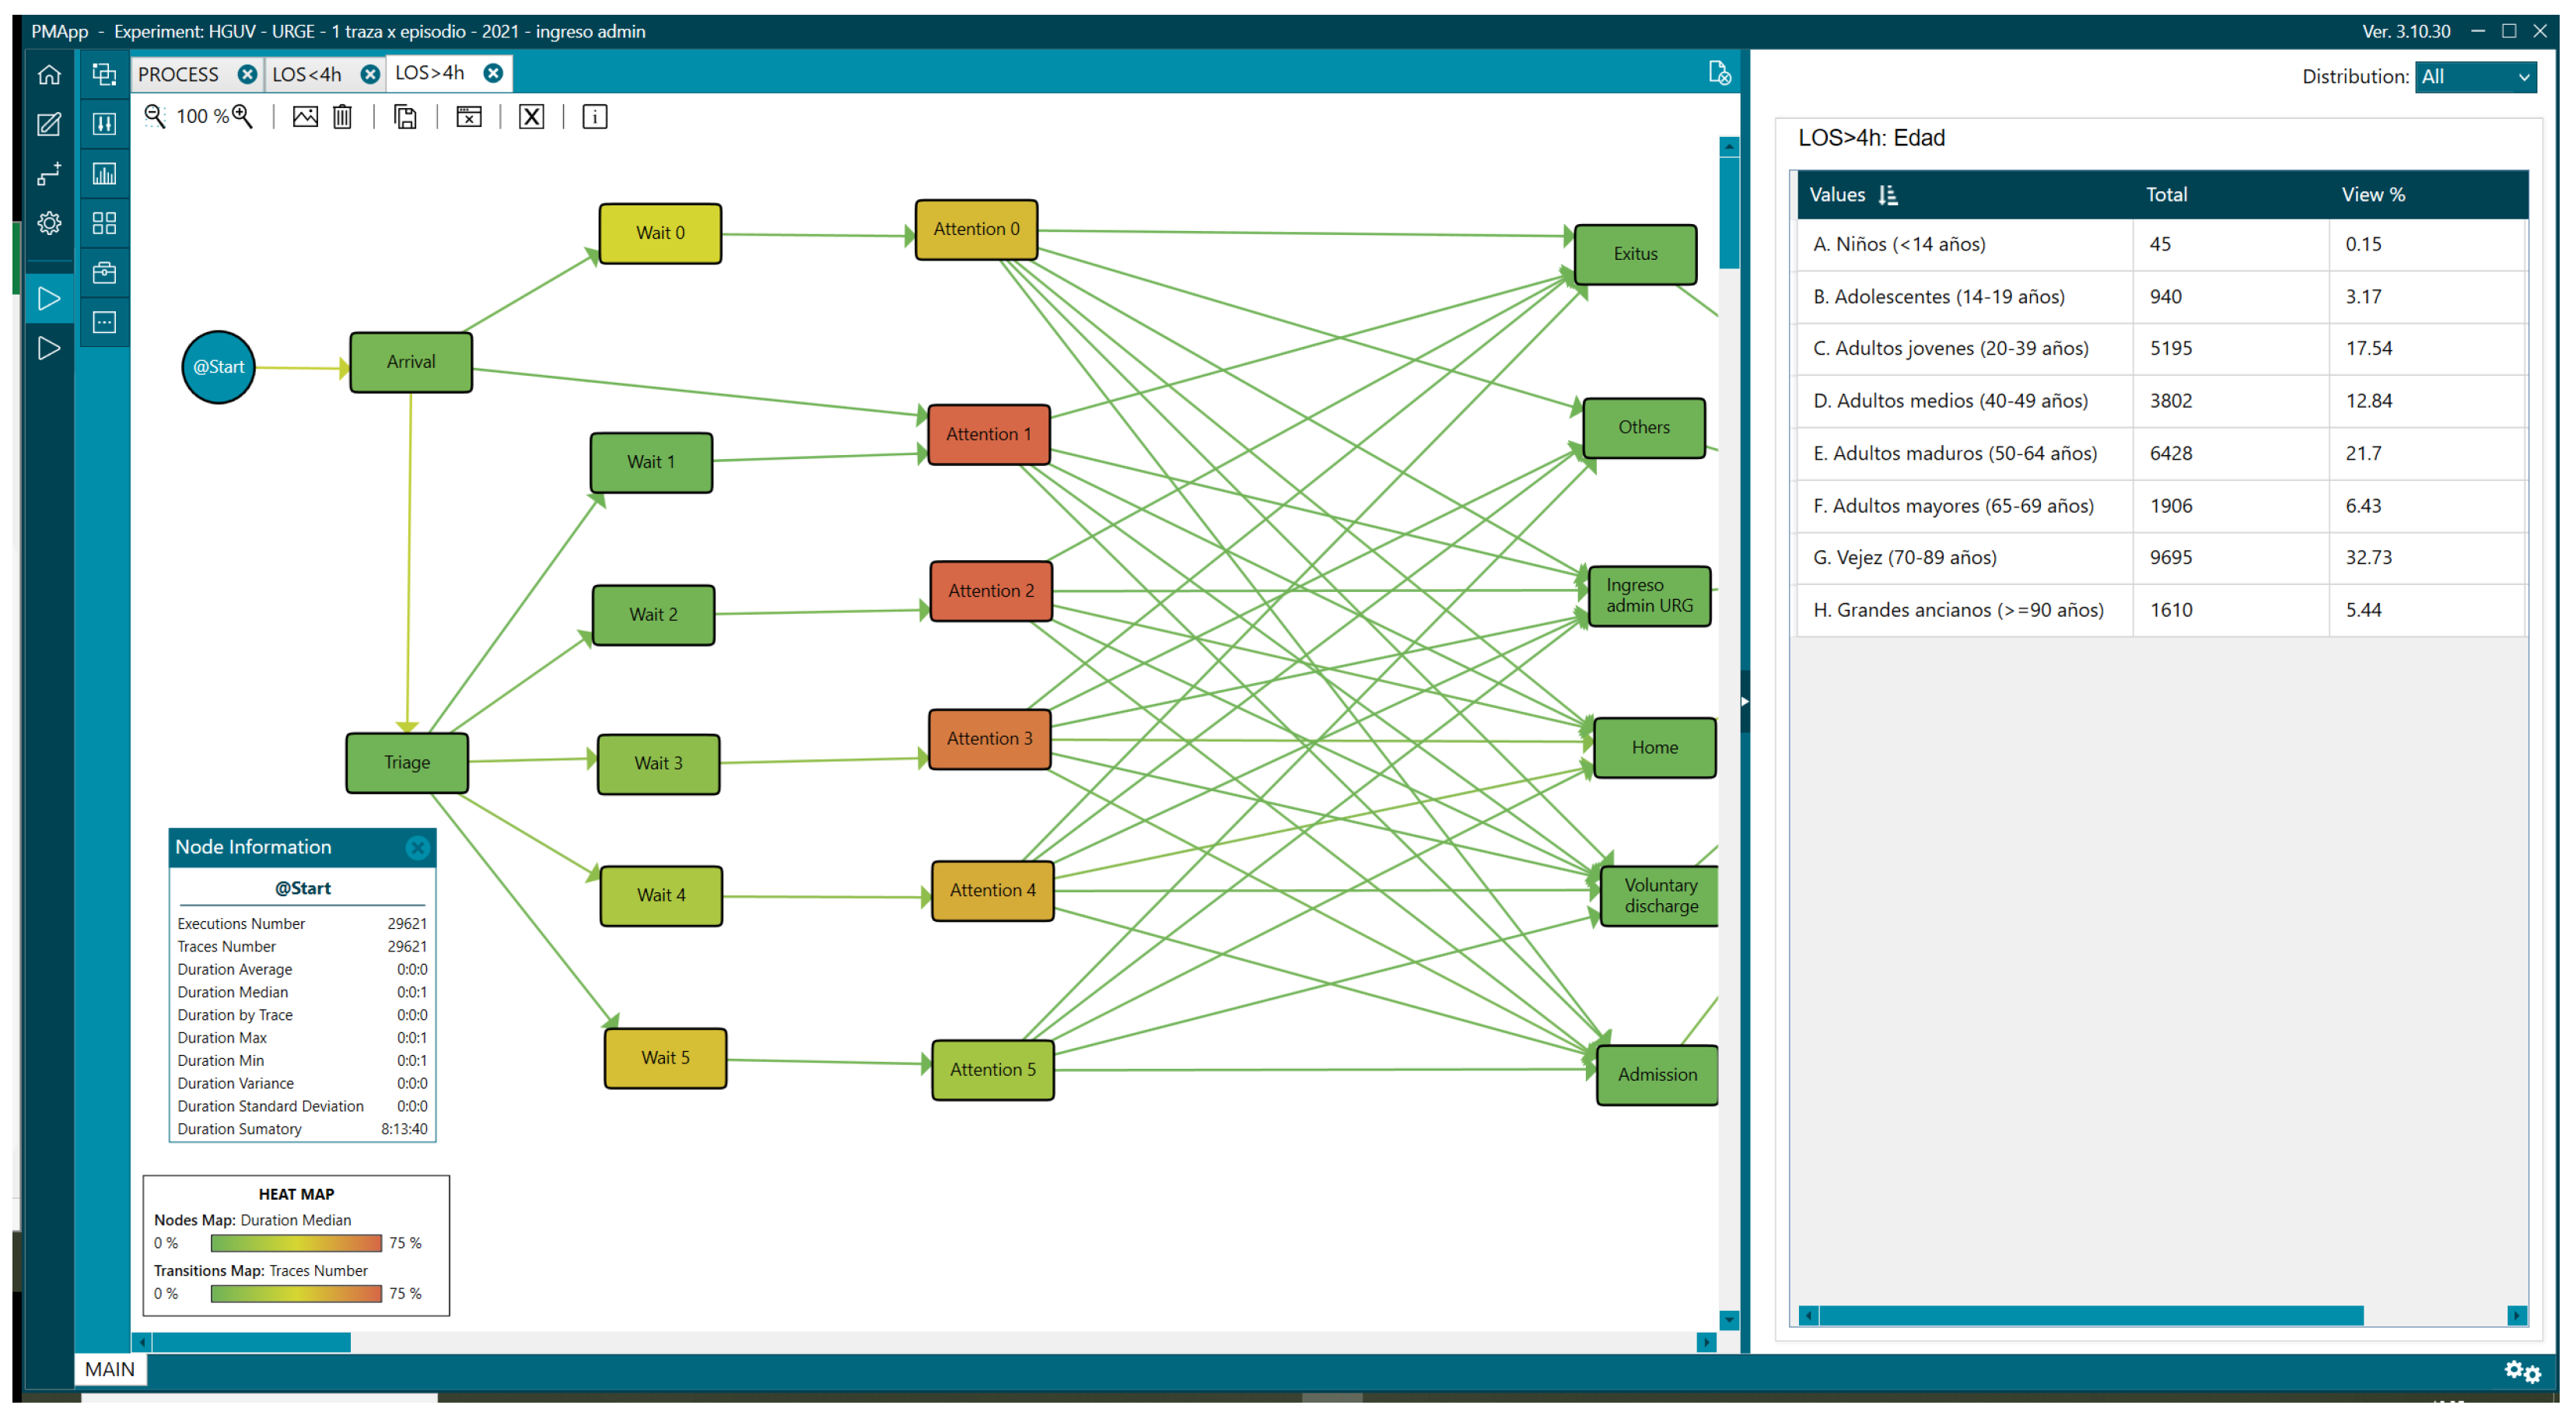
Figure 9.
Age distribution of patients with LOS greater than 4 h.
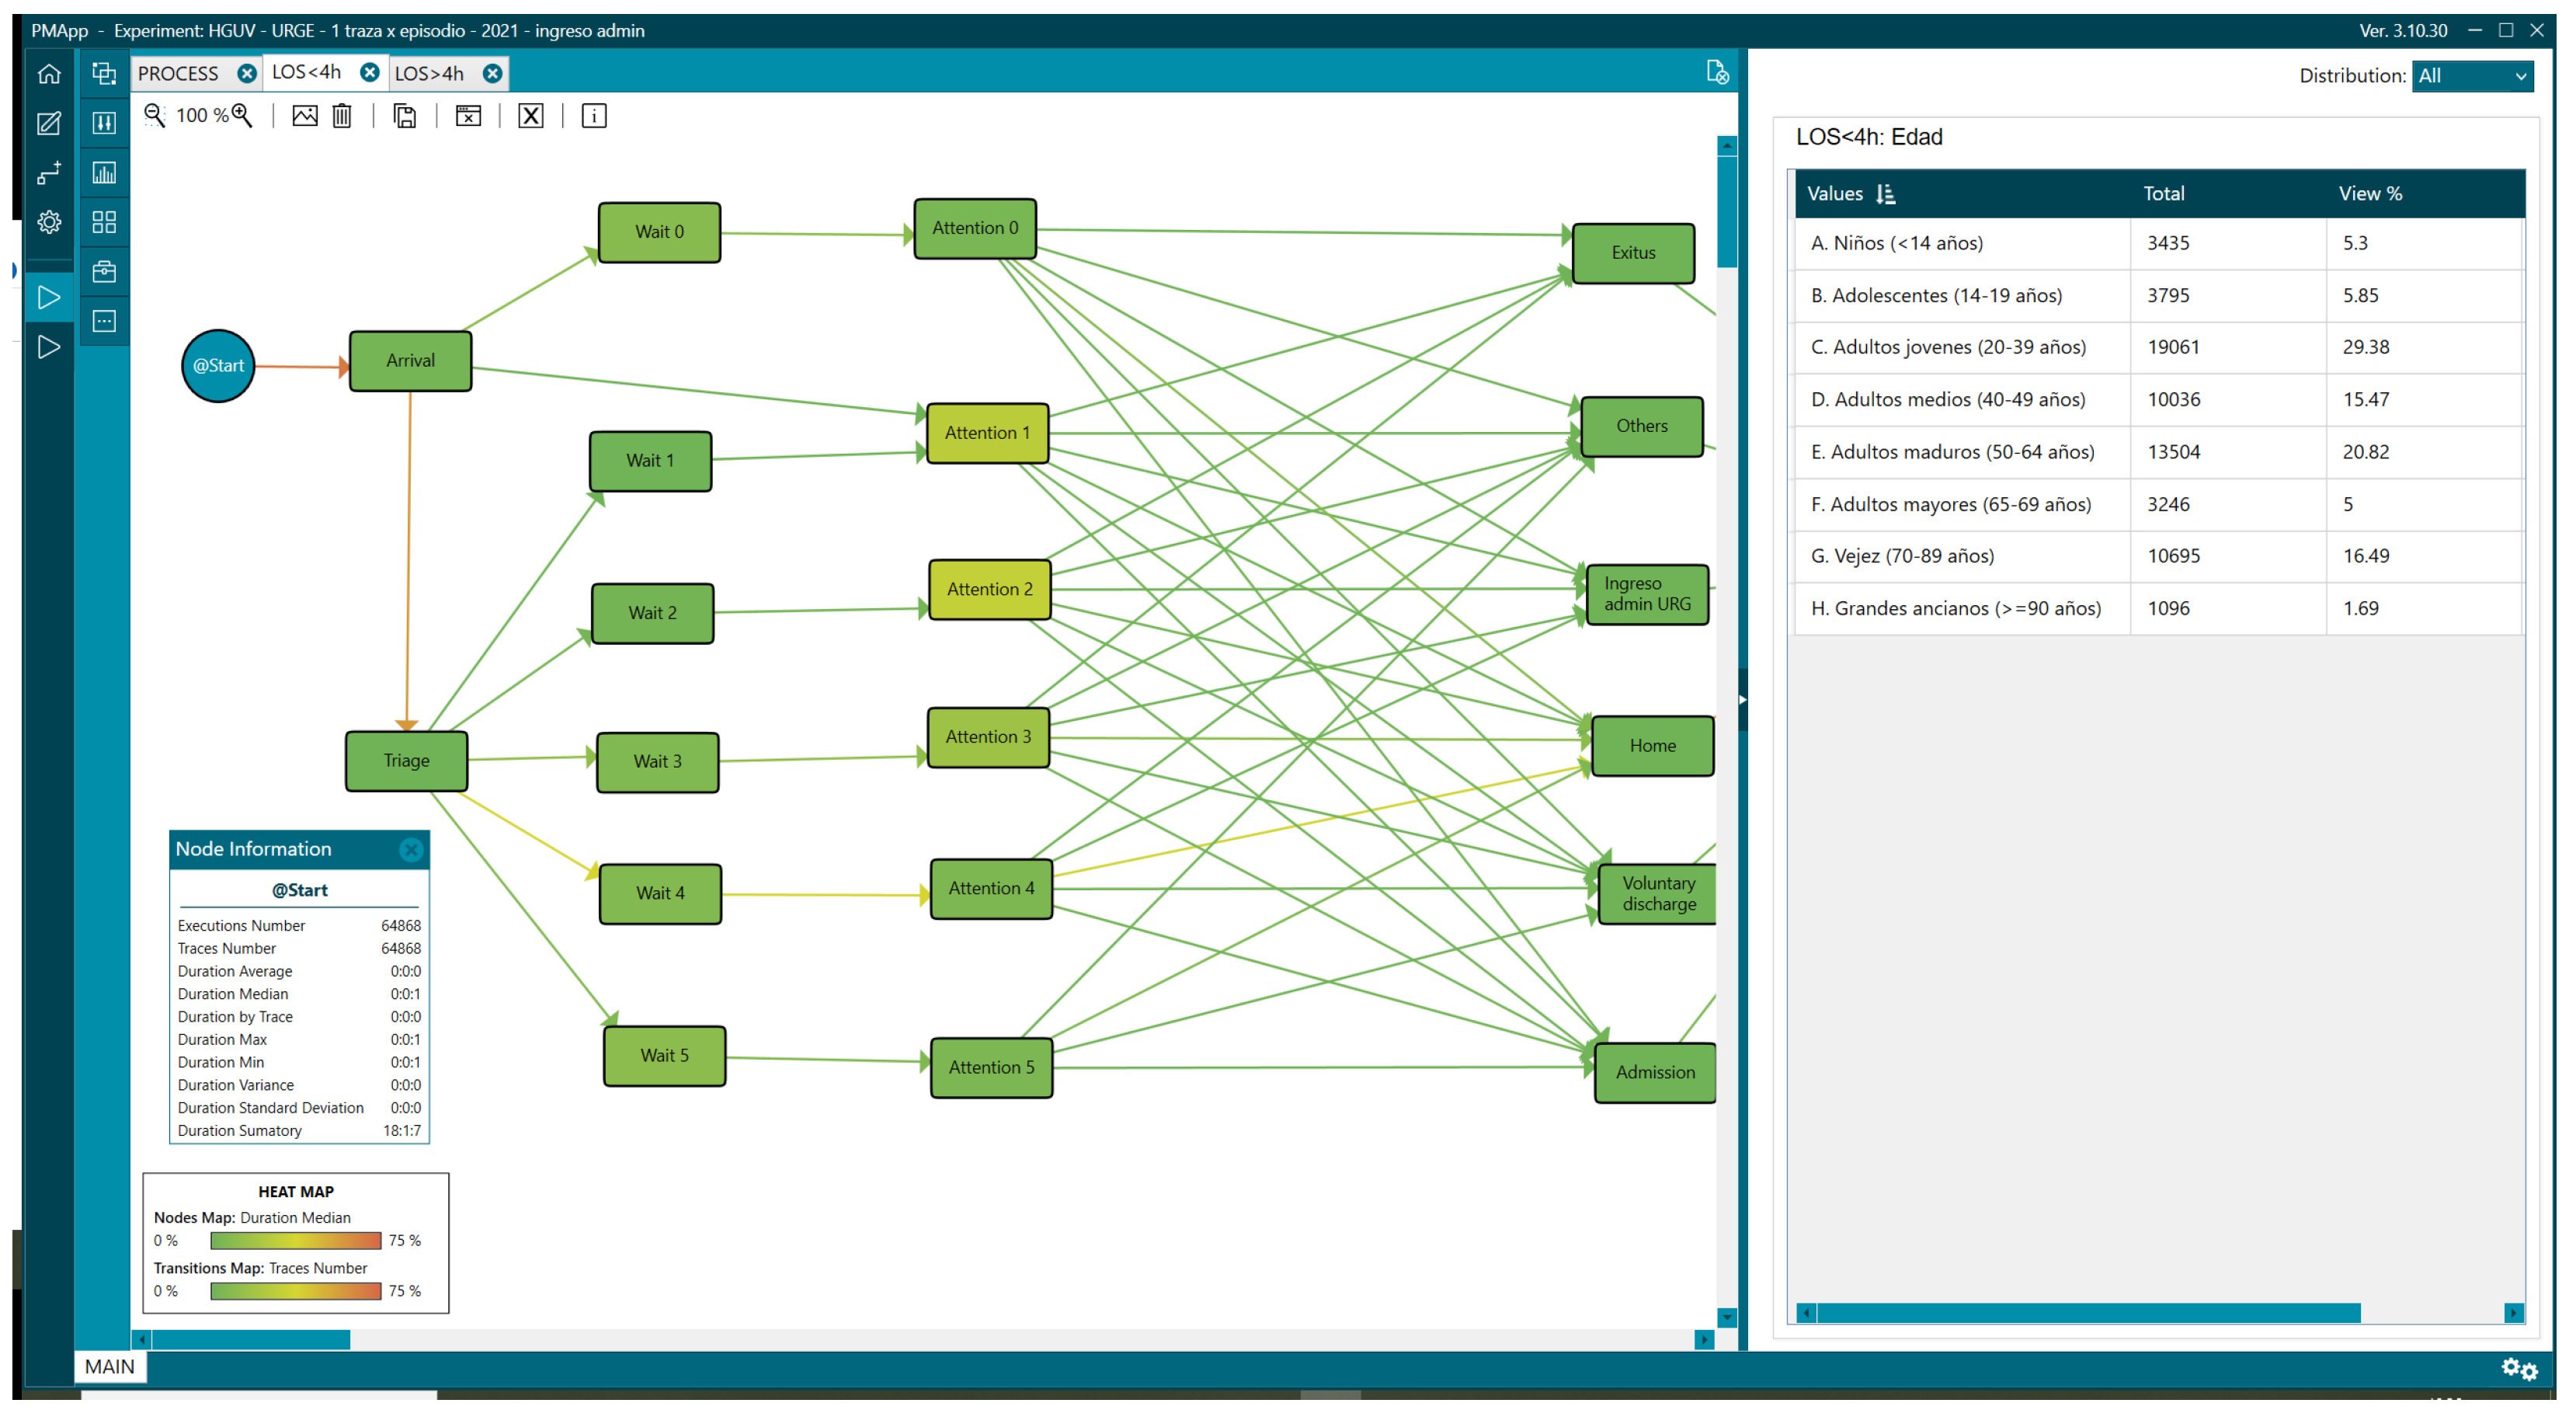
Overall, 31.46% (29,621) of the patients remained in the ED for more than 4 h, and there were differences in the percentage of patients older than 65 years, representing 44.6% for LOS > 4 h (Figure 9) vs. 23.18% for LOS < 4 h (Figure 8, Table 1).
The group with LOS > 4 h also had a higher percentage of urgent triage (Levels II and III) than in the group with LOS < 4 h: 51% (15,000) vs. 22% (13,801).
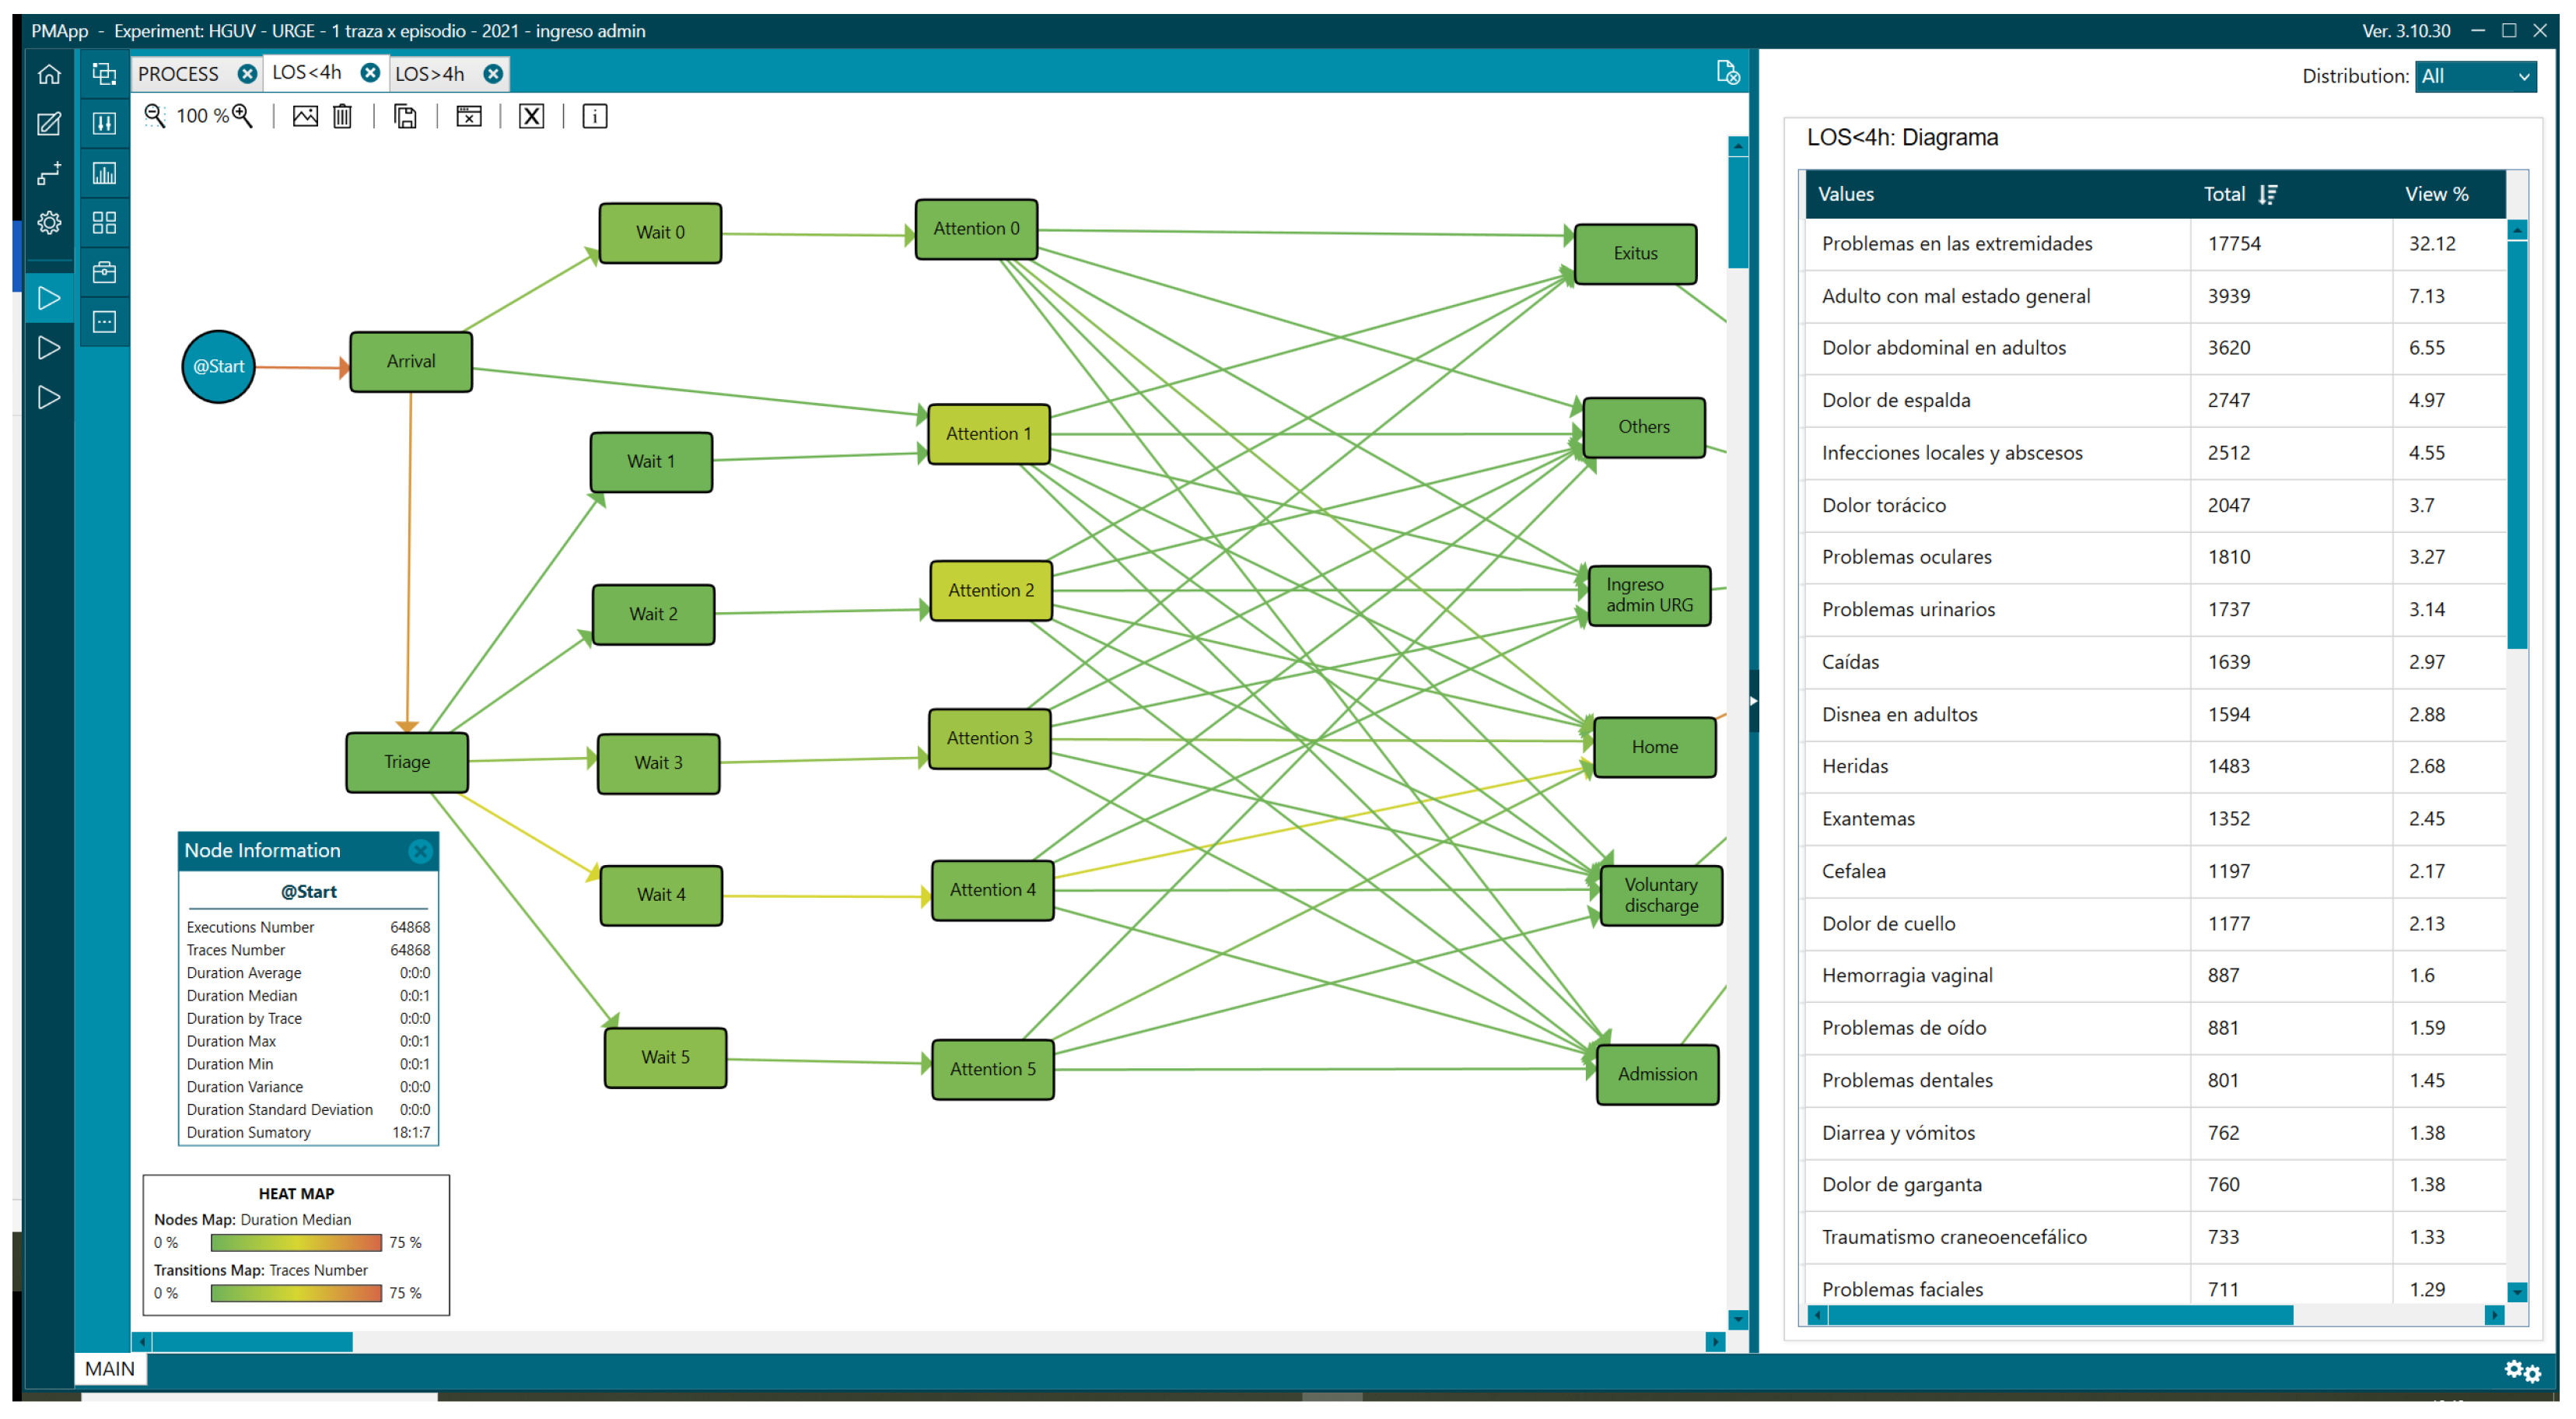
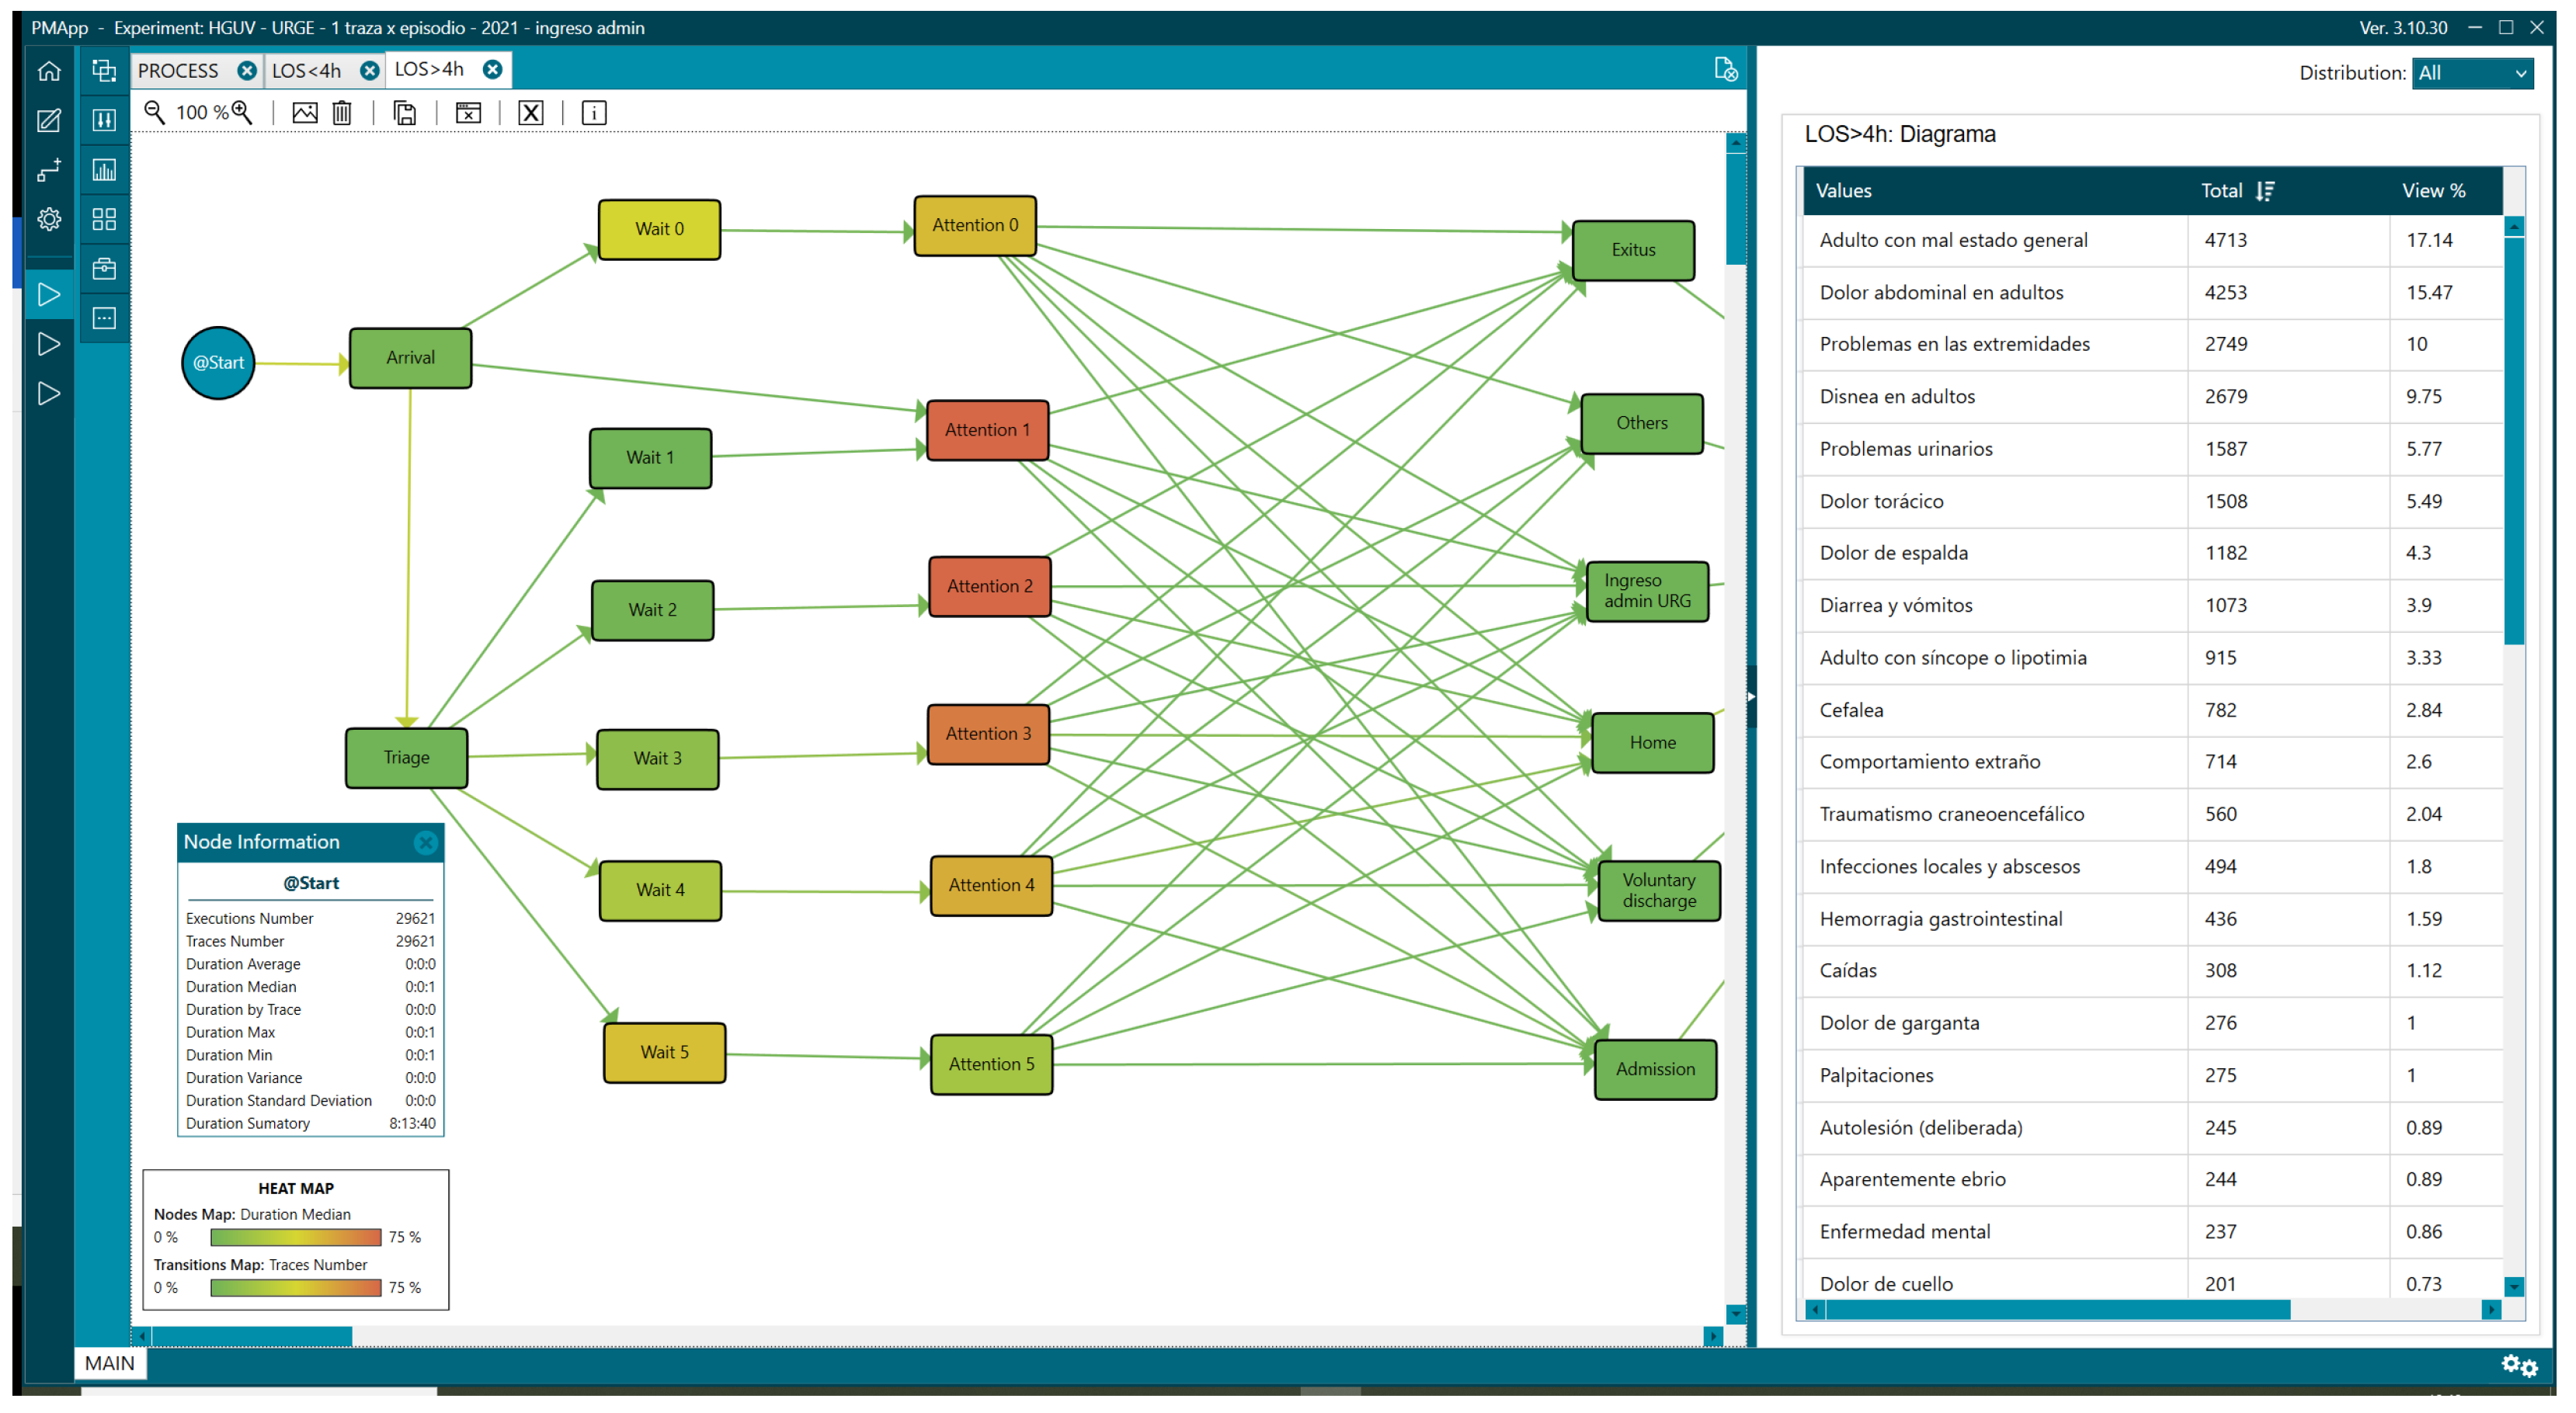
Regarding the reasons for consultation, there were differences in the percentages depending on the analysis group. Comparing data from patients with LOS < 4 h and those with LOS > 4, we found adults with poor general condition [“Adulto con mal estado general”] (17.14% vs. 7.13%), abdominal pain [“Dolor abdominal en adultos”] (15.47% vs. 6.55%), and limb problems [“Problemas en las extremidades”] (10% vs. 32.12%) (Figure 10 and Figure 11, Table 2).

Figure 10.
Reasons for consultation in patients with LOS less than 4 h.

Figure 11.
Reasons for consultation in patients with LOS greater than 4 h.
Table 2.
Attention diagrams of values analysed with PMApp.
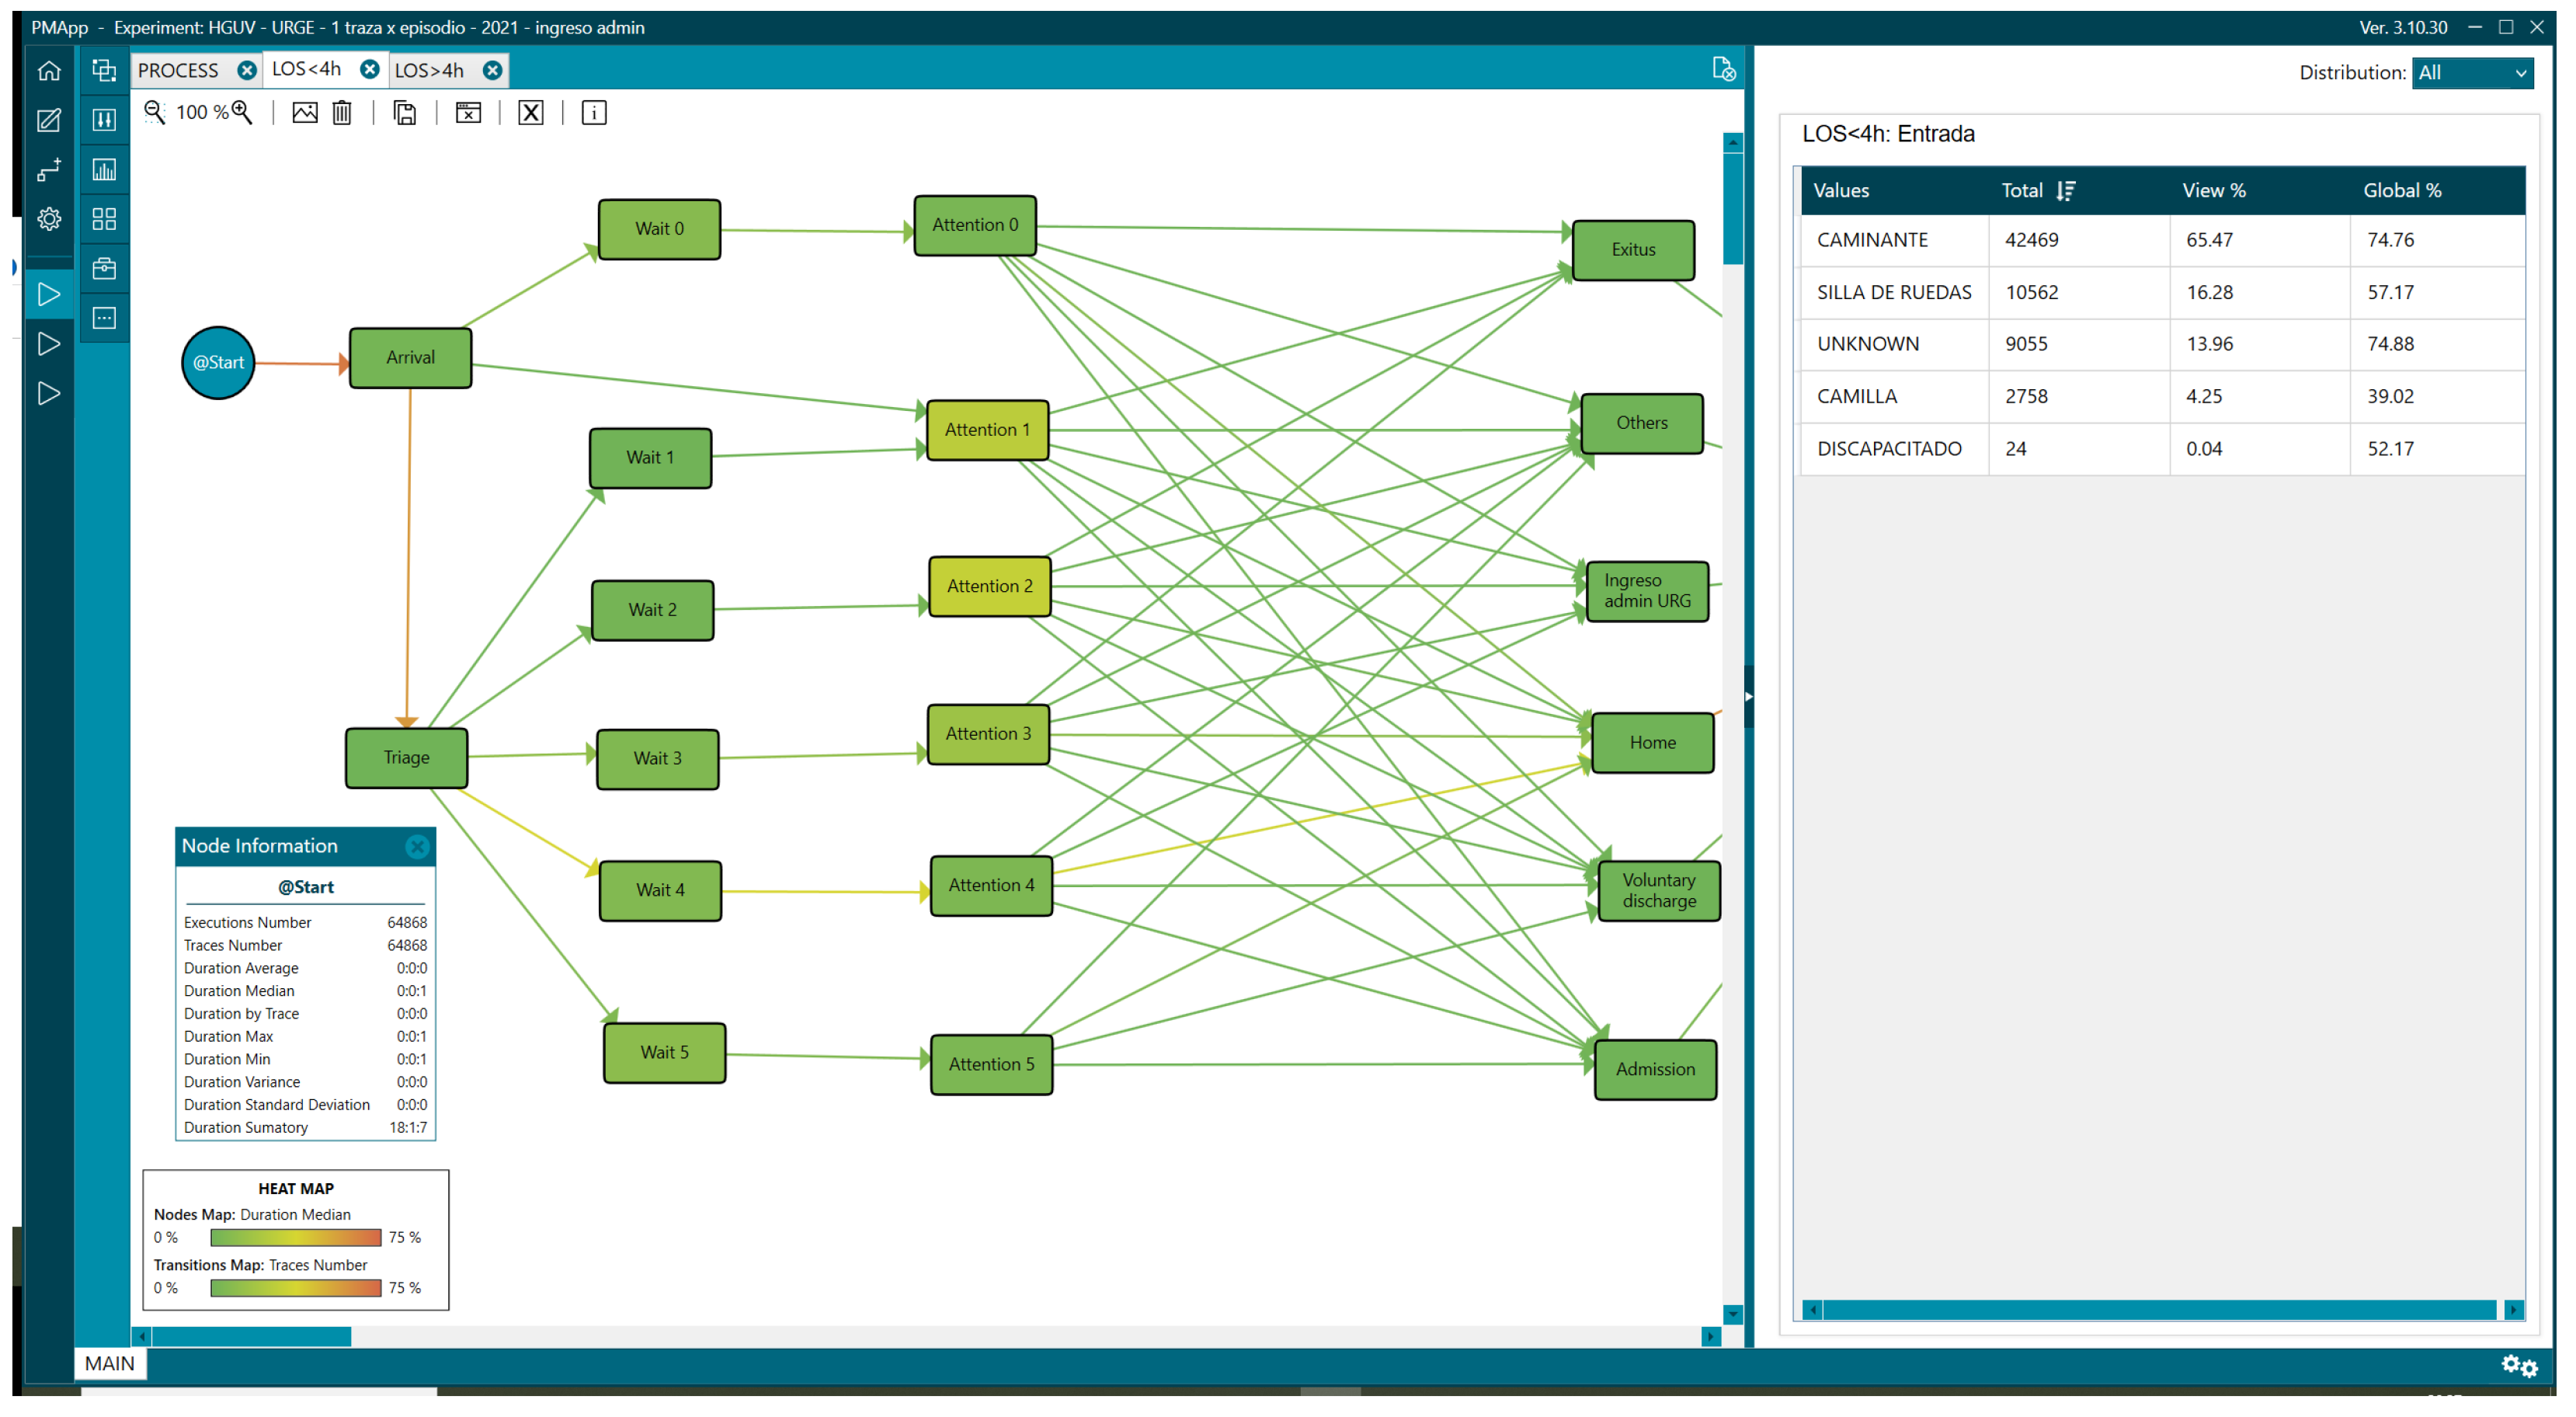
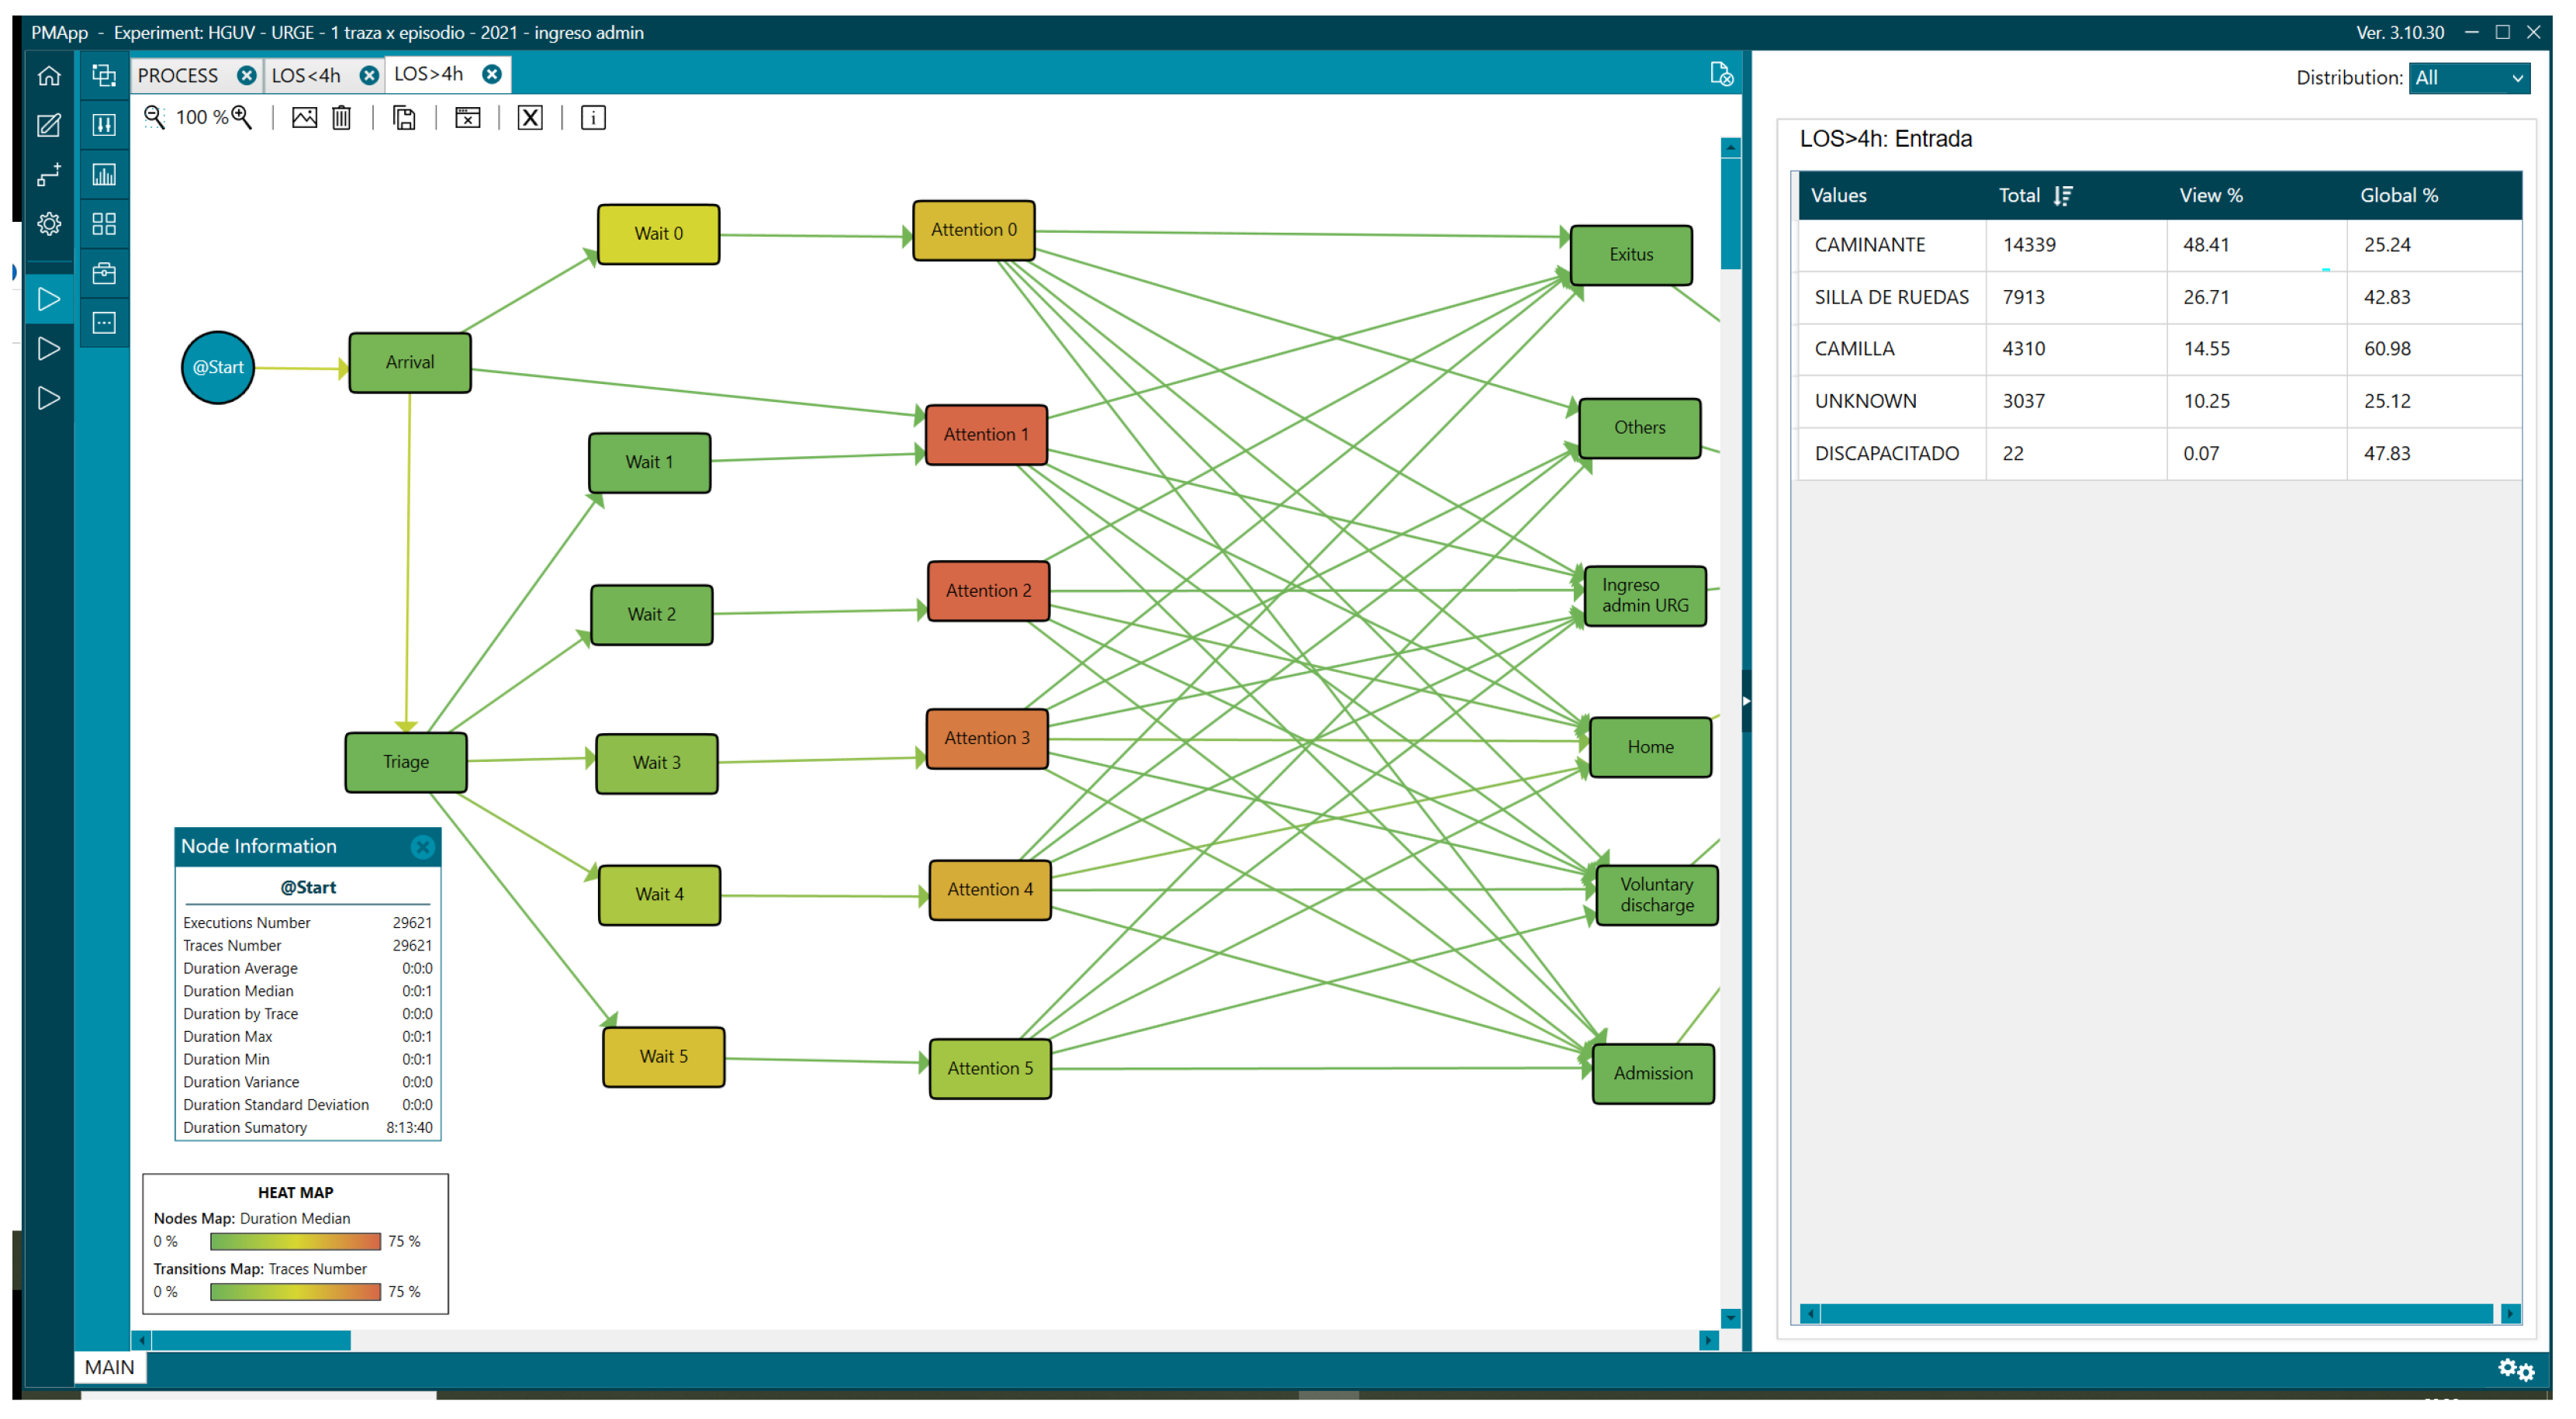
Likewise, the LOS > 4 group required a wheelchair or stretcher upon arrival at the ED, with 41.26% (12,223) versus 20.53% (13,320) with a LOS < 4 (Figure 12 and Figure 13,Table 3).
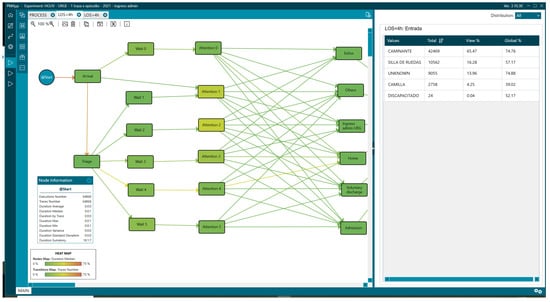
Figure 12.
Mean of arrival of patients with LOS less than 4 h.
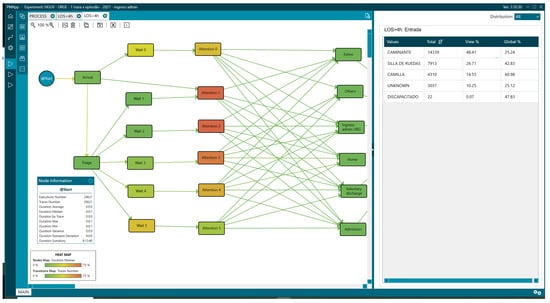
Figure 13.
Mean of arrival of patients with LOS greater than 4 h.
Table 3.
Means of arrival values analysed with PMApp.
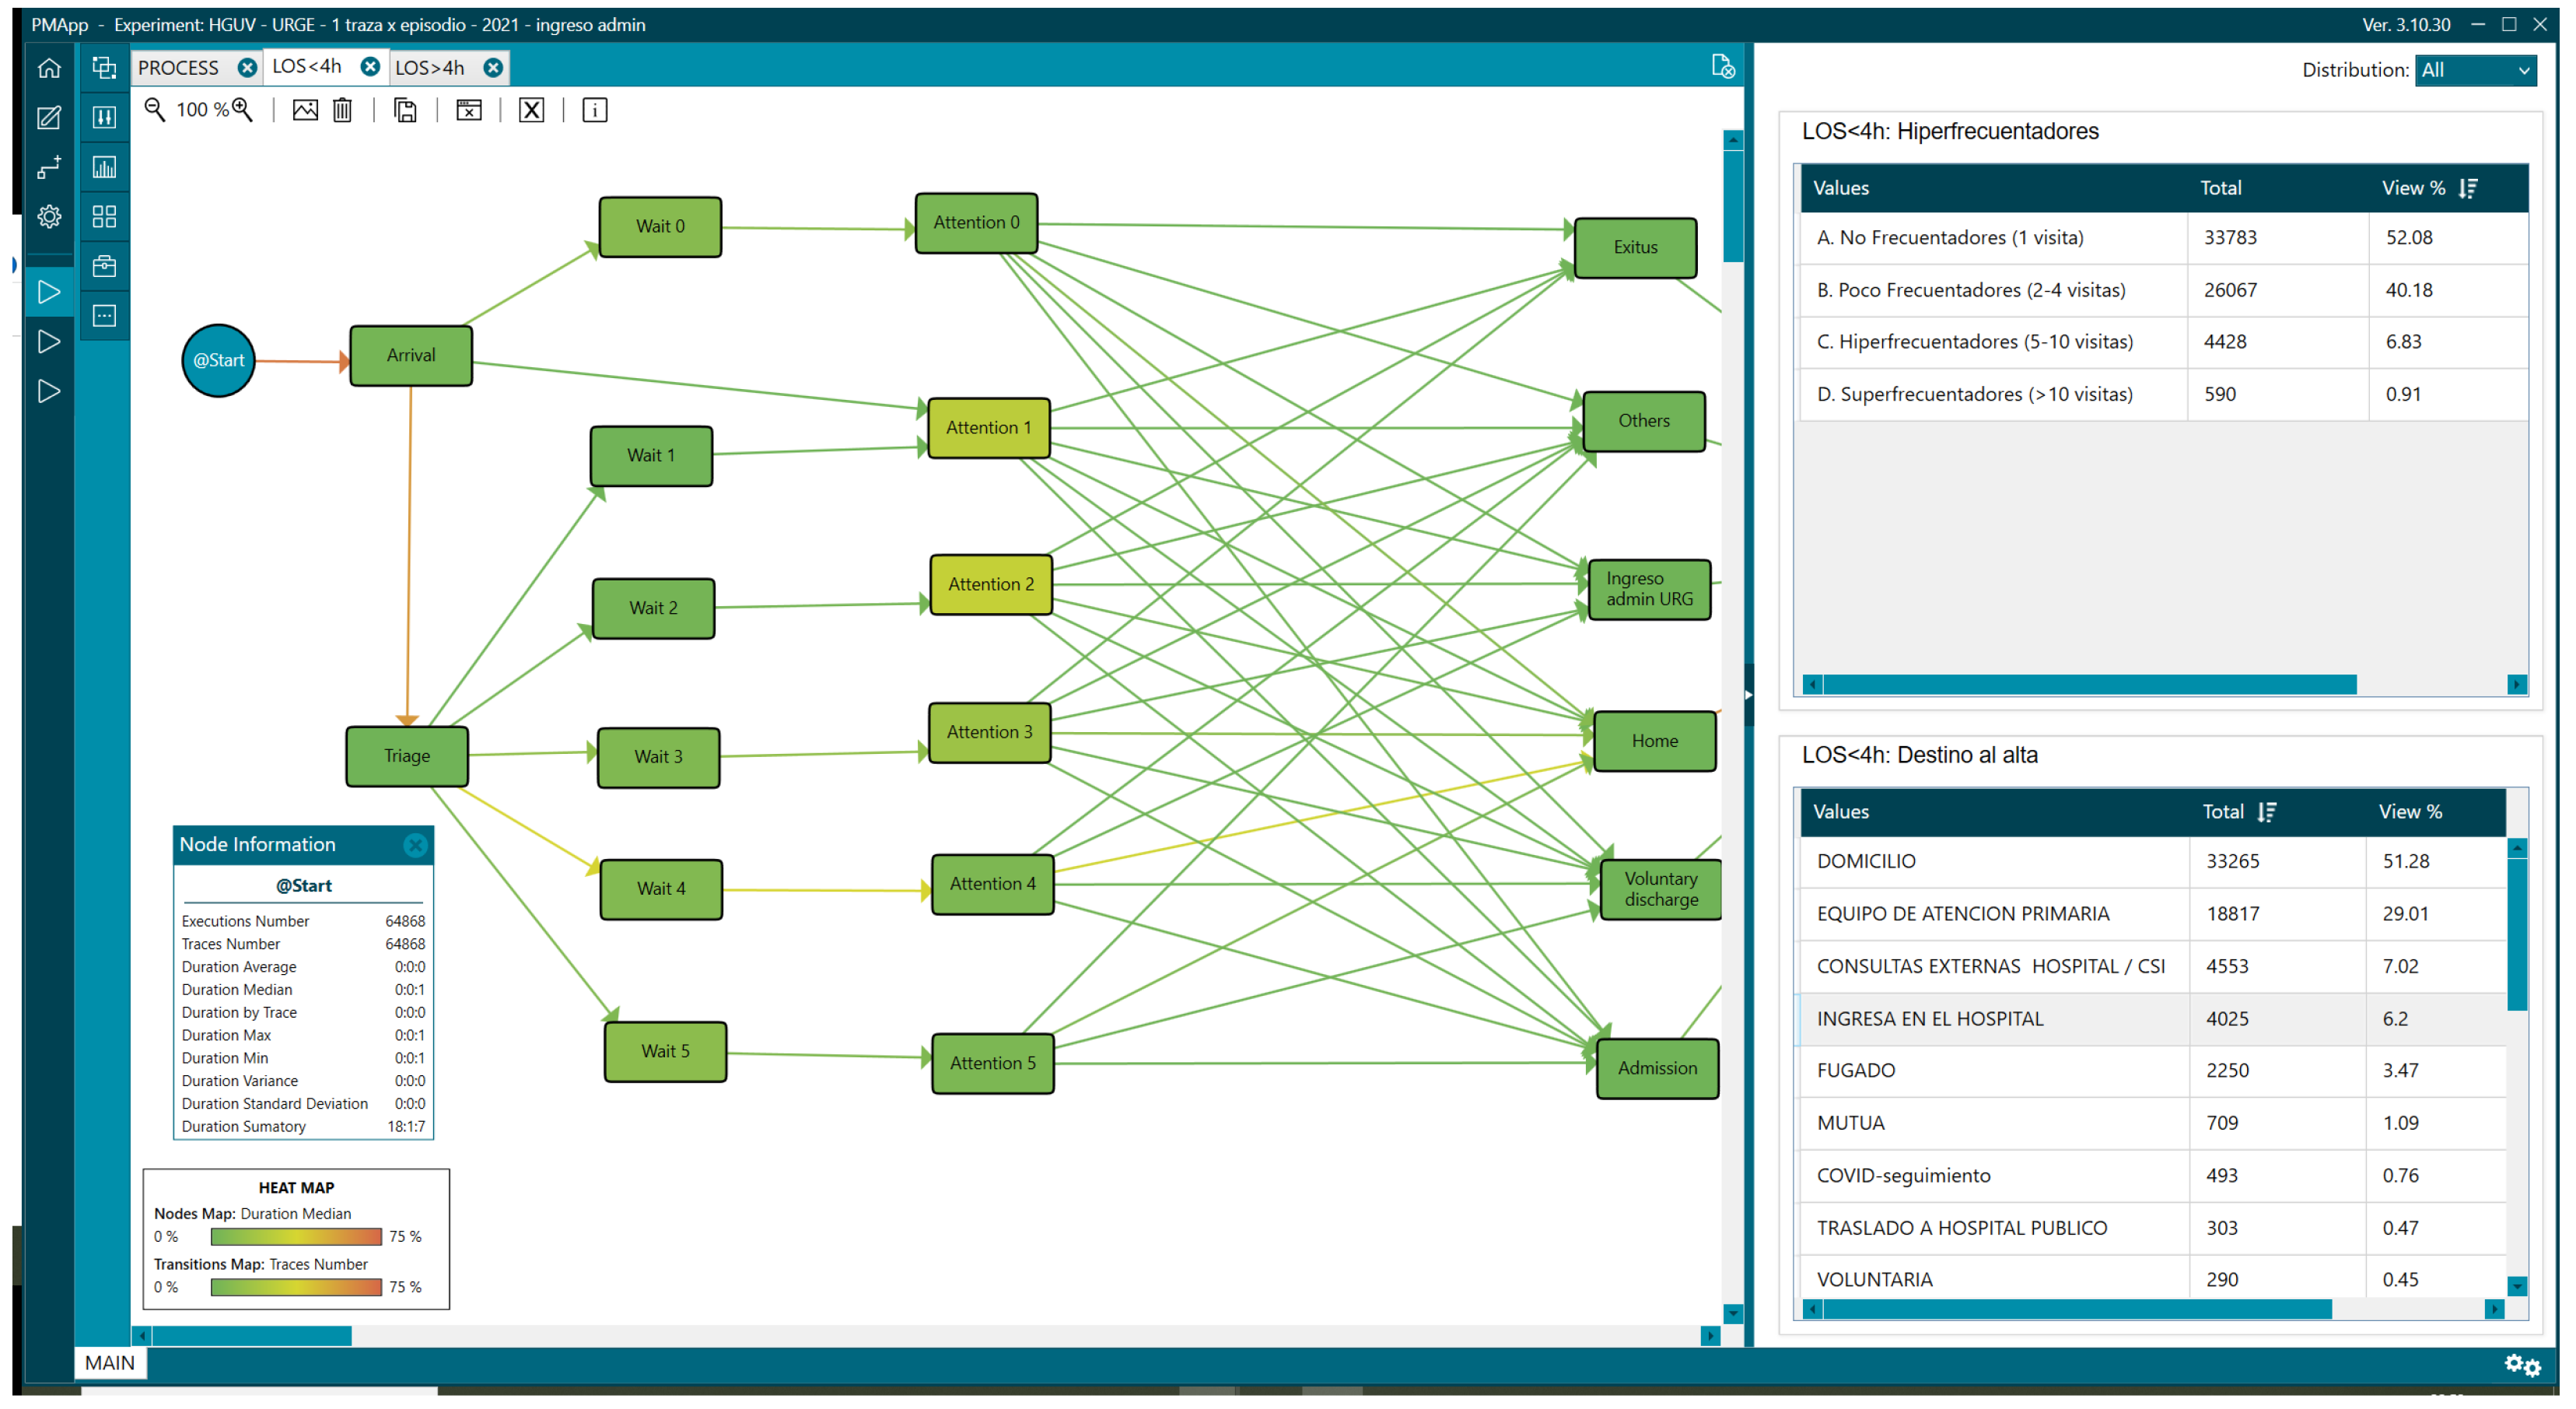
There were also differences in the outcome variables, with the admission rate being 22.83% (6762) vs. 6.2% (4025) in the LOS < 4 group. Regarding the percentage of patients who visited the ED five or more times in a year, we also observed differences: 10.18% (3015) vs. 7.74% (5018) in the LOS < 4 group (Figure 14 and Figure 15, Table 4).
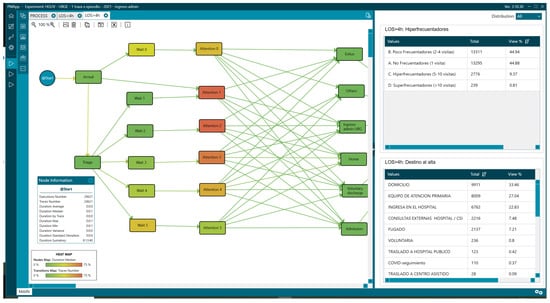
Figure 14.
Mean of arrival of patients and hyperfrequenters with LOS greater than 4 h.
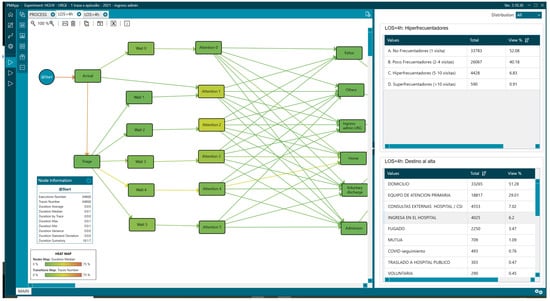
Figure 15.
Mean of arrival of patients and hyperfrequenters with LOS less than 4 h.
Table 4.
Frequency of visit values analysed with PMApp.
Next, we performed a detailed analysis of the times and found that the group with a LOS > 4 h had accumulated delays from their first contact (when patients arrive at the hospital and provide their administrative data). We found that the median time from the arrival of the patient at the hospital to triage was higher (14.27 min vs. 11.24 min). The same happened for the time intra-triage, which was almost double for the LOS > 4 h group (2.17 min vs. 1.25 min).
Regarding the time to first attention, there were also differences in the percentage of patients whose time to first contact exceeded the recommended time for each triage level: Level II (56–50%), Level III (49–35%), Level IV (45–9%), and Level V (19–4%). Finally, we found that the highest number of episodes (11,552) with LOS > 4 h occurred in triage level III, representing 39.16% of the total patients with LOS > 4.
Once we finalised the phase of characterisation of the patients, we performed a relative risk (RR) analysis to detect the relationship between variables and LOS. The variables with the highest RR for a LOS > 4 h were as follows: age; the older the age, the greater the risk of a LOS > 4 h (over 90 years, 1.95 (1.89–2.01)) (Table 1); urgent triage level (I, II, and III); (Level II 2.03 (1.99–2.08)) (Table 5); patients referred by other healthcare professionals; (residence 2.04 (1.96–2.13)) (Table 6); having a condition upon arrival that required a wheelchair and/or stretcher; (stretcher 2.11 (2.06–2.15)) (Table 3).
Table 5.
Manchester triage standard levels values analysed with PMApp.
Table 6.
Referral to the emergency department values analysed with PMApp.
The reasons for consultation, according to the diagram that presented the highest RR for a LOS > 4 h, were seizures 2.31 (2.13–2.52), diabetes 2.24 (2.07–2.42), dyspnea 2.10 (2.05–2.15) overdose 1.99 (1.76–2.25), gastrointestinal bleeding 1.93 (1.81–2.05), adult with poor general condition 1.88 (1.80–1.96), syncope 1.88 (1.80–1.96) and abdominal pain 1.84 (1.80–1.89) (Table 2).
4.2. Selection of Variables for the Study
The IPI obtained through interactive process mining allowed for the visualisation of where, how, and why delays occur in the emergency department. Based on this analysis, the risk rate of each variable recorded in triage was estimated, and three criteria were established to decide its inclusion in the FT formula:
- Robust statistical association: 1.8 for a stay ≥ 4 h;
- Operational prevalence: presence in ≥5% of episodes, ensuring a real impact on patient flow;
- Immediate availability and clinical relevance: the variable must be available during triage and be clinically actionable to activate the FT pathway.
The variables that simultaneously met these criteria were as follows:
- Age > 65 years: RR 1.77 in 70–89 years and RR 1.95 in ≥90 years, indicating frailty and greater care complexity;
- Hyperfrequency ( visits/year): RR 1.25, reflecting multimorbidity and risk of intensive resource consumption;
- Triage level II–III (Manchester): RR 2.03, accounting for 51% of prolonged stays;
- Need for a stretcher or wheelchair upon arrival: RR 2.11, identifying patients with functional limitations and a high likelihood of requiring additional testing;
- External referral (nursing home, primary care, or hospital outpatient clinics): RR 2.04; they usually arrive by ambulance and more frequently require admission;
- Reason for consultation (triage diagrams): These three charts are simultaneously prevalent, heterogeneous, and offer significant room for improvement through rapid interventions.
- –
- Dyspnea: RR 2.10;
- –
- Abdominal pain: RR 1.84;
- –
- Adult with poor general condition: RR 1.88.
These variables were specifically chosen to identify complex patients who are most likely to benefit from early and targeted interventions. For example, advanced age and the need for mobility aids are indicators of frailty, while frequent visits and urgent triage levels highlight patients with higher care needs. This selection ensures that the fast-track pathway prioritises high-impact cases, optimising both clinical outcomes and resource utilisation.
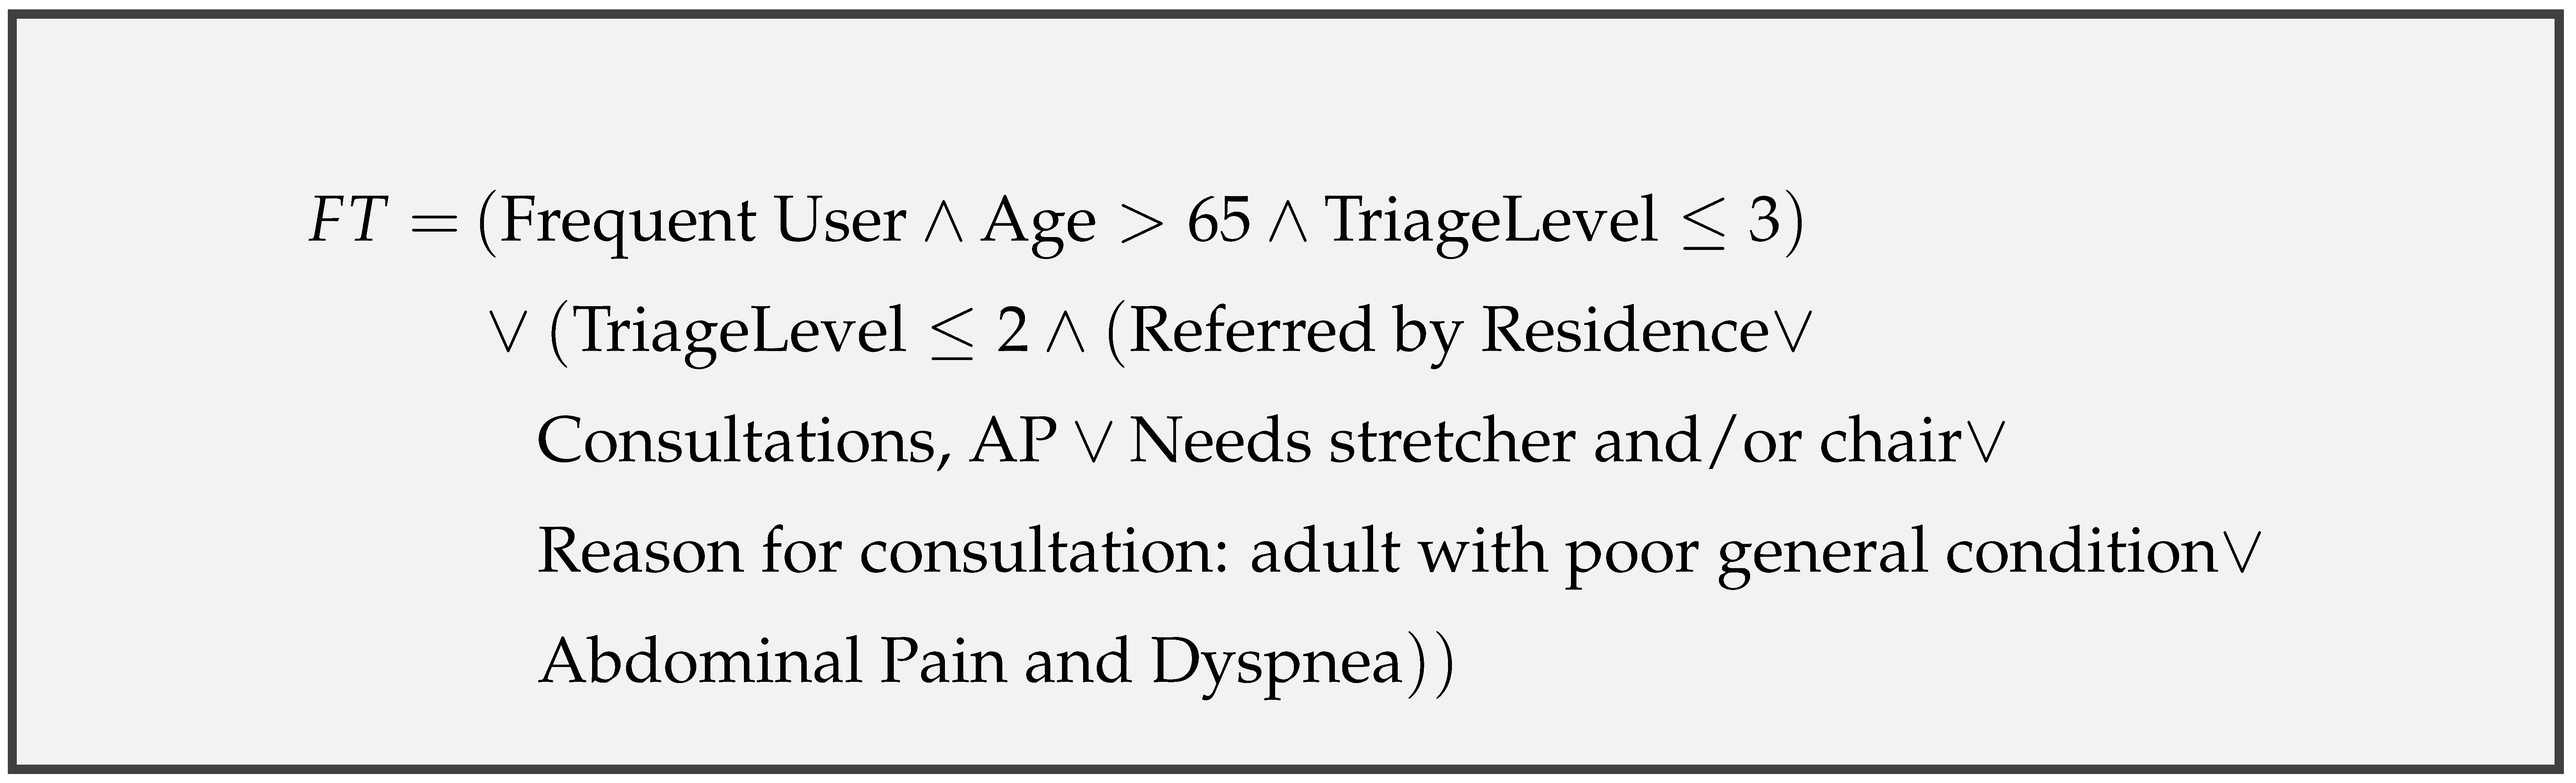
Variables with a high RR but low prevalence (≤2%) such as seizures or gastrointestinal bleeding were discarded to maintain the parsimony of the model and avoid over-alerting. Outcome variables (admission and destination) were also excluded because they were not available at the time of triage. The combination of these predictors formed the FT formula, which was automatically applied at the end of triage:
Age + frequent frequenter + Triage II-III + external referral + need for a stretcher/chair + (dyspnea and abdominal pain and poor general condition)
When the criteria are met, the nurse immediately activates the FT pathway and assigns a bed in the Virtual Decision Room, as assessed in the simulation phase of the study.
4.3. Creation of the Interactive Predictive Formula
The use of PMApp provided a visual representation of the process, allowing us to stratify and compare these processes, integrating, in addition to time, the clinical variables that influenced patient outcomes. This analysis was conducted to understand the problem and propose a formula to predict the probability of patients presenting with a LOS greater than 4 h upon arrival at the ED. This analysis used data on those with the highest RR risk of prolonged LOS, their prevalence, and their clinical relevance. The purpose for which this formula has been manually developed is to facilitate the understanding of the decisions made. In developing the predictive formula, we deliberately excluded laboratory signs or dynamic clinical signs from the model, as our methodology focuses exclusively on variables available prior to triage. This decision ensures that the formula can be applied immediately upon patient arrival, enabling early identification of high-risk patients and facilitating a more streamlined and efficient fast-track process. Additionally, only parameters that can be directly known or observed by healthcare professionals at the time of triage were included, avoiding the use of complex care rules or arrival rate predictions, which would complicate real-time application. By prioritising simplicity and feasibility, the proposed approach ensures operational applicability across diverse emergency department settings, particularly those with limited resources.
In especially critical environments such as emergencies, it is very important that the decisions made automatically are traceable in order to know on what basis the decisions have been made. Classic artificial intelligence systems are not traceable, so transparent traceability that ensures a fair, adequate decision that complies with the canons of equality and equity with the patient is not feasible. Therefore, to construct the formula, expert clinicians selected variables that, in addition to their prevalence and association with length of stay, had high clinical relevance to ensure the formula’s performance when applied to the entire ED.
Critically, the formula is intended to be applied at the point of triage, enabling immediate activation of the fast-track pathway. Consequently, outcome variables, which are only realised later in the patient’s journey, were excluded from the formula due to their unavailability at the time of triage.
The criteria for selecting the variables included in the formula included three characteristics: a high score associated with a prolonged LOS with the RR, prevalence, and finally, the application of the FT pathway must be clinically relevant.
The first variables assessed, advanced age, frequency of visits, and triage level, were included in the formula because they have a strong association with RR and prolonged LOS. Furthermore, these variables have already been validated in various studies as triggers of prolonged LOS [61,62,63].
Variables related to patient mobility and referral by another healthcare professional were also highly correlated with prolonged stays. These variables are interrelated, as many patients who come to the ED and require a stretcher and/or wheelchair arrive by ambulance after being referred by another healthcare professional who determined that their health condition required urgent care. If we add the need for mobility aids, we are faced with a complex and/or fragile patient profile who will benefit from rapid access to care, a fact that has also been confirmed in related studies [61,64,65]
To select the variables related to the reason for consultation, we selected those with the highest RR association with a prolonged LOS. The next step was to determine their prevalence and facilitate analysis. They were organised into two groups to compare the processes and clinical outcome variables that would inform us about their profile:
- Group RR1: Dyspnea, abdominal pain, adult with poor general condition;
- Group RR2: Syncope, seizure, diabetes, diarrhea and vomiting, gastrointestinal bleeding, and self-harm.
Notably, 50% (11,763) of episodes with a LOS > 4 h were in the RR1 group vs. 13% (3131) in the RR2 group. The admission rate for the RR1 group was 34% (4019), representing 59% of the total number of patients with a prolonged LOS. Finally, we analysed the processing times and found that 55% (6549) waited more than an hour for initial care, and 54% (6391) had a LOS greater than 6 h. These percentages were similar for both groups, but when evaluated in absolute numbers, the RR1 group represented almost 50% of the total number of patients with a LOS greater than 4 h (Table 7). This analysis shows that the differences in processing times and patient outcomes are similar in both groups.
Table 7.
Analysis of emergency department outcomes and metrics.
Finally, we evaluated the most prevalent charts to assess the clinical relevance of including them in the final formula. It is worth explaining what a “triage diagram” is. When a patient comes to the ED, they receive what is called a “complaint” or “reason for consultation” in triage. Depending on the reason, the charts are classified under “care diagrams,” which, along with other questions, help classify and organise care in the ED. However, this program’s performance is lower, with underdiagnoses for older adults and paediatric patients, as well as for some diagrams such as “adult with poor general condition,” “headache,” and “abdominal pain,” among others [66,67,68].
In the “adult with poor general condition” diagram, the classified patients often present with non-specific complaints, such as fatigue, weakness, or malaise. Geriatric patients with atypical symptoms, prolonged LOS, and low triage levels are also often included [69,70].
The following diagram assesses “abdominal pain”: This diagram contains significant variability in its causes, which poses a diagnostic challenge for clinicians, ranging from mild symptoms such as gastroenteritis to time-dependent pathologies [71]. Another important feature of this diagram is the presence of pain, whose early treatment is a priority [69,72,73].
Finally, the “dyspnea” diagram was assessed. This diagram includes all presentations that present with a feeling of shortness of breath, regardless of the cause (anaemia, anxiety, heart failure, obstructive pulmonary disease, etc.). Therefore, its presence as a symptom has a significant impact on the clinical outcomes of patients requiring rapid and effective diagnosis [74,75].
Thus, these three diagrams, in addition to being prevalent, present a high complexity, variability, and a wide margin for improvement with the application of an FT route.
The result of the formula, taking into account the above characteristics, was as follows:
4.4. Evaluation of the Interactive Formula with Machine Learning Models
To evaluate the validity of the predictive formula, the results obtained were compared with various classification algorithms known in the scientific literature. The train-test technique was used for the evaluation, which separates the training data. The statistical data presented in Section 4.1 were used to feed the algorithms, and the 6 months of data following the study interval were used for testing the predictive formula, and comparing them with other classic artificial intelligence classifiers.
As can be seen in Table 8, the prediction results of the predictive formula are relatively similar to the best automatic techniques, maintaining a good balance between sensitivity and specificity, which makes it perfectly acceptable for use in the prediction of patients with high LOS, taking into account that it is a fully traceable formula.
Table 8.
Evaluation results of the classification systems used in comparison with the predictive formula.
4.5. Evaluation of the Effectiveness of the Fast-Track Predictive Formula
After the predictive formula was developed, the next step was to evaluate its practical application in the emergency department (ED), specifically its impact on operations when used during triage. The focus was on assessing how reserving a specific number of beds—through a Virtual Decision Room (VDR)—for patients identified at triage as having a high probability of a length of stay (LOS) greater than 4 h would affect overall ED performance.
For this, a simulation was created using the PMApp application. This simulation modeled the ED process by incorporating patients flagged by the predictive formula into the VDR, assuming a fixed number of dedicated beds. The simulation replayed the patient flow, assigning those patients to the fast track if a bed was available. If no bed was available at the time of the patient’s arrival, they remained in the standard queue. Admitted patients occupied a virtual bed for the same duration as in the original historical log.
The analysis used a separate dataset—patients admitted between 1 January and 31 December 2022—to ensure independence from the data used to develop the formula. All patients were processed in order of arrival. The system removed those who met the predictive criteria and virtually admitted them to the fast track if space allowed.
This approach allowed for the observation of the impact of removing high-LOS patients from the standard ED workflow on overall delays and occupancy levels. Two key performance indicators were measured: Delay, defined as the average LOS across all patients, compared between the original dataset and the simulated fast track scenario and Occupation, measured as the number of patients present in the ED at the same time (denoted as k), reflecting real-time system congestion.
Together, these metrics provided insight into how the predictive model and VDR implementation could optimise patient flow and resource utilisation in the ED.
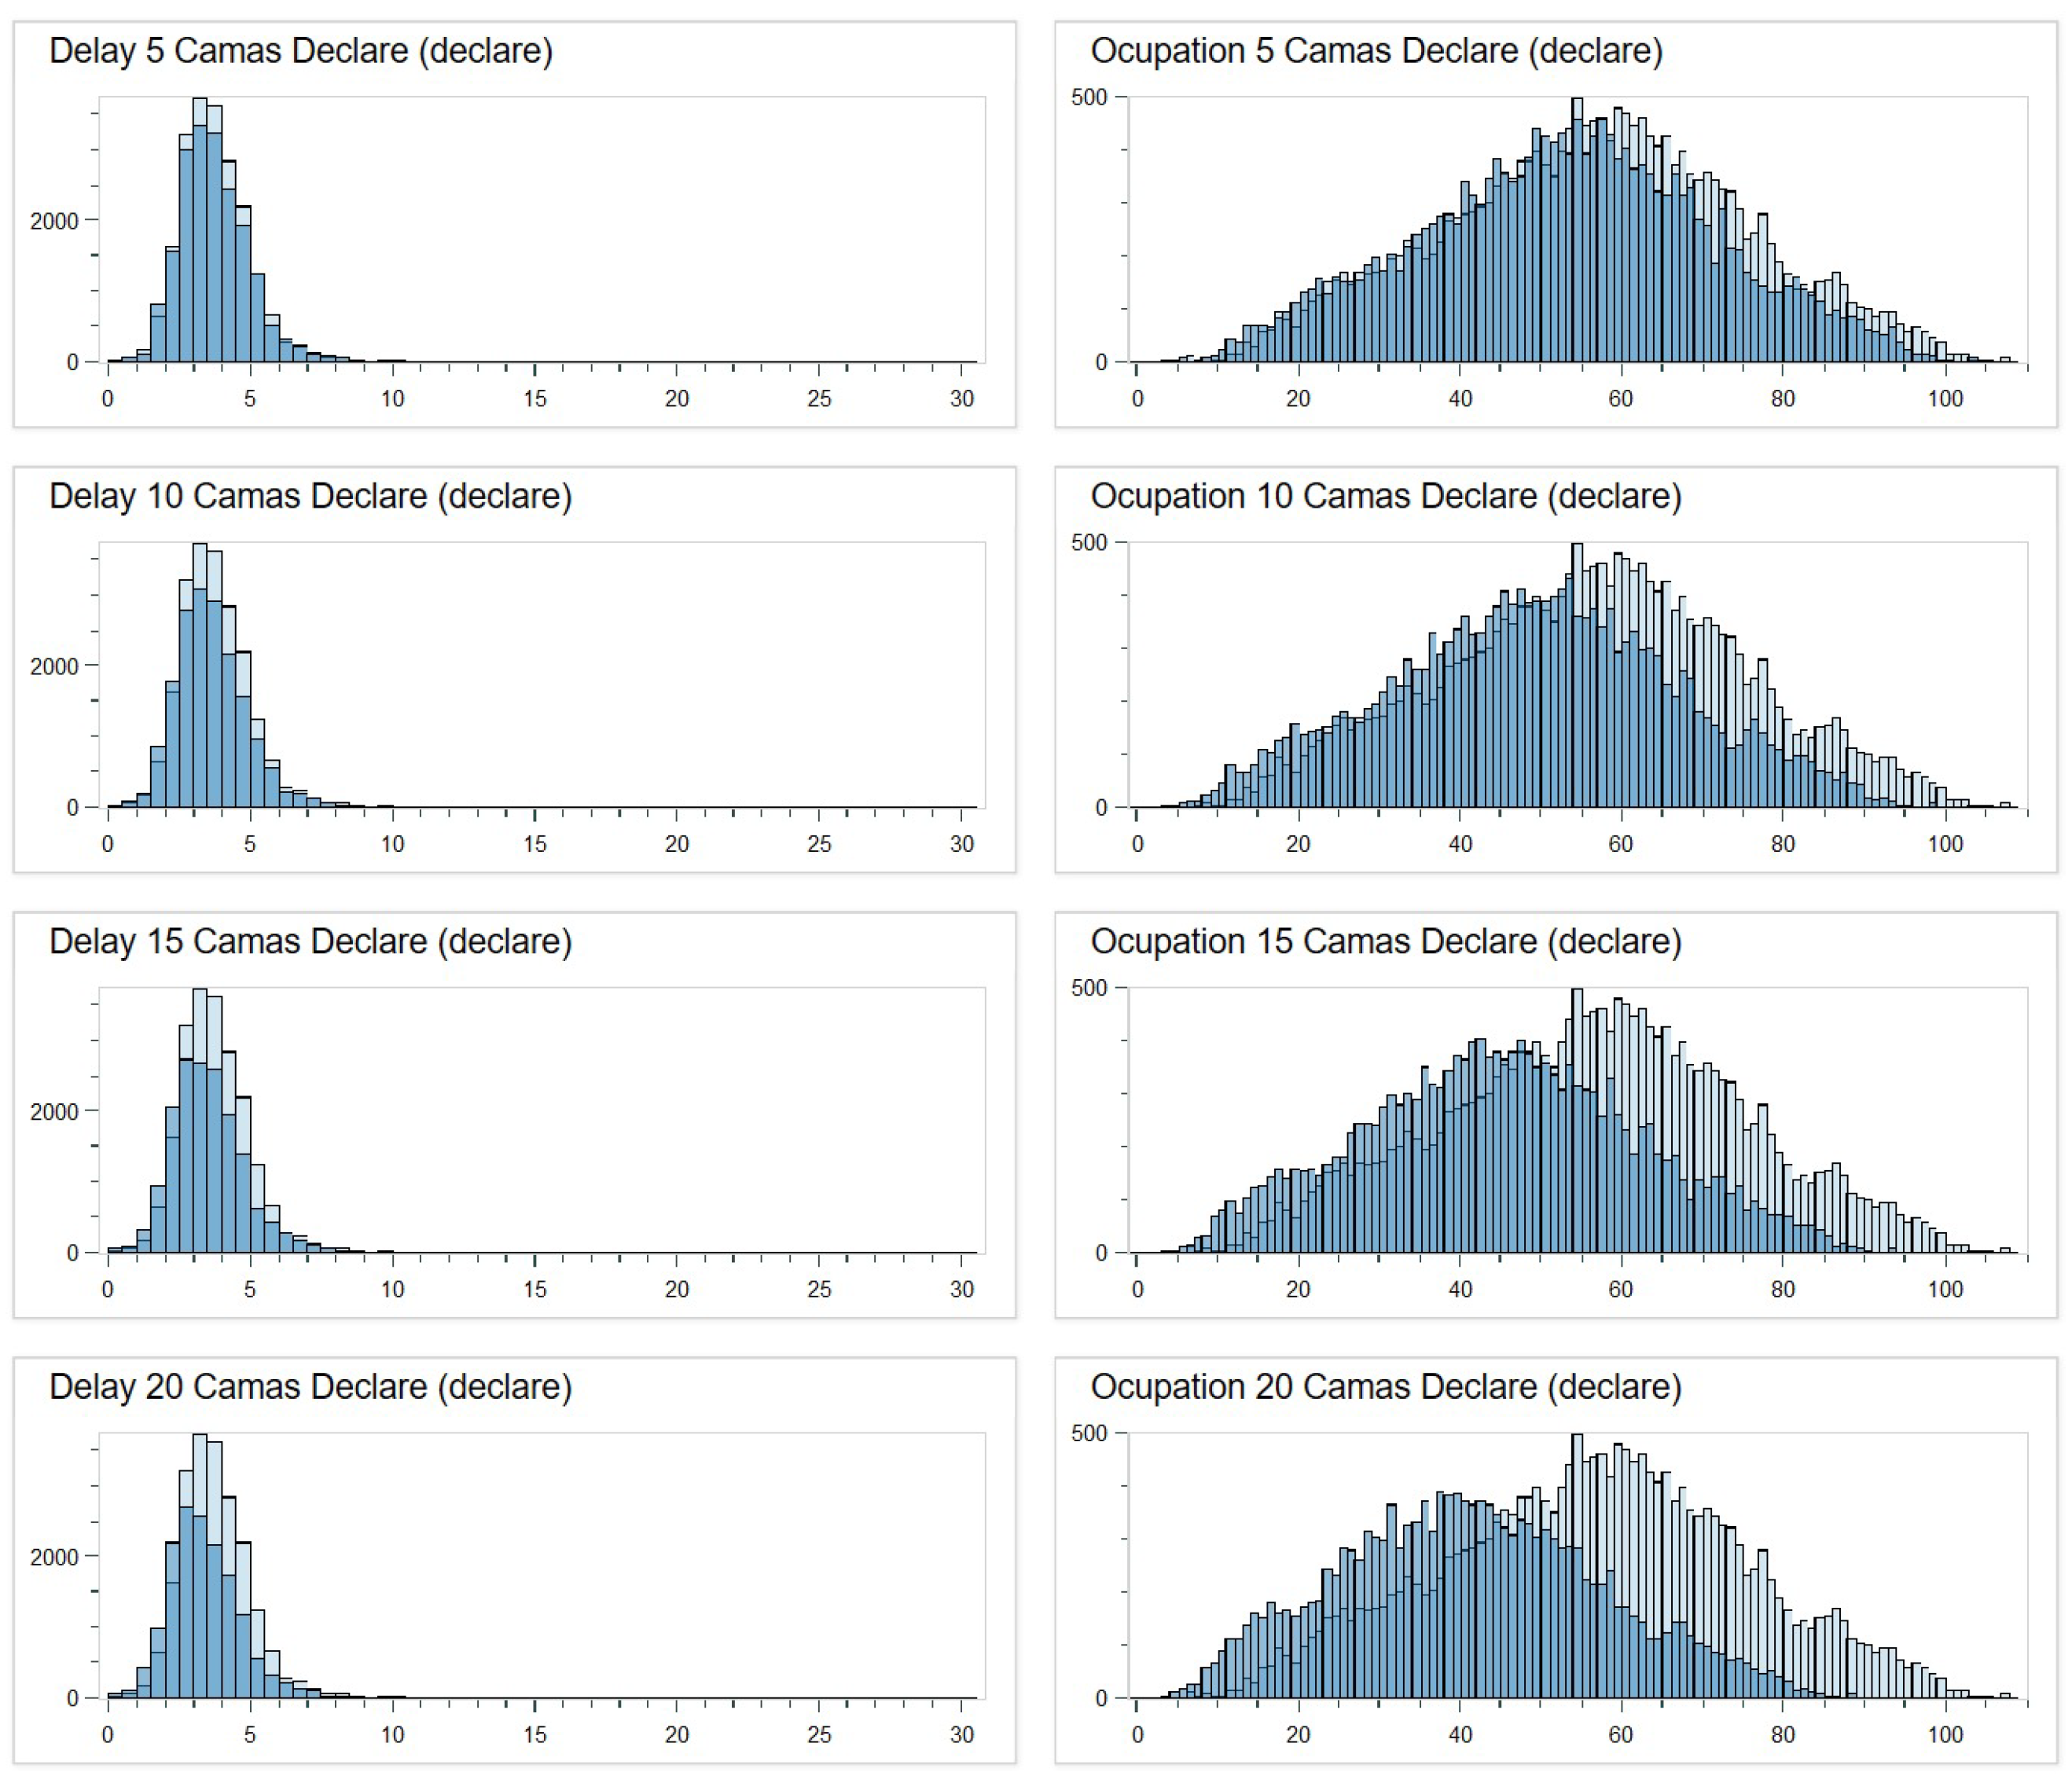
Table 9 shows the results of the simulation. In the case of having 5 beds, these beds would be fully occupied 80.56% of the time, while if 20 beds were reserved, they would only be occupied 72.53% of the time. In the case of improving LOS, by adding 5 beds, the average LOS of patients would be reduced by 9%, while with 20 beds, it would be reduced by 48%. As for occupancy, with 5 beds, the average number of simultaneous patients in the ED would be reduced by 16%, while with 20 beds, it would be reduced by 84%.
Table 9.
Impact of the predictive formula by the number of assigned beds.
These reductions are especially significant for complex patients, who tend to experience the longest delays and are at higher risk of adverse outcomes. By reserving a dedicated number of beds for this population, the fast-track pathway not only reduces their LOS but also mitigates complications such as delirium and enhances their overall care experience.
Graphically, Figure 16 illustrates the effects of applying the predictive formula in the simulation through a histogram. As shown, increasing the number of reserved beds leads to a smoother and lower histogram profile. This indicates a reduction in length of stay (LOS) and a noticeable leftward shift in the distribution. In other words, the greater the number of reserved beds, the more significant the reduction in LOS and occupancy rate within the emergency department, demonstrating the clear impact of the predictive model on patient flow. This is particularly relevant for complex patients, who benefit the most from dedicated resources. The reduction in LOS and occupancy rates underscores the importance of prioritising this high-impact population in ED management strategies.
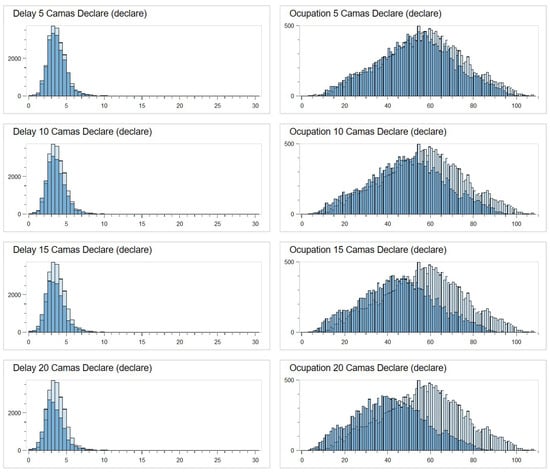
Figure 16.
Histograms with the simulation results.
5. Discussion
This study demonstrates how the integration of process mining with simulation enables the identification, application, and evaluation of tailored management interventions, such as fast-track pathways, to reduce length of stay (LOS) in emergency departments (EDs). The findings highlight that age, triage level, and reason for consultation are critical predictors of prolonged LOS, consistent with prior research in this area [17,19,20].
The proposed fast-track pathway specifically addresses the needs of complex patients, who represent a high-impact group within EDs. By prioritising these patients, the pathway ensures that limited resources are directed where they are most needed, improving both clinical outcomes and operational efficiency.
Although the term ‘fast track’ is traditionally associated with less complex cases, we intentionally used it to describe the expedited pre-admission process for complex patients. This terminology underscores the critical time saved during their triage and early management, which is essential for improving outcomes in this high-risk population. We acknowledge that this could lead to some confusion, as these patients often require longer stays overall, but the emphasis is on the swift initial intervention.
Unlike traditional flow management strategies, such as separation by severity level or FT referrals for low-acuity patients, this approach offers a novel alternative. By leveraging process mining on historical and real-time data, the study identified a targeted subset of patients, representing only 20–30% of visits but consuming the majority of ED resources and LOS. This Pareto-type methodology shifts focus from patient volume to the drivers of congestion, prioritising interventions based on their impact on care delivery.
The predictive formula, activated at triage by nursing staff, anticipates the needs of high-risk and vulnerable patients, particularly those aged 65 years and older. This population is at increased risk of complications, such as delirium, which is closely associated with prolonged waiting times, overstimulation, and fragmented care. Early intervention not only improves clinical outcomes but also mitigates costs associated with extended stays, readmissions, and institutionalisation.
From an economic perspective, unnecessary ED occupancy incurs substantial direct and opportunity costs [76]. This formula optimises resource utilisation by identifying patients who stand to benefit most from accelerated care, thereby balancing resource allocation and reducing inefficiencies. Furthermore, the operational flexibility of the model facilitates adaptation to varying healthcare pressures and available resources. Simulation results show that even minimal interventions, such as allocating five beds to the FT pathway, lead to a 21% reduction in average LOS and a 35% decrease in overall ED saturation. These benefits scale proportionally as additional resources are allocated, providing managers with a scalable and adaptable tool.
The predictive formula was developed using clinically relevant variables, including age >65 years; frequent ED visits; triage levels II and III; referrals from residential care; and specific reasons for consultation such as poor general condition, dyspnea, and abdominal pain. Validated through simulation, the formula demonstrates predictive performance comparable to other studies [77]. Unlike complex machine learning models, this transparent and traceable tool is easily integrated into existing workflows without requiring sophisticated IT systems, ensuring its applicability even in resource-limited settings.
Nonetheless, this approach has limitations. This study is a proof of concept to evaluate the feasibility and potential applicability of implementing this approach in other hospitals. Thus, the study was conducted in a single centre, necessitating adaptations for broader generalisation. Furthermore, while populations such as paediatrics and obstetrics–gynecology were excluded due to circuit differences, some paediatric patients admitted for trauma were included in the dataset. This inclusion introduces potential bias and inconsistency, particularly when the goal is to validate a model designed for a complex population.
Additionally, while no formal collinearity analysis or dimension reduction was conducted, the decision to design the interactive formula was made by a committee of experts, leveraging all available statistical information and accepting the potential risks associated with confounding variables. Similarly, while the model’s potential to decide priority access to the FT pathway is acknowledged, we consider the risk of false positives and negatives a limitation. However, because the formula is traceable, experts can make real-time decisions based on its outputs, mitigating potential biases or exclusions.
Moreover, the inability to publicly share the formula, simulation code, or dataset due to the privacy and confidentiality requirements surrounding health data is recognised as a limitation. In particular, anonymising the dataset would render it unsuitable for this specific analysis. Finally, the retrospective, observational design depends on the quality of available data, and further evaluation in fully real-world settings is required to validate its effectiveness.
In addition, although our approach employs an interactive formula designed to enhance explainability and traceability for healthcare professionals, its generalisability is limited. Due to the inherent variability across healthcare institutions, the proposed formula may not yield the same performance in different hospital settings. As such, for reproducibility and optimal results, we recommend replicating the full study and adapting the formula to each specific context.
Thus, despite these limitations, the study emphasises that patients with the longest LOS contribute the most to ED congestion, and targeted FT interventions can significantly improve both LOS and overall ED performance.
6. Conclusions
This study highlights the potential of activating fast-track pathways through predictive modelling and simulation, representing a paradigm shift in ED management. By addressing the underlying drivers of congestion, this strategy ensures proactive, patient-centred care and offers a competitive alternative to existing decongestion strategies. The simplicity of the predictive formula enhances its acceptance among ED staff and its adaptability across diverse hospital environments.
The results confirm the substantial improvements in LOS and ED saturation achieved by implementing the predictive FT pathway. Even with minimal resources, the intervention proved effective, with benefits scaling as additional resources were allocated. This combination of operational simplicity, low cost, immediate activation, and measurable effectiveness positions the tool as a practical and scalable solution for ED congestion management.
Future multicentre validations and real-world implementations are necessary to establish this approach as a cornerstone of ED management improvement policies. By building on the foundations laid in this study, broader evaluations could further confirm the generalisability and effectiveness of this predictive, simulation-based methodology in diverse healthcare settings.
Author Contributions
A.C.-M. and G.I.-S. contributed equally to the writing of the original draft, investigation, software, methodology, data curation, and validation of the results. C.F.-L. contributed to the supervision conceptualisation, investigation, software and review and editing. J.G., M.P.-L. and M.F.-L. contributed equally to data curation, validation of the results, and revision of the paper. All authors have read and agreed to the published version of the manuscript.
Funding
This research received no external funding.
Institutional Review Board Statement
The study is part of the “process mining for the management of an emergency service” project, conducted in accordance with the Declaration of Helsinki, and approved by the Ethics Committee of Hospital Universitario de Valencia (protocol code PRV00249).
Informed Consent Statement
Patient consent was waived due to the retrospective nature of the study, which was retrospective.
Data Availability Statement
The datasets presented in this article are not readily available due to their sensitive nature.
Acknowledgments
Thanks are due to my colleagues and friends, emergency nurses of the Consorcio Hospital General de Valencia and colleagues at the UPV for their involvement in the project.
Conflicts of Interest
The authors declare no conflicts of interest.
Abbreviations
The following abbreviations are used in this manuscript:
| ED | Emergency Department |
| FT | Fast Track |
| HCP | Healthcare Professional |
| IPI | Interactive Process Indicator |
| IPM | Interactive Process Mining |
| PM Experts | Interactive Process Miners |
| Data Rodeo | Interactive Process Data Rodeo |
| KPI | Key Performance Indicator |
| LOS | Length of Stay |
| ML | Machine Learning |
| POCT | Point-of-Care Testing |
| PMApp | Process Mining Application Toolkit |
| RAU | Rapid Assessment Unit |
| RR | Risk Rate/Relative Risk |
| VDR | Virtual Decision Room |
References
- de Sanidad, M. Portal Estadístico Ministerio Sanidad. 2022. Available online: https://pestadistico.inteligenciadegestion.sanidad.gob.es/publicoSNS/C/siae/siae/hospitales/actividad-asistencial/actividad-urgencias (accessed on 20 November 2024).
- Morley, C.; Unwin, M.; Peterson, G.M.; Stankovich, J.; Kinsman, L. Emergency department crowding: A systematic review of causes, consequences and solutions. PLoS ONE 2018, 13, e0203316. [Google Scholar] [CrossRef] [PubMed]
- Rasouli, H.R.; Esfahani, A.A.; Nobakht, M.; Eskandari, M.; Mahmoodi, S.; Goodarzi, H.; Farajzadeh, M.A. Outcomes of crowding in emergency departments; a systematic review. Arch. Acad. Emerg. Med. 2019, 7, e52. [Google Scholar] [PubMed]
- Bernstein, S.L.; Aronsky, D.; Duseja, R.; Epstein, S.; Handel, D.; Hwang, U.; McCarthy, M.; John McConnell, K.; Pines, J.M.; Rathlev, N.; et al. The effect of emergency department crowding on clinically oriented outcomes. Acad. Emerg. Med. 2009, 16, 1–10. [Google Scholar] [CrossRef] [PubMed]
- Hoot, N.R.; Aronsky, D. Systematic review of emergency department crowding: Causes, effects, and solutions. Ann. Emerg. Med. 2008, 52, 126–136. [Google Scholar] [CrossRef]
- Asplin, B.R.; Magid, D.J.; Rhodes, K.V.; Solberg, L.I.; Lurie, N.; Camargo, C.A., Jr. A conceptual model of emergency department crowding. Ann. Emerg. Med. 2003, 42, 173–180. [Google Scholar] [CrossRef]
- MacIsaac, M.; Peter, E. Emergency department crowding: An examination of older adults and vulnerability. Nursing Ethics 2025, 32, 99–110. [Google Scholar] [CrossRef]
- Memedovich, A.; Asante, B.; Khan, M.; Eze, N.; Holroyd, B.R.; Lang, E.; Kashuba, S.; Clement, F. Strategies for improving ED-related outcomes of older adults who seek care in emergency departments: A systematic review. Int. J. Emerg. Med. 2024, 17, 16. [Google Scholar] [CrossRef]
- Yarmohammadian, M.H.; Rezaei, F.; Haghshenas, A.; Tavakoli, N. Overcrowding in emergency departments: A review of strategies to decrease future challenges. J. Res. Med. Sci. 2017, 22, 23. [Google Scholar]
- Forster, A.J.; Stiell, I.; Wells, G.; Lee, A.J.; Van Walraven, C. The effect of hospital occupancy on emergency department length of stay and patient disposition. Acad. Emerg. Med. 2003, 10, 127–133. [Google Scholar] [CrossRef]
- Heymann, E.P.; Wicky, A.; Carron, P.N.; Exadaktylos, A.K. Death in the emergency department: A retrospective analysis of mortality in a Swiss University hospital. Emerg. Med. Int. 2019, 2019, 5263521. [Google Scholar] [CrossRef]
- Lauque, D.; Khalemsky, A.; Boudi, Z.; Östlundh, L.; Xu, C.; Alsabri, M.; Onyeji, C.; Cellini, J.; Intas, G.; Soni, K.D.; et al. Length-of-stay in the emergency department and in-hospital mortality: A systematic review and meta-analysis. J. Clin. Med. 2022, 12, 32. [Google Scholar] [CrossRef] [PubMed]
- Andersson, J.; Nordgren, L.; Cheng, I.; Nilsson, U.; Kurland, L. Long emergency department length of stay: A concept analysis. Int. Emerg. Nurs. 2020, 53, 100930. [Google Scholar] [CrossRef] [PubMed]
- Kłosiewicz, T.; Rozmarynowska, M.; Konieczka, P.; Mazur, M. Impact of geriatric admissions on workload in the emergency department. Healthcare 2023, 11, 593. [Google Scholar] [CrossRef] [PubMed]
- Elder, N.M.; Mumma, B.E.; Maeda, M.Y.; Tancredi, D.J.; Tyler, K.R. Emergency Department length of Stay is Associated with Delirium in older adults. West. J. Emerg. Med. 2023, 24, 532. [Google Scholar] [CrossRef]
- Ba-Aoum, M.; Hosseinichimeh, N.; Triantis, K.P.; Pasupathy, K.; Sir, M.; Nestler, D. Statistical analysis of factors influencing patient length of stay in emergency departments. Int. J. Ind. Eng. Oper. Manag. 2023, 5, 220–239. [Google Scholar] [CrossRef]
- Choi, W.; Woo, S.H.; Kim, D.H.; Lee, J.Y.; Lee, W.J.; Jeong, S.; Cha, K.; Youn, C.S.; Park, S. Prolonged length of stay in the emergency department and mortality in critically ill elderly patients with infections: A retrospective multicenter study. Emerg. Med. Int. 2021, 2021, 9952324. [Google Scholar] [CrossRef]
- Otto, R.; Blaschke, S.; Schirrmeister, W.; Drynda, S.; Walcher, F.; Greiner, F. Length of stay as quality indicator in emergency departments: Analysis of determinants in the German Emergency Department Data Registry (AKTIN registry). Intern. Emerg. Med. 2022, 17, 1199–1209. [Google Scholar] [CrossRef]
- Maynou, L.; Street, A.; Burton, C.; Mason, S.M.; Stone, T.; Martin, G.; Van Oppen, J.; Conroy, S. Factors associated with longer wait times, admission and reattendances in older patients attending emergency departments: An analysis of linked healthcare data. Emerg. Med. J. 2023, 40, 248–256. [Google Scholar] [CrossRef]
- Sweeny, A.; Keijzers, G.; O’Dwyer, J.; Arendts, G.; Crilly, J. Predictors of a long length of stay in the emergency department for older people. Intern. Med. J. 2020, 50, 572–581. [Google Scholar] [CrossRef]
- Urbina, A.; Juvé-Udina, M.E.; Romero-García, M.; Delgado-Hito, P.; González-Samartino, M.; Adamuz, J. Care complexity factors associated with revisits to an emergency department. Emergencias 2023, 35, 245–251. [Google Scholar] [CrossRef]
- Marsilio, M.; Roldan, E.T.; Salmasi, L.; Villa, S. Operations management solutions to improve ED patient flows: Evidence from the Italian NHS. BMC Health Serv. Res. 2022, 22, 974. [Google Scholar] [CrossRef] [PubMed]
- Juvé-Udina, M.; Matud, C.; Farrero, S.; Jiménez, H.; Rodrıguez, E.; Martınez, M.; Mesalles-Morredes, M. Intensity of nursing care: Workloads or individual complexity. Metas Enfermería 2010, 13, 6–14. [Google Scholar]
- Kobayashi, K.J.; Knuesel, S.J.; White, B.A.; Bravard, M.A.; Chang, Y.; Metlay, J.P.; Raja, A.S.; Md, M.L.M. Impact on length of stay of a hospital medicine emergency department boarder service. J. Hosp. Med. 2020, 15, 147–153. [Google Scholar] [CrossRef] [PubMed]
- Grant, K.L.; Bayley, C.J.; Premji, Z.; Lang, E.; Innes, G. Throughput interventions to reduce emergency department crowding: A systematic review. Can. J. Emerg. Med. 2020, 22, 864–874. [Google Scholar] [CrossRef]
- Gasperini, B.; Pierri, F.; Espinosa, E.; Fazi, A.; Maracchini, G.; Cherubini, A. Is the fast-track process efficient and safe for older adults admitted to the emergency department? BMC Geriatr. 2020, 20, 154. [Google Scholar] [CrossRef]
- Mostafa, R.; El-Atawi, K. Strategies to measure and improve emergency department performance: A review. Cureus 2024, 16, e52879. [Google Scholar] [CrossRef]
- Fernandez-Llatas, C. Applying interactive process mining paradigm in healthcare domain. In Interactive Process Mining in Healthcare; Springer: Cham, Switzerland, 2021; pp. 103–117. [Google Scholar]
- Fernandez-Llatas, C. Interactive Process Mining in Healthcare: An Introduction; Springer: Cham, Switzerland, 2021. [Google Scholar]
- Parmenter, D. Key Performance Indicators: Developing, Implementing, and Using Winning KPIs; John Wiley & Sons: Hoboken, NJ, USA, 2015. [Google Scholar]
- Horwitz, L.I.; Green, J.; Bradley, E.H. US emergency department performance on wait time and length of visit. Ann. Emerg. Med. 2010, 55, 133–141. [Google Scholar] [CrossRef]
- Singer, A.J.; Thode, H.C., Jr.; Viccellio, P.; Pines, J.M. The association between length of emergency department boarding and mortality. Acad. Emerg. Med. 2011, 18, 1324–1329. [Google Scholar] [CrossRef]
- Fernandez-Llatas, C. Bringing interactive process mining to health professionals: Interactive data rodeos. In Interactive Process Mining in Healthcare; Springer: Cham, Switzerland, 2021; pp. 119–140. [Google Scholar]
- Ibanez-Sanchez, G.; Fernandez-Llatas, C.; Valero-Ramon, Z.; Bayo-Monton, J.L. Pmapp: An interactive process mining toolkit for building healthcare dashboards. In Proceedings of the International Workshop on Explainable Artificial Intelligence in Healthcare, Third International Workshop, XAI-Healthcare 2023, and First International Workshop, PM4H 2023, Portoroz, Slovenia, 15 June 2023; Springer: Cham, Switzerland, 2023; pp. 75–86. [Google Scholar]
- Mackway-Jones, K.; Marsden, J.; Windle, J. Emergency Triage: Manchester Triage Group; John Wiley & Sons: Hoboken, NJ, USA, 2014. [Google Scholar]
- Soler, W.; Gómez Muñoz, M.; Bragulat, E.; Alvarez, A. Triage: A key tool in emergency care. Proc. An. Del Sist. Sanit. Navar. 2010, 33, 55–68. [Google Scholar]
- Moreno-Carrillo, A.; Arenas, L.M.Á.; Fonseca, J.A.; Caicedo, C.A.; Tovar, S.V.; Muñoz-Velandia, O.M. Application of queuing theory to optimize the Triage process in a tertiary emergency care (“ER”) department. J. Emergencies Trauma Shock 2019, 12, 268–273. [Google Scholar] [CrossRef]
- Soster, C.B.; Anschau, F.; Rodrigues, N.H.; Silva, L.G.A.d.; Klafke, A. Advanced triage protocols in the emergency department: A systematic review and meta-analysis. Rev. Lat.-Am. Enferm. 2022, 30, e3511. [Google Scholar] [CrossRef] [PubMed]
- Samadbeik, M.; Staib, A.; Boyle, J.; Khanna, S.; Bosley, E.; Bodnar, D.; Lind, J.; Austin, J.A.; Tanner, S.; Meshkat, Y.; et al. Patient flow in emergency departments: A comprehensive umbrella review of solutions and challenges across the health system. BMC Health Serv. Res. 2024, 24, 274. [Google Scholar] [CrossRef] [PubMed]
- Van den Heede, K.; Van de Voorde, C. Interventions to reduce emergency department utilisation: A review of reviews. Health Policy 2016, 120, 1337–1349. [Google Scholar] [CrossRef] [PubMed]
- Alter, D.N. Point-of-care testing for the emergency department patient: Quantity and quality of the available evidence. Arch. Pathol. Lab. Med. 2021, 145, 308–319. [Google Scholar] [CrossRef]
- England, N. Rapid Assessment and Treatment Models in Emergency Departments; NHS England: London, UK, 2012. [Google Scholar]
- Haraden, C.; Resar, R. Patient flow in hospitals: Understanding and controlling it better. Front. Health Serv. Manag. 2004, 20, 3. [Google Scholar] [CrossRef]
- Baugh, C.W.; Venkatesh, A.K.; Bohan, J.S. Emergency department observation units: A clinical and financial benefit for hospitals. Health Care Manag. Rev. 2011, 36, 28–37. [Google Scholar] [CrossRef]
- Adadi, A.; Berrada, M. Peeking inside the black-box: A survey on explainable artificial intelligence (XAI). IEEE Access 2018, 6, 52138–52160. [Google Scholar] [CrossRef]
- Devnath, L.; Fan, Z.; Luo, S.; Summons, P.; Wang, D. Detection and visualisation of pneumoconiosis using an ensemble of multi-dimensional deep features learned from Chest X-rays. Int. J. Environ. Res. Public Health 2022, 19, 11193. [Google Scholar] [CrossRef]
- Rigatti, S.J. Random forest. J. Insur. Med. 2017, 47, 31–39. [Google Scholar] [CrossRef]
- Gardner, M.W.; Dorling, S. Artificial neural networks (the multilayer perceptron)—A review of applications in the atmospheric sciences. Atmos. Environ. 1998, 32, 2627–2636. [Google Scholar] [CrossRef]
- Rish, I. An empirical study of the naive Bayes classifier. In Proceedings of the IJCAI 2001 Workshop on Empirical Methods in Artificial Intelligence, Seattle, WA, USA, 4 August 2001; Volume 3, pp. 41–46. [Google Scholar]
- Srivastava, S.; Gupta, M.R.; Frigyik, B.A. Bayesian quadratic discriminant analysis. J. Mach. Learn. Res. 2007, 8, 1277–1305. [Google Scholar]
- Zhu, J.; Zou, H.; Rosset, S.; Hastie, T. Multi-class adaboost. Stat. Its Interface 2009, 2, 349–360. [Google Scholar]
- Rokach, L.; Maimon, O. Decision trees. Data Mining and Knowledge Discovery Handbook; Springer: New York, NY, USA, 2005; pp. 165–192. [Google Scholar]
- Hearst, M.A.; Dumais, S.T.; Osuna, E.; Platt, J.; Scholkopf, B. Support vector machines. IEEE Intell. Syst. Their Appl. 1998, 13, 18–28. [Google Scholar] [CrossRef]
- González Chordá, V.M.; Macia Soler, M.L. Grupos de pacientes Relacionados por el Diagnóstico (GRD) en los hospitales generales españoles: Variabilidad en la estancia media y el coste medio por proceso. Enfermería Glob. 2011, 10, 125–144. [Google Scholar] [CrossRef]
- LaCalle, E.J.; Rabin, E.J.; Genes, N.G. High-frequency users of emergency department care. J. Emerg. Med. 2013, 44, 1167–1173. [Google Scholar] [CrossRef] [PubMed]
- Gómez Jiménez, J.; Ramón-Pardo, P.; Rua Moncada, C. Manual para la Implementación de un Sistema de Triaje para los Cuartos de Urgencias; Organización Panamericana de la Salud/Organización Mundial de la Salud: Washington, DC, USA, 2010. [Google Scholar]
- Jiménez, J.G.; Faura, J.; Burgues, L.; Pàmies, S. Gestión clínica de un servicio de urgencias hospitalario: Indicadores de calidad, benchmarking y análisis de la casuística (case-mix). Gestión Hosp. 2004, 15, 3–12. [Google Scholar]
- Theiling, B.J.; Kennedy, K.V.; Limkakeng, A.T., Jr.; Manandhar, P.; Erkanli, A.; Pitts, S.R. A method for grouping emergency department visits by severity and complexity. West. J. Emerg. Med. 2020, 21, 1147. [Google Scholar] [CrossRef]
- Álvarez, M.; Orgeira, J.; Loureiro, A.; Lima, M. Criterios de Homogenización de los Servicios de Urgencias Hospitalarias; Sociedad Española de Medicina de Urgencias y Emergencias: Galicia, Spain, 2018. [Google Scholar]
- Ministerio de Sanidad, G.d.E. Urgencias Atendidas en Hospitales de Atención Especializada. Tabla 27. 2025. Available online: https://www.sanidad.gob.es/estadEstudios/sanidadDatos/tablas/tabla27.htm (accessed on 25 April 2025).
- Kreindler, S.A.; Cui, Y.; Metge, C.J.; Raynard, M. Patient characteristics associated with longer emergency department stay: A rapid review. Emerg. Med. J. 2016, 33, 194–199. [Google Scholar] [CrossRef]
- Alnahari, A.; A’aqoulah, A. Influence of demographic factors on prolonged length of stay in an emergency department. PLoS ONE 2024, 19, e0298598. [Google Scholar] [CrossRef]
- Chaou, C.H.; Chen, H.H.; Chang, S.H.; Tang, P.; Pan, S.L.; Yen, A.M.F.; Chiu, T.F. Predicting length of stay among patients discharged from the emergency department—Using an accelerated failure time model. PLoS ONE 2017, 12, e0165756. [Google Scholar] [CrossRef]
- Ricciardi, C.; Marino, M.R.; Trunfio, T.A.; Majolo, M.; Romano, M.; Amato, F.; Improta, G. Evaluation of different machine learning algorithms for predicting the length of stay in the emergency departments: A single-centre study. Front. Digit. Health 2024, 5, 1323849. [Google Scholar] [CrossRef] [PubMed]
- Chou, Y.J.; Goh, V.; Ma, M.C.; Lee, C.C.; Hsieh, C.C.; Lin, C.H. Comparison of Outpatient Department-Referred and Self-Referred Patients in the Emergency Department. J. Emerg. Med. 2024, 66, 249–257. [Google Scholar] [CrossRef] [PubMed]
- Costa, J.P.d.; Nicolaidis, R.; Gonçalves, A.V.F.; Souza, E.N.d.; Blatt, C.R. The accuracy of the Manchester Triage System in an emergency service. Rev. Gauch. Enferm. 2020, 41, e20190327. [Google Scholar] [CrossRef] [PubMed]
- Azeredo, T.R.M.; Guedes, H.M.; de Almeida, R.A.R.; Chianca, T.C.M.; Martins, J.C.A. Efficacy of the Manchester Triage System: A systematic review. Int. Emerg. Nurs. 2015, 23, 47–52. [Google Scholar] [CrossRef]
- Brouns, S.H.; Mignot-Evers, L.; Derkx, F.; Lambooij, S.L.; Dieleman, J.P.; Haak, H.R. Performance of the Manchester triage system in older emergency department patients: A retrospective cohort study. BMC Emerg. Med. 2019, 19, 3. [Google Scholar] [CrossRef]
- Brutschin, V.; Kogej, M.; Schacher, S.; Berger, M.; Gräff, I. The presentational flow chart “unwell adult” of the Manchester Triage System—Curse or blessing? PLoS ONE 2021, 16, e0252730. [Google Scholar] [CrossRef]
- Blomaard, L.C.; Speksnijder, C.; Lucke, J.A.; de Gelder, J.; Anten, S.; Schuit, S.C.; Steyerberg, E.W.; Gussekloo, J.; de Groot, B.; Mooijaart, S.P. Geriatric screening, triage urgency, and 30-day mortality in older emergency department patients. J. Am. Geriatr. Soc. 2020, 68, 1755–1762. [Google Scholar] [CrossRef]
- Al-Faifi, J.J.; Alruwaili, K.A.; Alkhenizan, A.H.; Alharbi, M.F.; Alammar, F.N. Level of Knowledge and Attitude Toward Acute Abdomen Among the Public: A Nationwide Study. Cureus 2024, 16, e52416. [Google Scholar] [CrossRef]
- Friedman, A.B.; Chen, A.T.; Wu, R.; Coe, N.B.; Halpern, S.D.; Hwang, U.; Kelz, R.R.; Cappola, A.R. Evaluation and disposition of older adults presenting to the emergency department with abdominal pain. J. Am. Geriatr. Soc. 2022, 70, 501–511. [Google Scholar] [CrossRef]
- Zaboli, A.; Ausserhofer, D.; Pfeifer, N.; Magnarelli, G.; Ciccariello, L.; Siller, M.; Turcato, G. Acute abdominal pain in triage: A retrospective observational study of the Manchester triage system’s validity. J. Clin. Nurs. 2021, 30, 942–951. [Google Scholar] [CrossRef]
- Balen, F.; Lamy, S.; Froissart, L.; Mesnard, T.; Sanchez, B.; Dubucs, X.; Charpentier, S. Risk factors and effect of dyspnea inappropriate treatment in adults’ emergency department: A retrospective cohort study. Eur. J. Emerg. Med. 2024, 31, 276–280. [Google Scholar] [CrossRef] [PubMed]
- Zhou, J.; Nehme, E.; Dawson, L.; Bloom, J.; Smallwood, N.; Okyere, D.; Cox, S.; Anderson, D.; Smith, K.; Stub, D.; et al. Impact of socioeconomic status on presentation, care quality and outcomes of patients attended by emergency medical services for dyspnoea: A population-based cohort study. J. Epidemiol. Community Health 2024, 78, 255–262. [Google Scholar] [CrossRef] [PubMed]
- Nahab, F.; Leach, G.; Kingston, C.; Mir, O.; Abramson, J.; Hilton, S.; Keadey, M.; Gartland, B.; Ross, M. Impact of an emergency department observation unit transient ischemic attack protocol on length of stay and cost. J. Stroke Cerebrovasc. Dis. 2012, 21, 673–678. [Google Scholar] [CrossRef] [PubMed]
- d’Etienne, J.P.; Zhou, Y.; Kan, C.; Shaikh, S.; Ho, A.F.; Suley, E.; Blustein, E.C.; Schrader, C.D.; Zenarosa, N.R.; Wang, H. Two-step predictive model for early detection of emergency department patients with prolonged stay and its management implications. Am. J. Emerg. Med. 2021, 40, 148–158. [Google Scholar] [CrossRef]

Disclaimer/Publisher’s Note: The statements, opinions and data contained in all publications are solely those of the individual author(s) and contributor(s) and not of MDPI and/or the editor(s). MDPI and/or the editor(s) disclaim responsibility for any injury to people or property resulting from any ideas, methods, instructions or products referred to in the content. |
© 2025 by the authors. Licensee MDPI, Basel, Switzerland. This article is an open access article distributed under the terms and conditions of the Creative Commons Attribution (CC BY) license (https://creativecommons.org/licenses/by/4.0/).