Abstract
The article is a continuation of the research on creating the most complete and representative earthquake catalogs by combining all available data from regional, national, and international seismological agencies and reducing magnitudes to a uniform scale. The task of identifying and removing duplicates that arise during the merging process is solved using the authors’ modification of the nearest neighbor method. It is evident that the intelligent merging of different earthquake catalogs for the same territory will improve the completeness and representativeness of events in the final integrated catalog. In this article, the earthquake catalog of the western sector of the Arctic zone of the Russian Federation (AZRF) covering the period 1962–2022 was created by merging three regional Russian catalogs and the ISC catalog. The ratio of magnitude types in the catalog for different seismic networks was analyzed, and magnitude estimates were unified based on the obtained ratios. For analyzing seismic activity in the western AZRF, it is recommended to use earthquakes from the period 1998–2020 when the catalog was significantly cleaned from explosions and other events of the “non-earthquake” type.
1. Introduction
The paper [1] demonstrated that some seismic agencies may miss events detected by other agencies. This was illustrated using the JMA and ANSS catalogs for the aftershock sequence of the Tohoku earthquake (11 March 2011, Mw = 9.0) [2] recorded between 1 March and 31 December 2011. Based on the methodology developed by the authors [1], more than 700 events were identified in the ANSS catalog that were absent in JMA. Among the missed events were several aftershocks with M > 6.0 that occurred in the first hours after the main shock [3].
It is obvious that the intellectual merging of different earthquake catalogs for the same territory will make it possible to collect together the most complete information about all seismic events that have occurred. However, it should be noted that in the process of such merging, duplicates will arise, which, similarly to aftershocks [4], are events close in space and time, and there will be a task of their identification. The developed algorithm for merging catalogs with the identification and removal of duplicates is based on the nearest neighbor method [5,6] modified in [1]. The algorithm is based on the knowledge that duplicates do not have the causal relationship that exists for aftershocks. The application of the algorithm allows for the sequential merging of any number of earthquake catalogs [1].
In the paper [7], the earthquake catalog of the eastern sector of the Arctic zone of the Russian Federation (AZRF) was created by combining three regional catalogs (Yakutia, Northeast Russia, and Kamchatka) of the Geophysical Survey of the Russian Academy of Sciences (GS RAS) and the International Seismological Centre (ISC) with a unified magnitude scale, which is made available to the public. To confirm the feasibility of merging catalogs and the effectiveness of the algorithm, it should be noted that the obtained catalog [7] includes 23,254 events (1962–2020), of which 7781 are from ISC and 15,473 are from Russian catalogs. This article is a logical continuation of the study carried out in [7]. It is aimed at the creation of the integrated catalog of the western sector of the AZRF with unified magnitude estimates.
The western sector of the AZRF that is considered in the present study is a seismically active region [8,9] and includes the Arkhangelsk region, the Republic of Karelia, the Kola Peninsula, the western part of the Taymyr Peninsula, archipelagoes of Franz Josef Land, Novaya Zemlya, Severnaya Zemlya, and the basin of the White, Barents, and Kara Seas. In [10], information is provided on 10 earthquakes with M ≥ 5.0 that occurred in the region starting from the 17th century. It should be noted that the epicenters of four events are located in the continental part of the region, while the others are significantly further north in the Barents–Kara Basin. The strongest earthquake known in the western sector of the AZRF occurred in the latter region (14 October 1908, M = 6.6) [10,11]. For events that occurred in the pre-instrumental period of seismic observations, the coordinates of the epicenters and magnitude estimates have a significant uncertainty [12]. However, in recent years, a number of studies have been published in which the parameters of historical events have been redefined, including the considered region [11,13,14].
Many researchers note the modern seismicity of the Barents–Kara Basin in the transition zone from continent to ocean and the Novaya Zemlya Archipelago, where an earthquake with mb = 4.8 was registered on 11 October 2010 [15]. Seismic activity is observed on the Kola Peninsula and in the Karelia region.
The Severnaya Zemlya Archipelago and the northern part of the Taymyr Peninsula are located within the Kara Plate. At the same time, only the northeast of the peninsula is characterized by seismic activity, where most of the earthquakes registered during the instrumental period are associated with the mouth of the Khatanga Bay [14]. It should be noted that earthquakes that occurred in the northeast of the peninsula were included in the integrated catalog of the eastern sector of the AZRF [7] and are not considered in this article.
The White Sea Basin, including its waters and adjacent territory, is one of the most fragmented and mobile regions within the East European Platform. The most active tectonic structure here is the Kandalaksha Graben. The maximum intensity of paleo-earthquakes in the western part of Kandalaksha Bay (the bay of the White Sea in the south of the Kola Peninsula) is IX, in the central part of the sea, it is VIII, and on the western coast of the White Sea and in Onega Bay, it is VII–VIII. The White Sea Basin has a high seismic potential with a rare recurrence of strong earthquakes [16].
The full-scale study of the seismic regime of the western sector of the AZRF began in the late 1970s as part of the creation of the catalog [10]. Subsequently, for several decades, researchers noted the insufficient development of the seismic observation network in the region, which allowed the registration of events only with M ≥ 5.0 [17,18]. Over the past two decades, significant contributions to the development of seismic monitoring in the west of the AZRF have been made by the unique scientific facilities of Federal Center for Integrated Arctic Research, Russia, Arkhangelsk (FCIAR) [19,20,21,22]. Based on unique seismic data obtained by FCIAR, the structure of the lithosphere and upper mantle has been specified, regional hodographs have been constructed [23], and parameters of earthquakes that occurred in marine waters during the period from 1908 to 2020 have been refined. As a result, an updated catalog containing data on 125 earthquakes has been obtained [24].
On the maps of the General Seismic Zoning GSZ-97A, GSZ-2015A, and GSZ-2016A, the region is classified as zones with macroseismic intensity estimates V–VI [25,26,27,28,29,30]. In recent years, a seismic zoning map of the AZRF has been created [31].
Currently, the Geophysical Survey of the Russian Academy of Sciences (GS RAS) carries out the seismic monitoring of the entire territory of the Russian Arctic (http://www.gsras.ru/new/eng/catalog/, accessed on 1 June 2023). The western sector of the AZRF falls within the responsibility zone of the Kola and Arkhangelsk branches as well as the Central Department of GS RAS. Detailed information on earthquakes in the region is presented in the global ISC catalog (http://www.isc.ac.uk/isc-ehb/search/catalogue/, accessed on 1 June 2023). It should be noted that the analysis of earthquake catalogs of GS RAS branches and ISC showed that information about weak earthquakes is mainly contained in regional catalogs.
To create a unified (integrated) earthquake catalog of the western sector of the AZRF, the following main tasks were solved:
- The sequential merging of two regional catalogs of GS RAS, the ISC catalog, and the catalog from [24], identifying duplicates that arise during merging and excluding explosions and other anthropogenic events from the final catalog;
- The unification of magnitude estimates in the integrated catalog by constructing correlation ratios for different types of magnitude/energy class for the same events.
2. Materials and Methods
The studied region covers a geographic area bounded by the coordinates: 60° N–84° N, 25° E–100° E (Figure 1). Five earthquake catalogs are used as input data (Table 1):
- The Arctic catalog from the annual journals Earthquakes in the USSR 1962–1991, Earthquakes in Northern Eurasia 1992–2017, and Earthquakes in Russia 2018–2020 (hereinafter ARC);
- The merged earthquake catalog of the territory of the East European platform and its nearest surroundings from the annual journals Earthquakes in the USSR 1962–1991, Earthquakes in Northern Eurasia 1992–2017, and Earthquakes in Russia 2018–2020 (hereinafter VEP);
- The ISC 1962–2022 catalog, which is a composite and contains data from many world and also Russian agencies (Table 2);
- The catalog Seismicity of the western sector of the Russian Arctic [24] (hereinafter Morozov) 1962–2020;
- The merged catalog of seismic events in the territory of the Russian Federation from the annual journals Earthquakes in Russia 2003–2020. Only data on events that are non-earthquakes are used (hereinafter ER_EXP).
As can be seen from Figure 1, a large number of earthquake epicenters are located in the southwestern part of the studied region on the Kola Peninsula and Karelia as well as in the northern part of the region on the shelf boundary of the Kara and Barents Seas. The peculiarity of the western sector of the AZRF is the large number of seismic events that are not tectonic earthquakes (explosions, rock bursts, and other anthropogenic events) [32,33,34].
All the catalogs used (Table 1) are divided into “Earthquakes” (the nature of the event is “earthquake” or “possibly earthquake”) and other events. Events with unknown magnitude/class are excluded from the “Earthquakes” catalogs.


Figure 1.
The studied region with earthquake epicenters from the ISC catalog (blue and red dots). Events with magnitude definitions mb_ISC and mb_NEIC are marked in red. The red outline is the region covered by the Morozov catalog [24]. The blue outline is the sub-region of the Kola Peninsula and Karelia.
Table 1.
Input catalogs.
Table 1.
Input catalogs.
| Catalog | Period | Number of Events | Number of Earthquakes with Energy Classes and/or Magnitudes | Number of Non-Earthquakes |
|---|---|---|---|---|
| ARC | 1965–2020 | 175 | 175 | 0 |
| VEP | 1987–2020 | 971 | 742 | 170 |
| ISC | 1962–2022 | 105,656 | 4418 | 100,112 |
| Morozov | 1962–2020 | 118 * | 118 | 0 |
| ER_EXP | 2003–2020 | 14,990 | - | 14,990 |
* 116 events from the main catalog are included (6 events before 1962 and 3 events outside the studied region are excluded) as well as 2 events from the additional catalog that were relocated outside the studied area considered in [24] but are included in the region studied in the present paper.
Table 2.
Statistics of ISC catalog.
Table 2.
Statistics of ISC catalog.
| Agency Abbreviation | Agency | With Magnitude |
|---|---|---|
| BER | University of Bergen, Norway | 316 |
| CSEM | Centre Sismologique Euro-Méditerranéen, France | 36 |
| EIDC | Experimental (GSETT3) International Data Center, U.S.A. | 729 |
| FCIAR | Federal Center for Integrated Arctic Research, Russia | 13 |
| HEL | Institute of Seismology, University of Helsinki, Finland | 1390 |
| HFS | Hagfors Observatory, Sweden | 55 |
| IDC | International Data Centre, CTBTO, Austria | 356 |
| IEPN | Institute of Environmental Problems of the North, Russian Academy of Sciences, Russia | 6 |
| ISC | International Seismological Centre, United Kingdom | 495 |
| KOLA | Kola Regional Seismic Centre, GS RAS, Russia | 433 |
| LVSN | Latvian Seismic Network, Latvia | 124 |
| MIRAS | Mining Institute of the Ural Branch of the Russian Academy of Sciences, Russia | 211 |
| MOS | Geophysical Survey of Russian Academy of Sciences, Russia | 3 |
| NAO | Stiftelsen NORSAR, Norway | 171 |
| NEIC | National Earthquake Information Center, USA | 15 |
| NNC | National Nuclear Center, Kazakhstan | 3 |
| UPP | University of Uppsala, Sweden | 62 |
| TOTAL: | 4418 |
The methodology of the sequential merging of earthquake catalogs with the identification of duplicates is described in detail in [1,7]. A Euclidean metric (1) is used to find pairs of nearest events from two catalogs. After that, the classification of events into unique and duplicates is carried out using the threshold value of the metric. A basic three-parameter model is used, where the metrics for assessing the proximity between earthquakes take into account the time difference DT, and epicenter difference in the longitude DX and latitude DY. Depth information is not used, since the depth of hypocenters is often unknown or given as a fixed value for many events. Magnitudes are also not used, since earthquakes have magnitude estimates of different types from various agencies.
where , , and are the standard deviations of time, longitude, and latitude differences between the closest events from two source catalogs.
Before the merging process, each of the source catalogs (Table 1) was checked for internal duplicates. Statistical analysis did not reveal any anomalous groups of close events (Figure 2). It should be noted that duplicates typically have a metric value (1) Ro < 10 [1,7]. The number of such close events within each catalog is small, and there are no statistical reasons to consider such events as duplicates. Analysis (Figure 2) was performed with metric parameters , .
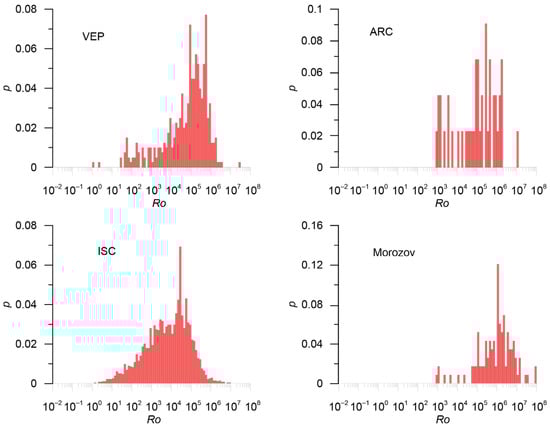
Figure 2.
Distribution of the metric for events within the source earthquake catalogs (Table 1). The catalog name is indicated on the histogram.
3. Results
3.1. Integrated Catalog of the Western Sector of the AZRF
As the results of [7] show, in the eastern sector of the AZRF, most earthquakes are registered by the Russian regional seismic networks of GS RAS. As shown in Table 2, in the western sector of the AZRF, a significant majority of events are registered by European seismic networks, whose data are collected in the composite ISC catalog. The number of earthquake records in the ISC catalog is approximately five times greater than the total number of events in the GS RAS catalogs. In addition, a new catalog was recently presented in [24], which covers a substantial part of the studied region. In this catalog, earthquakes are relocated based on the analysis and merging of all available seismic bulletins from Russian and European seismic networks using modern velocity models. However, data from [22] are not used, since they lack estimates of earthquake magnitudes.
Thus, in the task of merging earthquake catalogs, the following priority sources of earthquake data were established in the western sector of the AZRF (Table 1):
- Earthquakes from the Morozov catalog (118 events);
- Earthquakes from the ISC catalog (4418 events);
- Earthquakes from Russian catalogs ARC and VEP (175 + 742 events), with preference given to data from the ARC catalog in overlapping areas.
As mentioned above, when merging earthquake catalogs in the western sector of the AZRF, the task of excluding duplicates, i.e., records in different catalogs related to the same seismic event, as well as the task of excluding explosions and other events that are not earthquakes, were solved. The assembly diagram of the integrated catalog is shown in Figure 3, and the numerical parameters for merging are given in Table 3.
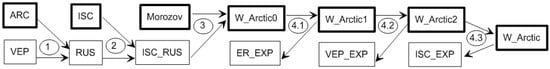
Figure 3.
Assembly diagram of the integrated catalog of the western sector of the AZRF. At each stage, the main catalog is marked with a bold frame. The stage numbers are given in ellipses and correspond to Table 3.
Table 3.
Scheme and compilation parameters of the integrated catalog.
3.1.1. Stage 1. Merging the ARC and VEP Catalogs
The main catalog was considered ARC, while VEP was the supplementary one. Duplicate analysis was performed with standard distribution parameters , . At the threshold value Ro = 10, three duplicates were identified, which was insufficient for optimizing metric parameters and estimating possible errors (Figure 4). The merged RUS catalog contains 920 events.
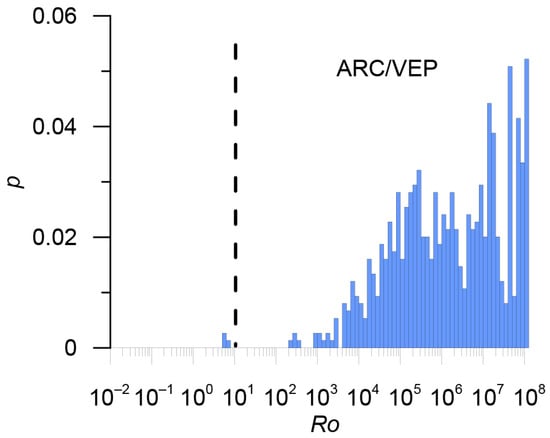
Figure 4.
Metric distribution for ARC/VEP pairs. The threshold metric value Ro = 10 is shown by a dashed line.
3.1.2. Stage 2. Merging the ISC and RUS Catalogs
The main catalog was considered ISC, while RUS was the supplementary one. Preliminary duplicate analysis was performed with standard distribution parameters , . At the threshold value Ro = 10, 263 potential duplicates were identified, of which six were absolute duplicates. Absolute duplicates were not used to determine dispersions (Figure 5).
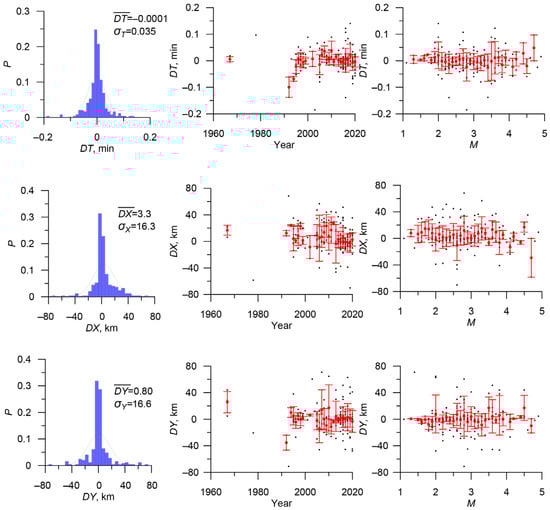
Figure 5.
Distributions of metric parameters DT, DX, and DY, and the dependence of dispersion and mean values on time and magnitude of events for merging the ISC and RUS catalogs.
It can be observed that each of the DT, DX, and DY parameters follows a normal distribution, and the mean is small compared to the standard deviation for all three parameters. Additionally, Figure 5 demonstrates that dispersion is almost independent of event magnitude and time.
The final analysis of duplicates was performed with the parameters , , and (Figure 6). The metric values were also calculated between the nearest events in the RUS catalog. The RUS catalog contains only two earthquakes with a distance to the nearest neighbor Ro < 35 (the algorithm for calculating the metric is the same as for two different catalogs, except for excluding the comparison of an earthquake with itself). This allowed us to estimate the probability that a duplicate was selected incorrectly due to high earthquake density: p = 2/884 = 0.0022, with an upper estimate of false duplicate probability at approximately 0.22%.
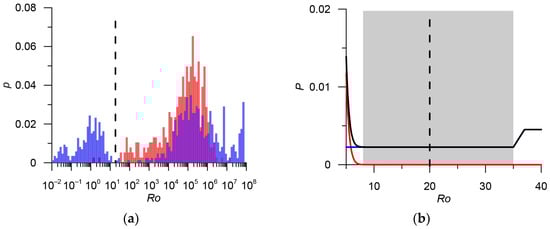
Figure 6.
(a) Comparison of the metric distribution ISC/RUS pairs (transparent blue histogram) and the same metric for RUS/RUS earthquakes (transparent red histogram); the intersection of histograms appears purple; (b) Threshold optimization: the red line shows the probability of missing a duplicate in the model with metric (1), the blue line shows the probability of a false duplicate, and the black line shows the total probability of first and second type errors. The gray band shows the range metric values Ro = 8 ÷ 35, which minimize the total number of errors, approximately 0.2%. The threshold value Ro = 20 is shown by a dashed line.
The selection of a metric threshold for identifying duplicates depends on the task of further study of the merged catalog. We chose a threshold that minimizes the total number of errors. Analysis of the spatial–temporal structure of the distribution for nearest neighbors in the ISC and RUS catalogs (Figure 7) indicates that a threshold of Ro = 20 provides a close-to-optimal separation of duplicates and naturally grouped events. In this case, 282 duplicates were identified. In total, there are 638 unique events in the RUS catalog for the studied region. These events were added to the ISC catalog, resulting in a merged ISC_RUS catalog that includes 5056 events.
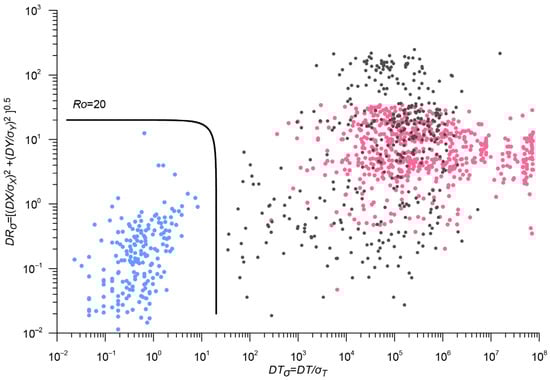
Figure 7.
Distribution of normalized DT and DR and contour line of metric (1). Colored dots represent ISC/RUS pairs (blue dots are duplicates, pink dots are unique events), and black dots are distances between RUS/RUS events in metric (1). The values of the metric for earthquakes in the RUS catalog are significantly larger than for ISC/RUS duplicates (blue dots). The contour line of metric (1) Ro = 20 provides a close to optimal separation of duplicates and naturally grouped events. Absolute duplicates are not shown.
3.1.3. Stage 3. Merging Morozov and ISC_RUS Catalogs
The main catalog is Morozov, the additional one is ISC_RUS obtained in the previous step. Duplicate analysis was performed with standard distribution parameters , . Figure 8 shows the distribution of metric (1). At Ro = 20, the ISC_RUS catalog contains 108 duplicates and 4948 unique events that were added to the Morozov catalog. The resulting catalog W_ARCTIC0 contains 5066 events.
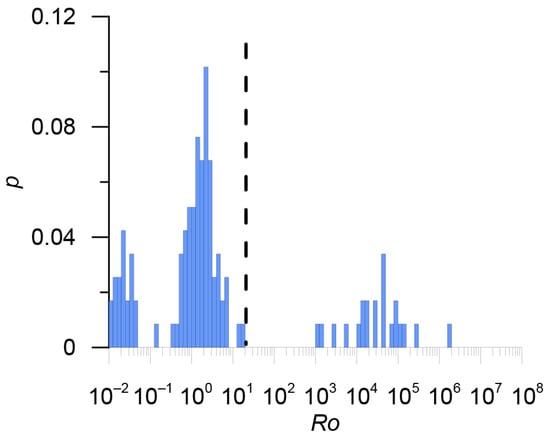
Figure 8.
Distributions of the metric for the Morozov/ISC_RUS event pairs. The threshold value of metric Ro = 20 is indicated by a dashed line.
3.1.4. Stage 4. Exclusion of Explosions and Other Anthropogenic Events
The preliminary exclusion of explosions and other anthropogenic events was performed based on the information on the nature of the events provided in the source catalogs. However, events marked as “non-earthquake” in one catalog may not be marked as such in other catalogs. We considered an event as a “non-earthquake” if it was marked as such in at least one of the input catalogs. In addition to the information from the ISC and VEP catalogs, data from the “Earthquakes of Russia” ER_EXP merged catalog (Table 1) were used.
Explosions and other anthropogenic events presented in the ER_EXP, VEP_EXP, and ISC_EXP catalogs (Table 1 and Table 3) were sequentially removed from the W_ARCTIC0 merged catalog obtained in the previous stage. Duplicate analysis was performed with standard distribution parameters , , and a threshold value of metric Ro = 10. A total of 380 duplicates were detected (Figure 9). These events were excluded from the W_ARCTIC0 catalog. The final integrated earthquake catalog, W_ARCTIC, for the western sector of the AZRF contains 4686 events. Table 3 provides statistics and parameters used at each step for excluding non-earthquake duplicates.
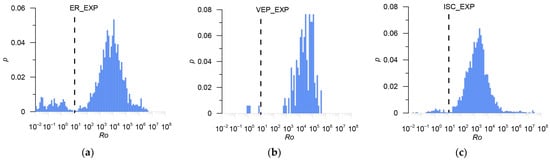
Figure 9.
Distributions of metric for the pairs: (a) W_ARCTIC0/ER_EXP; (b) W_ARCTIC1/VEP_EXP; (c) W_ARCTIC2/ISC_EXP. The threshold value of metric, Ro = 10 is indicated by a dashed line.
The results of the analysis of the final W_ARCTIC catalog suggest that explosions were not completely excluded. The histogram of the number of events (Figure 10a) shows an abnormally large number of events in 1994–1997 and 2021–2022. The spatial and spatiotemporal distribution of events (Figure 10b,c) also indicates an incomplete removal of explosions during these years. In this sense, the period of 1989–1993 also raises some suspicions. We were unable to find reliable sources of information on explosions during these periods.
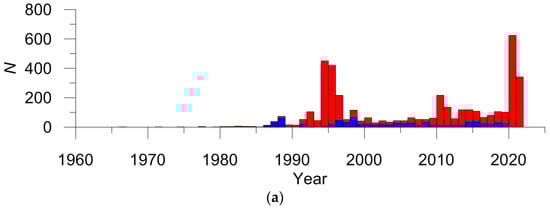
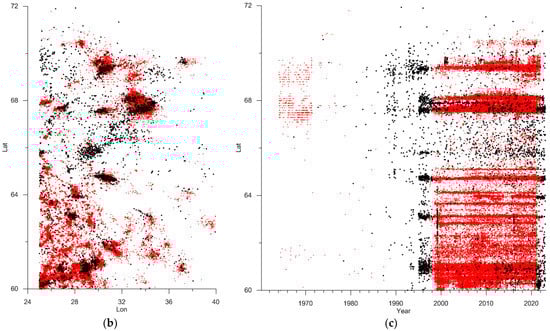
Figure 10.
Analysis of the W_ARCTIC catalog: (a) Red histogram—number of events per year (blue histogram shows a similar distribution for the VEP catalog); (b) Spatial distribution of epicenters; (c) Space–time distribution of events. Red dots represent explosions from the ISC_EXP catalog, while black dots represent earthquakes from the merged W_ARCTIC catalog in the Kola Peninsula and Karelia (60° N–72° N, 25° E–40° E).
In the area of the Severouralsk bauxite deposit (coordinates 60° N, 60° E) in the Northern Urals, there is a significant cluster of 57 events. According to [32], this area experiences a large number of technological explosions and rock bursts (hundreds per year). Therefore, we assume that most of the events in this cluster are not earthquakes, although this is not indicated in the catalogs used (Table 1). All 46 events that occurred in 2021–2022 are highly likely to be explosions (the information about explosions has not yet been published for this period). The other 11 events, if not explosions or rock bursts, are likely to be triggered earthquakes. Based on this, a decision was made to exclude events from the catalog that are part of the identified Urals cluster. The final integrated W_ARCTIC catalog contains 4629 events.
3.2. Magnitudes in the Integrated Catalog of the Western Sector of the AZRF
The western sector of the AZRF includes several seismically active zones with different types of magnitudes. In addition, it is assumed that the ratios between magnitudes may differ in different seismically active zones. Magnitude unification was carried out in two sub-regions: the Kola Peninsula and Karelia (60° N–72° N, 25° E–40° E) and the Kara and Barents Seas shelf. Earthquakes located within the East European and West Siberian platforms were considered together with events from the Kara and Barents Seas shelf.
3.2.1. The Kola Peninsula and Karelia
There is no earthquake in the Kola Peninsula and Karelia with a determined MwGCMT magnitude, while only seven events have mbISC and mbNEIC magnitude estimates (Figure 1). Due to these reasons, direct magnitude unification to the moment magnitude scale is impossible. Most events have local ML magnitudes from various agencies. MLKOLA was chosen as the base local magnitude because the local network of the Kola branch of GS RAS is located directly in the studied area. However, most earthquakes have local MLHEL magnitudes, allowing for more reliable correlations with other magnitude types (Figure 11). Thus, the unified local magnitude ML is determined by a regression relationship with MLHEL, which is approximately 0.3 less than MLKOLA (Figure 11a).
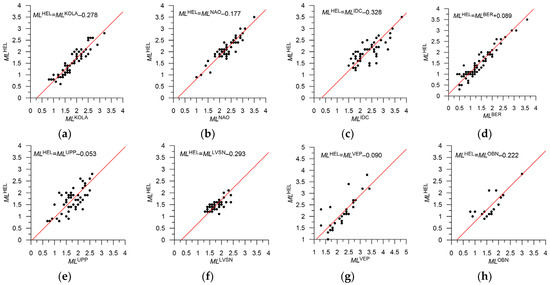
Figure 11.
Shift-type correlation ratio for local magnitudes from various agencies in the Kola Peninsula and Karelia sub-region. Magnitude types are specified on the figures. All eight relationships appear reliable.
Out of 104 events with MPSPVEP magnitude, only two have MLHEL and mbISC magnitudes. To refine the magnitude relationships, events outside the region (Svalbard) were used (Figure 12). Two events from the studied region fit well into the regression for Svalbard events. For this reason, we used the obtained relationships for earthquakes in the Kola Peninsula and Karelia. All events with MPSPVEP magnitude occurred in 1987–1989. It was previously suggested that not all explosions and other non-earthquake events were removed from the catalog for this period. Therefore, it is possible that these events are not tectonic earthquakes. In addition, most events have MPSPVEP < 3.5 magnitudes; i.e., they are outside the range for which relationships are established. Therefore, they were considered highly unreliable.
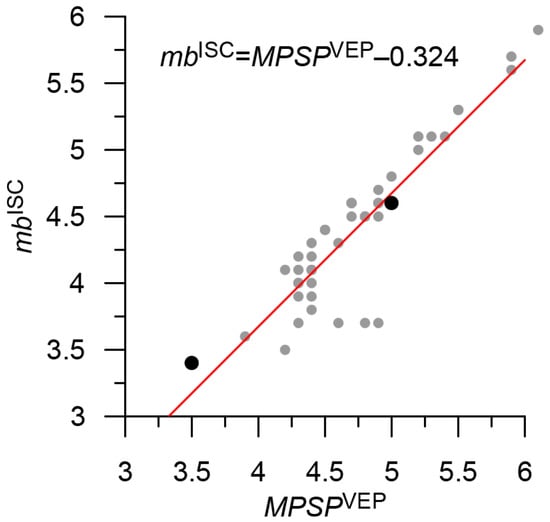
Figure 12.
Shift-type correlation ratio for MPSPVEP magnitude. Magnitude types are specified on the figure. Gray dots are events in Svalbard; black dots are two events in the shelf sub-region.
Only MDHEL and MDBER duration magnitudes have 166 events. This type of magnitude is often used for records without clear arrival (explosions, landslides, etc.). For example, the ML and MD relationship is sometimes used to identify landslides in regional catalogs [35]. Events with this type of magnitude are only present in the catalog during the period 1988–1997 when explosions are presumably not removed. It should be noted that MLEIDC and mbHFS magnitudes appear in the catalog only during this period, for which indirect correlations through MDBER were used for unification (Figure 13). Thus, it was assumed that most of these events are not earthquakes.
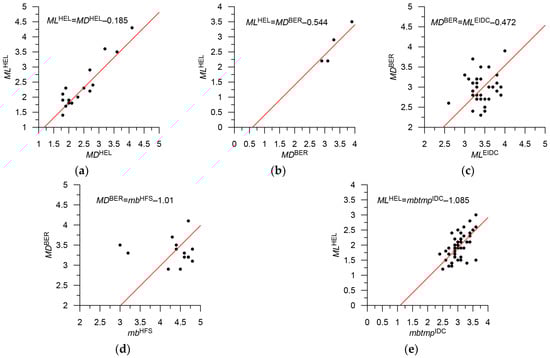
Figure 13.
Shift-type correlation ratios for magnitudes of various agencies in the sub-region of the Kola Peninsula and Karelia. Magnitude types are specified on the figures. Only the MDHEL (a) and mbtmpIDC (e) relationships appear reliable out of 5 ratios.
The regression ratios could not be established for eight events. A relationship was determined between the unified local magnitude ML and mbISC, mbNEIC: ML = mb − 0.08, i.e., they are very close. In fact, the difference lies within the 95% confidence interval, and they can be considered equal. There are only five events with both types of magnitudes, but they fit very well on a straight line (Figure 14). It should be noted that most events in the sub-region have a unified magnitude ML < 3.3, which is outside the range for which ML ≈ mb. Therefore, the relationship is unreliable.
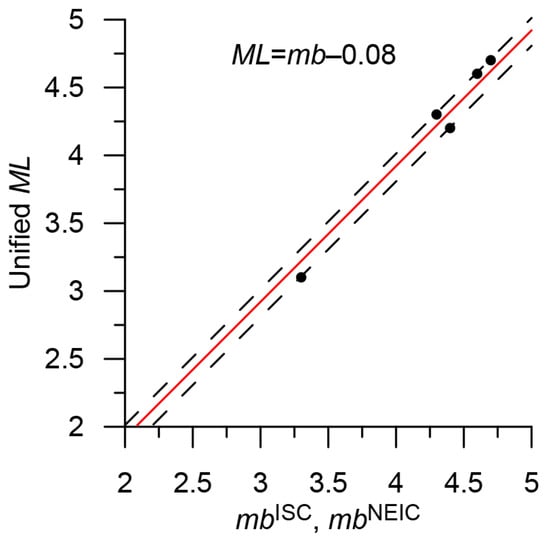
Figure 14.
Shift-type correlation ratio between the unified magnitude ML and mbISC, mbNEIC in the sub-region of the Kola Peninsula and Karelia. Magnitude types are specified on the figure. The dashed lines show the 95% confidence interval.
Statistics and formulas for converting magnitudes are presented in Table 4.
Table 4.
Unified magnitude in the catalog of the western sector of the Russian Arctic: sub-region Kola–Karelia.
3.2.2. The Kara and Barents Seas Shelf
In the sub-region of the Kara and Barents Seas shelf, there are no events with magnitude MwGCMT. Thus, a direct unification of magnitude to the moment scale is impossible. Magnitudes mbISC and mbNEIC were determined for 45 events (Figure 1). There are also a small number of determinations for magnitudes mb from other agencies. Most events have a local magnitude ML from various agencies, predominantly MLBER. For some earthquakes, magnitudes MDBER and other types determined by the GS RAS are available. The unified magnitude mb was determined by regression ratios with mbISC (Figure 15). The unified local magnitude ML was determined by a regression relationship with MLBER (Figure 16). In some cases, it was necessary to use indirect correlations—relationships are unreliable (Figure 17). Regression relationships could not be established for six events.
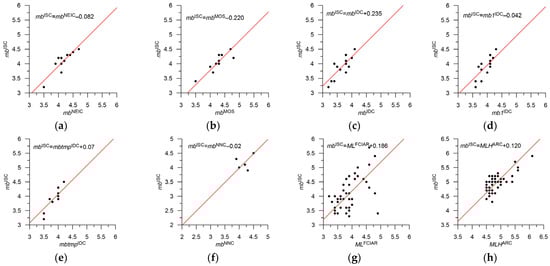
Figure 15.
Shift-type correlation ratios for magnitudes of various agencies with the magnitude mbISC in the sub-region of the Kara and Barents Seas shelf. Magnitude types are specified on the figures.
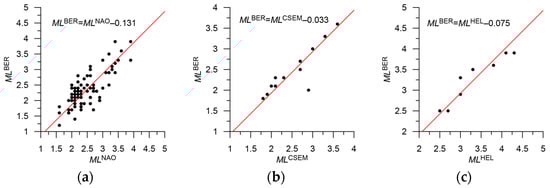
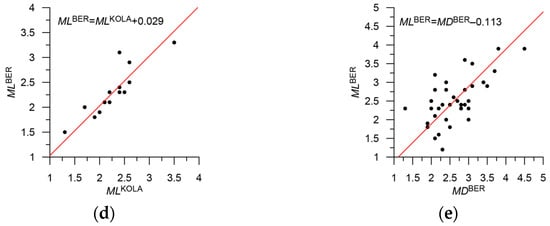
Figure 16.
Shift-type correlation ratios for magnitudes of various agencies with the magnitude MLBER in the sub-region of the Kara and Barents Seas shelf. Magnitude types are specified on the figures.
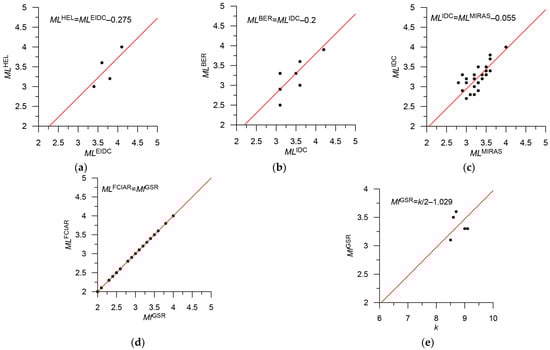
Figure 17.
Shift-type correlation ratios for magnitudes of different agencies that were used to calculate indirect correlations in the sub-region of the Kara and Barents Seas shelf. Magnitude types are specified on the figures.
There are 10 events with energy class measures k on the Franz Josef Land archipelago. Eight of them occurred in the end of 1983 or the beginning of 1984 and have the same epicenter coordinates. The coordinates for this period are given with an accuracy of 0.1°. These events are not included in the Morozov catalog. Whether these events are a swarm of natural earthquakes or technogenic events is an open question, so we do not exclude them from the integrated catalog.
A relationship was determined between the unified local magnitude ML and mb. The similarity of a linear relationship is observed for earthquakes with ML > 3.0. There are only 10 such events (Figure 18). At lower magnitudes, the relationship breaks down. The unified local magnitudes ML and mb are very close. In fact, the difference is less than 0.1, which is within the 95% confidence interval. Thus, they can be considered equal.
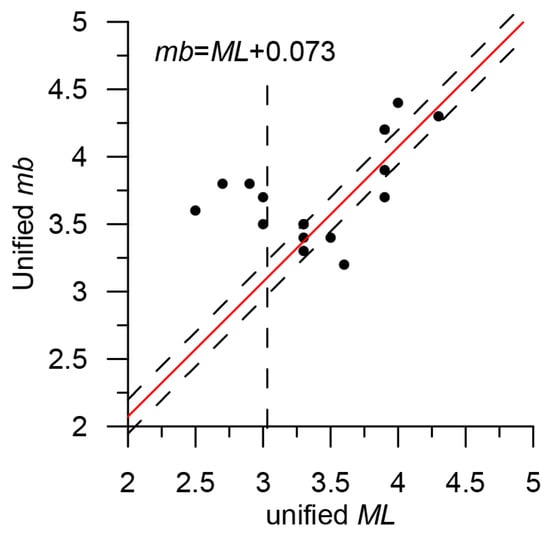
Figure 18.
Shift-type correlation ratio between unified magnitudes ML and mb (ML > 3.0) in the sub-region of the Kara and Barents Seas shelf. Magnitude types are specified on the figure. The dashed lines show the 95% confidence interval.
Statistics and formulas for magnitude conversion are presented in Table 5.
Table 5.
Magnitude in the integrated catalog of the western sector of the Russian Arctic: sub-region Barents and Kara Seas shelf.
3.3. Statistics of the Integrated Catalog for Two Sub-Regions
The integrated catalog of the western sector of the AZRF contains information on 4629 events. In turn, for the period 1998–2020, when all “non-earthquakes” were removed with a high degree of reliability, the catalog contains 2126 records (Figure 19). Detailed statistics for the catalog for the period 1998–2020 are presented in Table 6. Figure 19 shows that the registration level in the western part of the region is significantly better than in its central and eastern parts.
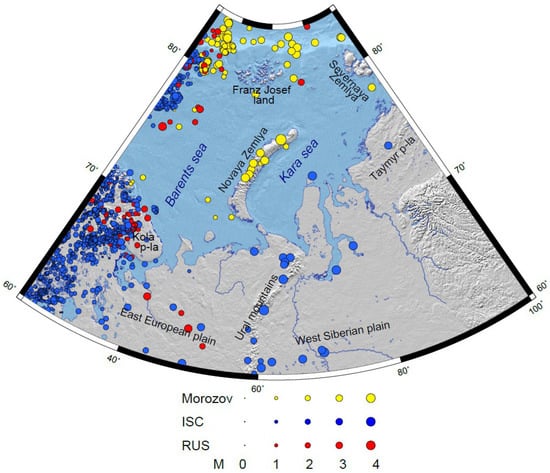
Figure 19.
Map of earthquake epicenters of the integrated catalog for the western sector of the AZRF for the period 1998–2020. Yellow dots show events from Morozov catalog, blue dots show events from the ISC catalog, and red dots show events from Russian catalogs. Preferred location of event corresponds to the priority of data sources: 1 Morozov, 2 ISC, 3 RUS.
Table 6.
Statistics of the integrated catalog.
Figure 20, Figure 21, Figure 22 and Figure 23 show event distributions over time and magnitude as well as differential magnitude–frequency graphs for various time periods for the sub-regions of the Kola Peninsula and Karelia, the Kara, and Barents Seas shelf.
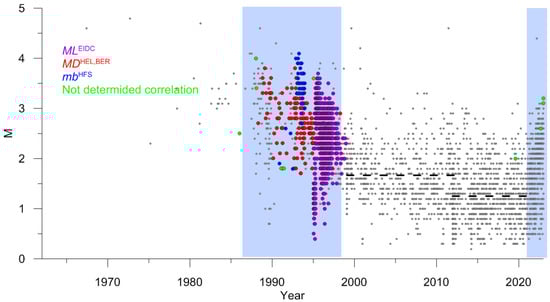
Figure 20.
Sub-region of the Kola Peninsula and Karelia. Event distribution over time and magnitude. Blue indicates periods unfiltered for explosions/rock bursts. Colored dots show events with unreliable magnitudes. The overwhelming majority of such events belong to periods with unfiltered explosions. The dashed line shows preliminary estimates of completeness magnitude Mc.
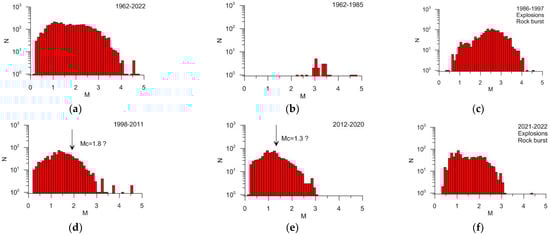
Figure 21.
Sub-region of the Kola Peninsula and Karelia. Differential magnitude-frequency graphs for different time periods and preliminary estimates of completeness magnitude Mc.
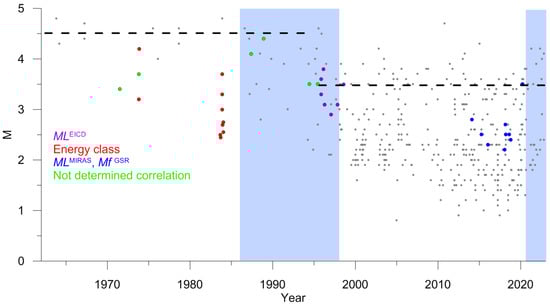
Figure 22.
Sub-region of the Kara and Barents Seas shelf. Distribution of events by time and magnitude. The blue color highlights periods not cleared from explosions/rock bursts. Colored dots show events with unreliable magnitudes. The dashed line is a preliminary estimate of completeness magnitude Mc.
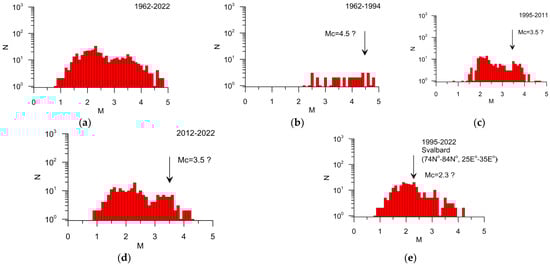
Figure 23.
Sub-region of the Kara and Barents Seas shelf: (a–d) represent differential magnitude-frequency graphs in different periods and preliminary estimates of completeness magnitude. (e) shows the magnitude-frequency graph in the vicinity of the Svalbard Archipelago.
Until 1980, only a few seismic events were registered in the sub-region of the Kola Peninsula and Karelia. The period 1998–2020 can be used to determine seismicity parameters.
Preliminary estimates-Mc = 1.8 in 1998–2011, Mc = 1.3 in 2012–2020.
Until 1995, the catalog contains few events in the sub-region of the Kara and Barents Seas shelf with Mc = 4.5. To determine seismicity parameters, the period 1998–2020 can be used. Preliminary estimates suggest Mc = 3.5 for 1995–2020. The increase in the number of small events is related to the western part of the shelf near Svalbard, where the registration level is much better, and the preliminary estimate Mc = 2.3.
Figure 24 shows a map of spatial variations in the completeness magnitude Mc in the integrated catalog for the period 1998–2020, which was constructed using a multi-scale method [36]. The volume of registered seismicity is sufficient for mapping only in the western part of the region on the Kola Peninsula and in Karelia as well as in the vicinity of the Svalbard Archipelago. In the rest of the region, only a regional value of Mc = 3.5 can be determined. Preliminary estimates of Mc = 1.8 on the Kola Peninsula and in Karelia and Mc = 2.3 in the vicinity of the Svalbard Archipelago were confirmed.
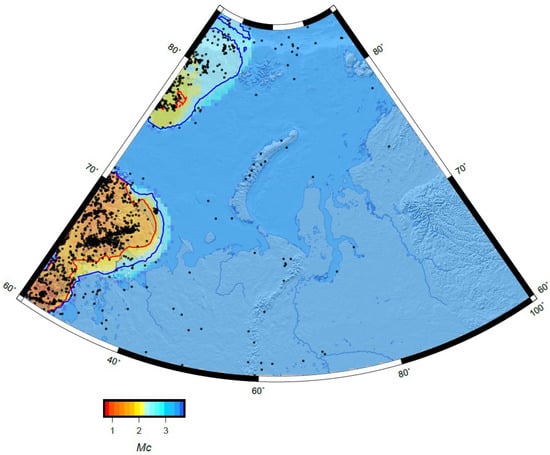
Figure 24.
Integrated catalog. Map of spatial variations in the completeness magnitude Mc for the period 1998–2020. The black dots show the earthquake epicenters, the red line is the level Mc = 1.8, the blue line is Mc = 2.3.
4. Conclusions
This paper describes step by step the procedure for compiling the integrated earthquake catalog for the western sector of the AZRF with a unified magnitude scale (Figure 19). The unification was carried out based on the analysis of ratios of magnitude types in the source catalogs. It should be noted that the obtained catalog, in contrast to the original catalogs, is characterized by the completeness and representativeness of events. The unified catalog is made available to the public at: http://www.wdcb.ru/arctic_antarctic/arctic_seism.html, (accessed on 1 June 2023). The integrated earthquake catalog obtained in this paper is intended for a wide range of researchers involved in both the study of the seismic regime of the Arctic and, in general, the seismic hazard assessment [37,38,39,40,41,42,43,44,45].
Based on the results obtained in this study, the authors consider it possible to formulate the following conclusions:
- Information on explosions and other events that are not tectonic earthquakes, presented in the catalogs of GS RAS and ISC, is incomplete. Approximately 300 such events from the GS RAS catalog (ER_EXP in Table 1) are classified as earthquakes in the ISC catalog, and conversely, about 100 explosions from the ISC catalog are classified as earthquakes in the GS RAS catalogs (Figure 9, Table 3);
- Explosions before 1998 and after 2020 have not been removed (Figure 10). Explosions after 2020 may be removed with the arrival of new data–GS RAS catalogs and reviewed ISC catalog. Identifying and removing explosions that occurred before 1998 is an extremely difficult task beyond the scope of the mathematical methods used in this study;
- In general, there is no sufficient guarantee that “non-earthquakes” have been completely removed from the combined catalog during the period of 1998–2020. However, there are reasons to believe that the number of such events is small and they will not have a significant impact on regional seismicity statistics;
- In the western sector of the AZRF, there are no MwGCMT determinations. Therefore, a direct unification of magnitude to moment magnitude scale was impossible. However, there were a sufficient number of mbISC determinations, which are used in ISC practice to obtain proxy-Mw estimates for earthquakes with M < 5.0 [46]. In the eastern sector of the AZRF, the MwGCMT = mbISC ratio is directly confirmed [7]. All magnitude scales were aligned with mbISC (Figure 14 and Figure 18), and it was hypothesized that the estimates made could be used as proxy-Mw in the western sector of the AZRF for regionally strong earthquakes with M ≥ 3.5, for the overwhelming majority of which mbISC and mbNEIC determinations are known. Interpreting weaker magnitudes as proxy-Mw is certainly controversial, since they fall outside the range for which regression relationships are constructed.
- Unlike the eastern sector of the AZRF, where the overwhelming majority of events had only three types of magnitude estimates (MwGCMT, mbISC, and energy class k), the diversity of magnitude estimates for weak earthquakes in the western sector is very high. This reduces the reliability of determining a unified magnitude scale. For some earthquakes, regression relationships are not determined or extremely unreliable. It should be noted that the number of such events is insignificant during the period of 1998–2020 (Figure 20 and Figure 22);
- The quality of the catalog after 1998 is significantly better. Therefore, for statistical analysis of seismicity parameters, such as the slope of the magnitude–frequency graph (b-value) and the level of seismic activity, we recommend using the catalog for the period of 1998–2020. However, data prior to 1998 may also be useful for other studies, for example, for studying possible sources of regionally strong earthquakes in the basins of the Barents and Kara Seas, where, for natural reasons, the presence of technogenic events is unlikely.
Author Contributions
Conceptualization, A.D.G., I.A.V. and P.N.S.; Data curation, P.N.S., B.A.D., N.A.S. and A.A.S.; Formal analysis, I.A.V.; Investigation, P.N.S., B.A.D., B.V.D. and A.A.S.; Methodology, I.A.V.; Resources, B.A.D. and N.A.S.; Software, I.A.V.; Validation, I.A.V., A.D.G., P.N.S., B.A.D. and B.V.D.; Visualization, I.A.V., B.V.D. and N.A.F.; Writing—original draft, A.D.G., I.A.V., P.N.S., B.A.D., B.V.D., N.A.S., A.A.S. and N.A.F.; Writing—review and editing, A.D.G., I.A.V., P.N.S., B.A.D., B.V.D., N.A.S., A.A.S. and N.A.F. All authors have read and agreed to the published version of the manuscript.
Funding
The reported study was funded by the Russian Science Foundation, project number 21-77-30010 «System analysis of geophysical process dynamics in the Russian Arctic and their impact on the development and operation of the railway infrastructure».
Institutional Review Board Statement
Not applicable.
Informed Consent Statement
Not applicable.
Data Availability Statement
Not applicable.
Acknowledgments
This work employed data provided by the Shared Research Facility «Analytical Geomagnetic Data Center» of the Geophysical Center of RAS (http://ckp.gcras.ru/ accessed on 22 May 2023).
Conflicts of Interest
The authors declare no conflict of interest.
References
- Vorobieva, I.; Gvishiani, A.; Dzeboev, B.; Dzeranov, B.; Barykina, Y.; Antipova, A. Nearest Neighbor Method for Discriminating Aftershocks and Duplicates when Merging Earthquake Catalogs. Front. Earth Sci. 2022, 10, 820277. [Google Scholar] [CrossRef]
- Imanishi, K.; Ando, R.; Kuwahara, Y. Unusual shallow normal-faulting earthquake sequence in compressional northeast Japan activated after the 2011 off the Pacific coast of Tohoku earthquake. Geophys. Res. Lett. 2012, 39, L09306. [Google Scholar] [CrossRef]
- Asano, Y.; Saito, T.; Ito, Y.; Shiomi, K.; Hirose, H.; Matsumoto, T.; Aoi, S.; Hori, S.; Sekiguchi, S. Spatial distribution and focal mechanisms of aftershocks of the 2011 off the Pacific coast of Tohoku Earthquake. Earth Planets Space 2011, 63, 669–673. [Google Scholar] [CrossRef]
- Shebalin, P.N.; Baranov, S.V.; Dzeboev, B.A. The Law of the Repeatability of the Number of Aftershocks. Dokl. Earth Sci. 2018, 481, 963–966. [Google Scholar] [CrossRef]
- Zaliapin, I.; Ben-Zion, Y. Earthquake clusters in southern California. I: Identification and stability. J. Geophys. Res. Solid Earth 2013, 118, 2847–2864. [Google Scholar] [CrossRef]
- Zaliapin, I.; Ben-Zion, Y. A global classification and characterization of earthquake clusters. Geophys. J. Int. 2016, 207, 608–634. [Google Scholar] [CrossRef]
- Gvishiani, A.D.; Vorobieva, I.A.; Shebalin, P.N.; Dzeboev, B.A.; Dzeranov, B.V.; Skorkina, A.A. Integrated Earthquake Catalog of the Eastern Sector of the Russian Arctic. Appl. Sci. 2022, 12, 5010. [Google Scholar] [CrossRef]
- Wetmiller, R.J.; Forsyth, D.A. Seismicity of the Arctic, 1908–1975. Arctic Geophysical Review. Publ. Earth Phys. Br. 1978, 45, 15–24. [Google Scholar]
- Burtman, V.S.; Kolodyazhnyi, S.Y. Fault systems in multiply deformed regions of Eurasia. Russ. J. Earth Sci. 2023, 1, 1–9. [Google Scholar] [CrossRef]
- Kondorskaya, N.V.; Shebalin, N.V. (Eds.) New Catalog of Strong Earthquakes in the USSR from Ancient Times through 1977; Report SE-31; World Data Center A for Solid Earth Geophysics: Boulder, CO, USA, 1982; 608p. [Google Scholar]
- Morozov, A.N.; Vaganova, N.V.; Konechnaya, Y.V. The October 14, 1908 MW 6.6 earthquake in the Barents and Kara Sea region of the Arctic: Relocation based on instrumental data. Polar Sci. 2019, 20, 160–166. [Google Scholar] [CrossRef]
- Morozov, A.N.; Vaganova, N.V.; Asming, V.E.; Kremenetskaya, E.O. Relocation of Early Instrumental Earthquakes in the Arctic. Seism. Instrum. 2022, 58, 32–34. [Google Scholar] [CrossRef]
- Morozov, A.N.; Vaganova, N.V.; Shakhova, E.V.; Konechnaya, Y.V.; Asming, V.E.; Antonovskaya, G.N.; Evtyugina, Z.A. Seismicity of the Arctic in the Early Twentieth Century: Relocation of the 1904–1920 Earthquakes. Bull. Seismol. Soc. Am. 2019, 109, 2000–2008. [Google Scholar] [CrossRef]
- Morozov, A.N.; Vaganova, N.V.; Konechnaya, Y.V.; Asming, V.E.; Dulentsova, L.G.; Evtyugina, Z.A. Seismicity in the far Arctic areas: Severnaya Zemlya and the Taimyr Peninsula. J. Seismol. 2021, 25, 1171–1188. [Google Scholar] [CrossRef]
- Rogozhin, E.A.; Kapustian, N.K.; Antonovskaya, G.N.; Konechnaya, Y.V. New seismicity map for the European sector of the Russian arctic region. Geotectonics 2016, 50, 238–243. [Google Scholar] [CrossRef]
- Nikonov, A.A.; Shvarev, S.V. Holocene Tectonic Activity and Seismicity of the White Sea Basin. Abstract of the Paleoseismological Seminar of the IPE RAS on 16 December 2013. Available online: http://www.ifz.ru/fundamental/tektonicheskaja-aktivnost-belomorskogo-basseina/ (accessed on 1 June 2023). (In Russian).
- Panasenko, G.D. Problems of seismic zoning of the Western sector of the Soviet Arctic. Nat. Econ. North 1986, 14, 4–6. (In Russian) [Google Scholar]
- Avetisov, G.P. Tectonic factors of intraplate seismicity of the Western Arctic. Izvestiya. Phys. Solid Earth 1996, 32, 975–985. [Google Scholar]
- Antonovskaya, G.N.; Kovalev, S.M.; Konechnaya, Y.V.; Smirnov, V.N.; Danilov, A.V. New information about the seismicity of the Russian Arctic based on the work of the seismic station “Severnaya Zemlya”. Arct. Antarct. Res. 2018, 64, 170–181. (In Russian) [Google Scholar] [CrossRef]
- Antonovskaya, G.N.; Kapustiana, N.K.; Konechnaya, Y.V.; Danilov, A.V. Registration capabilities of Russian island-based seismic stations: Case study of the Gakkel ridge monitoring. Seism. Instrum. 2020, 56, 33–45. [Google Scholar] [CrossRef]
- Antonovskaya, G.; Morozov, A.; Vaganova, N.; Konechnaya, Y. Seismic monitoring of the European Arctic and adjoining regions. In The Arctic. Current Issues and Challenges; Nova Science Publishers, Inc.: New York, NY, USA, 2020; pp. 303–368. [Google Scholar]
- Schweitzer, J.; Paulsen, B.; Antonovskaya, G.N.; Fedorov, A.V.; Konechnaya, Y.V.; Asming, V.E.; Pirli, M. A 24-Yr Long Seismic Bulletin for the European Arctic. Seismol. Res. Lett. 2021, 92, 2758–2767. [Google Scholar] [CrossRef]
- Morozov, A.N.; Vaganova, N.V. The Travel Times of Regional P and S for Spreading Ridges in the European Arctic. J. Volcanol. Seismol. 2017, 11, 156–163. [Google Scholar] [CrossRef]
- Morozov, A.N.; Vaganova, N.V.; Asming, V.E.; Peretokin, S.A.; Aleshin, I.M. Seismicity of the western sector of the Russian Arctic. Phys. Solid Earth 2023, 2, 115–148. (In Russian) [Google Scholar]
- Shebalin, P.N.; Gvishiani, A.D.; Dzeboev, B.A.; Skorkina, A.A. Why Are New Approaches to Seismic Hazard Assessment Required? Dokl. Earth Sci. 2022, 507, 930–935. [Google Scholar] [CrossRef]
- Giardini, D. The Global Seismic Hazard Assessment Program (GSHAP)—1992/1999. Ann. Geofis. 1999, 42, 957–974. [Google Scholar] [CrossRef]
- Giardini, D.; Grunthal, G.; Shedlock, K.M.; Zhang, P. The GSHAP Global Seismic Hazard Map. Ann. Geofis. 1999, 42, 1225–1228. [Google Scholar] [CrossRef]
- Ulomov, V.I. General seismic zoning of the territory of Russian Federation: GSZ-2012. Seism. Instrum. 2014, 50, 290–304. [Google Scholar] [CrossRef]
- Ulomov, V.I. Seismic hazard of Northern Eurasia. Ann. Geofis. 1999, 42, 1023–1038. [Google Scholar] [CrossRef]
- Ulomov, V.I.; Peretokin, S.A.; Medvedeva, N.S.; Akatova, K.N.; Danilova, T.I. Seismological aspects of general seismic zoning for the territory of the Russian Federation territory (OSR-97, OSR-2012, and OSR-2014 Maps). Seism. Instrum. 2015, 51, 311–328. [Google Scholar] [CrossRef]
- Zavyalov, A.D.; Peretokin, S.A.; Danilova, T.I.; Medvedeva, N.S.; Akatova, K.N. General Seismic Zoning: From Maps GSZ-97 to GSZ-2016 and New-Generation Maps in the Parameters of Physical Characteristics. Seism. Instr. 2019, 55, 445–463. [Google Scholar] [CrossRef]
- Malovichko, A.A.; Malovichko, D.A.; Golubeva, I.V.; Ivanova, Y.V. Natural and technogenic seismicity of the Ural region. J. Min. Sci. 2005, 41, 6–13. [Google Scholar] [CrossRef]
- Adushkin, V.V. Tectonic earthquakes of anthropogenic origin. Izv. Phys. Solid Earth 2016, 52, 173–194. [Google Scholar] [CrossRef]
- Petrov, V.A.; Minaev, V.A.; Ustinov, S.A.; Nafigin, I.O.; Lexin, A.B. Assessment of Seismogeodynamic Activity of Mining Areas on the Basis of 3D Geoinformation Modeling. Russ. J. Earth Sci. 2022, 6, 1–12. [Google Scholar] [CrossRef]
- Manconi, A.; Picozzi, M.; Coviello, V.; De Santis, F.; Elia, L. Real-time detection, location, and characterization of rockslides using broadband regional seismic networks. Geophys. Res. Lett. 2016, 43, 6960–6967. [Google Scholar] [CrossRef]
- Vorobieva, I.; Shebalin, P.; Narteau, C.; Beauducel, F.; Nercessian, A.; Clouard, V.; Bouin, M.-P. Multiscale mapping of completeness magnitude of earthquake catalogs. Bull. Seism. Soc. Am. 2013, 103, 2188–2202. [Google Scholar] [CrossRef]
- Dzeboev, B.A.; Gvishiani, A.D.; Agayan, S.M.; Belov, I.O.; Karapetyan, J.K.; Dzeranov, B.V.; Barykina, Y.V. System-Analytical Method of Earthquake-Prone Areas Recognition. Appl. Sci. 2021, 11, 7972. [Google Scholar] [CrossRef]
- Dzeboev, B.A.; Gvishiani, A.D.; Belov, I.O.; Agayan, S.M.; Tatarinov, V.N.; Barykina, Y.V. Strong Earthquake-Prone Areas Recognition Based on an Algorithm with a Single Pure Training Class: I. Altai-Sayan-Baikal Region, M ≥ 6.0. Izv. Phys. Solid Earth 2019, 55, 563–575. [Google Scholar] [CrossRef]
- Dzeboev, B.A.; Soloviev, A.A.; Dzeranov, B.V.; Karapetyan, J.K.; Sergeeva, N.A. Strong earthquake-prone areas recognition based on the algorithm with a single pure training class. II. Caucasus, M ≥ 6.0. Variable EPA method. Russ. J. Earth Sci. 2019, 19, ES6005. [Google Scholar] [CrossRef]
- Dzeboev, B.A.; Karapetyan, J.K.; Aronov, G.A.; Dzeranov, B.V.; Kudin, D.V.; Karapetyan, R.K.; Vavilin, E.V. FCAZ-recognition based on declustered earthquake catalogs. Russ. J. Earth Sci. 2020, 20, ES6010. [Google Scholar] [CrossRef]
- Gorshkov, A.I.; Soloviev, A.A. Recognition of earthquake-prone areas in the Altai-Sayan-Baikal region based on the morphostructural zoning. Russ. J. Earth Sci. 2021, 21, ES1005. [Google Scholar] [CrossRef]
- Gvishiani, A.D.; Dzeboev, B.A.; Agayan, S.M. FCAZm intelligent recognition system for locating areas prone to strong earthquakes in the Andean and Caucasian mountain belts. Izv. Phys. Solid Earth 2016, 52, 461–491. [Google Scholar] [CrossRef]
- Gvishiani, A.D.; Soloviev, A.A.; Dzeboev, B.A. Problem of Recognition of Strong-Earthquake-Prone Areas: A State-of-the-Art Review. Izv. Phys. Solid Earth 2020, 56, 1–23. [Google Scholar] [CrossRef]
- Kossobokov, V.G.; Soloviev, A.A. Pattern recognition in problems of seismic hazard assessment. Chebyshevskii Sb. 2018, 19, 55–90. (In Russian) [Google Scholar] [CrossRef]
- Agayan, S.M.; Tatarinov, V.N.; Gvishiani, A.D.; Bogoutdinov, S.R.; Belov, I.O. FDPS algorithm in stability assessment of the Earth’s crust structural tectonic blocks. Russ. J. Earth Sci. 2020, 20, ES6014. [Google Scholar] [CrossRef]
- Di Giacomo, D.; Bondár, I.; Storchak, D.A.; Engdahl, E.R.; Bormann, P.; Harris, J. ISC-GEM: Global Instrumental Earthquake Catalogue (1900–2009), III. Re-computed MS and mb, proxy MW, final magnitude composition and completeness assessment. Phys. Earth Planet. Inter. 2015, 239, 33–47. [Google Scholar] [CrossRef]
Disclaimer/Publisher’s Note: The statements, opinions and data contained in all publications are solely those of the individual author(s) and contributor(s) and not of MDPI and/or the editor(s). MDPI and/or the editor(s) disclaim responsibility for any injury to people or property resulting from any ideas, methods, instructions or products referred to in the content. |
© 2023 by the authors. Licensee MDPI, Basel, Switzerland. This article is an open access article distributed under the terms and conditions of the Creative Commons Attribution (CC BY) license (https://creativecommons.org/licenses/by/4.0/).