Abstract
To enhance ship detection accuracy in the presence of complex scenes and significant variations in object scales, this study introduces three enhancements to ReDet, resulting in a more powerful ship detection model called rotation-equivariant bidirectional feature fusion detector (ReBiDet). Firstly, the feature pyramid network (FPN) structure in ReDet is substituted with a rotation-equivariant bidirectional feature fusion feature pyramid network (ReBiFPN) to effectively capture and enrich multiscale feature information. Secondly, K-means clustering is utilized to group the aspect ratios of ground truth boxes in the dataset and adjust the anchor size settings accordingly. Lastly, the difficult positive reinforcement learning (DPRL) sampler is employed instead of the random sampler to address the scale imbalance issue between objects and backgrounds in the dataset, enabling the model to prioritize challenging positive examples. Through numerous experiments conducted on the HRSC2016 and DOTA remote sensing image datasets, the effectiveness of the proposed improvements in handling complex environments and small object detection tasks is validated. The ReBiDet model demonstrates state-of-the-art performance in remote sensing object detection tasks. Compared to the ReDet model and other advanced models, our ReBiDet achieves mAP improvements of 3.20, 0.42, and 1.16 on HRSC2016, DOTA-v1.0, and DOTA-v1.5, respectively, with only a slight increase of 0.82 million computational parameters.
1. Introduction
With the advancement of space remote sensing technology, the observation capability of optical remote sensing satellites has significantly improved, leading to an increase in the spatial resolution of remote sensing images. Currently, the spatial resolution can reach 0.3 m per pixel [1], providing high-quality data for various scientific research applications. Computer vision technology plays a crucial role in extracting information from these images for tasks such as geological mapping, terrain measurement, and land cover change detection [2]. Object detection and recognition in remote sensing images are particularly important, especially in identifying ships, which hold strategic value in both economic and military domains. The accurate detection and recognition of ships in port areas and key waterways are vital for civilian and military purposes. However, the presence of complex backgrounds and variations in object scales in remote sensing images [3] pose significant challenges to achieving satisfactory ship detection accuracy.
1.1. Difficulties in Optical Remote Sensing Image Object Detection
Remote sensing images exhibit complexity, covering a wide range with large image scales. While they provide valuable visual features for detection models, they also introduce complex and irrelevant background information that hinders accurate detection. Firstly, background interference arises from similar objects in the scene, leading to potential misjudgment. For example, small islands with similar colors and thin buildings on land can be mistakenly identified as ships. Secondly, self-interference occurs due to the diverse textures, similar colors, and wake features of ships, affecting the final recognition results. Thirdly, the random orientation of ships in remote sensing images poses another difficulty. Unlike natural scene images captured from a horizontal perspective, satellite images are taken from a bird’s-eye view, resulting in ships appearing at any position with any orientation, making detection challenging.
Furthermore, vehicles, boats, helicopters, airplanes, and large structures such as stadiums appear much smaller in remote sensing images compared to natural scene images captured from a horizontal viewpoint. Consequently, existing visual models often struggle to achieve accurate detection for these objects. For instance, in the optical remote sensing image dataset DOTA [4], small objects, such as cars, occupy approximately 30 × 50 pixels, large trucks occupy around 35 × 90 pixels, and the smallest yacht of interest is merely about 35 × 60 pixels in size.
1.2. The Significant Advantages of Deep Learning Techniques
Traditional ship detection methods [5,6,7,8] based on artificial feature modeling rely on manually designed algorithms to extract shallow features. These algorithms often focus on specific scenes and exhibit limited generalization abilities. They still face challenges in terms of accuracy, computational efficiency, and robustness in complex environments, making them less applicable [9,10,11].
In recent years, significant progress has been made in the field of object detection in natural images, largely attributed to the rapid development of deep learning technology [12]. The introduction of deep learning models has greatly improved the accuracy of object localization and recognition in images. Convolutional neural networks (CNNs) have emerged as powerful tools for feature extraction, enabling automatic learning and extraction of features from images. The renowned Faster R-CNN model [13] has become a representative model in natural image object detection, opening possibilities for applying deep learning-based object detection models to remote sensing images.
1.3. Related Works
After years of research, several mature methods have been developed for ship detection. Early studies predominantly focused on ship detection methods based on artificial feature modeling. However, since 2012, deep learning-based detection methods have emerged as a transformative force in the field of ship detection. Recent years have witnessed the proposal of numerous methods for ship detection in remote sensing images. Leveraging the powerful feature expression capabilities of convolutional neural networks (CNNs), these deep learning-based object detection methods can extract higher-level semantic features of ships, delivering significantly improved performance in complex remote sensing scenarios compared to traditional approaches. Nevertheless, most of these methods originated from object detection models designed for natural images captured from horizontal viewpoints and are limited in their ability to detect objects with arbitrary orientations. Given that ships possess relatively large aspect ratios and can exhibit random orientations in images, employing horizontal detection boxes would result in significant background information being included in the detection boxes. This issue becomes particularly pronounced when detecting densely distributed ships in a harbor, where interference from neighboring objects leads to poor detection performance.
To address these challenges, researchers have proposed models suitable for detecting objects with arbitrary orientations. For instance, the rotational R-CNN (R2CNN) model [14], initially developed for scene text detection, has shown excellent performance in detecting slanted text and has been adapted for ship detection. Liu et al. [15] enhanced this approach by introducing a rotation region of interest (RoI) pooling layer and a rotation bounding box regression module based on R2CNN. This improvement enables accurate feature extraction and localization, resulting in highly efficient and accurate ship detection. The rotated region proposal network (RRPN) [16] was designed as an enhancement of R2CNN to improve the quality of candidate regions generated by the region proposal network (RPN). RRPN generates 54 rotating anchor boxes with 3 scales, 3 aspect ratios, and 6 directions at each point in the feature map. Yang et al. [17] incorporated the dense feature pyramid network (FPN) based on RRPN to integrate low-level positional information and high-level semantic information, effectively detecting densely distributed ships using prow direction prediction. They also reduced redundant detection areas using rotational non-maximum suppression (NMS) to obtain more accurate object positions. Liu et al. [16] proposed the one-stage model CHPDet, which utilizes an orientation-invariant model to extract features. It selects the peak value of the feature map as the center point and then regresses the offset, size, and head point on the corresponding feature map of each center point, achieving impressive results in terms of speed and accuracy. Ding et al. [18] introduced a module called RoI Transformer based on the Faster R-CNN [13]. This module predicts a rough rotating RoI in the first stage based on the horizontal RoI generated by RPN. In the second stage, RoI Align [19] extracts the feature map of the RoI and refines the prediction result of the first stage to obtain a more accurate rotating RoI. Compared to RRPN, RoI Transformer significantly reduces the number of rotating anchors, leading to improvements in computational efficiency and detection accuracy. Oriented R-CNN [20], building upon the Faster R-CNN, introduced the midpoint offset representation and expanded the output parameters of the RPN regression branch from four to six to achieve skewed candidate boxes, resulting in substantial improvements in detection accuracy and computational efficiency.
Most object detection models are based on traditional CNNs, which possess translational equivariance but lack rotational equivariance. To enhance the adaptability of CNNs to rotational changes, numerous rotation-based object detection models have made significant efforts in data augmentation, rotation anchor boxes, or generating rotation RoIs to enhance the feature extraction of rotational objects in remote sensing images. Although these models have achieved some performance improvements, the issue of CNNs lacking rotational equivariance remains unaddressed.
To tackle this problem, ReDet [21] introduces the concept of E(2)-Equivariant Steerable CNNs [22] (E2-CNNs) into object detection by building upon the RoI Transformer [23]. ReDet adopts the e2cnn extension [22] for PyTorch [24] and employs it to reconfigure the architecture of ResNet-50 [25], renaming it ReResNet50. Additionally, the RiRoI Align module is redesigned to align channels and spatial dimensions, enabling the extraction of rotation-invariant features and further enhancing detection accuracy.
1.4. Goal of the Research
Although the methods mentioned above demonstrated good performance in ship detection, they still encounter several challenges. This study primarily focuses on two key issues:
(1) High-resolution optical remote sensing images contain rich pixel information of ships and other objects, but they also introduce a considerable amount of irrelevant, redundant, and potentially interfering noise. In specific scenarios, such as variations in lighting conditions and the limitations of satellite-borne sensors, the color contrast between ships and the background in some images may be low, leading to visual similarity to the human eye. Moreover, in harbor images, the shape of the dock can resemble that of large ships moored nearby. These factors contribute to the potential confusion of ships with complex backgrounds by detection models, resulting in missed detections and false alarms.
(2) Ships are typically sparsely and unevenly distributed in optical remote sensing images. Inappropriate sampling strategies may lead to the insufficient learning of ship features by the detection model. For example, the random sampling strategy commonly employed by many models, including ReDet, may exclude certain potential high-quality positive samples from the training process.
The ReDet model fails to address the aforementioned challenges. The upsampling operation in its FPN module may lead to the loss of crucial information, resulting in incomplete feature fusion and ultimately affecting the accuracy of the detection results. Additionally, the random sampler used in the RPN stage may lead to a small number of certain classes or samples due to class imbalance or sample imbalance, impacting the effectiveness of model training.
The objective of this study is to propose a solution based on ReDet to tackle the aforementioned problems, specifically focusing on ship object detection in remote sensing images. We introduce the ReBiDet model, which encompasses the following contributions: Firstly, we design a feature pyramid module called ReBiFPN based on rotational equivariance theory. ReBiFPN ensures balanced output levels and replaces the FPN module in the ReDet model. By integrating high-resolution features from higher layers with detailed information from lower layers, it enhances the detection performance of ships at multiple scales. Secondly, we propose the positive reinforcement learning sampler and an anchor optimization module based on K-means clustering. These components are utilized to balance the difficulty and proportion of positive samples during the training process, as well as optimizing the sizes and aspect ratios of anchors, further enhancing the model’s detection performance. Thirdly, we validate and compare the generalization performance of ReBiDet by selecting images from different optical remote sensing datasets. Finally, following the practices of other researchers in the field of optical remote sensing image object detection, we conduct experiments on the HRSC2016 and DOTA datasets to demonstrate the effectiveness of the proposed modules and the performance advantages of ReBiDet.
2. The Proposed Method
This section presents the architecture of ReBiDet. Figure 1 illustrates the five modules of ReBiDet: the feature extraction module ReResNet [21], the feature pyramid construction module ReBiFPN, the bounding box generation module RPN, the RoIAlign module for extracting feature maps of horizontal bounding boxes and performing preliminary classification and rotation bounding box generation, and the RiRoIAlign [21] module for extracting feature maps of rotation bounding boxes and performing classification refinement and rotation bounding box parameter refinement.
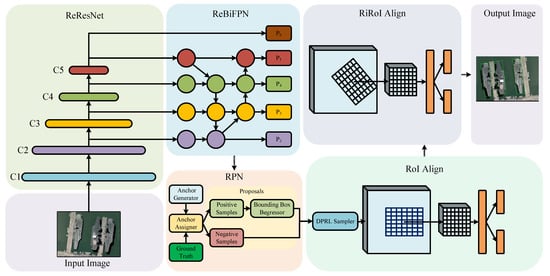
Figure 1.
Architecture of rotation-equivariant bidirectional feature fusion detector (ReBiDet).
ReBiDet is an improved version of ReDet that specifically addresses the characteristics of optical remote sensing images. The objective is to tackle the challenge of detecting ships in complex scenes with scale differences and enhance the detection accuracy of ships in remote sensing images using specialized modules. Three changes were made to the original ReDet architecture. Firstly, we introduced ReBiFPN, constructed based on e2cnn [22], to enable the network to capture multi-scale feature information from both bottom–up and top–down paths, facilitating more comprehensive fusion of low-level positional information and high-level semantic information. Secondly, we utilized the K-means [26] algorithm to cluster the aspect ratios of ground truth boxes in the dataset and adjusted the size of the anchor boxes generated by the anchor generator accordingly. Finally, in the RoIAlign stage, we employed the difficult positive reinforcement learning (DPRL) sampler to address class imbalance in the dataset and make the model more sensitive to challenging positive samples. Experimental results demonstrate the effectiveness of these improvements in enhancing the detection performance of small objects in optical remote sensing images.
2.1. Rotation-Equivariant Networks
Convolutional neural networks (CNNs) typically employ fixed-size, two-dimensional convolution kernels to extract features from images. During convolution, these kernels apply the same weights to every position in the image, thereby allowing the detection of the same feature, even if the image is horizontally or vertically shifted. This property is known as translation invariance. However, when an image undergoes a rotation, the pixel arrangement of all objects in the image changes, causing the features that can be extracted by the CNN to also change and potentially become distorted. This lack of rotation equivariance in CNNs poses challenges in accurately recognizing rotated objects.
The absence of rotation equivariance implies that as an object in the input image changes its orientation, the features extracted by the CNN also change, adversely affecting the accuracy of the rotated object detection. This effect is particularly pronounced for elongated objects, such as buses and ships.
Traditional CNNs are designed based on the assumption of translation invariance in input data. However, for objects with rotational symmetry, the extracted features may change, resulting in the loss of important information and poor training outcomes. E2-CNNs provide a solution to this problem. Their core is rooted in group theory and convolution operations, enabling them to extract features from an image in multiple directions simultaneously, thereby ensuring rotation equivariance throughout the convolution process. This property ensures that objects yield the same feature output regardless of their orientation or angle. Since rotation involves a continuous operation that entails substantial floating-point computation and information storage, it is impractical and inefficient to include the entire 2D rotation group in the computation. Thus, optimization becomes necessary in this context.
The backbone network employed in our model, ReResNet [21], is constructed based on E2-CNNs. Specifically, the 2D rotation group is discretized initially, establishing a discretized 2D rotation group with eight discrete parameters, representing eight rotation angles. This discretization significantly reduces computational complexity and memory resource consumption. Subsequently, each convolutional kernel extracts features based on this discretized 2D rotation group, resulting in feature maps (K, N, H, W) as depicted in Figure 2, where K denotes the number of convolutional kernels, N represents the number of directions (eight), and H and W denote the height and width of the feature maps, respectively.
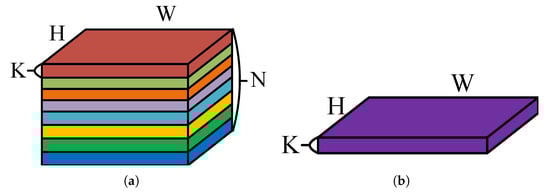
Figure 2.
Difference between the feature maps extracted by ReResNet and ResNet networks. (a) Feature maps extracted by the ReResNet network, denoted as (K, N, H, W), where N is an additional dimension compared to traditional ResNet feature maps shown in (b). Here, N = 8 indicates that discrete rotation group convolution can extract feature maps at 8 different rotation angles.
2.2. Rotation-Equivariant Bidirectional FPN
In the feature extraction network, lower-level features contain more detailed and positional information but have lower resolution. On the other hand, higher-level features have higher resolution and more semantic information but lack detail. In ReDet’s ReFPN module, inspired by the traditional FPN [27], a top–down feature fusion approach is adopted as shown in Figure 3. However, the traditional FPN has a relatively simple feature fusion method, performing simple feature upsampling from high to low levels. To provide a more intuitive understanding, we simplify the convolution layer and upsampling layer, representing them with Equation (1):
here, denotes the feature map extracted by the backbone network, represents the feature map output by the FPN module, and is the total number of layers inputted into FPN from the backbone network. The output fuses only the feature maps from layer i to , ignoring the importance of feature maps below layer i and not fully utilizing the feature information from different levels, which may lead to information loss. Typically, top-level feature maps with large strides are used to detect large objects, while bottom-level feature maps with small strides are used to detect small objects [28]. However, in the case of , if only the features of , , and from top to bottom are fused, the importance of , dedicated to detecting small objects, is ignored. Additionally, both and are extracted from the layer inputted into the backbone network, but only uses convolution downsampling with stride 2, which may result in the loss of significant feature information. In summary, the FPN design in the ReDet model suffers from unbalanced feature fusion, which may affect the detection performance of small objects in the overall model.
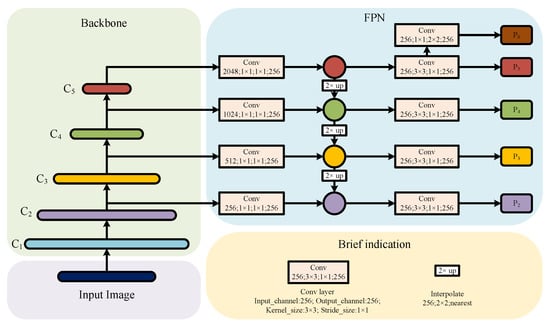
Figure 3.
Traditional feature pyramid network (FPN) structure schematic.
To address these issues, we introduce the rotation-equivariant bidirectional feature fusion feature pyramid network module, named ReBiFPN, based on the idea of PaNet [29]. Figure 4 illustrates the ReBiFPN module. ReBiFPN balances the output levels by integrating the feature maps of each resolution. It combines the high-resolution of the high-level features with the high-detail information of the low-level features, enhancing the network’s ability to extract and integrate multi-scale features through bidirectional path feature fusion. This approach captures richer multi-scale features and improves the detection performance of small objects. For simplicity, we represent the core idea of ReBiFPN with Equation (2):
where represents the feature map extracted by ReResNet, denotes the feature map output by the ReBiFPN module, is the total number of layers inputted into ReBiFPN from ReResNet, and is the number of the lowest layer inputted into ReBiFPN from ReResNet. Each level of the output balances the features fused from . The layer is excluded from the feature fusion because experimental results indicate that downsampling directly from the layer to obtain improves the detection accuracy slightly compared to downsampling from the layer. This improvement may be due to the weakening of object features after multiple convolution operations. A convolution is added before all the final output feature maps to reduce the aliasing effect of upsampling.
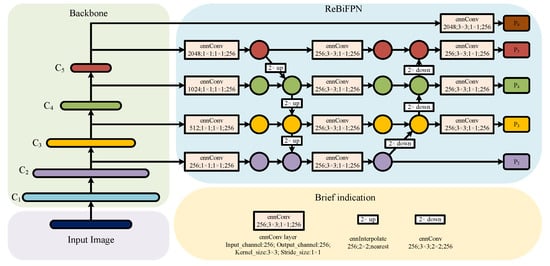
Figure 4.
Structure diagram of rotation-equivariant bidirectional feature fusion feature pyramid network (ReBiFPN), where all convolution and interpolation operations are based on E(2)-equivariant steerable CNNs [22] (E2-CNNs).
Our proposed ReBiFPN achieves the following objectives:
(1) Multi-scale information fusion: By leveraging the structure of the feature pyramid, we extract features at different scales. The fusion of features from various scales enhances the network’s receptive field, enabling it to detect ships of different scales. This capability allows the network to better adapt to variations in ship size and shape, thereby improving the robustness of ship detection.
(2) Bi-directional feature propagation: The use of a bi-directional feature propagation mechanism facilitates the exchange and interaction of information between different levels of the feature pyramid. This bidirectional propagation enables high-level semantic information to propagate to lower levels, enriching the semantic representation of lower-level features and enhancing their expressive capacity. Simultaneously, lower-level features can also propagate to higher levels, providing more accurate positional information, which aids in precise target localization.
(3) Multi-level feature fusion: We adopt a multi-level feature fusion strategy that progressively merges features from different layers. This approach allows the network to fuse semantic and positional information at different levels, resulting in more comprehensive and accurate feature representations. Through multi-level feature fusion, the finer details and contextual information of ships can be better captured, thereby improving the accuracy of ship detection.
From a theoretical standpoint, our proposed ReBiFPN demonstrates superior adaptability to scale variations compared to FPN. It effectively extracts richer semantic information and accurately localizes targets, ultimately leading to improved precision in object detection. Subsequent experiments provide further validation of these findings.
2.3. Anchor Improvement
ReBiDet is a two-stage object detection model that follows an anchor-based approach, where anchors are predefined boxes placed at various positions in an image [13]. The selection of anchor sizes and aspect ratios should be based on the distribution of object annotation boxes in the dataset, which can be considered as prior knowledge [30]. Improper anchor settings can hinder the network from effectively learning features of certain objects or result in the misidentification of adjacent objects. Therefore, it is crucial to carefully consider the size and shape distribution of objects in the training dataset and experiment with different numbers and ratios of anchors to find the most suitable settings for improving the network’s detection performance. To accomplish this, we employ the K-means algorithm to group the aspect ratios of ship bounding boxes in the HRSC2016 dataset into multiple clusters and determine anchor sizes based on the average aspect ratio of each cluster.
The K-means algorithm, presented in Algorithm 1, is an unsupervised learning technique. It starts by taking a set of aspect ratio data from the HRSC2016 dataset, randomly selecting K (set to 5 in our case) initial cluster centers. Each data point is then assigned to the nearest cluster center, and the cluster centers are iteratively recalculated and adjusted until they converge or reach a preset number of iterations. The objective is to maximize similarity within each cluster while minimizing similarity between clusters.
| Algorithm 1 K-means used to cluster the aspect ratios of ground truth boxes. |
|
Figure 5 illustrates the aspect ratio data of bounding boxes in the HRSC2016 dataset, grouped into five categories. The deep blue dots represent the cluster centroids of each aspect ratio group, which are {3.9, 5.8, 6.2, 6.3, 7.3}. Although these centroids span from 3.9 to 7.3, they are concentrated around 6. This suggests that the aspect ratios of objects in the HRSC2016 dataset tend to cluster around the value of 6. After conducting multiple experiments, aspect ratios of 7.3 and above did not yield satisfactory results in practical detection. Analysis indicates that such aspect ratios are too large. Although they appear in the clustering results, many ground truth boxes in the dataset are not strictly horizontal or vertical, but rather arbitrary. Large aspect ratios result in low intersection over union (IoU) values between anchor boxes and ground truth boxes, thus failing to enhance the model’s performance and introducing numerous negative samples that adversely impact performance. Consequently, we set the ratios of the RPN anchor generator as {1/6, 1/4, 1/2, 1, 2, 4, 6}.
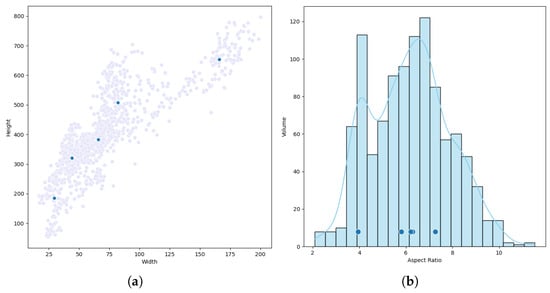
Figure 5.
Aspect ratio distribution and K-means clustering results of labeled boxes in the HRSC2016 dataset. (a) Scatter plot of the distribution of the length and width values of all labeled boxes. (b) Histogram of the aspect ratio distribution of all labeled boxes.
2.4. Difficult Positive Reinforcement Learning Sampler
The RPN module generates anchor boxes of varying sizes and aspect ratios on the feature map. It assigns positive and negative samples to these anchors based on the IoU threshold with the ground truth boxes. Specifically, an anchor box with an IoU greater than 0.7 is labeled as a positive sample, while an IoU less than 0.3 results in a negative sample. Any anchors falling between these thresholds are ignored. However, training the model with all candidate boxes becomes impractical due to their large number. To expedite the training process, ReDet adopts a random sampler that randomly selects a small subset of candidate boxes for training [21]. Nevertheless, the random sampler has notable drawbacks. The ratio of positive to negative samples is often imbalanced, and the random sampling strategy may excessively emphasize easy samples, impeding the model’s ability to learn from challenging samples such as small objects and overlapping objects. This not only affects the learning efficiency but also hampers the final detection accuracy.
Inspired by the concept of online hard example mining (OHEM) sampler [31], we propose selecting the candidate boxes with the highest loss for positive and negative samples during training to address the aforementioned issues with the random sampler. However, in practice, the distribution of negative samples is exceptionally complex, as depicted in Figure 6. During the sample selection stage in remote sensing ship detection, some anchor boxes may contain ship features but fall below the preset IoU threshold, while others may contain ships that were not annotated by the dataset’s original author. Despite these cases being classified as negative samples with high classification loss, they actually contain object features and belong to the category of hard samples. Prioritizing such negative samples with high classification loss during training could significantly affect the detection accuracy as confirmed by our experiments. As it is not possible to entirely avoid incorrect answers, we focus on learning the correct answers presents a more viable solution. Furthermore, since the number of negative samples typically exceeds the number of positive samples, randomly sampling negative samples may have a higher likelihood of selecting samples that only contain background and lack ship instances. Based on these observations, we propose the difficult positive reinforcement learning (DPRL) sampler to address this problem. The DPRL sampler concentrates on learning challenging positive samples to enhance the model’s performance, while continuing to employ the traditional random sampling approach for negative samples.
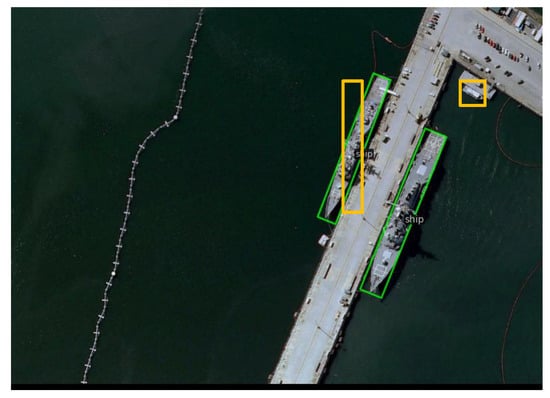
Figure 6.
Illustration of the intersection over union (IoU) between anchor boxes and ground truth boxes. The green box represents the ground truth box, while the yellow box represents the anchor box generated by the model with a 1:6 ratio.
Algorithm 2 outlines the calculation process of the DPRL sampler, which can be summarized as follows. For each batch of training samples , the forward propagation is initially performed to generate a set of candidate boxes using RPN, followed by loss calculation. The DPRL sampler maintains positive and negative samples in and , respectively. The samples in are then sorted in descending order based on the loss value, and the top samples are selected. Simultaneously, negative samples are randomly chosen from . These selected samples are combined with to form a new sample set L, which is used for backward propagation and updating the neural network parameters. This method intelligently selects the most challenging positive samples for training, thereby mitigating the issue of neglecting difficult samples and effectively enhancing the training efficiency of the neural network.
| Algorithm 2 Difficult positive reinforcement learning (DPRL) sampler. |
|
3. Experimental Results
3.1. Datasets
HRSC2016 [32] was released by Northwestern Polytechnic University in 2016 and is a unique dataset focusing on ship detection in remote sensing images. It consists of a total of 1680 images captured from 6 renowned ports available on Google Earth. Among these images, 619 do not contain any ships and serve as background images. The image sizes range from to . The dataset is divided into training, validation, and test sets, with 436, 181, and 444 images, respectively. The annotation format for ship bounding boxes is oriented bounding boxes (OBB) rather than horizontal bounding boxes (HBB), and a total of 2976 ships are annotated. HRSC2016 has become one of the most widely used benchmark datasets in remote sensing detection. The dataset presents several challenges for ship detection: (1) The majority of ships are docked closely together, exhibiting a dense arrangement of ships side by side. (2) Some ships are integrated with long piers or located in shipyards or ship repair yards, where the similarity between the ships and the nearby textures is high, making their features less distinguishable. (3) Certain land buildings bear resemblance to luxury yachts, leading to potential misclassification. (4) The scale of ships varies greatly, and an image may contain an aircraft carrier as well as a very small civilian ship simultaneously. The dataset provides annotations for ship classification at three levels; however, due to their low frequency, detecting and classifying ship subcategories is challenging. Therefore, our RePaDet model focuses only on training and inferring the first-level ship category, following the approach of most researchers.
DOTA [4,33], publicly released by Wuhan University in November 2017, has become the most commonly used public dataset for object detection in remote sensing. DOTA-v1.0 [4] consists of 2806 images obtained from various platforms, including Google Earth, JL-1, and GF-2 satellites. The dataset contains a total of 188,282 annotated objects belonging to 15 different categories, as represented by the abbreviations in the tables presented later: airplane (PL), baseball diamond (BD), bridge (BR), ground track field (GTF), small vehicle (SV), large vehicle (LV), ship (SH), tennis court (TC), basketball court (BC), storage tank (ST), soccer-ball field (SBF), roundabout (RA), harbor (HA), swimming pool (SP), and helicopter (HC). Unlike HRSC2016, the annotation boxes in DOTA-v1.0 are quadrilaterals defined by four points . DOTA-v1.5 [33], an extension of DOTA-v1.0, increases the number of bounding boxes to 402,089. It includes additional annotations for small objects (around 10 pixels or less) that were missed in DOTA-v1.0 and introduces a new category, container crane (CC), making it a more challenging dataset. In addition to the challenges faced by the HRSC2016 dataset, DOTA presents additional difficulties, including (1) a wide range of image pixel sizes, from to , making it challenging to train on GPUs such as GTX 3090ti, and (2) small object sizes, with 98% of the objects in the dataset being smaller than 300 pixels, and 57% smaller than 50 pixels [4], resulting in significant scale differences between tiny and large objects, thereby complicating detection. It is worth noting that the DOTA dataset does not release annotations for the test set; instead, researchers are required to upload their detection results for evaluation, which limits comprehensive analysis of experimental results.
3.2. Setup
The experimental setup employed a workstation equipped with an AMD Threadripper PRO 5995WX processor, 2 NVIDIA GTX3090Ti graphics cards, and 128 GB of memory. The workstation ran on the Ubuntu20.04 operating system and was installed with various software, including CUDA 11.8, Python 3.8, PyTorch 1.11.0 [24], and torchvision 0.12.0. The MMRotate 0.3.2 [34] framework was used for the entire experimental process and result generation. Both the hardware and software versions were relatively new and exhibited strong compatibility, allowing for easy replication in various environments.
During training, data augmentation techniques, such as horizontal and vertical flips, were applied, with a batch size of 2. The entire network was optimized using the stochastic gradient descent algorithm, with a momentum of 0.9 and a weight decay of 0.0001. The IoU threshold for positive samples in the RPN was set to 0.7. The horizontal NMS threshold was set to 0.7, and the oriented NMS threshold was set to 0.1.
For the HRSC2016 dataset, the longer side of the images was adjusted to 1280 pixels, while maintaining the aspect ratio. If the shorter side was larger than 1280 pixels, it was reduced to 1280 pixels as well. During training, the blank regions were filled with black, and the model was trained for 12 epochs. The initial learning rate was set to 0.01, which was divided by 10 at epoch 9 and epoch 11.
For the DOTA dataset, the original images were cropped to a size of , with a stride of 824 pixels, resulting in overlapping patches by 200 pixels. RePaDet was trained for 12 epochs with an initial learning rate of 0.01, which was also divided by 10 at epoch 9 and 11. Figure 7 illustrates the loss curve of our model during training on the DOTA dataset, with 3200 iterations per epoch. A significant decrease in loss was observed at the 8th epoch (25,600 iterations). To ensure a fair comparison with other models, multi-scale training was conducted by randomly cropping and rotating the dataset at three scales {0.5, 1.0, 1.5} for both training and testing.
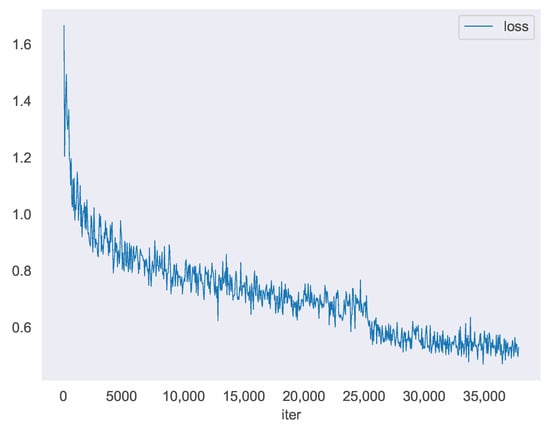
Figure 7.
Train loss curve of ReBiDet on DOTA.
3.3. Results and Analysis
3.3.1. Analysis Based on HRSC2016 Dataset
Firstly, we conducted ablation experiments on the HRSC2016 dataset to evaluate the aforementioned modules. The average precision (AP) was used as the main evaluation metric, calculated using the 11-interpolated precision method proposed in VOC2007 [35]. AP50 represents the AP value at an IoU threshold of 0.5. As shown in Equation (3),
where r is the recall rate and is the precision at recall rate . AP75 represents the AP value at an IoU threshold of 0.75. Its calculation formula is the same as that of AP50, except that the IoU threshold is changed to 0.75. AP50 and AP75 are commonly used to evaluate model performance [36]. The mean average precision (mAP) is the average AP calculated at different IoU thresholds ranging from 50% to 95% with a step size of 5%. Its calculation formula is given in Equation (4):
here, T represents the set of IoU thresholds, and is the average precision at IoU threshold t. This calculation method was initially used in the COCO detection challenge (bounding box) and is now commonly used in object detection evaluation [36].
Table 1 presents the performance of each module in ReDet. ReDet represents the experimental results reported by the authors, while ReDet* represents our best performance achieved in the MMRotate framework [34] for comparison. The three added modules showed varying degrees of improvement compared to the baseline. Although AP50 showed a small improvement and even a 0.1% drop after the DPRL module was added, mAP significantly improved. This suggests that the accuracy of the detection results under high IoU thresholds is greatly improved. Our ReBiDet model achieved a 1.27% improvement in mAP compared to the baseline, demonstrating the effectiveness of our proposed method.

Table 1.
The ablation study results on the HRSC2016 dataset. Noted that mean average precision (mAP) refers to the average precision over all possible IoU thresholds. AP50 refers to the average precision at an IoU threshold of 0.5, and AP75 refers to the average precision at an IoU threshold of 0.75.
We further analyzed the detection results of the ReBiDet model on the HRSC2016 dataset and generated a confusion matrix as shown in Figure 8. The test set contained 1228 annotated ground truth boxes. Our model correctly detected 1178 ships, missed 50 ships, and misclassified 106 background images as ships. We were surprised by the misclassification of the background images, but upon visualizing the results, we discovered that incomplete annotations in the HRSC2016 dataset might be the main reason for this. The original author did not fully annotate all objects that should have been labeled as ships in this dataset. Incomplete annotations in the test set can negatively impact model performance during testing. Figure 9 illustrates that the model detected some ships that were not fully labeled during testing. However, due to the incomplete annotation information, the validation program could not accurately determine if these ships were correctly detected, leading to their misclassification as false positives and a decrease in the model’s mAP.
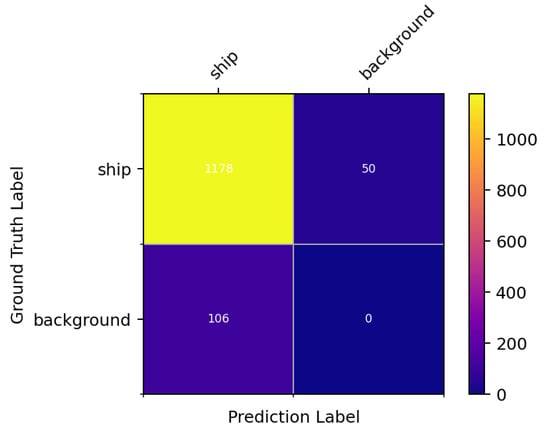
Figure 8.
Confusion matrix of the detection results of the ReBiDet model on the HRSC2016 dataset. The numbers in the figure refer to the number of targets.
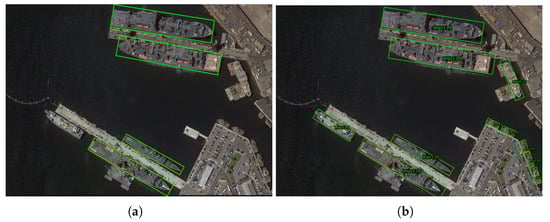
Figure 9.
Comparison between the ground truth label and detection result of an image in the test set of HRSC2016. (a) Image annotated with the ground truth label. (b) Our detection result on the same image.
Considering these findings, we thoroughly examined the HRSC2016 test set and manually re-annotated a portion of the missing targets, adding 80 new target annotations to the existing 1228 annotations. We then re-evaluated the detection performance of ReBiDet on the newly annotated test set. To ensure fairness, all compared models were baseline models from the MMRotate framework, replicated by the authors based on the original papers and the HRSC2016 dataset. Among them, SA-Net-TO [18] was the best model obtained after adjusting the hyperparameters by us. The final experimental results are presented in Table 2. On the new test set, ReBiDet showed slight improvements in mAP, AP50, and AP75. In terms of target detection statistics, at an IoU threshold of 0.5, ReBiDet correctly detected 1256 targets, missed 52 targets, and misdetected 29 targets. Its precision, recall, and accuracy were significantly better than those of ReDet and other detection models.
Table 2.
Comparison of detection results on the re-annotated HRSC2016 test set. All models compared are baseline models from the MMRotate framework.
In terms of Precision, ReBiDet outperformed SA-Net by 6.8% at an IoU threshold of 0.5, but the difference in AP50 was only 1%. This can be attributed to the lower precision of ReBiDet at certain recall rates, affecting its overall AP50. Compared to RetinaNet + KLD, ReBiDet had only a 1.04% higher precision, but its precision at certain recall rates was much higher, resulting in a 2.1% higher AP50 than RetinaNet+KLD. This demonstrates that AP and precision are not directly related [36]. AP is a more comprehensive indicator, as it considers multiple factors and evaluates the model’s performance under different conditions [36]. Compared to the baseline model ReDet, ReBiDet consistently outperformed in AP50, AP75, and mAP, indicating its superior detection accuracy under high IoU threshold conditions. This further validates the superiority of our proposed ReBiDet model.
3.3.2. Analysis Based on DOTA-v1.0
Earlier, we noted that the authors of DOTA-v1.0 did not provide ground truth annotation files for the test set. Instead, participants were required to submit their test results to a designated server, receiving mAP and AP values for each class as feedback. However, these metrics were insufficient for a comprehensive performance analysis. In our experiments, we trained ReBiDet and ReDet models on the training set and evaluated them on the validation set, which was not used for training. The MMRotate framework was employed for training and evaluation. The ReDet model’s learning rate was set to 0.01, consistent with ReBiDet. Other settings for ReDet remained at their default values. To facilitate a more intuitive comparison of detection performance, we generated confusion matrices for both models. Due to the large number of objects per class in the test set, we normalized the confusion matrix rows to present the correct and false recognition rates as percentages. The diagonal line in the matrix represents the proportion of true positive (TP) detections, while the rightmost column represents the number of false negative (FN) detections. Other areas denote false positive (FP) detections. Figure 10 illustrates that ReBiDet achieved a 92% TP rate for the ship class, surpassing ReDet by 1%, while also exhibiting a 7% FN rate, 1% lower than ReDet. For other classes, ReBiDet demonstrated either higher or equivalent TP numbers compared to ReDet, along with generally significantly lower FN numbers. This further confirms the effectiveness of our proposed modules.
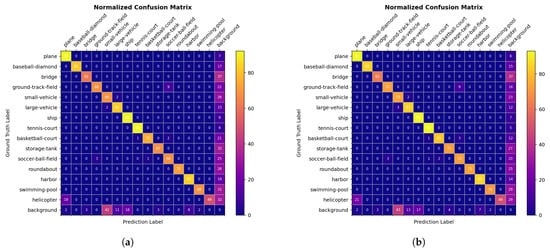
Figure 10.
Normalized confusion matrix on the DOTA dataset. (a) The detection results of ReDet reproduced by us. (b) The detection results of ReBiDet. The unit of the numbers in the figure is percentage (%), representing the percentage of ground truth label targets.
Figure 11 compares the ground truth labels of some validation set images with the detection results of the ReBiDet model trained solely on the training set. The images demonstrate the superior ability of ReBiDet to detect objects not annotated in the original dataset. Figure 11a,b showcase the strong performance of ReBiDet in detecting densely packed vessels, while Figure 11c,d exemplify its recognition capability for vessels in motion. Figure 11e,f,k,l demonstrate the effectiveness of ReBiDet in detecting small objects with indistinct features. Furthermore, Figure 11g–j demonstrate the robust detection performance of ReBiDet, even in complex scenes with cloud and mist interference.
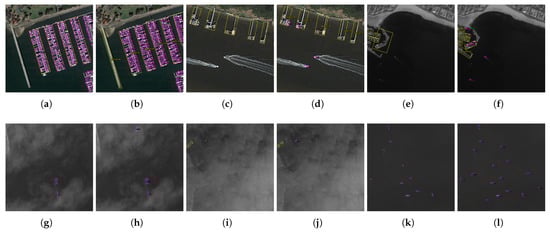
Figure 11.
Comparison between the ground truth label and detection result of images in the validation set of DOTA-v1.0. (a,c,e,g,i,k) are image annotated with the ground truth label. (b,d,f,h,j,l) are our detection result on the same image.
Additionally, when comparing ReBiDet with other models on a single RTX4090 computing platform, ReBiDet exhibited a slightly higher computational parameter count while achieving superior performance. Table 3 presents the comparison of ReBiDet with other models in terms of computational parameters, inference speed, and other dimensions. Within the MMRotate framework, ReBiDet had 32.56 million computational parameters, merely 0.92 M more than the 31.64 M of ReDet. This less than 1 M increase resulted in an additional 2.5 ms per image during model inference, corresponding to a decrease of 1.4 img/s in FPS. Thus, ReBiDet incurred a small computational cost, while significantly improving detection accuracy. The table reveals that computational parameters and inference speed are not completely correlated, with models having similar parameters but different inference speeds, and vice versa. Specifically, although ReBiDet had a relatively small parameter count, its inference speed was not fast enough. This may be attributed to the backbone network ReResNet50 and ReBiFPN, which are constructed based on E2CNN. These networks utilize rotation-equivariant convolutional layers, involving additional operations, such as rotation, interpolation, and grouping, which can reduce the calculation speed. Additionally, unlike traditional ResNet employing PyTorch’s built-in convolutional layers, ReResNet50 and ReBiFPN require calling the e2cnn library for rotation-equivariant network calculations, potentially affecting the computational efficiency.
Table 3.
Comparison of ReBiDet with other models on computational parameters and inference speed.
It is important to note that ReBiDet also exhibits excellent generalization performance. Figure 12 presents the detection results when applying the ReBiDet model trained on the DOTA dataset to image from the HRSC2016 dataset. The ReBiDet trained on the DOTA dataset outperformed the one trained on HRSC2016, showing improved alignment between the labeled detection boxes and the actual targets. ReBiDet detected more ships, including three additional small-sized vessels. This improvement can be attributed to the HRSC2016 training dataset’s incomplete annotation, which hinders model training completeness and leads to subpar detection performance. Additionally, the ReBiDet model underwent specific optimizations for ship detection tasks, particularly enhancing feature extraction capabilities through the ReBiFPN module. These improvements contribute to better generalization performance following thorough training.
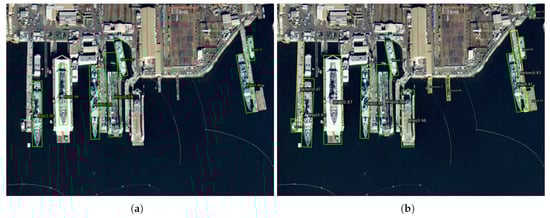
Figure 12.
Illustration of the generalization ability of the ReBiDet model trained on the DOTA dataset, using an original image from the HRSC2016 test set. Subfigure (a) displays the detection results obtained by the ReBiDet model trained on the HRSC2016 dataset. Subfigure (b) illustrates the detection results achieved by the ReBiDet model trained on the DOTA dataset.
To further assess the models’ generalization capability, we selected an image from the FAIR1M [40] dataset. To ensure fairness, all compared models were baseline models from the MMRotate framework, reconstructed by the authors based on the original papers and the DOTA dataset. Figure 13 reveals that only ReBiDet and RoI Transformer [23] detected the small vessel on the left side of the image. However, RoI Transformer mistakenly identified three land objects as ships. Although RDet [39] detected more ships, most of the annotated detection boxes had confidence scores below 0.5. S-Net [18] exhibited a similar situation, with confidence scores around 0.5 for the detected large ships, indicating uncertainty in the results and potentially affecting the AP metric. Oriented R-CNN [20] falsely detected a land object, and ReDet [21] failed to detect an adequate number of ships. For this particular image, ReBiDet demonstrated superior generalization capability.
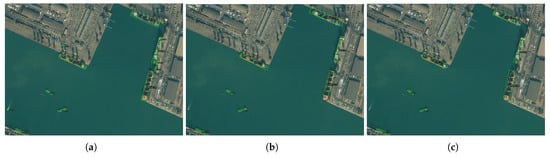
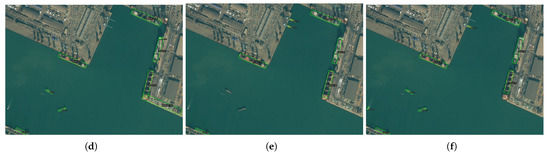
Figure 13.
Comparison of the generalization capability of ReBiDet and other five models trained on the DOTA dataset, using an original image from the FAIR1M [40] dataset. Subfigures (a–c) depict the detection results of RoI Transformer [23], RDet [39], and SA-Net [18], respectively, while subfigures (d–f) represent the detection results of Oriented R-CNN [20], ReDet [21], and ReBiDet, respectively. With the exception of ReBiDet, all other models were replicated by the authors of the MMRotate framework based on the original papers and the DOTA dataset.
3.3.3. Results
This section primarily presents the performance test results of ReBiDet. We follow the practices commonly employed by researchers in the field of optical remote sensing image object detection. We compare the ReBiDet model with state-of-the-art models reported in recent years on two benchmark datasets, namely HRSC2016 and DOTA, to evaluate and compare its performance. The selected models are from reputable journals and conferences, and we directly quote their performance metrics without modification. The backbone networks used by these models are denoted as R50, R101, R152, H-104, and DLA34, representing ResNet-50, ResNet-101, ResNet-152, 104-layer hourglass network, and 34-layer deep layer aggregation network, respectively.
Detailed comparison results for the HRSC2016, DOTA-v1.0, and DOTA-v1.5 datasets are reported in Table 4, Table 5 and Table 6. On the HRSC2016 dataset, ReBiDet outperforms all existing models, demonstrating outstanding performance compared to the state-of-the-art approaches. In the single-scale detection task on DOTA-v1.0, ReBiDet surpasses all compared methods with a mAP of 76.50%, which is 0.22 higher than the baseline model. In most fine-grained categories, ReBiDet ranks within the top three, except for the ship category, where it achieves the highest AP. In the multi-scale detection task, ReBiDet exhibits various degrees of improvement compared to the single-scale detection results across all categories. ReBiDet also demonstrates improvement in the PL, BD, GTF, SV, SH, TC, ST, SBF, and HA categories compared to the baseline model, with first-place rankings in GTF, TC, ST, SBF, and HA categories. On the DOTA-v1.5 dataset, ReBiDet showcases superior performance compared to the baseline method. This advantage can be attributed to the presence of numerous small objects, approximately 10 pixels or smaller, in DOTA-v1.5, which ReBiDet excels at learning and detecting. Furthermore, even when compared to RTMDet (a research collaboration among Shanghai AI Laboratory, Nanyang Technological University, Tianjin University, Shanghai Jiaotong University, and Northeastern University) [41], ReBiDet exhibits certain advantages in terms of performance and computational parameters. These results indicates the significant capability of ReBiDet in detecting large and elongated objects with ship features. Notably, despite utilizing a 50-layer backbone network, our model outperforms all compared methods with backbone networks of 101 layers or more. Figure 14 presents some results for the DOTA dataset.
Table 4.
Comparison results on the HRSC2016 dataset.
Table 5.
Comparisons with state-of-the-art methods on DOTA-v1.0 OBB task.
Table 6.
Comparisons with state-of-the-art methods on DOTA-v1.5 OBB task.

Figure 14.
Examples of detection results on the DOTA dataset using ReBiDet.
4. Discussion
The experimental results validate the effectiveness of our proposed ReBiDet model in ship detection tasks, indicating the efficacy of our designed methods and modules. ReBiFPN efficiently performs cross-fusion between deep features, which possess large receptive fields and strong semantic representation ability, and shallow features that lack spatial geometric feature details and have low resolution. This approach exhibits significant performance advantages compared to traditional feature pyramid networks. Each layer acquires more comprehensive and rich feature information, thereby facilitating downstream task execution and considerably improving the model’s detection ability. The anchor improvement method aggregates features from annotated boxes in the dataset, adjusting the parameters of the anchor generator accordingly, thereby enhancing the model’s detection capability for specific objects. The DPRL sampler module enables the model to focus on learning difficult positive samples, while avoiding the interference of false difficult negative samples. In summary, these three proposed methods or modules hold value in improving the ship detection capability in optical remote sensing images.
Nevertheless, it is important to acknowledge that any method or research inherently possesses certain limitations. Our research primarily falls within the qualitative category, and there is still ample room for exploration in the quantitative aspects, which represents our future direction. The ReBiFPN module, inspired by PANet [29], indeed yielded positive results. The EfficientDet research [57] demonstrates that stacking multiple bi-directional feature fusion paths further enhances the detection accuracy on the COCO dataset [58]. Moreover, the detection accuracy varies with the number of stacked layers. Hence, in our field of optical remote sensing detection, it is crucial to investigate whether a similar effect exists, which will be the focus of our forthcoming quantitative research. Regarding the anchor improvement method, we have only roughly aggregated the features of ships in the existing dataset and adjusted the parameters of the anchor generator, achieving a qualitative effect. To put it figuratively, this can be likened to “casting a wide net to catch more fish” (a common idiom). Additionally, the quantitative research lies in how to set the anchor generator reasonably and accurately to strike a balance between accuracy and computational complexity. After introducing the OHEM sampler module, we observed a decrease in detection accuracy instead of an increase. Through repeated experiments and in-depth analysis, we proposed the DPRL sampler module to enhance the learning of difficult positive samples, thereby beneficially improving the model’s detection accuracy. As for low-loss positive samples, it raises the question of whether it is the correct choice to abandon direct learning. In terms of negative samples, ships that are only partially anchored and interference from land structures, roads, and vegetation are considered difficult negative samples. Although random sampling is a feasible approach, it remains uncertain whether more reasonable methods exist to address these challenges. We firmly believe that such methods do indeed exist.
For ship detection in optical remote sensing images, our research is still in its early stages, with quantitative research serving as the focal point of our future work. Concerning the issue of inaccurate detection accuracy evaluation due to incomplete object annotations in HRSC2016, we intend to manually re-annotate all ship targets in the HRSC2016 dataset in our next study. This will enable us to conduct a comprehensive comparison of various evaluation indicators based on the model’s performance in existing detection models, ultimately leading to breakthroughs in improving detection performance. Furthermore, as illustrated in Figure 15, ReBiDet encounters an issue of inaccurate detection box positioning when detecting elongated objects such as ships. This issue primarily stems from inadequate training of the detection box during the alignment regression stage. We plan to explore potential solutions to this problem, including, but not limited to, modifying the loss function and the bounding box alignment regression module.
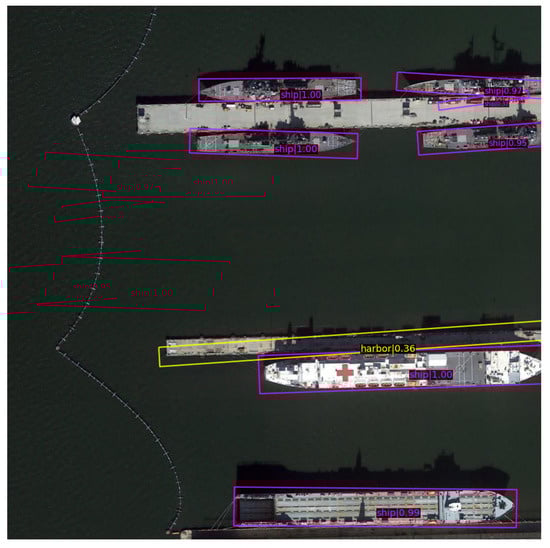
Figure 15.
Illustration of inaccurate detection box positioning by ReBiDet.
5. Conclusions
This study is dedicated to addressing the ship detection problem in optical remote sensing images. The proposed ReBiDet, an enhanced version of ReDet, incorporates three improvements: ReBiFPN, DPRL sampler, and anchor improvement. These enhancements respectively bolster the network’s ability to capture multi-scale features, learn difficult positive samples, and adapt to ship target aspect ratios. As a result, ReBiDet provides an effective and practically valuable solution for ship detection. The experimental results on HRSC2016 and DOTA datasets underscore the model’s exceptional performance. Future research can concentrate on enhancing the model’s performance by exploring more advanced network structures, loss functions, and optimization methods. Additionally, researchers can delve into additional optimization schemes for ship detection in remote sensing images to enhance accuracy and robustness. Moreover, it would be intriguing to explore the model’s generalization capability on other datasets, such as FAIR1M [40].
Author Contributions
Methodology, Z.Y.; Software, Z.Y.; Supervision, Z.L. and Y.X.; Writing—Original Draft, Z.Y. and S.L.; Writing—Review and Editing, Z.Y., C.L. and Z.L.;Visualization, F.S. All authors have read and agreed to the published version of the manuscript.
Funding
This research received no external funding.
Data Availability Statement
The HRSC2016 dataset used in this study was publicly released by Northwestern Polytechnical University in 2016 and includes complete sets of training, validation, and testing images and annotation files. It can be downloaded at the following address: https://aistudio.baidu.com/aistudio/datasetdetail/54106 (accessed on 8 June 2023). The DOTA dataset was publicly released by Wuhan University in November 2017 and includes complete sets of training, validation, and testing images, as well as annotation files for the training and validation sets. It can be downloaded at this address: https://captain-whu.github.io/DOTA/dataset.html (accessed on 8 June 2023). Since the downloaded package does not include annotation files for the testing set, users need to submit their model’s inference results to the Wuhan University official Evaluation Server to obtain the accuracy of the inference results, at this address: https://captain-whu.github.io/DOTA/evaluation.html (accessed on 8 June 2023). Finally, we published some of the raw experiment results for this study at https://github.com/YanZeGit/ReBiDet (accessed on 8 June 2023). After this article is published, our code and other related materials will also be released at this address.
Acknowledgments
This work was supported by the Institute of Systems Engineering, Academy of Military Sciences, and We would like to express our gratitude to Yongqiang Xie and Zhongbo Li, for their support and guidance throughout the project. Their contributions have been invaluable to the success of this study.
Conflicts of Interest
The authors declare no conflict of interest.
Abbreviations
The following abbreviations are used in this manuscript:
| ReBiDet | Rotation-equivariant Bidirectional Feature Fusion Detector |
| CNN | Convolutional Neural Networks |
| R2CNN | Rotational R-CNN |
| E2-CNNs | E(2)-Equivariant Steerable CNNs |
| RoI | Region of Interest |
| RRPN | Rotated Region Proposal Network |
| RPN | Region Proposal Network |
| NMS | Non-Maximum Suppression |
| IoU | Intersection over Union |
| FPN | feature pyramid network |
| ReFPN | Rotation-equivariant Feature Pyramid Network |
| ReBiFPN | Rotation-equivariant Bidirectional Feature Fusion Feature Pyramid Network |
| OHEM | Online Hard Example Mining |
| DPRL | Difficult Positive Reinforcement Learning |
| mAP | mean Average Precision |
| OBB | Oriented Bounding Boxes |
| TP | True Positive |
| FN | False Negative |
| FP | False Positive |
References
- Feng, X.; Zhang, W.; Su, X.; Xu, Z. Optical Remote Sensing Image Denoising and Super-Resolution Reconstructing Using Optimized Generative Network in Wavelet Transform Domain. Remote Sens. 2021, 13, 1858. [Google Scholar] [CrossRef]
- Zhou, H.; Tian, C.; Zhang, Z.; Li, C.; Ding, Y.; Xie, Y.; Li, Z. Position-Aware Relation Learning for RGB-Thermal Salient Object Detection. IEEE Trans. Image Process. 2023, 32, 2593–2607. [Google Scholar] [CrossRef] [PubMed]
- Li, Q.; Mou, L.; Liu, Q.; Wang, Y.; Zhu, X.X. HSF-Net: Multiscale Deep Feature Embedding for Ship Detection in Optical Remote Sensing Imagery. IEEE Trans. Geosci. Remote Sens. 2018, 56, 7147–7161. [Google Scholar] [CrossRef]
- Xia, G.S.; Bai, X.; Ding, J.; Zhu, Z.; Belongie, S.; Luo, J.; Datcu, M.; Pelillo, M.; Zhang, L. DOTA: A Large-Scale Dataset for Object Detection in Aerial Images. In Proceedings of the 2018 IEEE/CVF Conference on Computer Vision and Pattern Recognition, Salt Lake City, UT, USA, 18–23 June 2018; pp. 3974–3983. [Google Scholar] [CrossRef]
- Shuai, T.; Sun, K.; Wu, X.; Zhang, X.; Shi, B. A ship target automatic detection method for high-resolution remote sensing. In Proceedings of the 2016 IEEE International Geoscience and Remote Sensing Symposium (IGARSS), Beijing, China, 10–15 July 2016; pp. 1258–1261. [Google Scholar] [CrossRef]
- Diao, W.; Sun, X.; Zheng, X.; Dou, F.; Wang, H.; Fu, K. Efficient Saliency-Based Object Detection in Remote Sensing Images Using Deep Belief Networks. IEEE Geosci. Remote Sens. Lett. 2016, 13, 137–141. [Google Scholar] [CrossRef]
- Proia, N.; Pagé, V. Characterization of a Bayesian Ship Detection Method in Optical Satellite Images. IEEE Geosci. Remote Sens. Lett. 2010, 7, 226–230. [Google Scholar] [CrossRef]
- Ding, Z.; Yu, Y.; Wang, B.; Zhang, L. An approach for visual attention based on biquaternion and its application for ship detection in multispectral imagery. Neurocomputing 2012, 76, 9–17. [Google Scholar] [CrossRef]
- Li, B.; Xie, X.; Wei, X.; Tang, W. Ship detection and classification from optical remote sensing images: A survey. Chin. J. Aeronaut. 2021, 34, 145–163. [Google Scholar] [CrossRef]
- Yin, Y.; Cheng, X.; Shi, F.; Liu, X.J.; Huo, H.; Chen, S. High-order Spatial Interactions Enhanced Lightweight Model for Optical Remote Sensing Image-based Small Ship Detection. arXiv 2023, arXiv:abs/2304.03812. [Google Scholar]
- Ren, Z.; Tang, Y.; He, Z.; Tian, L.; Yang, Y.; Zhang, W. Ship Detection in High-Resolution Optical Remote Sensing Images Aided by Saliency Information. IEEE Trans. Geosci. Remote Sens. 2022, 60, 5623616. [Google Scholar] [CrossRef]
- Li, C.; Zhou, H.; Liu, Y.; Yang, C.; Xie, Y.; Li, Z.; Zhu, L. Detection-Friendly Dehazing: Object Detection in Real-World Hazy Scenes. IEEE Trans. Pattern Anal. Mach. Intell. 2023, 45, 8284–8295. [Google Scholar] [CrossRef]
- Ren, S.; He, K.; Girshick, R.; Sun, J. Faster R-CNN: Towards Real-Time Object Detection with Region Proposal Networks. IEEE Trans. Pattern Anal. Mach. Intell. 2017, 39, 1137–1149. [Google Scholar] [CrossRef] [PubMed]
- Jiang, Y.; Zhu, X.; Wang, X.; Yang, S.; Li, W.; Wang, H.; Fu, P.; Luo, Z. R2CNN: Rotational Region CNN for Orientation Robust Scene Text Detection. arXiv 2017, arXiv:abs/1706.09579. [Google Scholar]
- Liu, Z.; Hu, J.; Weng, L.; Yang, Y. Rotated region based CNN for ship detection. In Proceedings of the 2017 IEEE International Conference on Image Processing (ICIP), Beijing, China, 17–20 September 2017; pp. 900–904. [Google Scholar] [CrossRef]
- Liu, W.; Ma, L.; Chen, H. Arbitrary-Oriented Ship Detection Framework in Optical Remote-Sensing Images. IEEE Geosci. Remote Sens. Lett. 2018, 15, 937–941. [Google Scholar] [CrossRef]
- Yang, X.; Sun, H.; Sun, X.; Yan, M.; Guo, Z.; Fu, K. Position Detection and Direction Prediction for Arbitrary-Oriented Ships via Multitask Rotation Region Convolutional Neural Network. IEEE Access 2018, 6, 50839–50849. [Google Scholar] [CrossRef]
- Han, J.; Ding, J.; Li, J.; Xia, G.S. Align Deep Features for Oriented Object Detection. IEEE Trans. Geosci. Remote Sens. 2022, 60, 5602511. [Google Scholar] [CrossRef]
- He, K.; Gkioxari, G.; Dollár, P.; Girshick, R. Mask R-CNN. IEEE Trans. Pattern Anal. Mach. Intell. 2020, 42, 386–397. [Google Scholar] [CrossRef]
- Xie, X.; Cheng, G.; Wang, J.; Yao, X.; Han, J. Oriented R-CNN for Object Detection. In Proceedings of the 2021 IEEE/CVF International Conference on Computer Vision (ICCV), Montreal, QC, Canada, 10–17 October 2021; pp. 3500–3509. [Google Scholar] [CrossRef]
- Han, J.; Ding, J.; Xue, N.; Xia, G. ReDet: A Rotation-equivariant Detector for Aerial Object Detection. In Proceedings of the 2021 IEEE/CVF Conference on Computer Vision and Pattern Recognition (CVPR), Nashville, TN, USA, 20–25 June 2021; pp. 2785–2794. [Google Scholar] [CrossRef]
- Weiler, M.; Cesa, G. General E(2)-Equivariant Steerable CNNs. In Proceedings of the Thirty-Third Conference on Neural Information Processing Systems (NeurIPS 2019), Vancouver, BC, Canada, 8–14 December 2019; Available online: https://proceedings.neurips.cc//paper/2019/hash/45d6637b718d0f24a237069fe41b0db4-Abstract.html (accessed on 8 June 2023).
- Ding, J.; Xue, N.; Long, Y.; Xia, G.; Lu, Q. Learning RoI Transformer for Oriented Object Detection in Aerial Images. In Proceedings of the 2019 IEEE/CVF Conference on Computer Vision and Pattern Recognition (CVPR), Long Beach, CA, USA, 15–20 June 2019; pp. 2844–2853. [Google Scholar] [CrossRef]
- Paszke, A.; Gross, S.; Massa, F.; Lerer, A.; Bradbury, J.; Chanan, G.; Killeen, T.; Lin, Z.; Gimelshein, N.; Antiga, L.; et al. PyTorch: An Imperative Style, High-Performance Deep Learning Library. In Proceedings of the Thirty-Third Conference on Neural Information Processing Systems (NeurIPS 2019), Vancouver, BC, Canada, 8–14 December 2019; Available online: https://proceedings.neurips.cc/paper/2019/hash/bdbca288fee7f92f2bfa9f7012727740-Abstract.html (accessed on 8 June 2023).
- He, K.; Zhang, X.; Ren, S.; Sun, J. Deep Residual Learning for Image Recognition. In Proceedings of the 2016 IEEE Conference on Computer Vision and Pattern Recognition (CVPR), Las Vegas, NV, USA, 27–30 June 2016; pp. 770–778. [Google Scholar] [CrossRef]
- Arthur, D.; Vassilvitskii, S. K-means++ the advantages of careful seeding. In Proceedings of the Eighteenth Annual ACM-SIAM Symposium on Discrete Algorithms, New Orleans, LA, USA, 7–9 January 2007; pp. 1027–1035. [Google Scholar]
- Lin, T.Y.; Dollár, P.; Girshick, R.; He, K.; Hariharan, B.; Belongie, S. Feature Pyramid Networks for Object Detection. In Proceedings of the 2017 IEEE Conference on Computer Vision and Pattern Recognition (CVPR), Honolulu, HI, USA, 21–26 July 2017; pp. 936–944. [Google Scholar] [CrossRef]
- Gong, Y.; Yu, X.; Ding, Y.; Peng, X.; Zhao, J.; Han, Z. Effective Fusion Factor in FPN for Tiny Object Detection. In Proceedings of the 2021 IEEE Winter Conference on Applications of Computer Vision (WACV), Waikoloa, HI, USA, 3–8 January 2021; pp. 1159–1167. [Google Scholar] [CrossRef]
- Liu, S.; Qi, L.; Qin, H.; Shi, J.; Jia, J. Path Aggregation Network for Instance Segmentation. In Proceedings of the 2018 IEEE/CVF Conference on Computer Vision and Pattern Recognition, Salt Lake City, UT, USA, 18–23 June 2018; pp. 8759–8768. [Google Scholar] [CrossRef]
- Zhong, Y.; Wang, J.; Peng, J.; Zhang, L. Anchor Box Optimization for Object Detection. In Proceedings of the 2020 IEEE Winter Conference on Applications of Computer Vision (WACV), Snowmass, CO, USA, 1–5 March 2020; pp. 1275–1283. [Google Scholar] [CrossRef]
- Shrivastava, A.; Gupta, A.; Girshick, R. Training Region-Based Object Detectors with Online Hard Example Mining. In Proceedings of the 2016 IEEE Conference on Computer Vision and Pattern Recognition (CVPR), Las Vegas, NV, USA, 27–30 June 2016; pp. 761–769. [Google Scholar] [CrossRef]
- Liu, Z.; Yuan, L.; Weng, L.; Yang, Y. A High Resolution Optical Satellite Image Dataset for Ship Recognition and Some New Baselines. In Proceedings of the 6th International Conference on Pattern Recognition Applications and Methods–ICPRAM, Porto, Portugal, 24–26 February 2017; pp. 324–331. [Google Scholar] [CrossRef]
- Ding, J.; Xue, N.; Xia, G.S.; Bai, X.; Yang, W.; Yang, M.Y.; Belongie, S.; Luo, J.; Datcu, M.; Pelillo, M.; et al. Object Detection in Aerial Images: A Large-Scale Benchmark and Challenges. IEEE Trans. Pattern Anal. Mach. Intell. 2022, 44, 7778–7796. [Google Scholar] [CrossRef] [PubMed]
- Zhou, Y.; Yang, X.; Zhang, G.; Wang, J.; Liu, Y.; Hou, L.; Jiang, X.; Liu, X.; Yan, J.; Lyu, C.; et al. MMRotate: A Rotated Object Detection Benchmark using PyTorch. In Proceedings of the 30th ACM International Conference on Multimedia, Lisboa, Portugal, 10–14 October 2022; pp. 7331–7334. [Google Scholar] [CrossRef]
- Everingham, M.; Van Gool, L.; Williams, C.K.I.; Winn, J.; Zisserman, A. The PASCAL Visual Object Classes Challenge 2007 (VOC2007) Results. Available online: http://host.robots.ox.ac.uk/pascal/VOC/voc2007/ (accessed on 8 June 2023).
- Padilla, R.; Netto, S.L.; Silva, E.A.B.d. A Survey on Performance Metrics for Object-Detection Algorithms. In Proceedings of the 2020 International Conference on Systems, Signals and Image Processing (IWSSIP), Niteroi, Brazil, 1–3 July 2020; pp. 237–242. [Google Scholar] [CrossRef]
- Lin, T.Y.; Goyal, P.; Girshick, R.; He, K.; Dollár, P. Focal Loss for Dense Object Detection. In Proceedings of the 2017 IEEE International Conference on Computer Vision (ICCV), Venice, Italy, 22–29 October 2017; pp. 2999–3007. [Google Scholar] [CrossRef]
- Yang, X.; Yang, X.; Yang, J.; Ming, Q.; Wang, W.; Tian, Q.; Yan, J. Learning High-Precision Bounding Box for Rotated Object Detection via Kullback-Leibler Divergence. In Proceedings of the Thirty-Fifth Conference on Neural Information Processing Systems (NeurIPS 2021), Virtual, 6–14 December 2021; Available online: https://proceedings.neurips.cc/paper/2021/hash/98f13708210194c475687be6106a3b84-Abstract.html (accessed on 8 June 2023).
- Yang, X.; Liu, Q.; Yan, J.; Li, A. R3Det: Refined Single-Stage Detector with Feature Refinement for Rotating Object. In Proceedings of the AAAI Conference on Artificial Intelligence, Virtual, 8–9 February 2021; pp. 3163–3171. [Google Scholar] [CrossRef]
- Sun, X.; Wang, P.; Yan, Z.; Xu, F.; Wang, R.; Diao, W.; Chen, J.; Li, J.; Feng, Y.; Xu, T.; et al. FAIR1M: A benchmark dataset for fine-grained object recognition in high-resolution remote sensing imagery. ISPRS J. Photogramm. Remote Sens. 2022, 184, 116–130. [Google Scholar] [CrossRef]
- Lyu, C.; Zhang, W.; Huang, H.; Zhou, Y.; Wang, Y.; Liu, Y.; Zhang, S.; Chen, K. RTMDet: An Empirical Study of Designing Real-Time Object Detectors. arXiv 2022, arXiv:abs/2212.07784. [Google Scholar]
- Zhang, Z.; Guo, W.; Zhu, S.; Yu, W. Toward Arbitrary-Oriented Ship Detection With Rotated Region Proposal and Discrimination Networks. IEEE Geosci. Remote Sens. Lett. 2018, 15, 1745–1749. [Google Scholar] [CrossRef]
- Liao, M.; Zhu, Z.; Shi, B.; Xia, G.S.; Bai, X. Rotation-Sensitive Regression for Oriented Scene Text Detection. In Proceedings of the 2018 IEEE/CVF Conference on Computer Vision and Pattern Recognition, Salt Lake City, UT, USA, 18–23 June 2018; pp. 5909–5918. [Google Scholar] [CrossRef]
- Xu, Y.; Fu, M.; Wang, Q.; Wang, Y.; Chen, K.; Xia, G.S.; Bai, X. Gliding Vertex on the Horizontal Bounding Box for Multi-Oriented Object Detection. IEEE Trans. Pattern Anal. Mach. Intell. 2021, 43, 1452–1459. [Google Scholar] [CrossRef]
- Yang, X.; Yan, J. Arbitrary-Oriented Object Detection with Circular Smooth Label. In Proceedings of the Computer Vision–ECCV 2020: 16th European Conference on Computer Vision, Glasgow, UK, 23–28 August 2020; pp. 677–694. [Google Scholar] [CrossRef]
- Azimi, S.M.; Vig, E.; Bahmanyar, R.; Körner, M.; Reinartz, P. Towards Multi-class Object Detection in Unconstrained Remote Sensing Imagery. In Proceedings of the Computer Vision–ACCV 2018: 14th Asian Conference on Computer Vision, Perth, Australia, 2–6 December 2018; pp. 150–165. [Google Scholar] [CrossRef]
- Zhang, G.; Lu, S.; Zhang, W. CAD-Net: A Context-Aware Detection Network for Objects in Remote Sensing Imagery. IEEE Trans. Geosci. Remote Sens. 2019, 57, 10015–10024. [Google Scholar] [CrossRef]
- Pan, X.; Ren, Y.; Sheng, K.; Dong, W.; Yuan, H.; Guo, X.; Ma, C.; Xu, C. Dynamic Refinement Network for Oriented and Densely Packed Object Detection. In Proceedings of the 2020 IEEE/CVF Conference on Computer Vision and Pattern Recognition (CVPR), Seattle, WA, USA, 13–19 June 2020; pp. 11204–11213. [Google Scholar] [CrossRef]
- Wang, J.; Yang, W.; Li, H.C.; Zhang, H.; Xia, G.S. Learning Center Probability Map for Detecting Objects in Aerial Images. IEEE Trans. Geosci. Remote Sens. 2021, 59, 4307–4323. [Google Scholar] [CrossRef]
- Yang, X.; Yang, J.; Yan, J.; Zhang, Y.; Zhang, T.; Guo, Z.; Sun, X.; Fu, K. SCRDet: Towards More Robust Detection for Small, Cluttered and Rotated Objects. In Proceedings of the 2019 IEEE/CVF International Conference on Computer Vision (ICCV), Seoul, Republic of Korea, 27 October–2 November 2019; pp. 8231–8240. [Google Scholar] [CrossRef]
- Wei, H.; Zhang, Y.; Chang, Z.; Li, H.; Wang, H.; Sun, X. Oriented objects as pairs of middle lines. ISPRS J. Photogramm. Remote Sens. 2020, 169, 268–279. [Google Scholar] [CrossRef]
- Yi, J.; Wu, P.; Liu, B.; Huang, Q.; Qu, H.; Metaxas, D.N. Oriented Object Detection in Aerial Images with Box Boundary-Aware Vectors. In Proceedings of the 2021 IEEE Winter Conference on Applications of Computer Vision (WACV), Waikoloa, HI, USA, 3–8 January 2021; pp. 2149–2158. [Google Scholar] [CrossRef]
- Yang, X.; Yan, J.; Yang, X.; Tang, J.; Liao, W.; He, T. SCRDet++: Detecting Small, Cluttered and Rotated Objects via Instance-Level Feature Denoising and Rotation Loss Smoothing. IEEE Trans. Pattern Anal. Mach. Intell. 2022, 45, 2384–2399. [Google Scholar] [CrossRef] [PubMed]
- Chen, K.; Pang, J.; Wang, J.; Xiong, Y.; Li, X.; Sun, S.; Feng, W.; Liu, Z.; Shi, J.; Ouyang, W.; et al. Hybrid Task Cascade for Instance Segmentation. In Proceedings of the 2019 IEEE/CVF Conference on Computer Vision and Pattern Recognition (CVPR), Long Beach, CA, USA, 15–20 June 2019; pp. 4969–4978. [Google Scholar] [CrossRef]
- Lang, S.; Ventola, F.G.; Kersting, K. DAFNe: A One-Stage Anchor-Free Deep Model for Oriented Object Detection. arXiv 2021, arXiv:abs/2109.06148. [Google Scholar]
- Li, C.; Xu, C.; Cui, Z.; Wang, D.; Jie, Z.; Zhang, T.; Yang, J. Learning Object-Wise Semantic Representation for Detection in Remote Sensing Imagery. In Proceedings of the IEEE Conference on Computer Vision and Pattern Recognition Workshops, CVPR Workshops 2019, Long Beach, CA, USA, 16–20 June 2019; pp. 20–27. Available online: http://openaccess.thecvf.com/content_CVPRW_2019/html/DOAI/Li_Learning_Object-Wise_Semantic_Representation_for_Detection_in_Remote_Sensing_Imagery_CVPRW_2019_paper.html (accessed on 8 June 2023).
- Tan, M.; Pang, R.; Le, Q.V. EfficientDet: Scalable and Efficient Object Detection. In Proceedings of the 2020 IEEE/CVF Conference on Computer Vision and Pattern Recognition (CVPR), Seattle, WA, USA, 13–19 June 2020; pp. 10778–10787. [Google Scholar] [CrossRef]
- Lin, T.Y.; Maire, M.; Belongie, S.; Hays, J.; Perona, P.; Ramanan, D.; Dollár, P.; Zitnick, C.L. Microsoft COCO: Common Objects in Context. In Proceedings of the Computer Vision–ECCV 2014: 13th European Conference on Computer Vision, Zurich, Switzerland, 6–12 September 2014; pp. 740–755. [Google Scholar] [CrossRef]
Disclaimer/Publisher’s Note: The statements, opinions and data contained in all publications are solely those of the individual author(s) and contributor(s) and not of MDPI and/or the editor(s). MDPI and/or the editor(s) disclaim responsibility for any injury to people or property resulting from any ideas, methods, instructions or products referred to in the content. |
© 2023 by the authors. Licensee MDPI, Basel, Switzerland. This article is an open access article distributed under the terms and conditions of the Creative Commons Attribution (CC BY) license (https://creativecommons.org/licenses/by/4.0/).