Abstract
To explore the feasibility of applying the GemDialogue color comparison charts to the color grading of blue iolite, the color of the charts was quantified by the integrating sphere handheld spectroscopy in this paper, and the screened data were classified into a total of 9 categories using the elbow rule and K-Means clustering analysis. Using Fisher’s discriminant to perform discriminant analysis on the 9 categories that have been classified, the discriminant function equation was established separately to verify the accuracy of this classification. Finally, the color parameters of iolite samples were substituted into the discriminant formula to obtain the color grade. By combining the classification results and visual observation, it is clear that applying the GemDialogue color charts to blue iolite color grading is feasible.
1. Introduction
Cordierite mineral is a common diagenetic mineral in amphibolite, granulite, and high-grade aluminite [1], with the ideal chemical formula (Mg, Fe)2[Al4Si5O18] (H2O, CO2). In regional metamorphic rocks, granulites, and gneisses, cordierite coexists with other magnesium facies, such as garnet, biotite, orthopyroxene, spinel, or hornblende. It also coexists with aluminum-containing minerals, such as sillimanite and corundum [2]. Cordierite is used as a gemstone, which is known as “iolite” in the gem and jewelry industry [3]. Gem-grade iolite is mainly produced in Sri Lanka, Madagascar, the United States, Tanzania, Namibia, etc. [4]. Iolite is rich in color, which can be colorless, yellowish white, green, brown, and gray, etc., while iolite with gem-grade quality is generally blue or bluish-purple [5]. According to previous studies, the intervalence charge transfer between Fe2+ on the octahedron and Fe3+ on the co-sided T11 tetrahedron leads to the color and pleochroism of iolite [6,7,8].
Color grading plays an important role in the quality evaluation of colored gemstones. In 1994, King et al. [9] proposed a color classification method for colored diamonds: a 6504 K fluorescent lamp was used as the evaluation light source and colored diamonds were placed in a standard lighting box for grading. This method has been widely used around the world since it was announced. Then, the color classification methods of pink diamond [10], blue diamond [11], yellow diamond [12], and colorless diamond [13] were introduced. Although the color classification of diamond is well established, the grading of other colored gems and jade remains a problem to be solved. In order to better ensure the accuracy of color grading of colored gemstones, the CIE1976 L*a*b* uniform color space system was introduced and played an important role in the color quantization research of gemology. It mainly involves jadeite [14], peridot [15,16], iolite [3], amethyst [17], citrine [18], chromic garnet [19,20,21,22], tourmaline [23,24], sapphire [25], chrysoberyl [26], cubic zirconia [27], blue amber [28], and diamond [29].
The GemDialogue color chart is widely used in the world for expressing and classifying the color of gemstones. As a color comparison tool for precious stones, GemDialogue color charts cover a wide range of colors and are easy to perform. Guo et al. [30] used the GemDialogue color chart to classify jade green into seven grades, which confirmed that it is effective and feasible to use the GemDialogue color chart to evaluate the quality grade of jade color. Han et al. [25] set the hue angle range of the GemDialogue color chart between 186–300°, including four hues of sapphire, aquamarine blue, cyan, blue, and blue purple, and established a sapphire color evaluation system. Blue iolite is close in color to sapphire, but has a narrower range of hue. Considering the physical characteristics of iolite, this paper removed the aquamarine blue and cyan tones, and added purple tones to simulate the color of iolite.
The principle of clustering is to group data within a set in such a way that the differences between groups are maximized and the differences within groups are minimized. Therefore, a clustering algorithm is often used to objectively and accurately describe the classification of gems ‘colors [31,32]. Liu et al. [33] compared the Affinity Propagation (AP) and K-Means clustering methods applied to the grading of gemstone colors; it is believed that K-Means is more conducive to the selection of centers that are more representative of the entire population when the sample size is large and concentrated. This algorithm is simple and fast, and is more suitable for samples with a large initial number. Therefore, this paper uses K-Means clustering analysis to classify the color data of the color charts.
Based on the colorimetric theory and color characteristics of blue iolite, this paper uses the GemDialogue color chart as a tool to evaluate the quality of blue iolite and quantify its color properties. According to the characteristics of the quantized color data, the classification and description of different color categories were carried out and finally applied to the color grading of blue iolite.
2. Materials and Methods
2.1. Materials
In this paper, three color charts related to blue and blue–purple are selected: B/Blue, P2B/moderate purplish BLUE, and B2P/moderate bluish PURPLE. In order to obtain more hues of iolite, color charts B and P2B are superimposed with B2P as combination color codes and then denoted as B3P* and B4P*. The color of natural iolite is not pure, and is usually with a gray, brown hue; therefore, the blackgray mask and brown mask are selected to simulate the color of different hues.
In order to verify the feasibility of the classification method, we collected 29 gem-quality oval faceted blue iolites from suppliers with a clear origin. The gemological properties of the iolites are summarized in Table 1.

Table 1.
Gemological properties of iolite samples.
2.2. Methods
Based on the CIE 1976 L*a*b* uniform color space, the color parameters of 5 color charts were measured using the integrating sphere handheld spectroscopy (X-Rite, Grand Rapids, MI, USA) against white background. Experiment conditions include reflection, excluding specular reflection; experimental light source, D65 (6500 K); 2° observer view; voltage, 220 V; measurement range, 400–700 nm. The final color data were averaged through three tests. The test order of the color charts is 100 to 10. The overlay mode of the color mask is in the order of first up and then down; the blackgray (transparent) and brown (transparent) color masks are superimposed one after another. Take color chart B as an example (Figure 1).
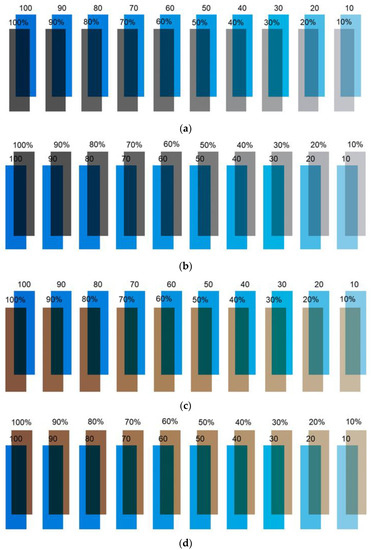
Figure 1.
Schematic diagram of color chart B overlaid color masks. (a) Overlay blackgray mask, color mask on top; (b) overlay blackgray cover, color cover below; (c) overlay brown mask, color mask on top; and (d) overlay brown color mask, color mask below.
3. Result and Discussion
3.1. Rules of Color Charts
The color parameters of the five color charts B, P2B, B2P, B3P*, B4P*, and their overlapping blackgray (transparent) and brown (transparent) color masks were tested under a D65 light source. A total of 7250 data were collected. The changes in lightness, L*, chroma, C*, and hue angle, h°, were observed to study the change pattern of the color charts and the effect of color masks on color.
Without superimposed masks, the range of the lightness, L*, of B, P2B, B2P, B3P*, and B4P* are, in order, L*B ∈ (43.51, 77.38), L*P2B ∈ (31.43, 81.33), L*B2P ∈ (34.1, 79.18), L*B3P* ∈ (20.48, 65.43), and L*B4P* ∈ (17.44, 69.18); the range of chroma, C*, are successively C*B ∈ (26.29, 66.58), C*P2B ∈ (15.76, 74.2), C*B2P ∈ (21.18, 103.2), C*B3P* ∈ (28.54, 93.61), and C*B4P* ∈ (21.93, 90.28); the range of hue angle, h°, are h°B ∈ (237, 266.4), h°P2B ∈ (258.6, 286.8), h°B2P ∈ (307, 312.9), h°B3P* ∈ (259.1, 302.5), and h°B4P* ∈ (285.6, 303.6), in order. With the color band value from 100 to 10, the lightness, L*, of the five color charts increased successively, the chroma, C*, decreased successively, and the hue angle, h°, showed an overall decreasing trend (Figure 2). Very few samples did not follow this pattern, which may be related to the stability of the instrument. As can be seen from the figure, there are many overlapping parts of lightness, L*, and chroma, C*, in the five color charts, but the difference in hue angle, h°, is obvious, which belongs to five different hue intervals, and the size relationship is: h°B2P > h°B4P* ≥ h°B3P* ≥ h°P2B ≥ h°B. The hue of B2P tends to be purple, the hue of B4P* lies in blue–purple, and the hue of B3P* partly lies in bluepurple and partly tends to blue. Color chart B and P2B are both located in blue, but the blue of B is lighter. Secondly, although the change trend of color parameters in each color chart is the same, the change speed is different, the chroma, C*, and hue angle, h°, are the most obvious.
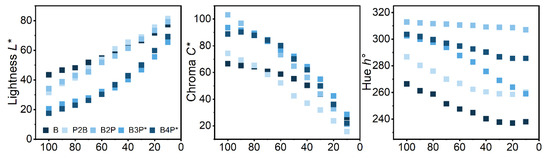
Figure 2.
The trend of L*, C*, and h° of five color charts.
3.1.1. The Influence of Color Mask on Lightness, L*
As shown in Figure 3, when the color mask is not superimposed, it is the first part. The data obtained by superimposing a blackgray mask above the color charts, superimposing a blackgray mask below, superimposing a brown mask above, and superimposing a brown mask below are part II to V, respectively. It can be clearly seen that the lightness, L*, is the highest when the color mask is not superimposed. After the color masks are superimposed, the lightness, L*, of the three color charts is reduced, but the degree is different. Through data comparison and analysis, the decrease of lightness, L*, after superposition of the blackgray mask is significantly higher than that of superposition of the brown mask, indicating that the blackgray mask has a greater impact on lightness, L*, than the brown mask. Secondly, the superposition method of the color mask also affects the change degree of the lightness, L*: both the blackgray mask and brown mask have a greater effect on the lightness, L*, when the mask is placed at the bottom than when the mask is placed at the top.
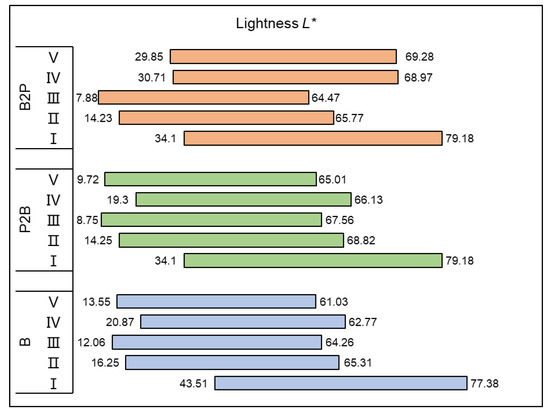
Figure 3.
The change of lightness, L*, after three color charts superimposed with different color masks.
3.1.2. The Influence of Color Mask on Chroma, C*
As shown in Figure 4, when the color mask is not superimposed, the chroma, C*, is the highest. After the color mask is superimposed, the chroma, C*, decreases as a whole, which is the same as the change rule of the lightness, L*. Overlaying different color masks or when the color mask overlay mode is different, the degree of change of chroma, C*, is also different. It is found that compared with the blackgray color mask, the overall change of the chroma, C*, is greater when the brown color mask is superimposed, indicating that the brown mask has a greater impact on the chroma, C*. Secondly, the influence of the color mask on the chroma, C*, is obviously greater than that of the color mask on the bottom, which is opposite to the law of the lightness, L*, and the lighter the color, the greater the influence of the color mask.
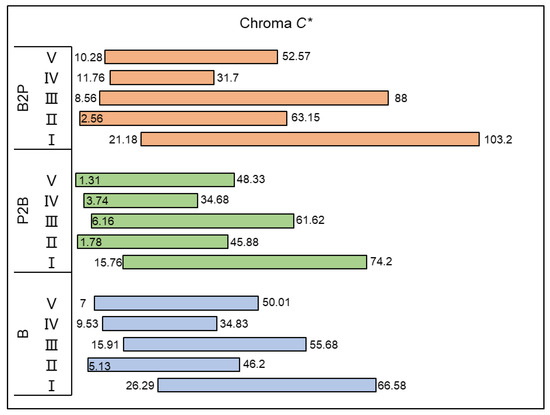
Figure 4.
The change of chroma, C*, after three color charts superimposed with different color masks.
3.1.3. The Influence of Color Mask on Hue Angle, h°
As shown in Figure 5, it is found that the overall effect of the superimposed blackgray color mask on the hue angle, h°, of the color standard is not significant, while the effect of the brown mask is obvious, especially for the color chart B2P. And it is observed that the superposition method of the color mask has little effect on the hue angle, h°, that is, whether it is the superposition method of the color mask is on or under the color charts, the range of the hue angle, h°, is not significantly different.
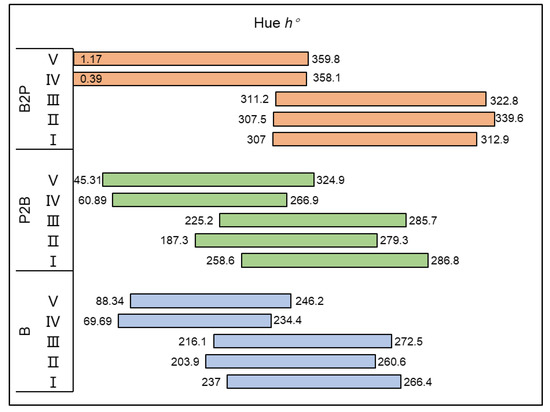
Figure 5.
The change of hue angle, h°, after three color charts superimposed with different color masks.
3.2. Color Grading of Color Charts
According to the color characteristics of the GemDialogue color charts and iolite, the range of the hue angle, h°, was determined to be between 240–310°, a total of 1930 data were selected. The selected data continuous are well, no obvious leap, and better cover the color range of blue iolite from low to high chroma.
This paper uses K-Means clustering analysis to classify the data. The K-Means algorithm seeks the best partitioning of data through iterative optimization steps and minimization of square error [34], the basic idea is to divide the data space randomly into k classes specified in advance, and then update the centroid of each class through iterative calculation, when the results of two adjacent iterations are basically the same, the algorithm converges [35]. The selection of K value in K-Means clustering is often based on subjective experience, which cannot determine whether it is the best clustering number. Therefore, the elbow rule was chosen in this paper to determine the best K value of data. The basic principle of elbow rule is to determine the optimal cluster number by calculating the sum of the squared errors (SSE) under different cluster numbers, when the number of clusters increases to a certain extent, SSE will sharply slow down, forming an elbow, the number of clusters corresponding to the elbow is the optimal K value [36]. According to the results of the elbow rule (Figure 6), data works best when divided into 6 categories.
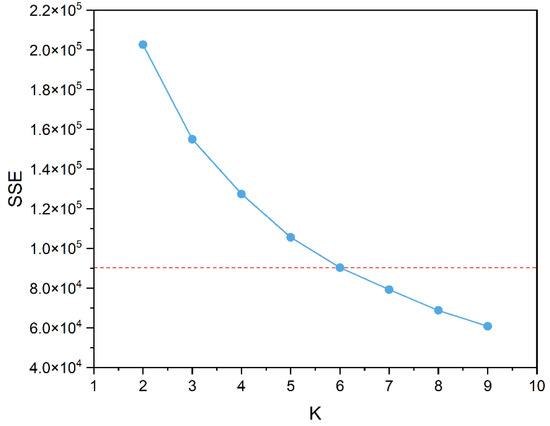
Figure 6.
The relationship between K and Sum of the Squared Errors (SSE).
Lightness, L*, chroma, C*, and hue angle, h°, were selected as variables. K-Means clustering analysis was used to divide the color data into 6 categories, and the clustering results were shown in Table 2.
Table 2.
K-Means cluster analysis results.
According to the one-way ANOVA of the three parameters of the 6 categories (Table 3), the P values of the three parameters were all less than the significance level of 0.05, indicating that the fast clustering analysis of the test data divided into 6 categories was basically successful and the clustering effect was relatively ideal.
Table 3.
Results of the one-way analysis.
According to the classification results, the hue angle, h°, of the first and fourth categories are similar, ranging from 280° to 310°, belonging to the range of bluepurple to purple hue. However, the lightness, L*, and chroma, C*, of the first category is much greater than the fourth category, which is blueviolet with a high lightness and medium chroma, some samples can reach light purple, with the best color in the 6 categories. While the fourth category gave the sample a bluepurple hue with a distinct blackgray tone due to a too low lightness and chroma. The chroma, C*, of the second category is the highest in the 6 categories, indicating that its blue is the strongest and purest. Although the lightness is low, it has little influence on the color appearance. The mean values of hue angle, h°, of the third and fifth categories are similar, both have a hue angle between 240°and 300°, belonging to the blue color. While the lightness, L*, and chroma, C*, of the two are different. The lightness, L*, of the third category is higher than that of the fifth category, but the chroma is the lowest among the 6 categories, so the color of the third category belongs to the grayblue with low saturation. Although the saturation of the fifth category is slightly higher than that of the third category, due to the low lightness, it shows dark blue with obvious blackgray tone. The 6th category has similar lightness and chroma, its color appearance is light blue to blue.
For more accurate classification of the blue color charts, K-Means clustering analysis is performed again on categories 1 and 6 that have large color differences. The clustering results are shown in Table 4.
Table 4.
K-Means cluster analysis results of categories 1 and 6.
Category 1 is further divided into three categories, whose color features are purple, light purple, and bluepurple, respectively. Category 6 is divided into two categories, with color characteristics of blue and light blue.
Based on the above analysis, the color characteristics and classification of 9 categories of color charts are summarized in Table 5.
Table 5.
Color grade and description of color charts.
3.3. Accuracy Verification of Classification Results
The discriminant function is established based on Fisher discriminant analysis of 9 categories. The application method is to substitute the color parameters L*, C*, h° of an unknown color grade into 9 discriminant formulas. The largest value of the function is the color classification corresponding to this color. The corresponding color grade of iolite can be known by comparing the color grade with the category table. The discriminant functions and classification accuracy of different categories are summarized in Table 6.
Table 6.
Fisher discriminant analysis results.
The overall accuracy of classification was 99.6%, only 8 of the 1930 data were inconsistent with the actual classification, indicating that the accuracy of discriminant analysis was ideal and the function of Fisher discriminant analysis can be applied to the classification of unknown samples after the clustering analysis of a large number of sample data.
3.4. Application and Feasibility Study
Twenty-nine elliptic faceted blue iolites were selected for color test with the integrating sphere handheld spectroscopy, and color parameters L*, a*, b*, C*, and h° were recorded. Due to the pleochroism of iolite, the table facet was selected as the color measurement surface in this paper. The color data were substituted into the discriminant functions of 9 categories, respectively, to obtain the category of each sample, and the results were shown in Table 7.
Table 7.
Color grading results of 29 iolites.
The 29 samples were divided into three categories and classified into four color levels, among which 1 sample belonged to light purple with high lightness and medium chroma, 11 samples belonged to bluepurple with high lightness and medium chroma, 2 samples belonged to grayblue with low chroma, and 15 samples belonged to bluepurple with black and gray tones. After observation, it was found that the classification results were consistent with the visual observation, and the color comparison between some samples and the cluster centers is shown in Figure 7.
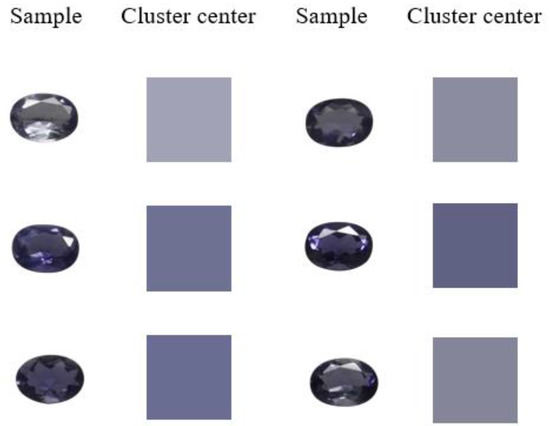
Figure 7.
Color contrast figure between sample and cluster center.
Although not all categories were covered due to the limited number of samples, the results proved that this method is still feasible and can provide a more objective and stable basis for color classification of blue iolite than the visual evaluation.
4. Conclusions
- (1)
- Different color masks and different superposition methods will have different effects on the color parameters of charts. The blackgray mask mainly affects the lightness, L*, while the brown mask mainly affects the chroma, C*, and the hue angle, h°.
- (2)
- The selected color data were divided into 9 categories by Elbow rule and K-Means clustering analysis. Fisher discriminant analysis was used to reverse verify the classification results, and the accuracy of color classification was 99.6%, which proved that the fast cluster analysis and discriminant analysis methods were reasonable and effective in gem color classification.
- (3)
- The color data of iolites was substituted into the discriminant to obtain the color level of the object. Combined with the classification results and naked eye observation, it is feasible to apply the GemDialogue color charts to the color grading of blue iolite.
Author Contributions
Conceptualization, X.L.; methodology, X.L. and Y.G.; validation, Y.G.; formal analysis, X.L.; investigation, X.L.; resources, X.L. and Y.G.; data curation, X.L.; writing—original draft preparation and editing, X.L.; supervision, Y.G.; project administration, Y.G. All authors have read and agreed to the published version of the manuscript.
Funding
This research received no external funding.
Institutional Review Board Statement
Not applicable.
Informed Consent Statement
Not applicable.
Data Availability Statement
Not applicable.
Acknowledgments
All of the experiments in this research were conducted in the laboratories of the Gemological Institute, China University of Geosciences, Beijing.
Conflicts of Interest
The authors declare no conflict of interest.
References
- Bertoldiab, C.; Proyerc, A.; Schonberga, D.; Behrensd, H.; Dachsb, E. Comprehensive chemical analyses of natural cordierites: Implications for exchange mechanisms. Lithos 2004, 78, 389–409. [Google Scholar] [CrossRef]
- Das, S.; Mohanty, J. Characteristics of Cordierite (Iolite) of Bandarguha-Orabahala Area, Kalahandi District, Odisha, India. J Geol. Geophys. 2017, 6, 1000294. [Google Scholar]
- Liu, X.; Guo, Y. Study on the Color-Influencing Factors of Blue Iolite. Minerals 2022, 12, 1356. [Google Scholar] [CrossRef]
- Yu, X. Colored Gemmology, 2nd ed.; Geological Publishing House: Beijing, China, 2016. [Google Scholar]
- Zhang, B. Systematic Gemmology, 2nd ed.; Geological Publishing House: Beijing, China, 1997. [Google Scholar]
- Faye, G.; Manning, P. The polarized optical absorption spectra of tourmaline, cordierite, chloritoid and vivianite: Ferrous ferric electronic interaction as a source of pleochroism. Am. Miner. 1968, 53, 1174–1201. [Google Scholar]
- Pollak, H. Charge transfer in cordierite. Phys. Status Solidi 1976, 74, K31–K34. [Google Scholar] [CrossRef]
- Parkin, K.; Loeffler, B.; Burns, R. Mfssbauer spectra of Kyanite, Aquamarine and Cordierite showing intervalence charge transfer. Phys. Chem. Miner. 1977, 1, 301–311. [Google Scholar] [CrossRef]
- King, J.; Moses, T.; Shigley, J.; Liu, Y. Color grading of colored diamonds in the GIA Gem Trade Laboratory. Gems Gemol. 1994, 30, 220–242. [Google Scholar] [CrossRef]
- King, J.; Shigley, J.; Guhin, S.; Gelb, T.; Hall, M. Characterization and grading of natural-color pink diamonds. Gems Gemol. 2002, 38, 128–147. [Google Scholar] [CrossRef]
- King, J.; Moses, T.; Shigley, J.; Welbourn, C.; Lawson, S.; Cooper, M. Characterizing natural-color type IIb blue diamonds. Gems Gemol. 1998, 34, 246–268. [Google Scholar] [CrossRef]
- King, J.; Shigley, J.; Gelb, T.; Guhin, S.; Hall, M.; Wang, W. Characterization and grading of natural-color yellow diamonds. Gems Gemol. 2005, 41, 88–115. [Google Scholar] [CrossRef]
- King, J.; Geurts, R.; Gilbertson, A.; Shigley, J. Color grading “d-to-z” diamonds at the gia laboratory. Gems Gemol. 2008, 44, 296–321. [Google Scholar] [CrossRef]
- Guo, Y.; Wang, H.; Li, X.; Dong, S. Metamerism appreciation of jadeite-jade green under the standard light sources D65, A and CWF. Acta Geol. Sin. 2016, 90, 2097–2103. [Google Scholar] [CrossRef]
- Tang, J.; Guo, Y. Color effect of light sources on peridot based on CIE1976 L*a*b* color system and round RGB diagram system. Color Res. Appl. 2019, 44, 1–9. [Google Scholar] [CrossRef]
- Tang, J.; Guo, Y.; Xu, C. Metameric effects on peridot by changing background color. J. Opt. Soc. Am. 2019, 36, 2030–2039. [Google Scholar] [CrossRef]
- Cheng, R.; Guo, Y. Study on the effect of heat treatment on amethyst color and the cause of coloration. Sci. Rep. 2020, 10, 14927. [Google Scholar] [CrossRef] [PubMed]
- Guo, Y.; Zhang, X.; Li, X.; Zhang, Y. Quantitative characterization appreciation of golden citrine golden by the irradiation of [FeO4]4−. Arab. J. Chem. 2018, 11, 918–923. [Google Scholar]
- Krzemnicki, M.; Hanni, H.; Reusser, E. Colour change garnets from Madagascar:Comparison of colorimetric with chemical data. J. Gemmol. 2001, 27, 395–408. [Google Scholar] [CrossRef]
- Schmetzer, K.; Bernhardt, H.; Bosshart, G.; Hainschwang, T. Colour-change garnets from Madagascar: Variation of chemical, spectroscopic and colorimetric properties. J. Gemmol. 2009, 31, 235–282. [Google Scholar] [CrossRef]
- Sun, Z.; Palke, A.; Renfro, N. Vanadium-and chromium-bearing pink pyrope garnet: Characterization and quantitative colorimetric analysis. Gems Gemol. 2016, 51, 348–369. [Google Scholar] [CrossRef]
- Sun, Z.Y.; Palke, A.C.; Renfro, N.; Breitzmann, H.; Hand, D.; Muyal, J. GN: Discovery of color-change chrome grossular garnets from Ethiopia. Gems Gemol. 2018, 54, 233–236. [Google Scholar]
- Liu, Y.; Shigley, J.; Halvorsen, A. Colour hue change of a gem tourmaline from the Umba Valley, Tanzania. J. Gemmol. 1999, 26, 386–396. [Google Scholar] [CrossRef]
- Guo, Y. Quality evaluation of tourmaline red based on uniform color space. Cluster Comput. 2017, 20, 3393–3408. [Google Scholar] [CrossRef]
- Han, J.; Guo, Y.; Liu, S. Environmental issues on color quality evaluation of blue sapphire based on gemdialoguetm color comparison charts. Ekoloji Derg. Ekoloji 2018, 27, 1365–1376. [Google Scholar]
- Liu, Y.; Shigley, J.; Fritsch, E.; Hemphill, S. The “alexandrite effect” in gemstones. Color Res. Appl. 1994, 19, 186–191. [Google Scholar] [CrossRef]
- Sun, Z.; Renfro, N.; Palke, A. Tri-color-change holmium-doped synthetic CZ. Gems Gemol. 2017, 53, 259–260. [Google Scholar]
- Liu, Y.; Shi, G.; Wang, S. Color phenomena of blue amber. Gems Gemol. 2014, 50, 134–140. [Google Scholar] [CrossRef]
- Liu, F.; Guo, Y.; Lv, S.; Chen, G. Application of the entropy method and color difference formula to the evaluation of round brilliant cut diamond scintillation. Mathematics 2020, 8, 1489. [Google Scholar] [CrossRef]
- Guo, Y.; Zong, X.; Qi, M. Feasibility study on color evaluation of jadeite based on GemDialogue color chip images. EURASIP J. Image Video Process. 2018, 2018, 95. [Google Scholar] [CrossRef]
- Jiang, Y.; Guo, Y.; Zhou, Y.; Li, X.; Liu, S. The Effects of Munsell Neutral Grey Backgrounds on the Colour of Chrysoprase and the Application of AP Clustering to Chrysoprase Colour Grading. Minerals 2021, 11, 1092. [Google Scholar] [CrossRef]
- Pan, X.; Guo, Y.; Liu, Z.; Zhang, Z.; Shi, Y. Application of cluster analysis and discriminant analysis in quality grading of jadeite red. J. Phys. Conf. Ser. 2019, 1324, 012101. [Google Scholar] [CrossRef]
- Liu, Z.; Guo, Y. The Effect of Munsell Neutral Value Scale on the Color of Yellow Jadeite and Comparison between AP and K-Means Clustering Color Grading Schemes. Crystals 2022, 12, 241. [Google Scholar] [CrossRef]
- Steinly, D. K-means clustering: A half-century synthesis. Br. J. Math. Stat. Psychol. 2006, 59, 1–34. [Google Scholar] [CrossRef]
- He, X.; He, F.; Xu, L. The determination of the optimal clustering number of K-means algorithm. J. Univ. Electron. Sci. Technol. China 2022, 51, 904–912. [Google Scholar]
- Zhong, Z.F.; Li, M.H.; Zhang, Y. Improvement of K-Means algorithm for adaptive K value in machine learning. Comput. Eng. Des. 2021, 42, 136–141. [Google Scholar]


Disclaimer/Publisher’s Note: The statements, opinions and data contained in all publications are solely those of the individual author(s) and contributor(s) and not of MDPI and/or the editor(s). MDPI and/or the editor(s) disclaim responsibility for any injury to people or property resulting from any ideas, methods, instructions or products referred to in the content. |
© 2023 by the authors. Licensee MDPI, Basel, Switzerland. This article is an open access article distributed under the terms and conditions of the Creative Commons Attribution (CC BY) license (https://creativecommons.org/licenses/by/4.0/).