Abstract
This paper presents an improved procedure for conducting diagnostics tests on corrosion in reinforced concrete structures. This method consists in drilling cylindrical concrete cores with fragments of secondary steel reinforcement (e.g., spacer bars, stirrups, binders) from the selected areas of the structure. Then, a three-electrode system is arranged on those cylindrical cores under laboratory conditions. The fragment of steel rebar with concrete is used as the working electrode. Using the counter electrode in the form of a patented conductive coating applied on the core side wall with painting techniques and the graphite reference electrode placed in an opening made in the core near the reinforcement was the novelty of this method. Following the procedure, the occurrence of minimum and maximum corrosion rates in concrete is simulated in the climate chamber after determining, on the basis of historical weather data, extreme combinations of temperature, and relative humidity for a given structure. This method was verified in the diagnostics testing of two large reinforced concrete tanks for fresh water, and cement storage silos.
1. Introduction
Reinforced concrete structures, during their service life, are subjected to natural progressive wear. In a typical non-aggressive environment, CO2 is the main risk with reinforced steel in concrete [1,2]. It leads to concrete carbonation over time, and the resultant drop in pH of pore solution below 11.0–11.5 [3,4] causes decomposition of the passive layer on the reinforcing steel. In more aggressive environments containing chlorides (e.g., in seaside facilities, bridges), reinforcing steel faces corrosion risk when the concentration limit of Cl− in concrete exceeds 0.4% by weight of cement in concrete [5,6]. The above most common causes of corrosion of steel reinforcement should be monitored or diagnosed in advance [7,8]. In present times, the field of construction monitoring has been intensively developed with the use of multi-probes containing sensors for concrete pH, chloride concentration, moisture content in concrete, oxygen concentration, and three-electrode systems for performing electrochemical polarization measurements [9,10,11,12]. These multi-probes are often coupled with a remote data transmission system to obtain images of corrosion conditions of the structure without the need for in-site inspections [13,14,15]. However, the above monitoring methods cannot be applied to existing concrete structures, which require “traditional” corrosion diagnostics, including three groups of testing.
The first group includes all methods for evaluating protective properties of concrete against steel. Concrete powder can be collected from different depths directly from the structure. However, concrete cores are usually drilled from the structure. In laboratory conditions, they are used to represent pore solution. For this purpose, the following methods can be employed: pressure extraction, vacuum extraction, or aqueous extraction from concrete powder can be prepared. In pore solutions [16,17] simulating properties of concrete cover at different depths, chloride content is usually determined and pH measurements are taken.
Measurements of corrosion potential and concrete resistivity can be classified into the second group of methods for corrosion diagnostics of concrete structures. Both those groups only provide the qualitative evaluation of corrosion risk for reinforcement in concrete. These methods can be used to evaluate the likelihood of corrosion on the basis of criteria recommended in the standards and literature. Results obtained from those tests can be presented in the form of clear colourful maps with contour lines [7,18,19].
The third, final, group of the most advanced methods of corrosion diagnostics includes polarization methods, which have been adapted from the electrochemical laboratories to complex conditions of the in-situ tests. The expert practice shows that the following three methods are effective for the in-situ tests: linear polarization resistance (LPR) [20,21], electrochemical impedance spectroscopy (EIS) [22,23], and galvanostatic pulse (GP) [24,25] methods. These methods are applied in a three-electrode arrangement, where steel rebar covered with concrete is used as the working electrode. Two other electrodes—reference and auxiliary—are placed in the measuring head on the concrete surface.
Two aspects of the polarization methods are arguable. At first, such tests only determine the momentary corrosion rate at a specific temperature of concrete and at its specific moisture content. It means that a measurement taken during wet summer provides corrosion rate which differs from the measurements taken during dry winter. Unfortunately, none of these measurements can be regarded as mean or reliable. The second aspect refers to the range of polarization current which determines the area of reinforcement polarization [26,27]. Knowing this area is significant for determining density of corrosion current in reinforcement. It should be underlined that transducers, that is, guard rings, have been used for many years. They are used to confine the propagation of polarization currents [28,29,30]. However, such results are disputable in case of polarization tests performed in the area of dense reinforcement, cross rebars and rebars going through a few layers. Drilling concrete cores with embedded rebar pieces from concrete structures seems to be more a better solution. The first proved tests of that type seem to be described in the paper [31]. The three-electrode system can be arranged under the laboratory conditions for cores drilled from the structure to perform polarization measurements by LPR, EIS, or GP methods which do not arise any interpretation doubts [32]. Additionally, the thermal and humidity conditions observed for the structures can be simulated [33]. In this way, the extremes, that is, the minimum and maximum densities of corrosion currents, which can occur during operation of the tested structure, can be determined.
This paper presents the application possibilities of the diagnostics method based on cores drilled from the structure and improved by the authors, using the examples of reinforced concrete tanks for fresh water and cement storage silos. The practical application of this method is preceded by descriptions of theoretical foundations of observed physical and chemical phenomena, and by detailed technical information on the employed measuring systems.
2. Methodology for Measuring the Rate of Corrosion Reinforcement in Cores Drilled from The Structure
2.1. Measuring Corrosion Rate by Electrochemical Methods
Corrosion of the rebar occurs on the contact surface area with concrete. Using a very simplified description, there is cross-section decrement in the rebar circumference over time measured as corrosion rate CR defined as the decrement of the rebar cross-section over . Because the cross-section decrement is equal to mass decrement on the contact surface area with metal solution having density , corrosion rate can be expressed in two following ways
However, it is very difficult to measure the decrement of the rebar cross-section in concrete (and impossible for mass decrement ) because such measurements require the rebars uncovered from the concrete cover, and the measurable values are obtained only for a long-term and advanced corrosion of reinforcement. Hence, other methods are necessary, particularly the methods applicable for very small corrosion rates. Such methods, based on the electrochemical nature of the corrosion process of steel, in which the anodic reaction of iron dissolution (2) is accompanied by the reaction of oxygen depolarization (3), have been used in electrochemical laboratories for nearly 100 years and are commonly known as polarization methods.
The basis is the determination of density of corrosion current , which clearly defines corrosion rate because following Faraday’s law intensity of corrosion current is proportional to the decrement of metal mass
In this equation is molar mass for iron, —reaction time, —active surface of the electrode, —charge number of reaction (2), and —Faraday’s constant. Determination of the mass decrement Δm by electrochemical methods is used to find corrosion rate CR in the function of density of corrosion current from the following equation
The reaction (2) in the steady state is characterized by potential calculated from the Nernst equation and the exchange current . Similarly, the reaction (3) in the steady state is characterized by potential and the exchange current . Because both reactions take place on the same electrode, potential of corroding steel takes the intermediate value of the mixed potential specified by the corrosion potential corresponding to the common value of current density . A difference between the potential and the potential is specified as the overpotential of the anodic reaction . The difference between and is correspondingly specified as the overpotential of the cathodic reaction . Taking the activation nature of the corrosion process which means that corrosion rate depends on the unrestricted process of charge transfer, and is not controlled by the transport of reagents or by the medium resistance, then the relationship between density of anodic current and the overpotential of the anodic reaction is given by the Equation (6), and similarly the relationship between density of cathodic current and the overpotential of the cathodic reaction is expressed by the Equation (7)—cf. [34].
where is temperature, is gas constant, and and are transfer coefficients for anodic and cathodic reactions. The above relationships for current density on logarithmic scale are shown in the form of red straight lines (Figure 1a), at the intersection of which the values and can be read. Current density on arithmetic scale (Figure 1b) shows that densities of anodic and cathodic current at the corrosion potential are equalized to the absolute value. Consequently, the resultant current density is zero.
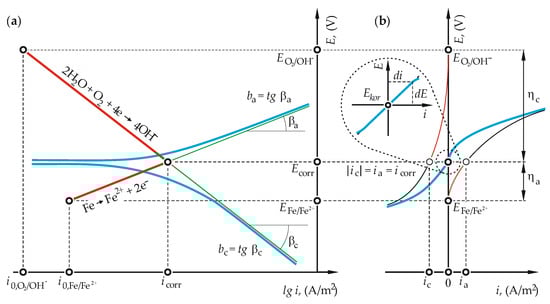
Figure 1.
The mechanism of development of corrosion potential on iron surface: (a) E–i diagram on logarithmic scale; and (b) E–i diagram on arithmetic scale—description and notes in the text.
2.2. Specification for Development of the Three-Electrode System for Concrete Cores
The red lines in Figure 1 show the natural way of the formation of the resultant potential due to current flow through the electrode, which was induced by the difference in potentials (Evans diagrams). At the resultant current equal to zero, components of current density cannot be measured in a direct way, e.g., using the ammeter. Only the values can be measured with voltage meter of high internal resistance as a difference in potentials on poles of the open cell. Such a measurement is taken using the additional reference electrode of known and constant potential.
External polarization current should be applied to the working electrode and third auxiliary electrode to determine the searched value . New induced overpotentials of the reactions (2) and (3) maintain the relationships with relevant densities of current in accordance with the expressions (6) and (7) and are used to record the curve illustrated in blue in Figure 1.
The system of three electrodes in the laboratory conditions, that is, the working electrode 1 (metal), the reference electrode 2 and the auxiliary electrode 3 connected to the potentiostat 4 is placed in the electrochemical cell 5 presented in Figure 2a. The construction and shape of the electrodes significantly reduce measuring errors which occur during polarization measurements, mainly by minimizing the distance between the working electrode 1 and the reference electrode 2 usually by using Luggin capillary 6. Moreover, the employed working electrode 1 is small and the auxiliary electrode 3 is much bigger. Also, the constant temperature is kept due to water jacket 7 connected to the thermostat.
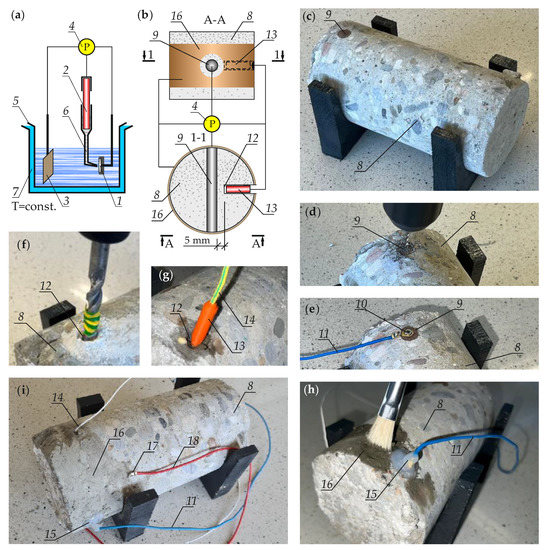
Figure 2.
The three-electrode system used in the polarization tests: (a) the electrochemical cell used in the laboratory; (b) the system formed on the drilled core with a rebar fragment; (c) core drilled from the structure; (d) drilling an opening in the rebar to connect the conductor; (e) connecting the conductor to the rebar using a plug; (f) drilling an opening in concrete for the reference electrode; (g) the reference electrode before its placing in the opening; (h) application of conductive coating which is used as the auxiliary electrode; and (i) the ready specimen after toluene evaporation and before putting it into the climate chamber, 1—working electrode in the electrochemical cell, 2—reference electrode in the electrochemical cell, 3—auxiliary electrode in the electrochemical cell, 4—potentiostat, 5—electrochemical cell, 6—Luggin capillary, 7—water jacket, 8—concrete core drilled from the structure, 9—a fragment of rebar used as the working electrode, 10—connection plug of the working electrode, 11—connection wire of the working electrode, 12—opening in concrete for the reference electrode, 13—reference electrode in concrete core, 14—connection wire of the reference electrode, 15—epoxy grouting compound to protect the rebar face against corrosion, 16—conductive coating used as the auxiliary electrode, 17—connector of the auxiliary electrode, 18—connection wire of the auxiliary electrode.
Creating the measuring system, similar to the electrochemical cell, for polarization tests for reinforced concrete structure is an extremely difficult task. Drilling from the structure cores 8 with a fragment of the rebar 9, which are used as the working electrode (Figure 2b,c) is considered as the solution for adapting the tests to the laboratory conditions. The new solution proposed in this paper consists in introducing permanently two other electrodes of the three-electrode system into the drilled core. The working electrode is connected to the potentiostat 4 by making an opening in the rebar face (Figure 2d), into which the plug 10 with the connection wire 11 (Figure 2e) is introduced. Then, an opening is made in concrete 12 whose bottom should be as close to the rebar as possible (ca. 5 mm from the rebar side surface—Figure 2f). The diameter of such an opening should be relatively small to prevent cracking of concrete cover while making such an opening. The reference electrode 13 and the connection wire 14 are placed in the opening 12 (Figure 2g), and the electrode is placed in this opening on cement grout. The traditional silver chloride or copper-sulphate electrode can be used as the reference electrode. However, the small size of the electrode induces the use of solid electrodes, e.g., graphite [35], Cl−/AgCl,Ag [36,37], MnO2 [38,39,40] or NiFe2O4 [41,42,43]. Application of the electrode from spectrally clean graphite in the housing from ABS material is illustrated in Figure 2. Both face areas of the rebar with the plug 10 were coated with epoxy grouting compound 15 to protect steel against surface and crevice corrosion during long-term testing (Figure 2h). Then, following the original methodology the auxiliary electrode was prepared using the painting technique, that is, covering side surfaces of the core with a silver-powder coating 16, excluding the rebar face (Figure 2h). The coating material was prepared by adding one portion of polystyrene granules to two portions of toluene, which were then stirred until complete dissolution of the granules. Then, four portions of silver powder with particle size not greater than 60 μm were added to the mixture, and components were stirred until uniform mass. To connect the coating to the potentiostat, the connector 17 with the connection wire 18 were glued to concrete surface, and the coating was applied on the metallic surface of connector 17 by the painting technique—Figure 2i. This figure also presents the ready specimen after toluene evaporation from the coating, prior to its placing in the climate chamber.
2.3. Methodology of Measuring Corrosion Rate in the Reinforcement of Cores in the Climate Chamber
Reinforced concrete structures during their service life are exposed to variable thermal and humidity conditions which have a fundamental impact on the course and development of the corrosion process [44,45]. Thus, measurements of corrosion rates should represent the variable values of humidity and temperature of the structure surrounding. As it has been already noted temperature was strictly monitored during the polarization measurements of corrosion rate of metal in the electrochemical cell in the laboratory conditions (cf. Figure 2a). For the above presented core specimens, it was insufficient to monitor only temperature because the effect of moisture content of concrete was also very important [46,47,48,49,50,51,52,53,54]. Prior to the tests, the extreme temperatures, at which the structure 1 is used, and the corresponding extreme values of relative humidity should be analysed (Figure 3a). This analysis of potential temperature values should exclude the values below 0 °C, at which corrosion process are stopped. Usually, two pairs of values are set: and which are the most conductive to corrosion development, and and which cause the slowest development of these processes (Figure 3b). Those values could be determined on the basis of historical reports covering several years and provided by the weather stations close to the tested facility. Additionally, these estimations could use the standards for heating systems in buildings or the standards concerning temperature impact on constructions. For the industrial facilities with unusual working conditions, the extreme values of temperature and relative humidity or temperature of water, into which the specimen was immersed, should be specified individually.
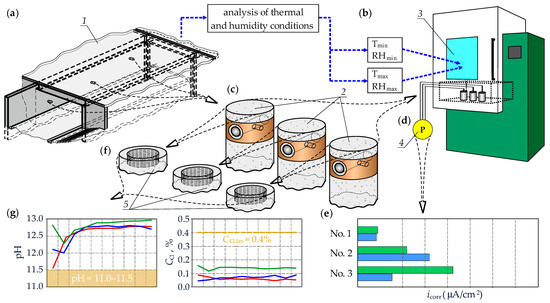
Figure 3.
Methodology of measuring corrosion rate of reinforcement in drilled concrete cores by simulating thermal and humidity conditions in the climate chamber: (a) drilling cores for corrosion tests and analysis of thermal and humidity conditions for the structure; (b) determination of extreme temperature and relative humidity values taken for corrosion testing of core specimens; (c) drilled cores equipped with three solid electrodes; (d) polarization measurements on the specimens in the climate chamber using the potentiostat; (e) values obtained in the climate chamber for extreme thermal and humidity conditions; (f) grinding layers of concrete cover; (g) profiles of chloride ion concentrations and concrete pH; 1—the tested structure, 2—specimens of concrete cores with three fixed electrodes, 3—climate chamber, 4—potentiostat, 5—concrete cover subjected to grinding by layers.
After drilling concrete cores 2 from the structures 1, they were equipped with three solid electrodes (Figure 3c). Then, after pre drying, the cores were place in the climate chamber 3 where at first the conditions with the lowest temperature and relative humidity were specified. Storage time of the specimens was not constant, but control measurements taken during next three days for concrete impedance between the working electrode and the auxiliary electrode at 1 kHz with a difference not greater than 0.1 kΩ meant that such conditions could be considered as steady. Then, corrosion rate was measured using the potentiostat 4 with cores in the climate chamber 3 (Figure 3d). This resulted in determining the minimum density of corrosion current (Figure 3e). After taking those measurements, the temperature and relative humidity in the climate chamber were increased until conditions in concrete were considered as steady which was evaluated by the above impedance measurement. Corrosion rate measured after that time provided the maximum density of corrosion rate (Figure 3e). When the electrochemical tests were completed, the undamaged concrete cover 5 was ready for grinding by layers (Figure 3f). The obtained powder was subjected to chemical tests to determine profiles of chloride concentrations and distributions of pH values (Figure 3g).
3. Validation of the Developed Methodology in Testing Reinforced Concrete Structures without Clear Signs of Corrosion Degradation
3.1. Description of the Tested Structure and Its Condition
Tests for verifying the developed methodology were conducted on ground-embedded reinforced concrete tanks for fresh water. The tanks were made in the 1990s in the west of Poland. This technological facility divided into two parts (marked as T1 and T2) was composed of four isolated rectangular tanks with dimensions of 36 × 24 m (Figure 4). Overall dimensions of the structure were 72 × 48 m. The tanks were founded on the reinforced concrete slab with a thickness of 120 cm. The thickness of perimeter walls was 45 cm, and of the internal walls was 40 cm. Floor slabs of the tanks were supported by intermediate elements, that is, reinforced concrete frames with beams with cross-section of 90 × 45 cm, monolithically connected to columns with cross-section of 45 × 45 cm. The reinforced concrete floor slab with a thickness of 25 cm was loaded with a 20-cm layer of sand and a 70-cm layer of topsoil.
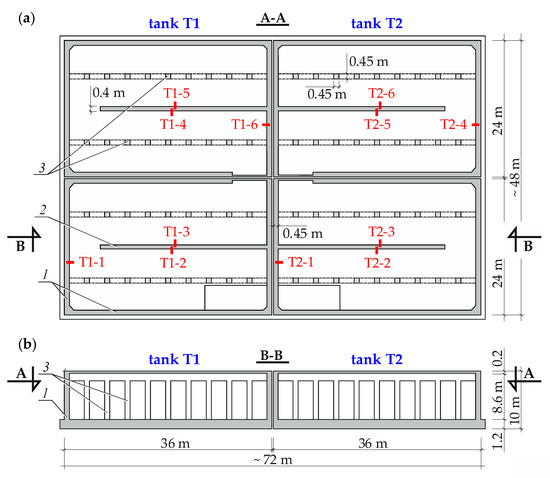
Figure 4.
The tested structure of the rectangular reinforced concrete tanks for fresh water; (a) cross-section A-A; and (b) longitudinal section B-B; 1—perimeter walls, 2—internal walls, 3—columns; symbols T1-1–T1-6 and T2-1–T2-6 show places of drilling cylindrical concrete cores with embedded reinforcement for corrosion tests.
Conditions of the tanks were regularly inspected following the current regulations. After one inspection, the facility administrator obtained worrying information on white discoloration on internal sides of the tank walls, and serious wear of protective coats on concrete (Figure 5). Decision on immediate shut-down of the tanks was considered due to hazard related to corrosion process of reinforced concrete. However, due to technological aspects such actions were not possible for both tanks, and preparation and repair works were expensive and time-consuming. Therefore, the facility administrator made a decision to precede the scheduled repair works by the construction expertise. This expertise was to be the verification developed from specialised tests, the opinion contained in conclusion from the technical inspection, based on the visual inspection of the facility.
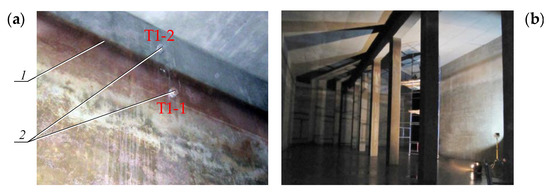
Figure 5.
Photos from the inside of tested tanks for fresh water: (a) a fragment of the internal wall and floor slab of the tank: 1—smudge of water in the tank, 2—cylindrical concrete cores drilled below and above the line 1 that indicates water level in the tank; and (b) perimeter and internal walls, columns and beam from the reinforced concrete frame that supports the floor slab of the tank.
This construction expertise was oriented to the evaluation of corrosion risk to reinforced concrete structural system of the tanks. The corrosion tests were conducted on concrete cores with embedded rebar pieces drilled from concrete structures. Places of core drilling from the wall tanks are shown in Figure 4a.
3.2. Measurements of Reinforcement Corrosion Using the Method of Linear Polarization Resistance (LPR)
The three-electrode system was arranged on the drilled cylindrical cores as specified in the procedure described in Section 2.2 to take polarization measurements of corrosion rate of reinforcement. A fragment or fragments of steel rebars were used as the working electrode, the auxiliary electrode was the conductive coating, and the reference electrode was the graphite rod. All three electrodes were connected to the potentiostat Gamry Reference 600 (cf. Figure 2).
Following the testing methodology presented in Section 2.3, which includes the use of laboratory-simulated effects of temperature and relative humidity of the tested structure, two pairs of boundary parameters and were determined. It was determined that temperature = 30 °C and relative humidity = 99% increased the rate of corrosion in reinforcing steel in concrete without the direct contact with water in the tank. On the other hand, average water temperature = 7 °C and full immersion of cores in water collected from the tested tanks were regarded as characteristic parameters for concrete zone with the permanent contact with water. Results from the LPR method in the form of four sets of polarization curves are illustrated in Figure 6. Two sets of polarization curves presented in one row (Figure 6a,b) refer to the tank T1, while the curves shown in the second row (Figure 6c,d) refer to the tank T2. For clear comparison diagrams in the left column (Figure 6a,c) were obtained from the reinforcement of cylindrical cores immersed in water at temperature = 7 °C, while those in the right column (Figure 6b,d) were obtained at the climate chamber with the determined air temperature = 30 °C and relative humidity = 99%.
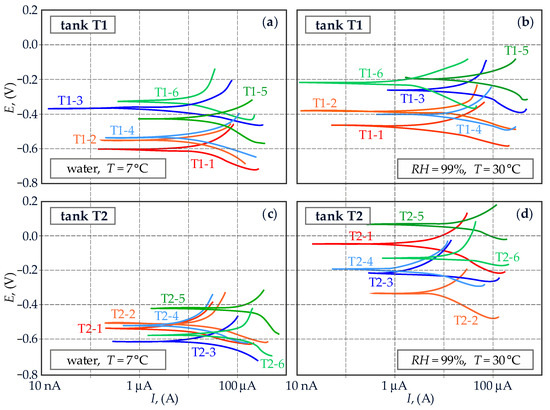
Figure 6.
Polarization curves obtained from the method linear polarization resistance (LPR) conducted on cylindrical concrete cores with embedded fragments of steel rebars drilled from reinforced concrete structures of tanks for fresh water: (a) results for the tank T1—tests in water at temperature = 7 °C; (b) results for the tank T1—tests at air temperature = 30 °C and relative humidity = 99%; (c) results for the tank T2—tests in water at temperature = 7 °C; and (d) results for the tank T2—tests at air temperature = 30 °C and relative humidity = 99%.
3.3. Testing Protective Properties of Concrete against Reinforcing Steel
Continuing the methodology (Section 2.3), when simulation of the effects of temperature and moisture content in concrete on the corrosion rate was completed, crushed concrete was collected from the cover of the core reinforcement for further tests. The Profile Grinding Kit was used to obtain concrete powder from ten 4-mm layers of cover of the rebar. Pore solution was prepared for each grinding layer of the cover by adding distilled water to concrete powder in a 1:1 weight ratio. The mixture of crushed concrete and water was filtered off through filter paper after about 24 h, including repetitive stirring. Chlorides content and pH were determined in such prepared aqueous solutions that simulated chemical properties of liquid from concrete pores. The results from chemical analyses are presented in the form of diagrams in Figure 7. For clearer comparison the diagrams in the left column (Figure 7a,c,e) refer to cores drilled from the tank T1, while the diagrams in the right column (Figure 7b,d,f) refer to the tank T2.
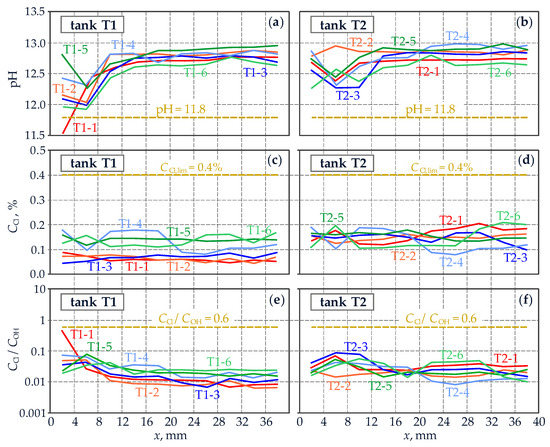
Figure 7.
Test results for cores drilled from the tanks—protective properties of pore solution against reinforcing steel: (a,b) distribution of pH values in the direction x of concrete cover thickness for rebars in the tanks T1 and T2; (c,d) profiles of chloride concentrations in the direction x of concrete cover thickness for rebars in the tanks T1 and T2; and (e,f) distributions in the direction x of concrete cover thickness, values of concentration ratios of chloride and hydroxide ions—the Hausman criterion.
4. Validation of the Developed Methodology in Testing Reinforced Concrete Structures with Clear Signs of Corrosion Degradation
4.1. Description of the Tested Structure and Its Condition
The tests for verifying the developed methodology were also conducted o reinforced concrete silos for cement storage, made in the 1960s in the west of Poland. The silos were performed in the shape of cylinders in the slipform construction technique. The structure height measured from the base of circular foundation in the form of a slab with a thickness of 250 cm was 49 m (Figure 8). The inside diameter of the reinforced concrete shell with a thickness of 40 cm was 18.2 m. Covering of the silos was made from a circular reinforced concrete slab with a thickness of 15 cm, based on steel I-section profiles. Steep downslopes were in the bottom part of the structure, and the technical gallery for providing walkways between the adjacent facilities belonging to the same functional group.
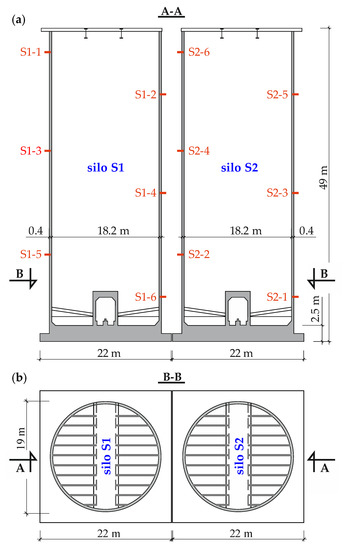
Figure 8.
The tested structure of cylindrical reinforced concrete silos for cement: (a) cross-section A-A; and (b) longitudinal section B-B; symbols S1-1–S1-6 and S2-1–S2-6 show places of drilling cylindrical concrete cores with embedded reinforcement for corrosion tests.
Conditions of the silos monitored during the periodical inspections raised growing year-by-year concerns of the facility administrator. The alarming symptoms of very serious corrosion processes were observed (Figure 9). Uncovered corroded rebars were very visible from the outer part of the reinforced concrete shell. Moreover, there was no concrete cover on very long outside fragments of the silos because poor-quality concrete was mechanically ground over several dozen years by adding cement.
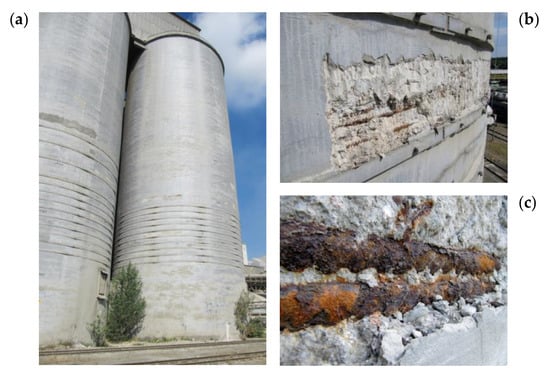
Figure 9.
The tested structure of cylindrical silos for cement: (a) the outer shell surface of the silos; (b) corroded fragment of the perimeter wall with locally uncovered corroded reinforcement; and (c) very corroded steel rebars without concrete cover, directly exposed to atmospheric conditions.
Finally, the facility administrator decided to omission the complex construction opinion to obtain the precise information for further safe use of the silos. The tests within the construction opinion included assessment of mechanical properties of concrete and reinforcing steel, and corrosion measurements. The metallographic specified in Section 2.3, based on cylindrical concrete cores drilled from the structure with secondary rebars, was applied as part of the corrosion tests. Places of core drilling from the reinforced concrete shells of the silos are shown in Figure 8a. In a few cases the drilled cores were not dense structures, and rebar fragments were separated from the concrete cover. Polarization tests on corrosion rate were not conducted for these damaged cores. However, vertical crack in concrete areas found in the perimeter walls of the silos indicated the risk of failure or structural collapse. The above information was taken into account in the computational analysis for safe use of the facility (which is not discussed in this paper).
4.2. Measurements of Reinforcement Corrosion Using the Method of Linear Polarization Resistance (LPR)
Tests on the corrosion rate of reinforcement in drilled concrete cores were performed using the method of linear polarization resistance. The three-electrode measuring system on the cores was similar to the one used for testing the tanks for fresh water (cf. Section 3.2). To obtain the extreme rates of corrosion current, two critical pairs of parameters were determined. For that purpose, historical data were used concerning changes in temperature and relative humidity recorded near the facility for three years. The temperature = 30 °C and relative humidity = 95% were regarded as parameters favourable for corrosion, whereas the temperature = 10 °C and relative humidity = 40% were considered to be unfavourable. To have the total control over the stability of thermal and humidity conditions, the polarization measurements were taken in the climate chamber. Similar to the tests on reinforced concrete tanks, distributions of polarization curves are shown in four groups in Figure 10. In the top row (Figure 10a,b), there are the curves obtained for the cores drilled from the silo S1, and the curves for the silo S2 are presented in the bottom row. To facilitate the comparative assessment between the silos, the set of polarization curves in the left column (Figure 10a,c) characterized the unfavourable thermal and humidity conditions for corrosion, whereas the curves in the right column (Figure 10b,d) represented conditions for developing corrosion.
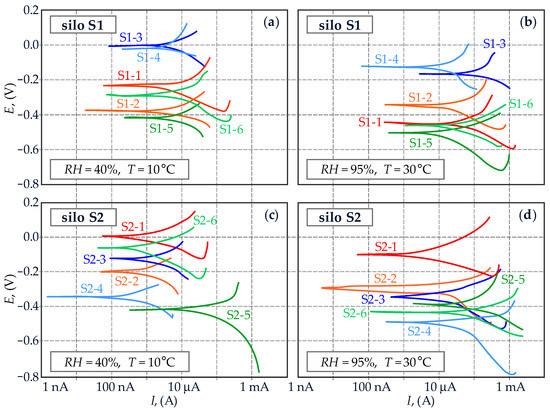
Figure 10.
Polarization curves obtained with the method of the linear polarization curve (LPR) performed on cylindrical concrete cores with fragments of steel rebars, drilled from the structure of reinforced concrete silos for cement storage: (a) results for the silo S1—tests at air temperature = 10 °C and relative humidity = 40%; (b) results for the silo S1—tests at air temperature = 30 °C and relative humidity = 95%; (c) results for the silo S2—tests at air temperature = 10 °C and relative humidity = 40%; and (d) results for the silo S2—tests at air temperature = 30 °C and relative humidity = 95%.
4.3. Testing Protective Properties of Concrete against Reinforcing Steel
Following the developed methodology on the cores drilled from the structure, the tests on protective properties of cover concrete against steel rebars were performed after completing the polarization measurements. Similar to the reinforced concrete tanks, after collecting power concrete from layers of the cover, the mixture was prepared from this concrete powder to simulate liquid found in concrete pores. Chloride concentration and pH were determined in pore solutions representing ten 4-mm layers. The test results obtained for 12 cores are presented in Figure 11 as the distribution of chloride concentrations and pH values in the direction to the thickness of reinforcement cover.
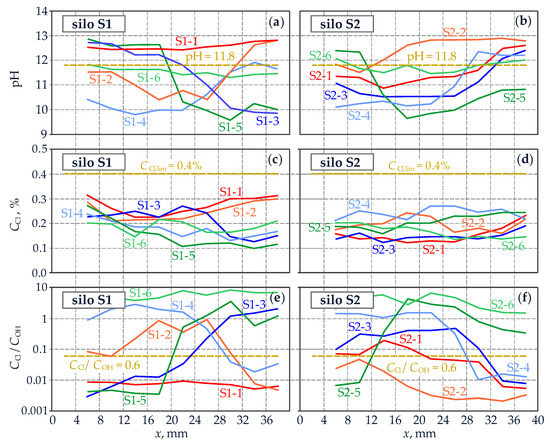
Figure 11.
Test results for cores drilled from the silos—protective properties of pore solution against reinforcing steel: (a,b) distribution of pH values in the direction x of concrete cover thickness for bars in the silos S1 and S2; (c,d) profiles of chloride concentrations in the direction x of concrete cover thickness for bars in the silos S1 and S2; and (e,f) distributions in the direction x of concrete cover thickness, values of concentration ratios of chloride and hydroxide ions—the Hausman criterion.
5. Discussion
5.1. Comparative Analysis of Test Results for Two Different Structures with Reference to the Applied Diagnostics Method
As expected the values of corrosion and relative humidity affecting corrosion in the surrounding of the tested structures and determined from the historical weather data resulted in the variation of shapes of obtained polarization curves (Figure 6 and Figure 10). For the curves obtained for cores drilled from the tanks shown in Figure 6, there was a clear shift of all the curves towards positive values of potential at temperature = 30 °C and relative humidity = 99%, which was related to monitoring the corrosion process through the reaction of oxygen depolarization. Total immersion in water limited oxygen and consequently reduced the rate of cathodic reaction. Hence, corrosion potentials approximated to potential of the iron electrode. However, no clear shift of the curves towards any (greater or smaller) corrosion current densities was observed at changed conditions in the chamber. But in the cores drilled from the tank T2—the tests in water—the curves tend to shift towards greater densities of corrosion current, while those drilled from the tank T1 were usually maintained in the same zone. Densities of corrosion current were determined for each polarization curve shown in Figure 6. Generally, two methods can be employed for this purpose. The first method consisted in extrapolating straight anodic and cathodic sections, and then determining the searched density of corrosion current at the intersection (cf. Figure 1a). The second method of linear polarization resistance (LPR) to determine densities of corrosion current is discussed in this paper [55]. This method included the occurrence—on the arithmetic scale of current densities—of the proportional ratio between corrosion rate and the slope of the polarization curve (cf. Figure 1b). This relationship (8) is referred to as polarization resistance
which is reversely proportional to corrosion density
Parameters and in the Equation (9) are constants of anodic and cathodic reactions, respectively (cf. Figure 1a). The detailed results from the analysis with the calculated densities for corrosion current are shown in Table A1 and Table A2 of the Appendix A. It should be emphasized that the value of polarized area of the reinforcement taken in the equations, each time was precisely determined after crushing core concrete in the testing machine and removing fragments of the tested rebars. For an easier comparative evaluation of the obtained test results, corrosion current densities , based on values from Table A1 and Table A2, are presented in Figure 12 in the form of horizontal bar graphs. Distribution of the values was divided into two parts characteristic for each of the two tested tanks. Moreover, the values obtained at the temperature = 30 °C and maximum relative humidity = 99% are in green, while the values obtained for concrete cores in contact with water at the temperature of 7 °C are in blue.
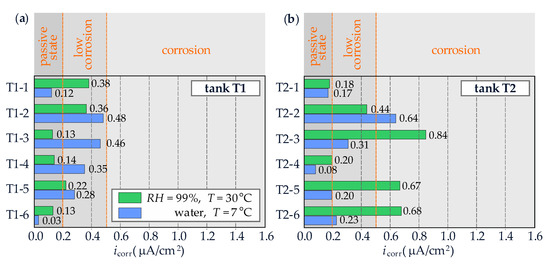
Figure 12.
Distribution of corrosion current densities presented as horizontal bar graphs, obtained for reinforcement of cylindrical concrete cores drilled from reinforced concrete tanks for fresh water: (a) results for the tank T1; and (b) results for the tank T2; blue bars represent the tests in water with a temperature = 7 °C; green bars represent the tests at the air temperature = 30 °C and relative humidity = 99%; information in orange above the graphs show corrosion risk for reinforcement in concrete of the tested cores.
The analysis of these results does not give a clear answer as to which of these two sets of extreme temperature and relative humidity intensify the corrosion process of steel in concrete. In the tank T1, the reinforcement covered with concrete that is contact with water having a temperature of 7 °C can be regarded as the most prone to corrosion, while in tank T2, strongly damp hot air ( = 30 °C, = 99%) was the source of intensified corrosion processes of the reinforcement. Because it was not possible to unambiguously determine two critical sets of parameters for the tanks, this issue can be the reason for further searching for more combinations of these parameters in future. In this case, as the determined values of corrosion current density were similar, usually in the “low corrosion” range, searching for the combination of parameters would not affect the conclusions concerning the corrosion state of the tanks.
However, the analysis of polarization tests conducted on the reinforcement of cores drilled from the silos S1 and S2 give other observations concerning the impact of determined critical parameters of relative humidity and air temperature at the structure. In the determined thermal and humidity conditions favourable for the development of reinforcement corrosion ( = 95% i = 30 °C), the obtained polarization curves (Figure 10b,d) were noticeably shifted towards lower potentials and higher values of corrosion current density compared to the curves obtained at lower temperature and relative humidity (Figure 10a,c). The specified direction of curve shift was related to the control over corrosion activation where higher temperature and higher concrete conductivity, which was caused by greater humidity, had a significant impact on the increased rate of reactions (2) and (3) in accordance with the relationships (5) and (6).
Following the same process as for the analysis of polarization results obtained for the reinforcement in cores drilled from the tanks, the results for cores from the silos obtained from the method of linear polarization resistance of the corrosion current density are presented in Table A3 and Table A4 of the Appendix A. The obtained values are compared on bar graphs in Figure 13. The analysis of graphical presentation of distributed densities of corrosion current for both tested silos quite clearly confirmed predictions about the critical parameters of humidity and temperature which could maximize or minimize corrosion rate. High relative humidity and air temperature (blue bars) caused the expected increase in corrosion current density even to the level of 1.42 μA/cm2. On the other hand, low relative humidity and air temperature resulted in significant reduction of corrosion current density, which in only one case (0.38 μA/cm2) resulted in exceeding range of values characteristic for passivation.
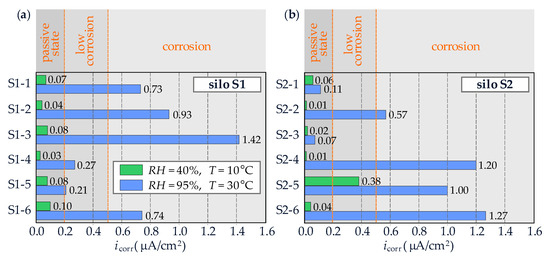
Figure 13.
Distribution of corrosion current densities presented as horizontal bar graphs, obtained for reinforcement of cylindrical concrete cores drilled from reinforced concrete silos for cement: (a) results for the silo S1; and (b) results for the silo S2; blue bars represent the tests at air temperature = 30 °C and relative humidity = 99%; green bars represent tests at air temperature = 30 °C and relative humidity = 99%; information in orange above the graphs show corrosion risk for reinforcement in concrete of the tested cores.
According to the proposed testing methodology (Section 2.3), evaluation of causes of corrosion was a complementary and important part to testing corrosion rate for reinforcement in the cores drilled from the structure. Distributions of the main factors specifying conditions favourable for corrosion development were determined along the cover thickness in both analysed types of structures — the tanks and the silos (Figure 7 and Figure 11). For the cores drilled from the tanks T1 and T2, the obtained pH values noticeably exceed 12, except for the external ones near a 10-mm cover (Figure 7a,b). On the other hand, for the silos S1 and S2 (Figure 11a,b) the pH profile significantly varied depending on the place of drilling the core. Moreover, considerable drops in pH values, often below the range of 11.0–11.5, were observed. They were found to initiate decomposition of passive layer of reinforcing steel in concrete.
The tests on chloride content in concrete cover, both in the tanks (Figure 7c,d) and the silos (Figure 11c,d) demonstrated no risk caused by high concentration of Cl− ions in the pore solution. According to the standard [56] 0.4% by weight of cement in concrete is considered as the limit value of chloride concentration in reinforced concrete units. Chloride content along the whole thickness of 40 m cover in the tanks T1 and T2 did not exceed 0.2%. The chloride concentration also did not increase near rebars in the silos S1 and S2; however, these values were slightly higher in the tanks and locally exceeded 0.3%.
Some papers [57,58] reveal that the most reliable criterion for evaluating corrosion risk for reinforcement posed by chloride ions was the so-called Hausman criterion [59]
This criterion includes the total effect of concentration of chloride and hydroxide ions on the surface of reinforcing steel, which is contact with pore solution. With an increasing concentration of OH− ions, Cl− ions are displaced form steel surface, which impeded decomposition of a passive layer by chlorides in the pore solution. Knowing both the distribution of pH values and concentrations of chlorides ions, obtained from the tests conducted on the tanks and the silos, this criterion (10) could be directly applied assuming that was the function of pH in accordance with the following Formula (11)
The calculated ratios of concentrations and for each thickness layer of concrete cover in the cores are presented as the distribution of curves in Figure 7e,f, and Figure 11e,f. By illustrating the coordinate of 0.6 in the form of a horizontal dashed line corresponding to the ultimate level, it is easy to visually assess whether the Hausman criterion (10) is met or exceeded. The analysis of results for concrete cores drilled from the tanks T1 and T2 (Figure 7e,f) clearly indicated no risk of chloride-induced corrosion of the reinforcement. The above confirmed the previously analysed very satisfactory high values of pH (Figure 7a,b) and desired low concentrations of chloride ions (Figure 7c,d). For the silos S1 and S2, the limit level based on the Hausman criterion was definitely exceed for the majority of concrete cores (Figure 11e,f). It means chloride-induced corrosion risk for the reinforcement even though the analysis of only chloride concentrations with reference to cement weight in concrete did not indicate that risk (Figure 11c,d). The obtained results were obviously affected by the increased concentration of hydroxide ions near reinforcing steel, which was caused by increased pH of pore solution (Figure 11a,b).
5.2. Assessment of Benefits of the Modified Testing Methodology
The employed methodology described in point 2.3 delivers benefits in four aspects. First, which was the main topic of this paper, natural variability of corrosion rate over a long service life of the structure was simulated in the climate chamber on the cores drilled from the structure. Therefore, the extreme values of corrosion current density were obtained, which were similar to the effect produced during a continuous, long-term monitoring of the structure.
The second benefit was the precise determination of the polarized (tested) surface area of the reinforcement. The range of current impact in the structure during the polarization measurements was not known because according to [44], this range was determined by the present corrosion rate and concrete conductivity. The equipment with a double counter electrode, where the outer electrode was used as the guard ring [60,61,62,63] is usually employed to reduce the polarization range and precisely determine the tested surface area. As it was mentioned in the introduction part, unfortunately the application of the guard ring is not always effective, particularly when the crossing multi-layer reinforcement is present in the tested element or when local corrosion is observed. On the other hand, drilling of the cores with fragments of rebars caused that the counter electrode 1 (Figure 14) applied on the core base or the coated counter electrode 2 applied on the side surface of the core (Figure 14b) had considerably greater surface area than the working electrode 3 (a rebar fragment). The paper [32] described simulation with FEM, within which distributions of the polarizing potential were analysed after applying the electrode on the bottom of the cylindrical specimen. As illustrated in Figure 14c, distributions of potential were different, but each time the rebar was uniformly polarized on the whole contact area between concrete and steel. Moreover, the tested surface, including the surface of ribs, could be precisely measured after completing the tests because the reinforcing steel was not smooth.
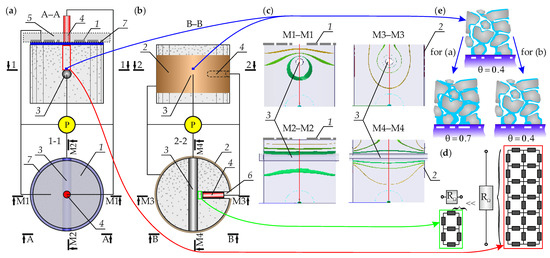
Figure 14.
Benefits obtained from using solid reference and auxiliary electrodes for polarization measurements of concrete cores drilled from the structure: (a) drilled concrete cores with electrodes conventionally applied on the bottom; (b) drilled concrete core with electrodes placed in an opening or applied on the surface; (c) polarization distribution for the working electrode at the auxiliary electrode on the bottom and side surface, cf. [32]; (d) compared resistance of concrete layer between the reference and working electrode, with reference to cases (a,b); and (e) an impact of increased humidity in the cylindrical specimen on steel covering with pore solution, 1—applied auxiliary electrode, 2—solid auxiliary electrode, 3—a rebar fragment used as the working electrode, 4—reference electrode, 5—measurement probe, 6—an opening in the core concrete for the reference electrode, 7—wet or damp spacer, —resistance of concrete layer between the reference and the working electrode, θ—degree of steel covering with pore solution, P—potentiostat—description and notes in the text.
The third advantage was the minimized ohm drop of potential between the working electrode 3 and the reference electrode 4. The distance in the electrochemical cell, illustrated in Figure 2, between the working electrode 1 and the reference electrode 2, with Luggin capillary 6 was a few millimetres. This small layer of solution between the electrodes was characterized by some resistance , which in the theoretical description is expressed by introducing additional members and , to the relationships η–i defined by the expressions (6) and (7), giving the following Formulas (12) and (13)—cf. [34].
In the era of modern measuring devices, the effect of the unfavourable drop of IR on shapes of the polarization curve had some significance during the tests performed in the electrochemical cell. In front of each recorded measuring point modern potentiostats actively compensate the effect of potential drop across the resistor during formation of the polarization curve. However, the universal high response potentiostats are calibrated against small drops of IR. On the other hand, in traditional measurements performed on concrete structures, the electrode is applied through the probe 5 (Figure 14a), in which the above mentioned counter electrode 1 and the reference electrode 4 were integrated [60,61,62,63]. Resistance of concrete cover layer , presented within a red frame in Figure 14a, was greater by a few orders than in the electrochemical cell, reaching even the value of a few kΩ. Consequently, precise and sensitive instruments used for the analysed measuring systems on concrete cores produced instable results. The procedure of moving the reference electrode 4 closer to the rebar 3 through the performed opening 6 (Figure 14b) within a distance of only a few millimetres, proposed in this paper, resulted in significantly lower resistance of concrete, which was within a green frame (Figure 14d). As a result, we obtained the proper compensation of IR drop and stability of the results.
Providing better electrical contact between all the electrodes of the measuring system was the final benefit. Apart from the working electrode 3 enclosed with concrete, the reference electrode 4 and the auxiliary electrode 1 are usually applied through the wet or damp spacer 7 (Figure 14a). Introduction of the additional source of humidity, particularly during the tests simulating dry environmental conditions, could considerably change the measurement results. In the paper [64] which described modelling of steel corrosion, moisture content of concrete was associated with the level of pore filling, and consequently with coverage of rebar surface with pore solution (Figure 14e). In the electrochemistry limiting the electrode surface is related to absorption of inert substances, where the degree of electrode covering is defined by the value θ. Following the same procedure, the rate of electrode reactions was assumed to decrease proportionally to the contact surface with pore solution. Assuming that the reduction of corrosion rate referred to the same degree to cathodic and anodic reactions, and that no other process connected with a change in moisture content of concrete occurred, then a change in the relations η–i expressed by the Equations (6) and (7) was related to a new term . Taking into account that component in the Equations (6) and (7), the following relationships (14) were (15) obtained—cf. [34]
On the other hand, applying the counter electrode in the form of conductive coating using the painting technique and permanently fixing the reference electrode in the core using cement grout, the electric contact with concrete was provided without the damp spacer. The final filling of concrete pores after long exposure in the dry environment is shown in the upper part of Figure 14e. The potential impact of additional moisture content in the volume of concrete pores is presented in the bottom part of this Figure. In this case, additional moisture content of concrete resulted in an increased coverage of steel with pore solution (an increase in coefficient θ). Moreover, additional moisture can induce the immediate change in potential of the working electrode, total resistance of the system, and consequently polarity distribution of the working electrode is also changed. However, in accordance with the methodology described in this paper, the application of solid electrodes did not produce any unfavourable change in the moisture content of concrete.
Polarization curves on logarithmic scale are shown in blue colour in Figure 15. They are the same blue polarization curves in Figure 1. In this case, the diagram was assumed to be plotted at average moisture content of concrete for average θ. The orange modified curves are shown in the same Figure for comparative purposes, after taking into account the uncompensated drop of the potential across the resistance of concrete cover. Additionally, the changed curves, after taking into account increased moisture content and greater θ, caused by using the damp spacer below the measuring probe are shown in violet colour. Also, new hypothetical values of corrosion current density were determined for orange curves and violet ones. The analysis of diagrams in Figure 15 revealed that the applied electrodes with reference to the solid electrodes presented in this paper, can significantly affect conclusions about current rate of corrosion.
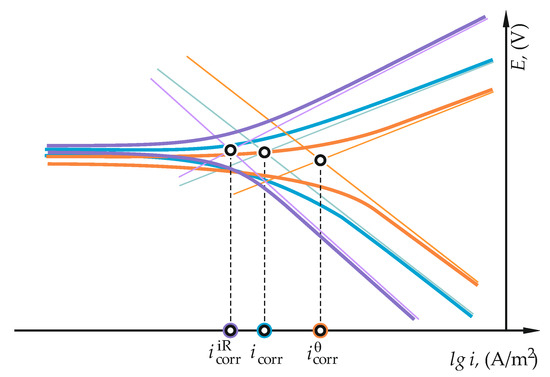
Figure 15.
The impact of changed moisture content of concrete and uncompensated drop of potential across concrete cover on the shape of polarization curves and on determined values of corrosion current density—description in the text.
6. Conclusions
The conclusion presented below can be derived from the tests conducted on reinforced concrete tanks and silos and from multi-aspect analyses of various factors which determine the effectiveness and reliability of results from corrosion testing performed on concrete cores drilled from the structure:
- The traditional in-situ diagnostics testing of corrosion using the electrochemical methods (measurements of potential, resistivity, polarization) provide valuable information; however, they only indicate the temporary electrochemical state of the reinforced concrete structure, which depends on thermal and humidity conditions at the moment of measurements;
- Generally, diagnostics processes for reinforced concrete structure conducted on large areas of concrete, and/or at high altitudes, and/or in difficult-to-access areas are troublesome and dangerous. Hence, drilling cores with fragments of the secondary reinforcement (e.g., spacer bars, stirrups, binders) from the structure greatly improve safety and comfort of tests by conducting them in the laboratory conditions. There, polarization tests on corrosion rate of reinforcement, and tests on protective properties of concrete against reinforcing steel can be performed as well;
- The extreme values of corrosion current density can be determined when extreme thermal and humidity parameters are set in the climate chamber while testing the rate of corrosion current for reinforcement in the tested cores. Selection of temperature and relative humidity in the climate chamber should be based on the analysis of historical weather and operational data from a few years, concerning the location of the tested civil structure. The set of values of corrosion current density obtained in that way, after conversion into corrosion rate values, can be included in the mechanical models representing degradation of the tested reinforced concrete structures, which provides more precise estimation of the remaining service life of this structure;
- The arrangement of the three-electrode system on the drilled concrete cores should minimize the measuring errors. Therefore, the counter electrode in the form of conductive coating applied on the side wall of the cylindrical core with the painting technique is the novelty proposed by the authors. The main advantage of this solution is the constant electric contact between the coating and the core concrete, which does not require any additional conductive medium that changes electric properties of concrete. The second improvement of the three-electrode system consists in using the solid reference electrode embedded in cement grout in the opening with bottom placed very close the working electrode. This solution minimizes the problem related to resistance compensation and increases stability of the results while polarization curves are recorded during the tests on corrosion rate. Moreover, cores with fragments of rebars which are used as working electrodes in the three-electrode system, drilled from the structure cause that the polarization surface area can be precisely determined by directly measuring side walls of rebars after crushing the cores at the end of the corrosion tests;
- The described examples of corrosion tests performed on reinforced concrete tanks for fresh water and silos for cement storage confirmed the application possibilities of the diagnostics method based on the tests on drilled cores and improved by the authors. At satisfactory protective properties of concrete against reinforcement, changes in thermal and humidity parameters in the tanks did not produce any significant differences in corrosion rate, which was generally kept at low level. The results were different for the silos, where concrete carbonation decreased protective properties of concrete. Consequently, values of corrosion current density were high under conditions favourable for corrosion. Particular attention should be paid to the results obtained in conditions unfavourable for corrosion because in that case density of corrosion current of the reinforcement indicated passive state. In-situ measurements of corrosion rate taken in such conditions could lead to incorrect conclusions about corrosion of reinforcement in the silos.
Author Contributions
Conceptualization, M.J. and T.J.; methodology, T.J. and M.J.; formal analysis, M.J. and T.J.; investigation: M.J. and T.J.; resources, T.J.; data curation, M.J.; writing—original draft preparation, M.J. and T.J.; writing—review and editing, M.J. and T.J.; visualization, T.J. and M.J.; supervision, M.J. All authors have read and agreed to the published version of the manuscript.
Funding
The research was financed by Silesian University of Technology (Poland) within the grant no. 03/020/RGH_19/0073 and the grant no. 03/020/RGJ22/0129 and in part within the project BK-222/RB-2/2022 (03/020/BK_22/0128).
Institutional Review Board Statement
Not applicable.
Informed Consent Statement
Not applicable.
Data Availability Statement
The data presented in this study are available on request from the corresponding author.
Conflicts of Interest
The authors declare no conflict of interest. The funders had no role in the design of the study; in the collection, analyses, or interpretation of data; in the writing of the manuscript; or in the decision to publish the results.
Appendix A

Table A1.
Results of the analysis of polarization curves for steel reinforcement in cores drilled from the tank T1.
Table A1.
Results of the analysis of polarization curves for steel reinforcement in cores drilled from the tank T1.
| Core | T | RH | Egraphite | ba | bc | B | Rp | RpAp | icorr |
|---|---|---|---|---|---|---|---|---|---|
| No. | (°C) | (%) | (V) | (mV) | (mV) | (mV) | (kΩ) | (kΩcm2) | (µA/cm2) |
| T1-1 | 30 | 100 | −0.432 | 125 | 29 | 10.2 | 2.51 | 88.4 | 0.12 |
| 7 | water | −0.546 | 153 | 43 | 14.6 | 1.10 | 38.8 | 0.38 | |
| T1-2 | 30 | 100 | −0.316 | 485 | 42 | 16.8 | 0.95 | 35.1 | 0.48 |
| 7 | water | −0.534 | 66 | 72 | 15.0 | 1.14 | 42.0 | 0.36 | |
| T1-3 | 30 | 100 | −0.182 | 337 | 52 | 19.6 | 0.85 | 42.2 | 0.46 |
| 7 | water | −0.303 | 183 | 23 | 8.9 | 1.43 | 70.6 | 0.13 | |
| T1-4 | 30 | 100 | −0.345 | 228 | 41 | 15.1 | 0.55 | 43.4 | 0.35 |
| 7 | water | −0.490 | 96 | 36 | 11.4 | 1.08 | 84.6 | 0.14 | |
| T1-5 | 30 | 100 | −0.169 | 80 | 69 | 16.1 | 0.34 | 56.5 | 0.28 |
| 7 | water | −0.414 | 71 | 66 | 14.9 | 0.40 | 67.5 | 0.22 | |
| T1-6 | 30 | 100 | −0.165 | 40 | 48 | 9.5 | 8.52 | 332 | 0.03 |
| 7 | water | −0.237 | 34 | 74 | 10.1 | 1.94 | 75.8 | 0.13 |
Table A2.
Results of the analysis of polarization curves for steel reinforcement in cores drilled from the tank T2.
Table A2.
Results of the analysis of polarization curves for steel reinforcement in cores drilled from the tank T2.
| Core | T | RH | Egraphite | ba | bc | B | Rp | RpAp | icorr |
|---|---|---|---|---|---|---|---|---|---|
| No. | (°C) | (%) | (V) | (mV) | (mV) | (mV) | (kΩ) | (kΩcm2) | (µA/cm2) |
| T2-1 | 30 | 100 | 0.052 | 141 | 43 | 14.3 | 3.18 | 83.7 | 0.17 |
| 7 | water | −0.437 | 170 | 30 | 11.1 | 2.31 | 61.1 | 0.18 | |
| T2-2 | 30 | 100 | −0.270 | 141 | 69 | 20.1 | 1.18 | 31.4 | 0.64 |
| 7 | water | −0.428 | 262 | 36 | 13.7 | 1.17 | 31.2 | 0.44 | |
| T2-3 | 30 | 100 | −0.080 | 142 | 11 | 4.4 | 0.55 | 14.5 | 0.31 |
| 7 | water | −0.554 | 60 | 44 | 11.0 | 0.50 | 13.2 | 0.84 | |
| T2-4 | 30 | 100 | −0.109 | 162 | 31 | 11.3 | 5.17 | 13.7 | 0.08 |
| 7 | water | −0.435 | 127 | 29 | 10.3 | 1.94 | 51.3 | 0.20 | |
| T2-5 | 30 | 100 | 0.098 | 78 | 56 | 14.2 | 0.48 | 72.5 | 0.20 |
| 7 | water | −0.398 | 140 | 140 | 30.4 | 0.30 | 45.2 | 0.67 | |
| T2-6 | 30 | 100 | 0.006 | 213 | 21 | 8.3 | 0.47 | 36.1 | 0.23 |
| 7 | water | −0.515 | 378 | 97 | 33.5 | 0.64 | 49.0 | 0.68 |
Table A3.
Results of the analysis of polarization curves for steel reinforcement in cores drilled from the silo S1.
Table A3.
Results of the analysis of polarization curves for steel reinforcement in cores drilled from the silo S1.
| Core | T | RH | Egraphite | ba | bc | B | Rp | RpAp | icorr |
|---|---|---|---|---|---|---|---|---|---|
| No. | (°C) | (%) | (V) | (mV) | (mV) | (mV) | (kΩ) | (kΩcm2) | (µA/cm2) |
| S1-1 | 30 | 100 | −0.283 | 192 | 43 | 15.3 | 0.37 | 20.8 | 0.73 |
| 13 | 40 | −0.169 | 185 | 31 | 11.5 | 2.88 | 160 | 0.07 | |
| S1-2 | 30 | 100 | −0.421 | 50 | 64 | 12.2 | 0.22 | 13.2 | 0.93 |
| 13 | 40 | −0.356 | 43 | 18 | 5.5 | 2.32 | 138 | 0.04 | |
| S1-3 | 30 | 100 | −0.135 | 132 | 41 | 13.6 | 0.16 | 9.57 | 1.42 |
| 13 | 40 | +0.008 | 41 | 76 | 11.6 | 2.38 | 142 | 0.08 | |
| S1-4 | 30 | 100 | −0.098 | 106 | 73 | 18.8 | 1.21 | 69.8 | 0.27 |
| 13 | 40 | +0.024 | 121 | 18 | 6.8 | 4.19 | 241 | 0.03 | |
| S1-5 | 30 | 100 | −0.467 | 56 | 56 | 12.2 | 0.99 | 58.6 | 0.21 |
| 13 | 40 | −0.386 | 70 | 48 | 12.4 | 2.60 | 154 | 0.08 | |
| S1-6 | 30 | 100 | −0.383 | 171 | 49 | 16.5 | 0.39 | 22.4 | 0.74 |
| 13 | 40 | −0.238 | 117 | 51 | 15.4 | 2.66 | 152 | 0.10 |
Table A4.
Results of the analysis of polarization curves for steel reinforcement in cores drilled from the silo S2.
Table A4.
Results of the analysis of polarization curves for steel reinforcement in cores drilled from the silo S2.
| Core | T | RH | Egraphite | ba | bc | B | Rp | RpAp | icorr |
|---|---|---|---|---|---|---|---|---|---|
| No. | (°C) | (%) | (V) | (mV) | (mV) | (mV) | (kΩ) | (kΩcm2) | (µA/cm2) |
| S2-1 | 30 | 100 | +0.001 | 36.7 | 31.1 | 7.3 | 1.41 | 65.4 | 0.11 |
| 13 | 40 | +0.080 | 67 | 39 | 10.7 | 4.00 | 185 | 0.06 | |
| S2-2 | 30 | 100 | −0.267 | 409 | 88 | 31.4 | 0.95 | 55.2 | 0.57 |
| 13 | 40 | −0.206 | 57 | 128 | 17.1 | 20.99 | 1222 | 0.01 | |
| S2-3 | 30 | 100 | −0.284 | 15.6 | 43.9 | 5.0 | 1.43 | 72.3 | 0.07 |
| 13 | 40 | −0.113 | 56 | 64 | 13.0 | 12.44 | 629 | 0.02 | |
| S2-4 | 30 | 100 | −0.466 | 90 | 89 | 19.4 | 0.27 | 16.2 | 1.20 |
| 13 | 40 | −0.330 | 25 | 236 | 9.8 | 32.63 | 1931 | 0.01 | |
| S2-5 | 30 | 100 | −0.333 | 178 | 44 | 15.3 | 0.26 | 15.3 | 1.00 |
| 13 | 40 | −0.381 | 236 | 34 | 12.9 | 0.56 | 33.7 | 0.38 | |
| S2-6 | 30 | 100 | −0.396 | 142 | 46 | 15.1 | 0.24 | 11.9 | 1.27 |
| 13 | 40 | −0.006 | 64 | 60 | 13.4 | 8.04 | 404 | 0.04 |
References
- Stefanoni, M.; Angst, U.; Elsener, B. Corrosion rate of carbon steel in carbonated concrete—A critical review. Cem. Concr. Res. 2018, 103, 35–48. [Google Scholar] [CrossRef]
- Marciniak, A.; Grymin, W.; Margiewicz, T.; Koniorczyk, M. Influence of freezing-induced damage on the carbonation rate of concrete. Eur. J. Environ. Civ. Eng. 2016, 21, 1–16. [Google Scholar] [CrossRef]
- Liu, X.; Niu, D.; Li, X.; Lv, Y.; Fu, Q. Pore solution pH for the corrosion initiation of rebars embedded in concrete under a long-term natural carbonation reaction. Appl. Sci. 2018, 8, 128. [Google Scholar] [CrossRef] [Green Version]
- Liu, M.; Cheng, X.; Li, X.; Zhou, C.; Tan, H. Effect of carbonation on the electrochemical behavior of corrosion resistance low alloy steel rebars in cement extract solution. Constr. Build. Mater. 2017, 130, 193–201. [Google Scholar] [CrossRef]
- Al-Saleh, S.A. Analysis of total chloride content in concrete. Case Stud. Constr. Mater. 2015, 3, 78–82. [Google Scholar] [CrossRef] [Green Version]
- Ann, K.Y.; Song, H.W. Chloride threshold level for corrosion of steel in concrete. Corros. Sci. 2007, 49, 4113–4133. [Google Scholar] [CrossRef]
- Figueira, R.B. Electrochemical sensors for monitoring the corrosion conditions of reinforced concrete structures: A review. Appl. Sci. 2017, 7, 1157. [Google Scholar] [CrossRef] [Green Version]
- Ahmad, S. Reinforcement corrosion in concrete structures, its monitoring and service life prediction—A review. Cem. Concr. Compos. 2003, 25, 459–471. [Google Scholar] [CrossRef]
- Montemor, M.F.; Alves, J.H.; Simões, A.M.; Fernandes, J.C.S.; Lourenço, Z.; Costa, A.J.S.; Appleton, A.J.; Ferreira, M.G.S. Multiprobe chloride sensor for in situ monitoring of reinforced concrete structures. Cem. Concr. Compos. 2006, 28, 233–236. [Google Scholar] [CrossRef]
- Dong, S.G.; Lin, C.J.; Hu, R.G.; Li, L.Q.; Du, R.G. Effective monitoring of corrosion in reinforcing steel in concrete constructions by a multifunctional sensor. Electrochim. Acta 2011, 56, 1881–1888. [Google Scholar] [CrossRef]
- Yu, H.; Caseres, L. An embedded multi-parameter corrosion sensor for reinforced concrete structures. Mater. Corros. 2012, 63, 1011–1016. [Google Scholar] [CrossRef]
- Andrade, C.; Martinez, I. Corrosion Rate Monitoring of Deteriorated and Repaired Structures through On-Site Linear Polarization Measurements Using Surface or Embedded Sensors. In 2nd International RILEM Symposium on Advances in Concrete through Science and Engineering; RILEM Publications SARL: Quebec City, QC, Canada, 2006. [Google Scholar]
- Barroca, N.; Borges, L.M.; Velez, F.J.; Monteiro, F.; Górski, M.; Castro-Gomes, J. Wireless sensor networks for temperature and humidity monitoring within concrete structures. Constr. Build. Mater. 2013, 40, 1156–1166. [Google Scholar] [CrossRef] [Green Version]
- Taheri, S. A review on five key sensors for monitoring of concrete structures. Constr. Build. Mater. 2019, 204, 492–509. [Google Scholar] [CrossRef]
- Abbas, Y.; Have, B.T.; Hoekstra, G.I.; Douma, A.; De Bruijn, D.; Olthuis, W.; Van Den Berg, A. Connecting to concrete: Wireless monitoring of chloride ions in concrete structures. Procedia Eng. 2015, 120, 965–968. [Google Scholar] [CrossRef] [Green Version]
- Duffó, G.S.; Farina, S.B. Electrochemical behaviour of steel in mortar and in simulated pore solutions: Analogies and differences. Cem. Concr. Res. 2016, 88, 211–216. [Google Scholar] [CrossRef]
- Jiang, J.Y.; Wang, D.; Chu, H.Y.; Ma, H.; Liu, Y.; Gao, Y.; Shi, J.; Sun, W. The passive film growth mechanism of new corrosion-resistant steel rebar in simulated concrete pore solution: Nanometer structure and electrochemical study. Materials 2017, 10, 412. [Google Scholar] [CrossRef] [Green Version]
- Yu, B.; Liu, J.; Chen, Z. Probabilistic evaluation method for corrosion risk of steel reinforcement based on concrete resistivity. Constr. Build. Mater. 2017, 138, 101–113. [Google Scholar] [CrossRef]
- ASTM C876; 2015 Standard Test Method for Corrosion Potentials of Uncoated Reinforcing Steel in Concrete. ASTM International: West Conshohocken, PA, USA, 2015.
- Millard, S.G.; Law, D.; Bungey, J.H.; Cairns, J. Environmental influences on linear polarisation corrosion rate measurement in reinforced concrete. NDT E Int. 2001, 34, 409–417. [Google Scholar] [CrossRef]
- Sadowski, Ł. New non-destructive method for linear polarisation resistance corrosion rate measurement. Arch. Civ. Mech. Eng. 2010, 10, 109–116. [Google Scholar] [CrossRef]
- Ribeiro, D.V.; Souza, C.A.C.; Abrantes, J.C.C. Use of Electrochemical Impedance Spectroscopy (EIS) to monitoring the corrosion of reinforced concrete. Rev. IBRACON Estruturas Mater. 2015, 8, 529–546. [Google Scholar] [CrossRef]
- Ribeiro, D.V.; Abrantes, J.C.C. Application of electrochemical impedance spectroscopy (EIS) to monitor the corrosion of reinforced concrete: A new approach. Constr. Build. Mater. 2016, 111, 98–104. [Google Scholar] [CrossRef]
- Raczkiewicz, W.; Wójcicki, A. Temperature impact on the assessment of reinforcement corrosion risk in concrete by galvanostatic pulse method. Appl. Sci. 2020, 10, 1089. [Google Scholar] [CrossRef] [Green Version]
- Sathiyanarayanan, S.; Natarajan, P.; Saravanan, K.; Srinivasan, S.; Venkatachari, G. Corrosion monitoring of steel in concrete by galvanostatic pulse technique. Cem. Concr. Compos. 2006, 28, 630–637. [Google Scholar] [CrossRef]
- Jaśniok, M.; Jaśniok, T. Measurements on Corrosion Rate of Reinforcing Steel under various Environmental Conditions, Using an Insulator to Delimit the Polarized Area. Procedia Eng. 2017, 193, 431–438. [Google Scholar] [CrossRef]
- Jaśniok, T.; Jaśniok, M. Range of polarization limited by a dielectric during electrochemical measurements of corrosion rate of steel reinforcement in concrete. Ochr. Przed Korozją 2016, 1, 29–35. [Google Scholar] [CrossRef]
- Law, D.W.; Millard, S.G.; Bungey, J.H. Linear polarization resistance measurements using a potentiostatically controlled guard ring. NDT E Int. 2000, 33, 15–21. [Google Scholar] [CrossRef]
- Poursaee, A.; Hansson, C.M. Galvanostatic pulse technique with the current confinement guard ring: The laboratory and finite element analysis. Corros. Sci. 2008, 50, 2739–2746. [Google Scholar] [CrossRef]
- Wojtas, H. Determination of corrosion rate of reinforcement with a modulated guard ring electrode; analysis of errors due to lateral current distribution. Corros. Sci. 2004, 46, 1621–1632. [Google Scholar] [CrossRef]
- Andrade, C.; Alonso, C.; Sarŕa, J. Corrosion rate evolution in concrete structures exposed to the atmosphere. Cem. Concr. Compos. 2002, 24, 55–64. [Google Scholar] [CrossRef]
- Jaśniok, T.; Jaśniok, M. Effects of electrodes location in a three-electrode system on polarization measurements of reinforcing steel in concrete cores drilled from a structure. Ochr. Przed Korozją 2019, 62, 252–258. [Google Scholar] [CrossRef]
- Jaśniok, M.; Jaśniok, T. Evaluation of Maximum and Minimum Corrosion Rate of Steel Rebars in Concrete Structures, Based on Laboratory Measurements on Drilled Cores. Procedia Eng. 2017, 193, 486–493. [Google Scholar] [CrossRef]
- Kisza, A. Elektrochemia II. Elektrodyka; Wydawnictwo Naukowe PWN: Warszawa, Poland, 2001; ISBN 83-204-2564-6. [Google Scholar]
- Correia, M.J.; Pereira, E.V.; Salta, M.M.; Fonseca, I.T.E. Sensor for oxygen evaluation in concrete. Cem. Concr. Compos. 2006, 28, 226–232. [Google Scholar] [CrossRef]
- Brewer, P.J.; Leese, R.J.; Brown, R.J.C. An improved approach for fabricating Ag/AgCl reference electrodes. Electrochim. Acta 2012, 71, 252–257. [Google Scholar] [CrossRef]
- Jin, M.; Jiang, L.; Xu, J.; Chu, H.; Tao, D.; Bai, S.; Jia, Y. Electrochemical characterization of Solid Ag/AgCl reference electrode with different electrolytes for corrosion monitoring of steel in concrete. Electrochemistry 2016, 84, 383–389. [Google Scholar] [CrossRef] [Green Version]
- Rogulski, Z.; Siwek, H.; Paleska, I.; Czerwiński, A. Electrochemical behavior of manganese dioxide on a gold electrode. J. Electroanal. Chem. 2003, 543, 175–185. [Google Scholar] [CrossRef]
- Muralidharan, S.; Ha, T.H.; Bae, J.H.; Ha, Y.C.; Lee, H.G.; Park, K.W.; Kim, D.K. Electrochemical studies on the solid embeddable reference sensors for corrosion monitoring in concrete structure. Mater. Lett. 2006, 60, 651–655. [Google Scholar] [CrossRef]
- Muralidharan, S.; Saraswathy, V.; Madhavamayandi, A.; Thangavel, K.; Palaniswamy, N. Evaluation of embeddable potential sensor for corrosion monitoring in concrete structures. Electrochim. Acta 2008, 53, 7248–7254. [Google Scholar] [CrossRef]
- Maruthapandian, V.; Saraswathy, V. Solid nano ferrite embeddable reference electrode for corrosion monitoring in reinforced concrete structures. Procedia Eng. 2014, 86, 623–630. [Google Scholar] [CrossRef] [Green Version]
- Qiao, G.; Hong, Y.; Song, G.; Li, H.; Ou, J. Electrochemical characterization of the solid-state reference electrode based on NiFe2O4 film for the corrosion monitoring of RC structures. Sensors Actuators B Chem. 2012, 168, 172–177. [Google Scholar] [CrossRef]
- Hong, Y.; Qiao, G.; Song, G. Preparation of the NiFe 2O 4 electrochemical film for the solid-state reference electrode based on EB-PVD. Appl. Surf. Sci. 2012, 258, 8934–8939. [Google Scholar] [CrossRef]
- Andrade, C.; Alonso, C. Corrosion rate monitoring in the laboratory and on-site. Constr. Build. Mater. 1996, 10, 315–328. [Google Scholar] [CrossRef]
- Liu, Y.; Weyers, R.E. Modeling the time-to-corrosion cracking in chloride contaminated reinforced concrete structures. ACI Mater. J. 1998, 95, 675–681. [Google Scholar] [CrossRef]
- Gulikers, J. Theoretical considerations on the supposed linear relationship between concrete resistivity and corrosion rate of steel reinforcement. Mater. Corros. 2005, 56, 393–403. [Google Scholar] [CrossRef]
- Nygaard, P.V.; Geiker, M.R.; Elsener, B. Corrosion rate of steel in concrete: Evaluation of confinement techniques for on-site corrosion rate measurements. Mater. Struct. Constr. 2009, 42, 1059–1076. [Google Scholar] [CrossRef]
- Morris, W.; Vico, A.; Vázquez, M. Chloride induced corrosion of reinforcing steel evaluated by concrete resistivity measurements. Electrochim. Acta 2004, 49, 4447–4453. [Google Scholar] [CrossRef]
- Morris, W.; Vico, A.; Vazquez, M.; De Sanchez, S.R. Corrosion of reinforcing steel evaluated by means of concrete resistivity measurements. Corros. Sci. 2002, 44, 81–99. [Google Scholar] [CrossRef]
- Hope, B.B.; Ip, A.K.; Manning, D.G. Corrosion and electrical impedance in concrete. Cem. Concr. Res. 1985, 15, 525–534. [Google Scholar] [CrossRef]
- Feliu, S.; González, J.A.; Feliu, S.; Andrade, C. Relationship between conductivity of concrete and corrosion of reinforcing bars. Br. Corros. J. 1989, 24, 195–198. [Google Scholar] [CrossRef]
- Hornbostel, K.; Larsen, C.K.; Geiker, M.R. Relationship between concrete resistivity and corrosion rate—A literature review. Cem. Concr. Compos. 2013, 39, 60–72. [Google Scholar] [CrossRef]
- Sang, Y.; Yang, Y.; Zhao, Q. Electrical resistivity of plain cement-based materials based on ionic conductivity: A review of applications and conductive models. J. Build. Eng. 2022, 46, 103642. [Google Scholar] [CrossRef]
- Sengul, O. Use of electrical resistivity as an indicator for durability. Constr. Build. Mater. 2014, 73, 434–441. [Google Scholar] [CrossRef]
- Stern, M.; Geary, A.L. Electrochemical Polarization. J. Electrochem. Soc. 1957, 104, 56. [Google Scholar] [CrossRef]
- PN-EN 206+A1:2016-12; Concrete Specification, Performance, Production and Conformity. PKN/KT 274: Warszawa, Poland, 2016.
- Thomas, M. Chloride thresholds in marine concrete. Cem. Concr. Res. 1996, 26, 513–519. [Google Scholar] [CrossRef]
- Femenias, Y.S.; Angst, U.; Moro, F.; Elsener, B. Development of a novel methodology to assess the corrosion threshold in concrete based on simultaneous monitoring of pH and free chloride concentration. Sensors 2018, 18, 3101. [Google Scholar] [CrossRef] [Green Version]
- Hausmann, D.A. Steel Corrosion in Concrete—How Does It Occur? Mater. Prot. 1967, 6, 19–23. [Google Scholar]
- Karthick, S.P.; Muralidharan, S.; Saraswathy, V.; Thangavel, K. Long-term relative performance of embedded sensor and surface mounted electrode for corrosion monitoring of steel in concrete structures. Sens. Actuators B Chem. 2014, 192, 303–309. [Google Scholar] [CrossRef]
- Clément, A.; Laurens, S.; Arliguie, G.; Deby, F. Numerical study of the linear polarisation resistance technique applied to reinforced concrete for corrosion assessment. Eur. J. Environ. Civ. Eng. 2012, 16, 491–504. [Google Scholar] [CrossRef]
- Flis, J.; Pickering, H.W.; Osseo-Asare, K. Assessment of data from three electrochemical instruments for evaluation of reinforcement corrosion rates in concrete bridge components. Corrosion 1995, 51, 602–609. [Google Scholar] [CrossRef]
- Feliu, S.; González, J.A.; Miranda, J.M.; Feliu, V. Possibilities and problems of in situ techniques for measuring steel corrosion rates in large reinforced concrete structures. Corros. Sci. 2005, 47, 217–238. [Google Scholar] [CrossRef]
- Ohno, M.; Limtong, P.; Ishida, T. Multiscale modeling of steel corrosion in concrete based on micropore connectivity. J. Build. Eng. 2022, 47, 103855. [Google Scholar] [CrossRef]
Publisher’s Note: MDPI stays neutral with regard to jurisdictional claims in published maps and institutional affiliations. |
© 2022 by the authors. Licensee MDPI, Basel, Switzerland. This article is an open access article distributed under the terms and conditions of the Creative Commons Attribution (CC BY) license (https://creativecommons.org/licenses/by/4.0/).