Article

3D Modelling of Archaeoseismic Damage in the Roman Site of Baelo Claudia (Gibraltar Arc, South Spain)

by
Yolanda Sánchez-Sánchez
1,*,
Javier Elez
1,
Pablo G. Silva
2,
Gabriel Santos-Delgado
3,
Jorge Luis Giner-Robles
4 and
Klaus Reicherter
5
1
Department Geología, Facultad Ciencias, Universidad Salamanca, 37008 Salamanca, Spain
2
Department Geología, Universidad Salamanca, Escuela Politécnica Superior de Ávila, 05003 Avila, Spain
3
Department Ingeniería, Cartográfica y del Terreno, Universidad Salamanca, 05003 Avila, Spain
4
Department Geología, Facultad de Ciencias, Universidad Autónoma de Madrid, Cantoblanco, Tres Cantos, 28049 Madrid, Spain
5
Neotectonics and Natural Hazards Institute, RWTH Aachen University, 52056 Aachen, Germany
*
Author to whom correspondence should be addressed.
Appl. Sci. 2022, 12(10), 5223; https://doi.org/10.3390/app12105223
Submission received: 21 April 2022 / Revised: 13 May 2022 / Accepted: 18 May 2022 / Published: 21 May 2022
(This article belongs to the Special Issue 3D Virtual Reconstruction for Archaeological Sites)

Abstract

:

Featured Application

this work offers methods for the quantification of the deformation in Archaeoseismological scenarios using drone-based high-resolution 3D models.

Abstract

This study deals with the morphometric characterization and quantification of earthquake damage in the ancient Roman city of Baelo Claudia in South Spain (Gibraltar Arc) by means of the use of 3D modelling from drone imagery. Baelo Claudia is a world-renowned archaeological site recording recurrent earthquake destruction during the first and third centuries AD. The first earthquake destroyed the lower littoral zone of the city, allowing its reconstruction from the year c. 60–70 CE, but the second earthquake in 365–390 CE led to the complete destruction of the renewed city and its eventual abandonment. This second earthquake imprinted important deformations in the main monumental zone of the city, including the basilica temples, macellum, city walls, aqueducts and funerary monuments, as well as in the main paved zones of the city. This is the case for the Forum, Decumanus and Cardos, which show a variety of folds, pop-up structures, conjugate fractures and impact marks susceptible to be measured in a 3D format. The current study presents detailed (up to 3 mm/pixel) surface models of iconic monuments within the city. The 3D models were obtained by means of serial orthophotos taken with a UAV Mavic Pro 2 (DJI) Drone device equipped with a 20 mpx camera and a 1” CMOS sensor. Each individual image was captured in a geo-referenced jpg format and processed with the Agisoft Metashape Professional software®. Depending on the measured monument, the final images consisted of 250 to 700 photographs clustered by 50,000 to 150,000 tie points. In all studied items (Decumanus, city walls and bath dish), we follow the same workflow of analysis: (1) alignment of photos with support points; (2) building a dense cloud of points; (3) creation of the surface texture; (4) creation of the Digital Elevation Model (DEM); (5) creation of the orthomosaic; and finally, (6) the building of the high-quality 3D tiled surface models. The obtained models allow the geometric quantification of earthquake deformations (displacements, amplitudes, orientation, etc.) in a GIS-based 3D environment suitable to quantify oriented damage of seismic origin. In a complementary way, these 3D models deserve to be considered for their potential role as digital seismoscopes of ancient archaeological sites and/or heritage buildings.

1. Introduction

The use of 3D technologies and modelling in archaeology has experienced a rapid increase during the two last decades. Different topographic methodologies have been used over the last years for the survey of archaeological structures, including Terrestrial Laser Scanning (TLS) [1], aerial survey with Laser (LiDAR) and the use of photogrammetry from cameras; however, drones [2] help us to take high-resolution images with an accurate topographic positioning of each image [3]. They also make it possible to program specific flights with the desired conditions around the element to be modeled, making the pre- and post-processing work much more efficient, fast and accurate, thus offering relevant time and cost efficiency.
The creation of 3D models from the drone images of entire archaeological sites, particular buildings, monuments, statues or relevant artistic ornaments has been used to preserve and disseminate cultural heritage and scientific information, or simply to capture the modern condition of archaeological objects for further virtual restorations [4]. Among many other applications is the generation of 3D models as digital twins of damaged or destroyed sites based on preserved archaeological materials and historical descriptions [4,5,6,7]. This paper presents a study on this research line applied to archaeoseismology with the purpose of illustrating, depicting and quantifying some of the most significant, preserved deformations caused by an earthquake in the late fourth century AD in the ancient Roman City of Baelo Claudia in South Spain [8,9].
The Roman city of Baelo Claudia is one of the most renowned archaeoseismological sites in the Mediterranean, since its present remains preserve the impact of two different earthquakes during Roman times (first and fourth centuries CE; [9]) and the subsequent tsunami destruction that followed the last event [10,11]. The site has been the subject of deep archaeoseismological analyses, including geoarchaeological research, 2D GPR and ERT geophysical prospections [12,13,14,15], and 2D detailed mapping of damage [14,16], as well as complementary geological and paleogeographical analyses [11,12,14,17]. To date, all the compiled 2D information has followed the archaeoseismological classification and routines proposed by Rodríguez-Pascua et al. [18], presently synthetized and updated in the Springer Encyclopedia on Cultural Heritage [19,20]. This paper is focused on converting from a 2D rendering to a 3D digital format three emblematic, seismically damaged structures in the Roman site, including (a) the folded E-W Decumanus maximus of the city; (b) the tilted and cracked northern bastion of the city walls; and (c) a large marble dish from the baths surfed away by the tsunami backwash. This work represents a first step towards the enactment (development) of 3D modelling from drone imagery of the entire city to highlight archaeoseismic damage, but also the valorization of 3D modelling in the geological analysis of both particular geoarchaeological elements and the changing landscapes around key archaeological sites.

2. Archaeology and Archaeoseismology of Baelo Claudia

Baelo Claudia is a well-known ancient Roman city located on the edge of the Gibraltar Strait (Cádiz, South Spain) in the Bolonia Bay (Tarifa, Cádiz). The geology of the area is complex, embedded in the Cretaceous to Eocene flysch units of the Betic Cordillera (Figure 1). However, the archaeological site is totally located on marly Cretaceous materials (Bolonia Fm.), with some more competent interbedded limestone levels originating minor scarps. Towards the littoral sector of the city, some marine terrace formations developed during the middle–late Pleistocene, giving place to the stair-cased coastal landscape on which the old city was built. Geotechnical boreholes in the theatre sector (S2 in Figure 2) identify a buried late Pleistocene terrace at +13–14 m above sea level [9]. Upper terraces at +20–22 m border the lower monumental sector of the city, and more recent terrace levels at +7–8 m constitute this lower plateau of the city. In any case, this lower plateau is buried by thick post-Roman colluvium and aeolian deposits (Figure 2). In particular, the post-Roman dunes buried most of the lower sector of the city after its abandonment [9], preserving the seismic deformations analyzed in this paper.
The city developed from the first century BCE to the late fourth century CE. The writings of the Greek geographer Strabo (first century CE) indicate that the site was the main harbor in the westernmost Mediterranean during the time of the Roman Empire [8]. Strabo described this old settlement (Belon) as an important industrial fishing and “garum” center, as well as the main port for reaching the Mauritania Tingitana (North Africa) on the other side of the Strait of Gibraltar (Figure 1). It is important to note that the sole written documents that mention Belon in antiquity come from the work of Strabo [8]. The rest of the history of the city has been built from the successive archaeological findings (coins, ceramics, epigraphy, architectural styles, etc.) from excavations undertaken at the site since the early 20th century [8]. Archaeological excavations in the city evidence three distinct urban periods, which are separated by important discontinuities in the geoarchaeological record [9]. Since the early 1980s, these archaeological discontinuities have been linked to the occurrence of seismic events [8,21,22]. Later studies [9,13,14] clearly indicate the occurrence of two intervening earthquakes in the years 40–60 AD and 365–390 AD as the most decisive events in the urban development of this ancient Roman city. Both earthquakes are catalogued as “ancient earthquakes” only evidenced by their archaeoseismological record, since there are no historical writings documenting these two earthquakes. Both are presently included in the Catalogue of Geological Effects of Earthquakes in Spain [23].
The first earthquake is documented by the large works carried out in the lower sector of the city, which underwent important topographic and levelling works to build the new Baelo Claudia, obtaining the status of “Roman City” around the year 60 AD [8,21]. The old town of Belon (described by Strabo) was nearly destroyed and buried by a thick “demolition horizon” above which a new monumental zone (Forum, Basilica, Theatre, Temples, etc.) was rebuilt; additionally, some parts of the city wall damaged by the earthquake were repaired or reinforced [9]. This new city experienced a period of prosperity, including the construction of many garum fishing factories and the enlargement and monumentalizing of the eastern necropolis of the city [25,26].
Evidence of the second earthquake, which occurred during the late fourth century CE (365–395 AD), is largely preserved in the present architectural remains of the archaeological site. Seismic damage is visible in walls, columns, arches and pavements, that is, in both vertical and horizontal structures, which led to the 2D and 3D geometrical study of the deformations by means of the application of a typical analysis of structural geology [13,16,19]. All the preserved deformations can be catalogued as representative “Earthquake Archaeological Effects” (EAEs) according to the classification of [18,20]. These EAEs include: (a) fractures, folds and pop-up structures in pavements; (b) strain structures generated by permanent ground deformations, such as tilted, displaced, folded or collapsed walls and shock breakouts in flagstones; and (c) strain structures generated by transient seismic shaking, such as penetrative and conjugated (x-cross) fractures in masonry blocks, oriented fallen columns, rotated and displaced masonry blocks in walls and drums, dropped key stones in arches, folded steps and curbs, block impact marks in pavements and dipping broken corners in masonry blocks. The geological analyses of this set of different EAEs indicate an oriented damage of seismic origin, indicating a predominant NE–SW deformation of the ground congruent with a seismic source (fault) located to the SW of the city around the Bolonia Bay (Figure 1). Geological and geophysical analyses indicate that the NE–SE Cabo de Garcia Fault (CGF) or the set of NNE–SSW normal faults identified by the German Scientific Ship “Meteor” within the Bay may be the suspected seismogenic source for this ancient earthquake [13,15].
This second earthquake was followed by a tsunami, probably of local origin since there is no contemporary sedimentary evidence in other key studied locations around the Bolonia Bay [11,24], which is in accordance with the local seismic sources mentioned above. This destructive event was first documented within the city by Röth et al. [10], reporting its sedimentary signals in the Decumanus maximus and the littoral termas, which retained a large amount of tsunami backwash deposits archaeologically dated to the late fourth century. More recent studies document this tsunami layer in several sectors inside and outside the city walls, in the eastern necropolis [25] and within the adjacent ancient lagoonal area [11]. The tsunami layer is a dark, cohesive sandy deposit (28 to 52 cm thick) containing fragments of pottery, fish and animal bones, glassware and bricks, as well as large boulders of masonry blocks and column drums washed away by the tsunami. The layer also contains microfaunal assemblages with a mixture of benthic and planktonic foraminifera typical of tsunamites, as well as lagoonal brackish water gastropods and numerous shell debris and broken foraminifera reworked from the ancient embayment. These deposits reach a maximum elevation of about +8 m above the present sea level, which can be related to tsunami waves of 5 m in height, and they have been interpreted as backwash deposits trapped within the ruins of the city after the earthquake’s destruction [24]. Recent findings in the eastern necropolis record a destroyed mausoleum from the late second century in which the stratigraphy shows the earthquake destruction layer (with NE–SW collapsed marble columns and epigraphy) buried by the dark tsunami layer. Numismatic and pottery findings below the collapsed columns archaeologically date the earthquake–tsunami event between the years 360 and 400 AD [25], which is in agreement with previous archaeological dating within the city [10] and radiocarbon dating of the tsunamites (sedimentary cores) within the ancient lagoonal area [11].
In summary, the archaeological site of Baelo Claudia constitutes an open-air “archaeoseismological museum” in which the generation of 3D modelling is feasible and can work as models for analyzing other ancient sites affected by natural destructive events. Highlighting the main buildings cited in the text with enlarged images of the 3D models analyzed, we modelled 3D deformations in the vertical (city wall) and horizontal (Decumanus) planes caused by the fourth century earthquake, as well as representative architectural features affected by the subsequent tsunami, such as the marble dish on top of the tsunami deposits and the small aqueduct (Figure 3).

3. Materials and Methods

3.1. Methods

To realize the 3D models of each architectural element studied in this work, the following methodology was used:

3.1.1. Image Acquisition

The images were taken with a DJI Mavic 2 Pro drone with a weight of 907 g, a battery autonomy of 32 min and a maximum speed of 72 km/h. The images were taken with GPS + GLONASS positioning, whose accuracy was ±0.5 m vertically and ±1.5 m horizontally. The camera carried by the drone was a Hasselblad RGB (Red, Green, Blue) with a 1” CMOS sensor and 20MP. The camera’s lens had a FOV of 77° and an aperture of 2.8–11.
Different flight plans were made to obtain images depending on the characteristics of the element to be mapped. The design and execution of the flight plans were carried out with the drone-link software. The different flight plans were:
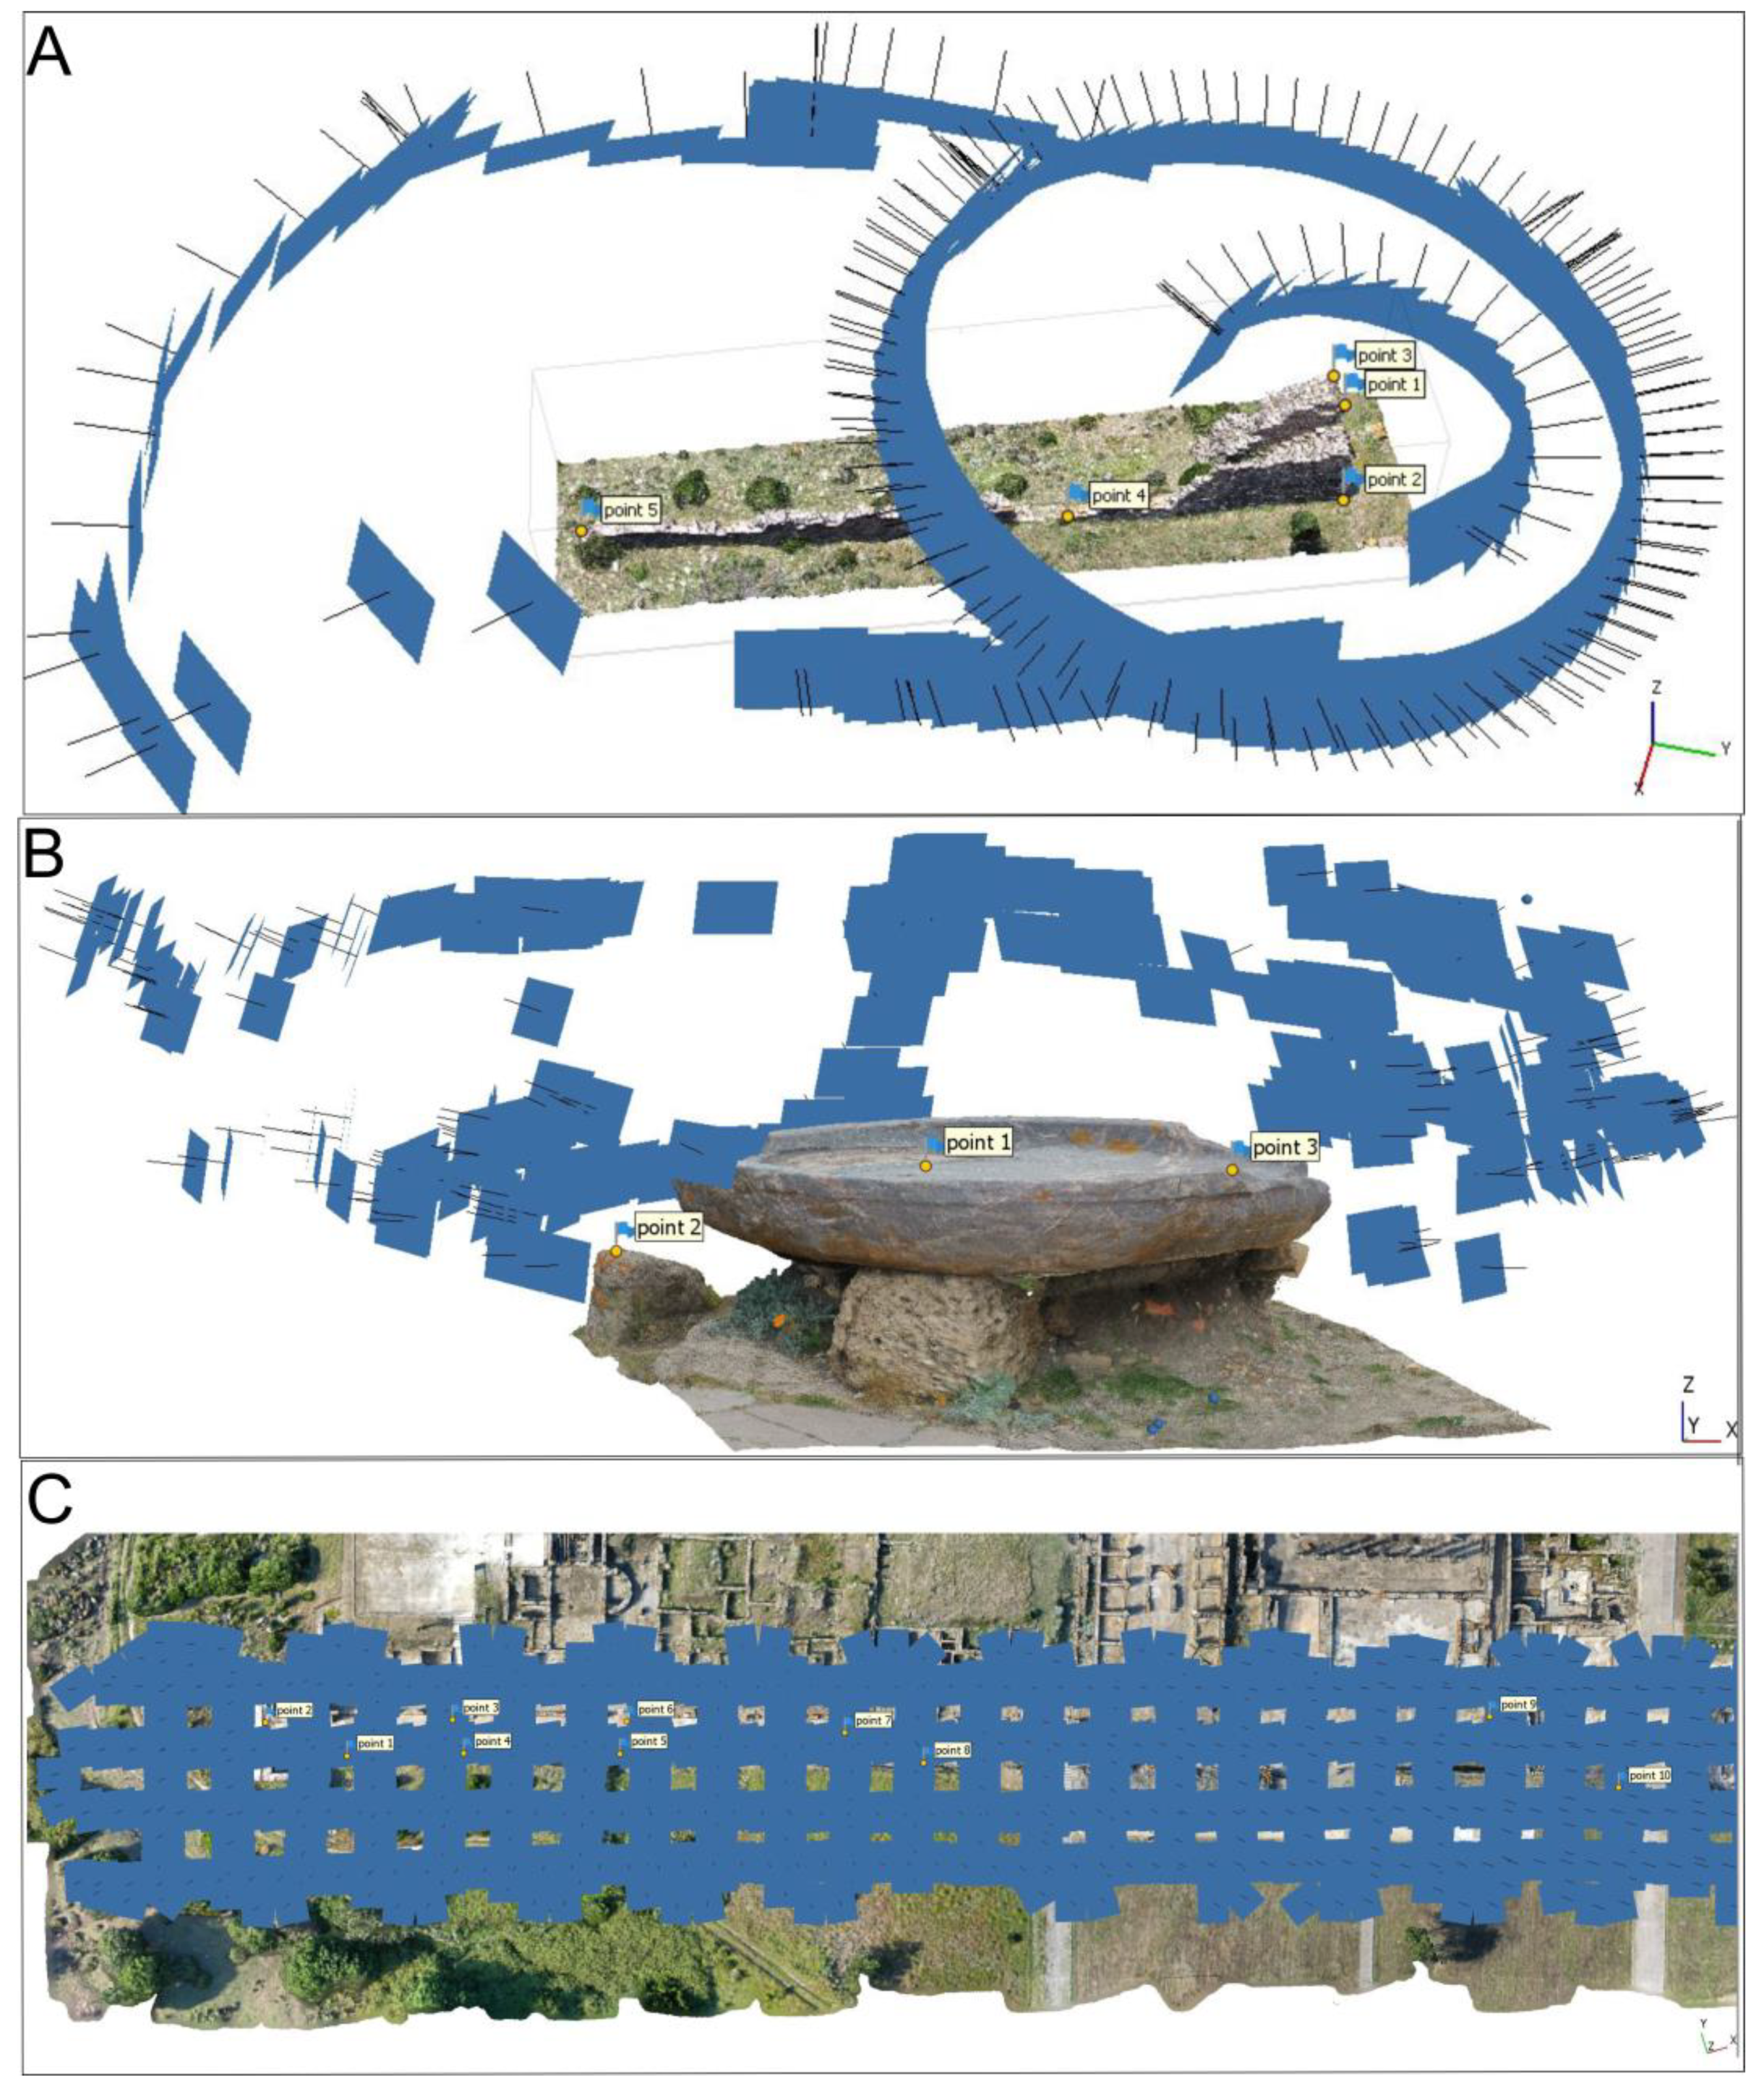
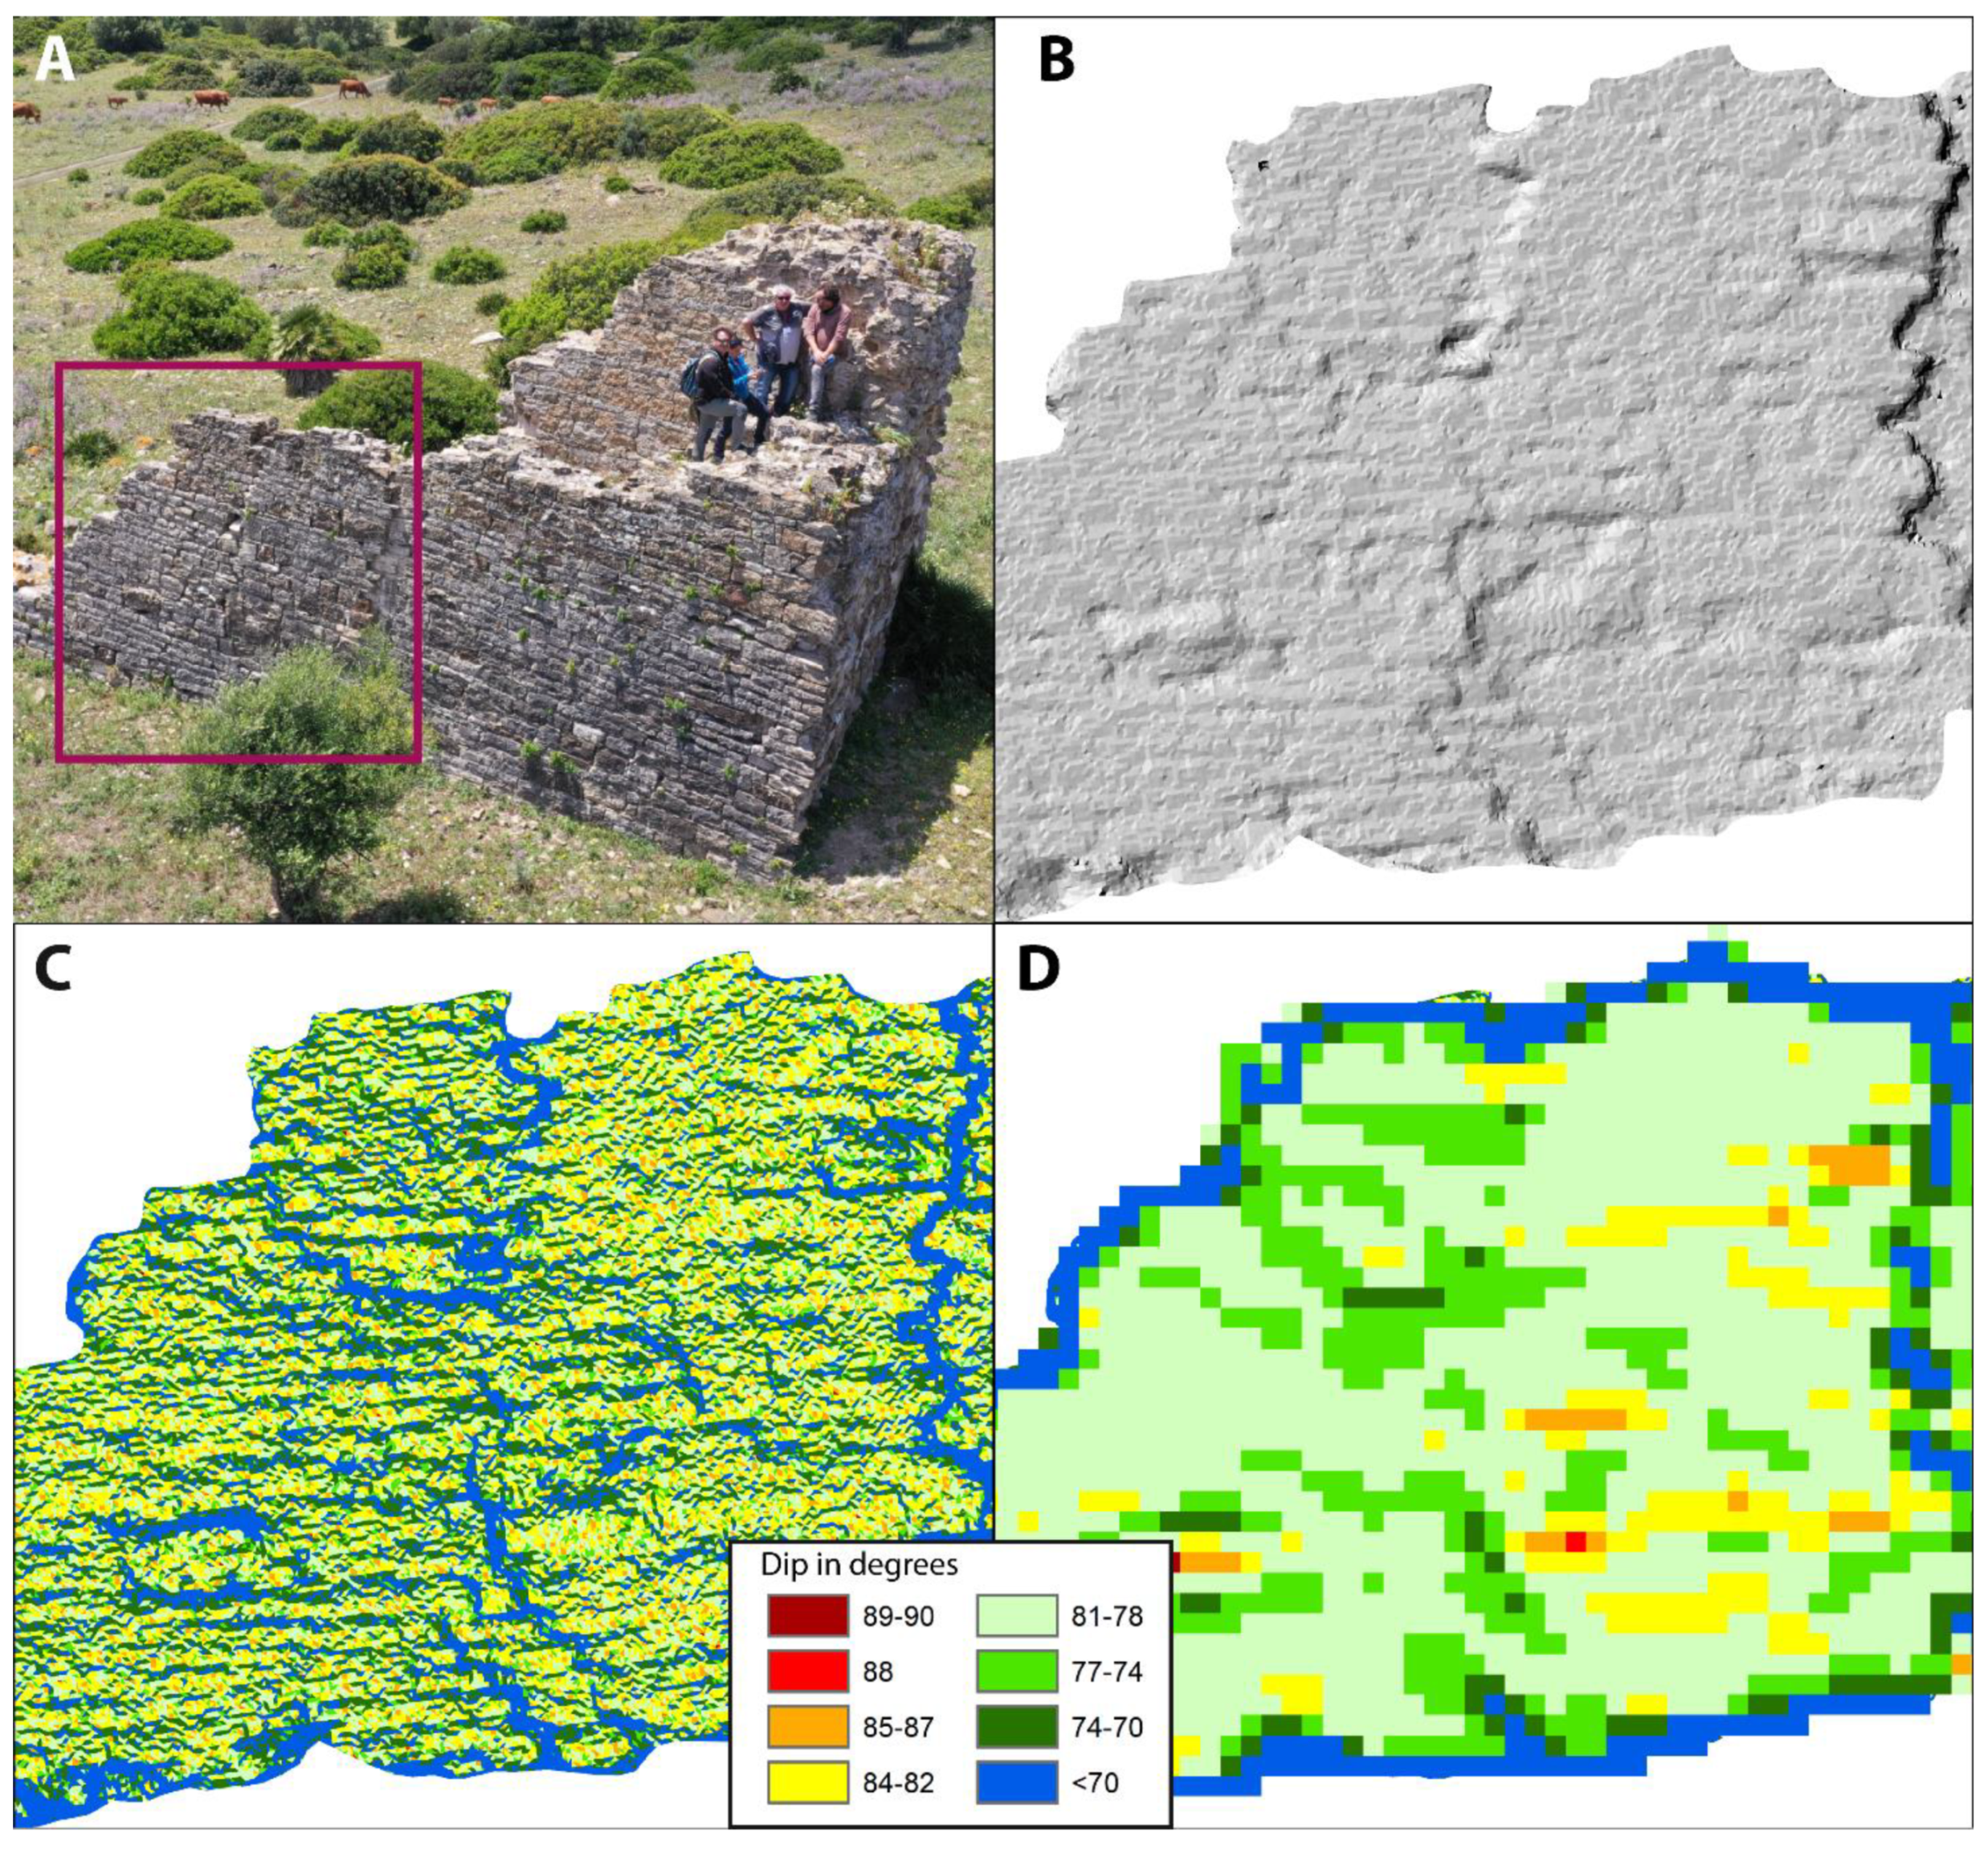
  • North City-Wall Bastion: A set of two flights were made, the first flight in orbit 12 m above the ground to obtain a 3D modelling (Figure S1) with maximum resolution of the north bastion complemented with a second ellipse 13 m above the ground to map the junction of the bastion to the wall. Finally, 221 images were taken (Figure 4A).
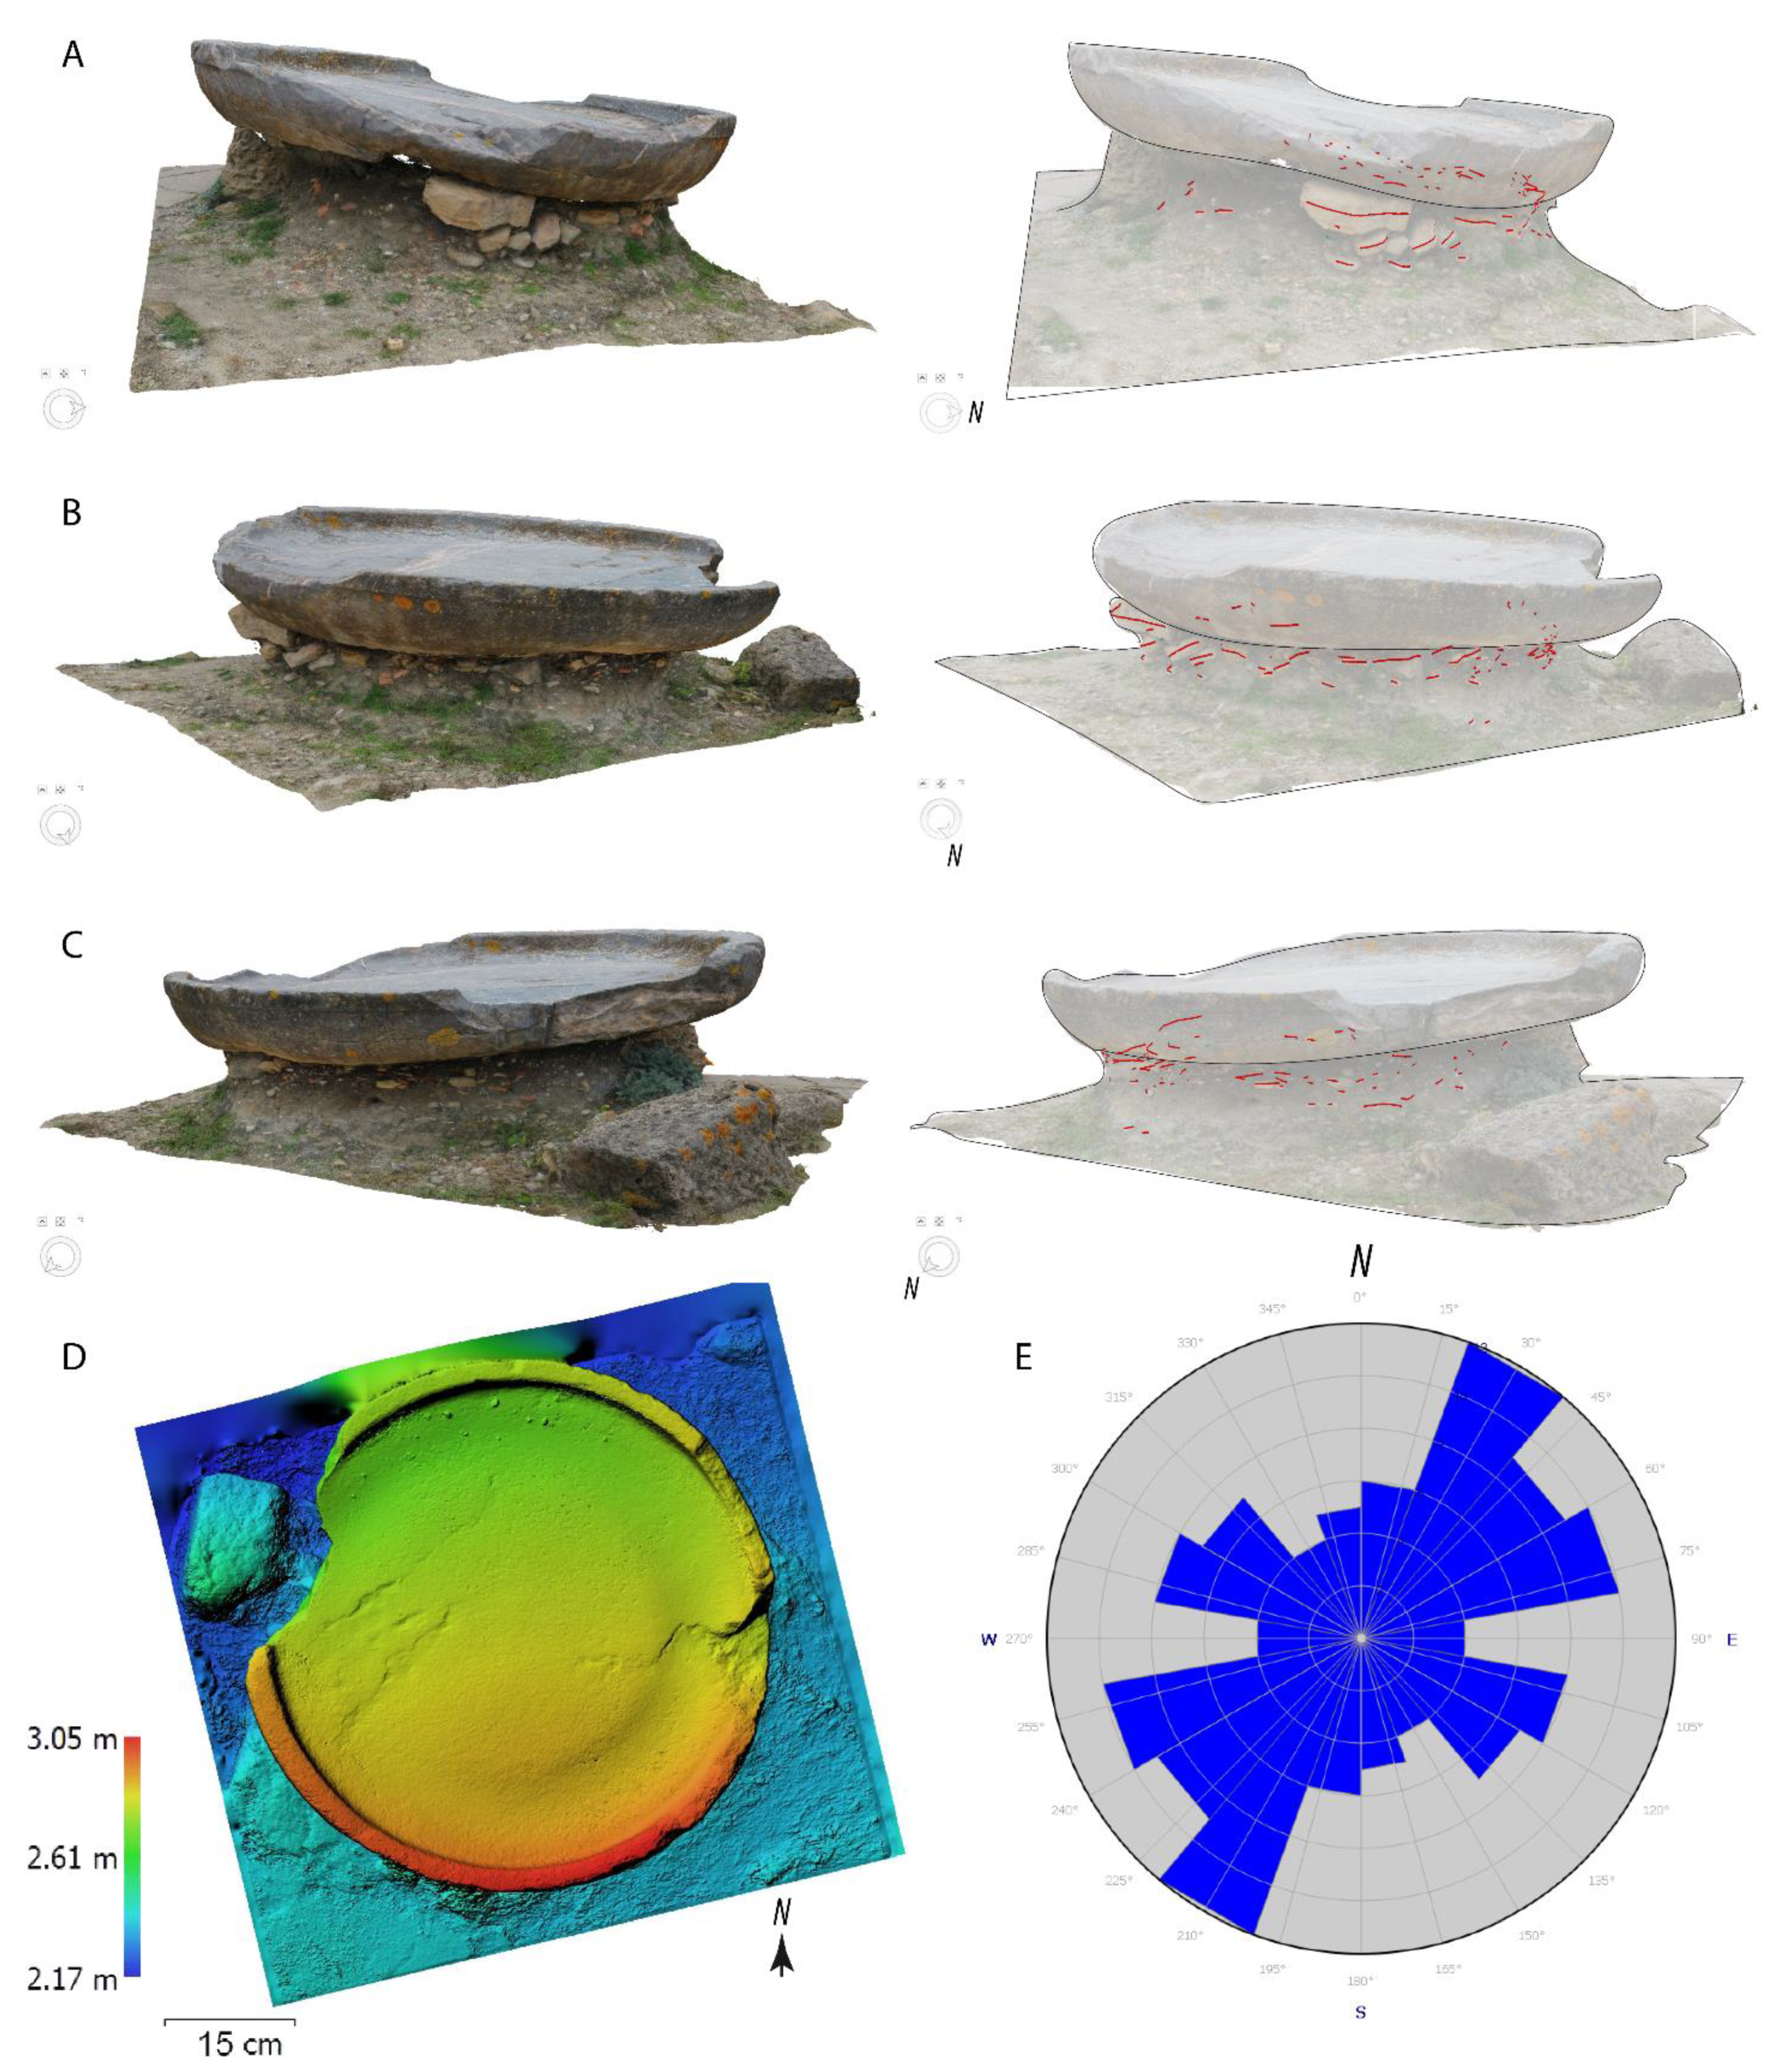
  • Marble dish tsunami: The drone was flown several times in orbit at different heights from the ground (0.5, 0.75 and 1 m) and at a distance from the object ranging from 0.5 to 2 m in order to obtain both the tsunamite in high resolution and the inclination, direction and modelling of the arrays (Figure S2). Finally, a total of 295 photographs were taken (Figure 4B).
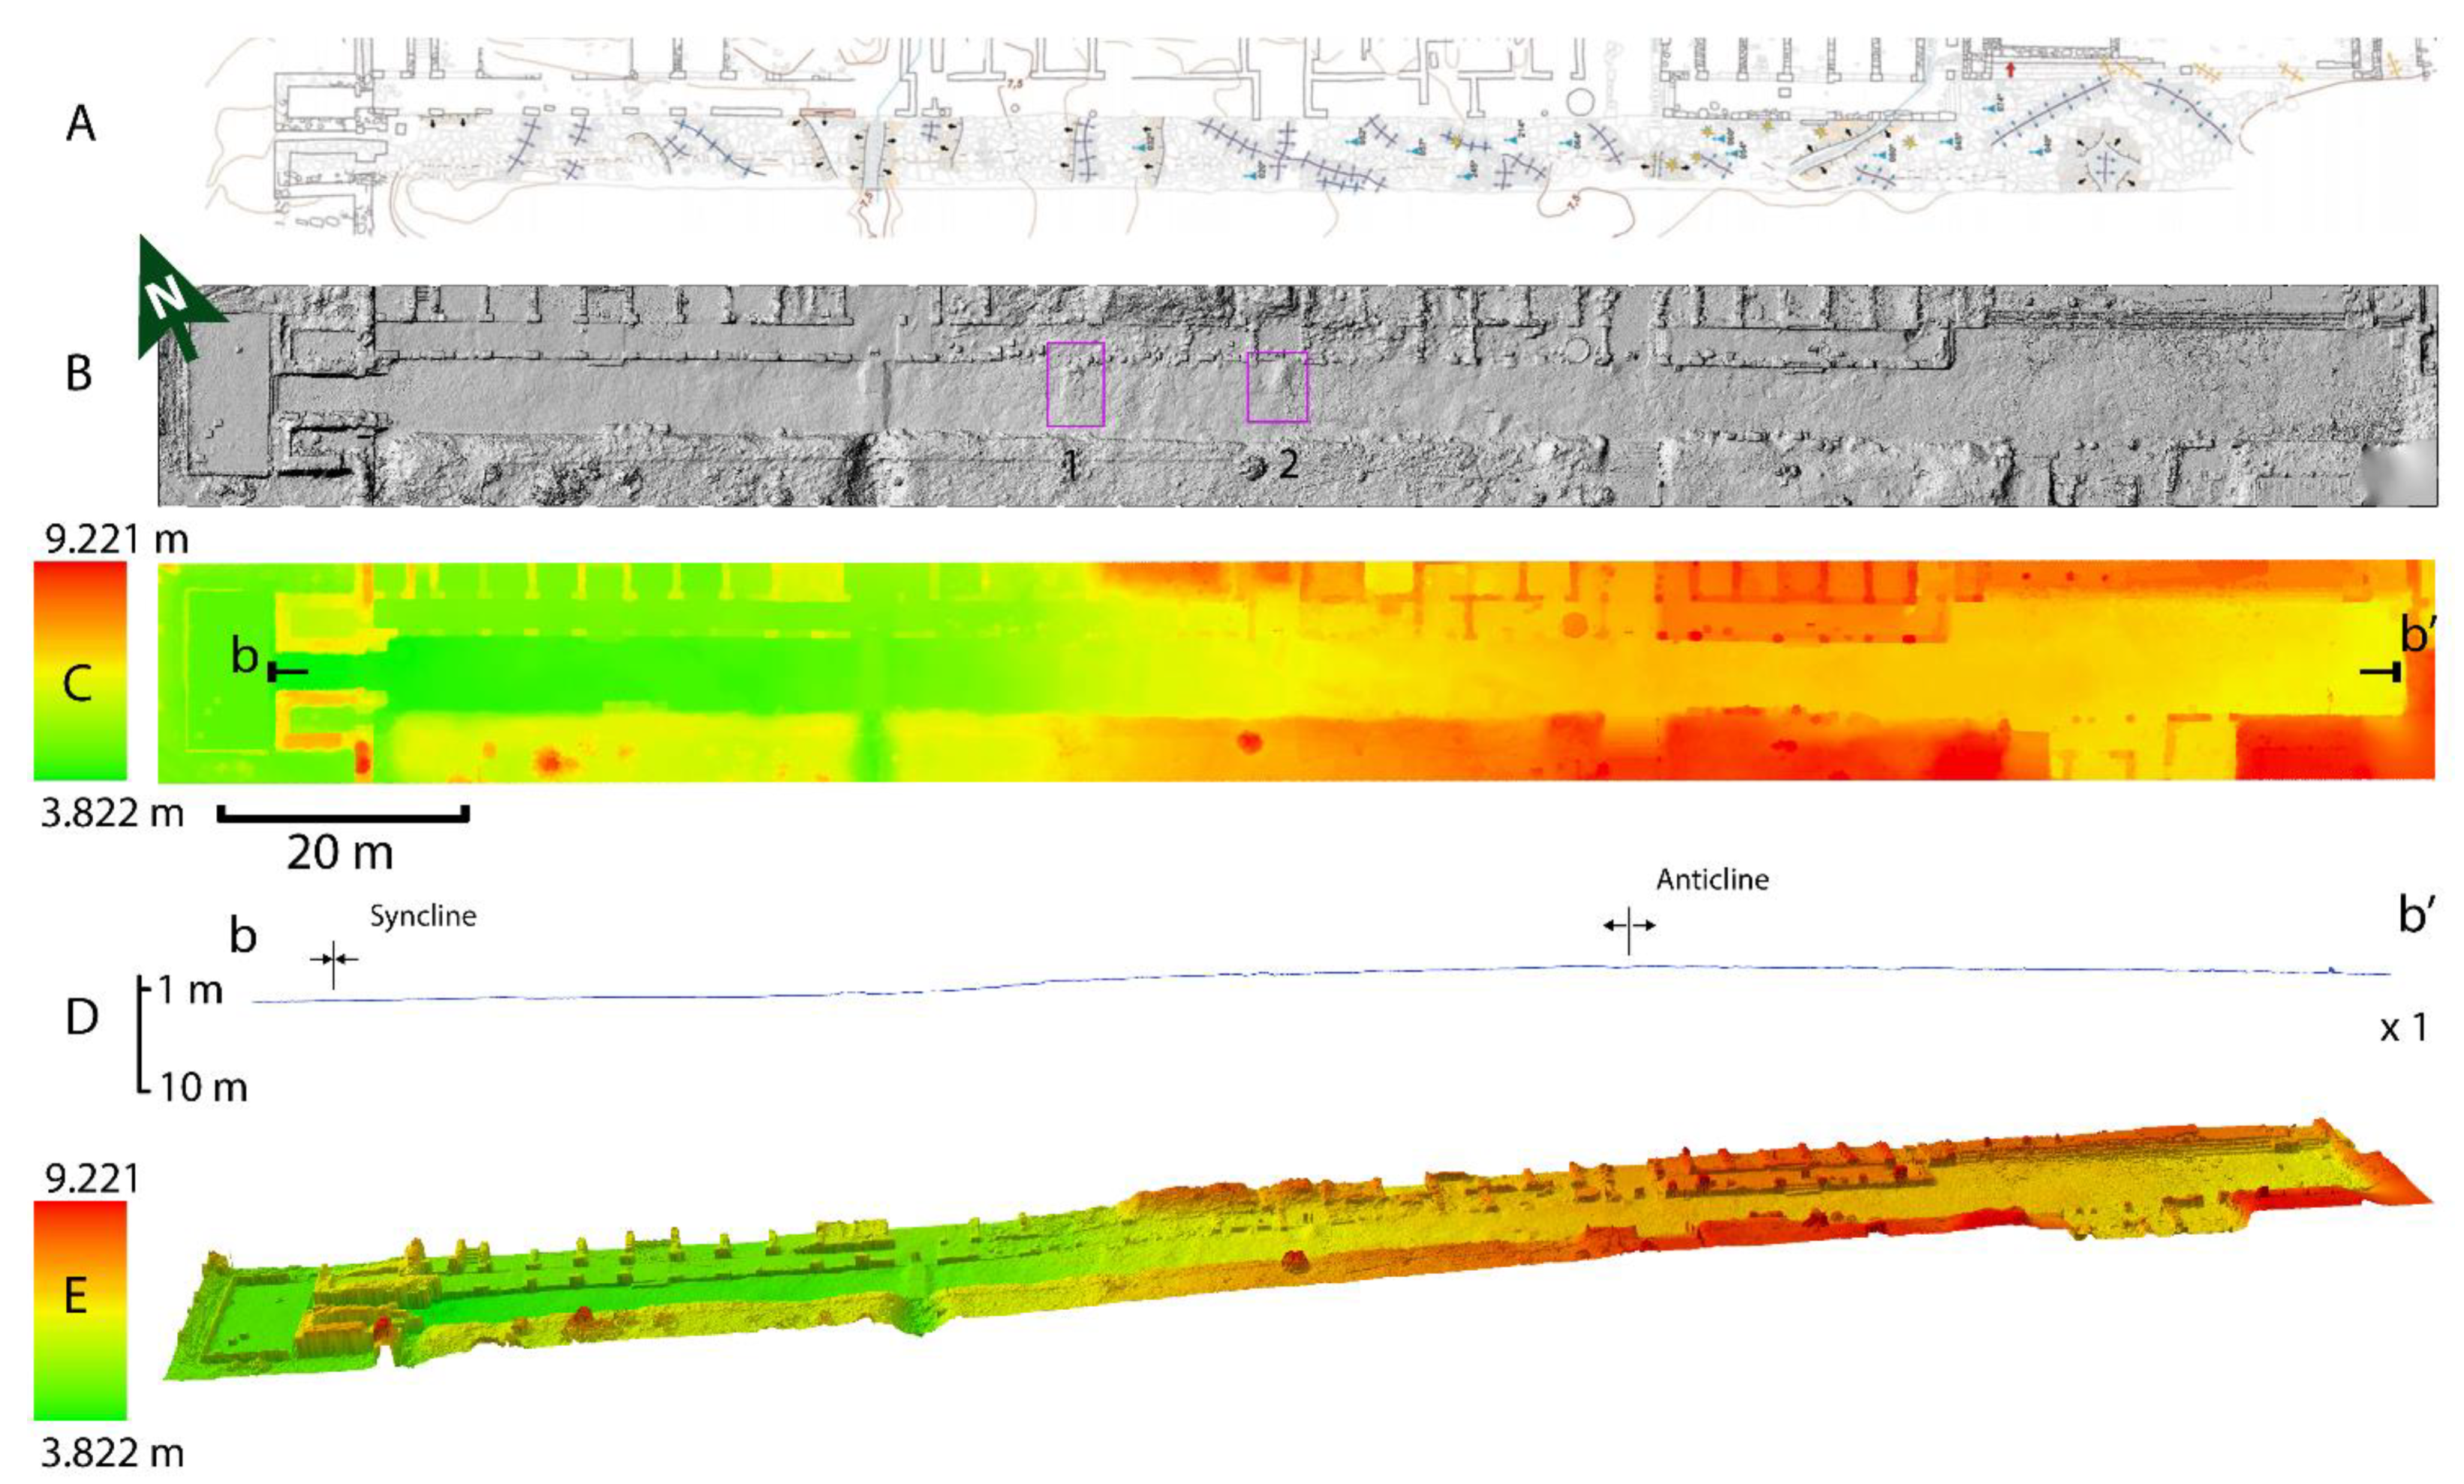
  • Folded Decumanus maximus: A grid flight plan was made at a flight altitude of 30 m, with an overlap of 80% front and 70% side, finally taking 350 photos (Figure 4C).

3.1.2. Control Points

To adjust the position of the images, control points were determined on the different surfaces and vertices of the elements to be studied using the GNSS receiver Leica’s FLX100. The receiver was capable of receiving GPS, GLONASS, Galileo and Beidou signals and was connected to the National Reference Geodetic Network of GNSS Permanent Stations (ERGNSS) for on-the-spot topographic correction. It had a real-time planimetric accuracy of 2 cm and altimetric accuracy of 3 cm.
For the treatment of the coordinates, we used the software TcpGPS for Aplitop, which allows the calculation of coordinates according to the ETRS89-UTM Reference System, the official system in Spain.
The RMSE of each model was calculated from the positioning of the images and the control points, obtaining errors mostly lower than 1 m (Table 1) (Figure 4).

3.1.3. Data Processing

Agisoft Methashape Professional was used to process the images obtained from the flights, which included alignment, orientation, scaling and the generation of point-cloud models and orthophotographs. This software, together with the number of images and data to be processed, had immense hardware requirements; an ASUS WS X299 PRO ATX Workstation with 128 Gb of DDR4-2666 RAM and Intel® Core i9-10900X processor at 3.7 GHz, 2 NVIDIA GeForce RTX 2080 Super 8 GB GDDR6 graphics cards with 3072 NVIDIA® CUDA® Cores and HD SSD of 1Tb capacity were used.

3.1.4. Geological Applications of 3D Models

The applications presented here revolve around a series of characteristic elements within the city of Baelo Claudia that we have considered representative of the different working techniques both in the acquisition of data and in the subsequent processing and modelling using GIS (Geographical Information System) environments. The interest lies in obtaining and quantifying parameters related to the deformation and damage suffered during the earthquakes and tsunami that are recorded in the various architectural elements of the Roman city (see, for instance, [14]).
In the case of the Decumanus máximus, a photogrammetric reconstruction was obtained from the aerial photographs from a flight at 30 m in elevation, from which a DEM (Digital Elevation Model) of 1.5 cm pixels was interpolated. Hillshade elevation models (Figure 5), hypsometric models and the topographic profiles that will be presented later can be derived directly from this DEM. In addition, and in order to obtain partial 3D models of more detailed structures within the Decumanus máximus, more detailed DEMs with 3 mm pixels were obtained, capable of perfectly illustrating even the Decumanus máximus tiling and all the structural details of the different existing geological structures.
For the tsunami-transported marble dish, the 3D photogrammetric reconstruction obtained in Metashape was exported to KMZ format. This preserved the real georeferencing and textures in ArcGIS Pro, which could be directly photo-interpreted so that the interpretations were registered, georeferenced and dimensioned in 3D. From the interpretation performed, the management of the data obtained in ArcGIS Pro was quite straightforward.
Not only in the archaeoseismological scenarios, but in any current seismic scenario, it is common for buildings to suffer deformations and damage in the walls. These deformations, in many cases, are very characteristic and easily identifiable (e.g., [19,20]), but given their location in vertical areas and far from the ground, they are difficult to access; therefore, they present difficulties for parameterization and quantification. In addition to this, DEMs are usually obtained (and computed) as elements in “plan view”, the same as in traditional topography. To apply the full potential of GIS to this type of vertical element, such as walls, we decided to treat the elevation view of the walls of the buildings as maps with their own topography. In this case, we decided to apply this workflow to the North City-Wall Bastion of Baelo Claudia, specifically the east side of the city wall, which presents a remarkable level of preservation (Figure 3 and Figure 5). This wall is N162E-oriented, shows strong deformation (both in the form of vertical axis folds and fractures) and nowadays is nearly vertical (Figure 3). For this work, once the appropriate photogrammetric reconstruction was performed in 3D (Figure 5A), we proceeded to isolate the data related only to the E wall of the architectural element. Once the photogrammetric reconstruction points of the 3D mesh were isolated, they were rotated 90 degrees clockwise from the base of the wall and with the axis parallel to the main direction of the wall (Figure 5B,C). This allowed the topographic reconstruction of this wall panel from almost vertical to almost horizontal (Figure 5C,D). This was done without distorting the overall dimensions of the reconstruction, just a rotation. The election of the main direction and the location of the rotation axis was relevant to illustrate the correct dimensions of the deformation suffered. In this case, we located the axis tangent at the most external part of the wall, cero vertical deviation (green colors in Figure 5E). In seriously deformed structures, it can be difficult to locate a “main direction”, and it is recommended to segment the study area into areas with similar characteristics to minimize subjectiveness.
Subsequently, we obtained a DEM of the wall thus rotated 90 degrees and therefore now horizontal so that, by means of GIS computing, we could fully reach the potential of elevation data management that a GIS usually provides; see, for instance, a good-quality hillshade model in Figure 5D and a hypsometric distribution in Figure 5E. It is worth noting that, due to the rotation of the original topographic elevation points, the results of all GIS workflows and algorithms must be reinterpreted. For instance, a slope algorithm will offer the complementary angle of the actual slope due to the 90-degree rotation. This angle will identify the deviation from the vertical (90 degrees) suffered during the earthquake and, hence, the changes in dip from pre- to post-earthquake situation. Moreover, in a GIS environment, an aspect algorithm usually identifies the direction to which the downward slope points at each location for a DEM, and this slope characterizes the areas facing N, S E and W. However, after the rotation is applied to the elevation data of the studied wall, the aspect algorithm will now only identify left and right and vertical up and down. As the overall orientation of the wall is N162 E, the aspect domains can clearly be correlated as broadly NNW–SSE oriented, and the flanks and axis of existing vertical folds can be identified (this will be discussed later in the next sections). In the same manner, the hypsometric model of the rotated DEM of the wall (Figure 5E) indicates the separation (horizontal) in cm from a vertical plane with zero displacement from the ground, on the rotation axis.
As we will see, all these models allow the precise identification and quantification of the deformation suffered in this wall, which would otherwise be quite difficult due to access and the overall low magnitude of the deformation in the fracturing, tilting and folding of this structure.

4. Results

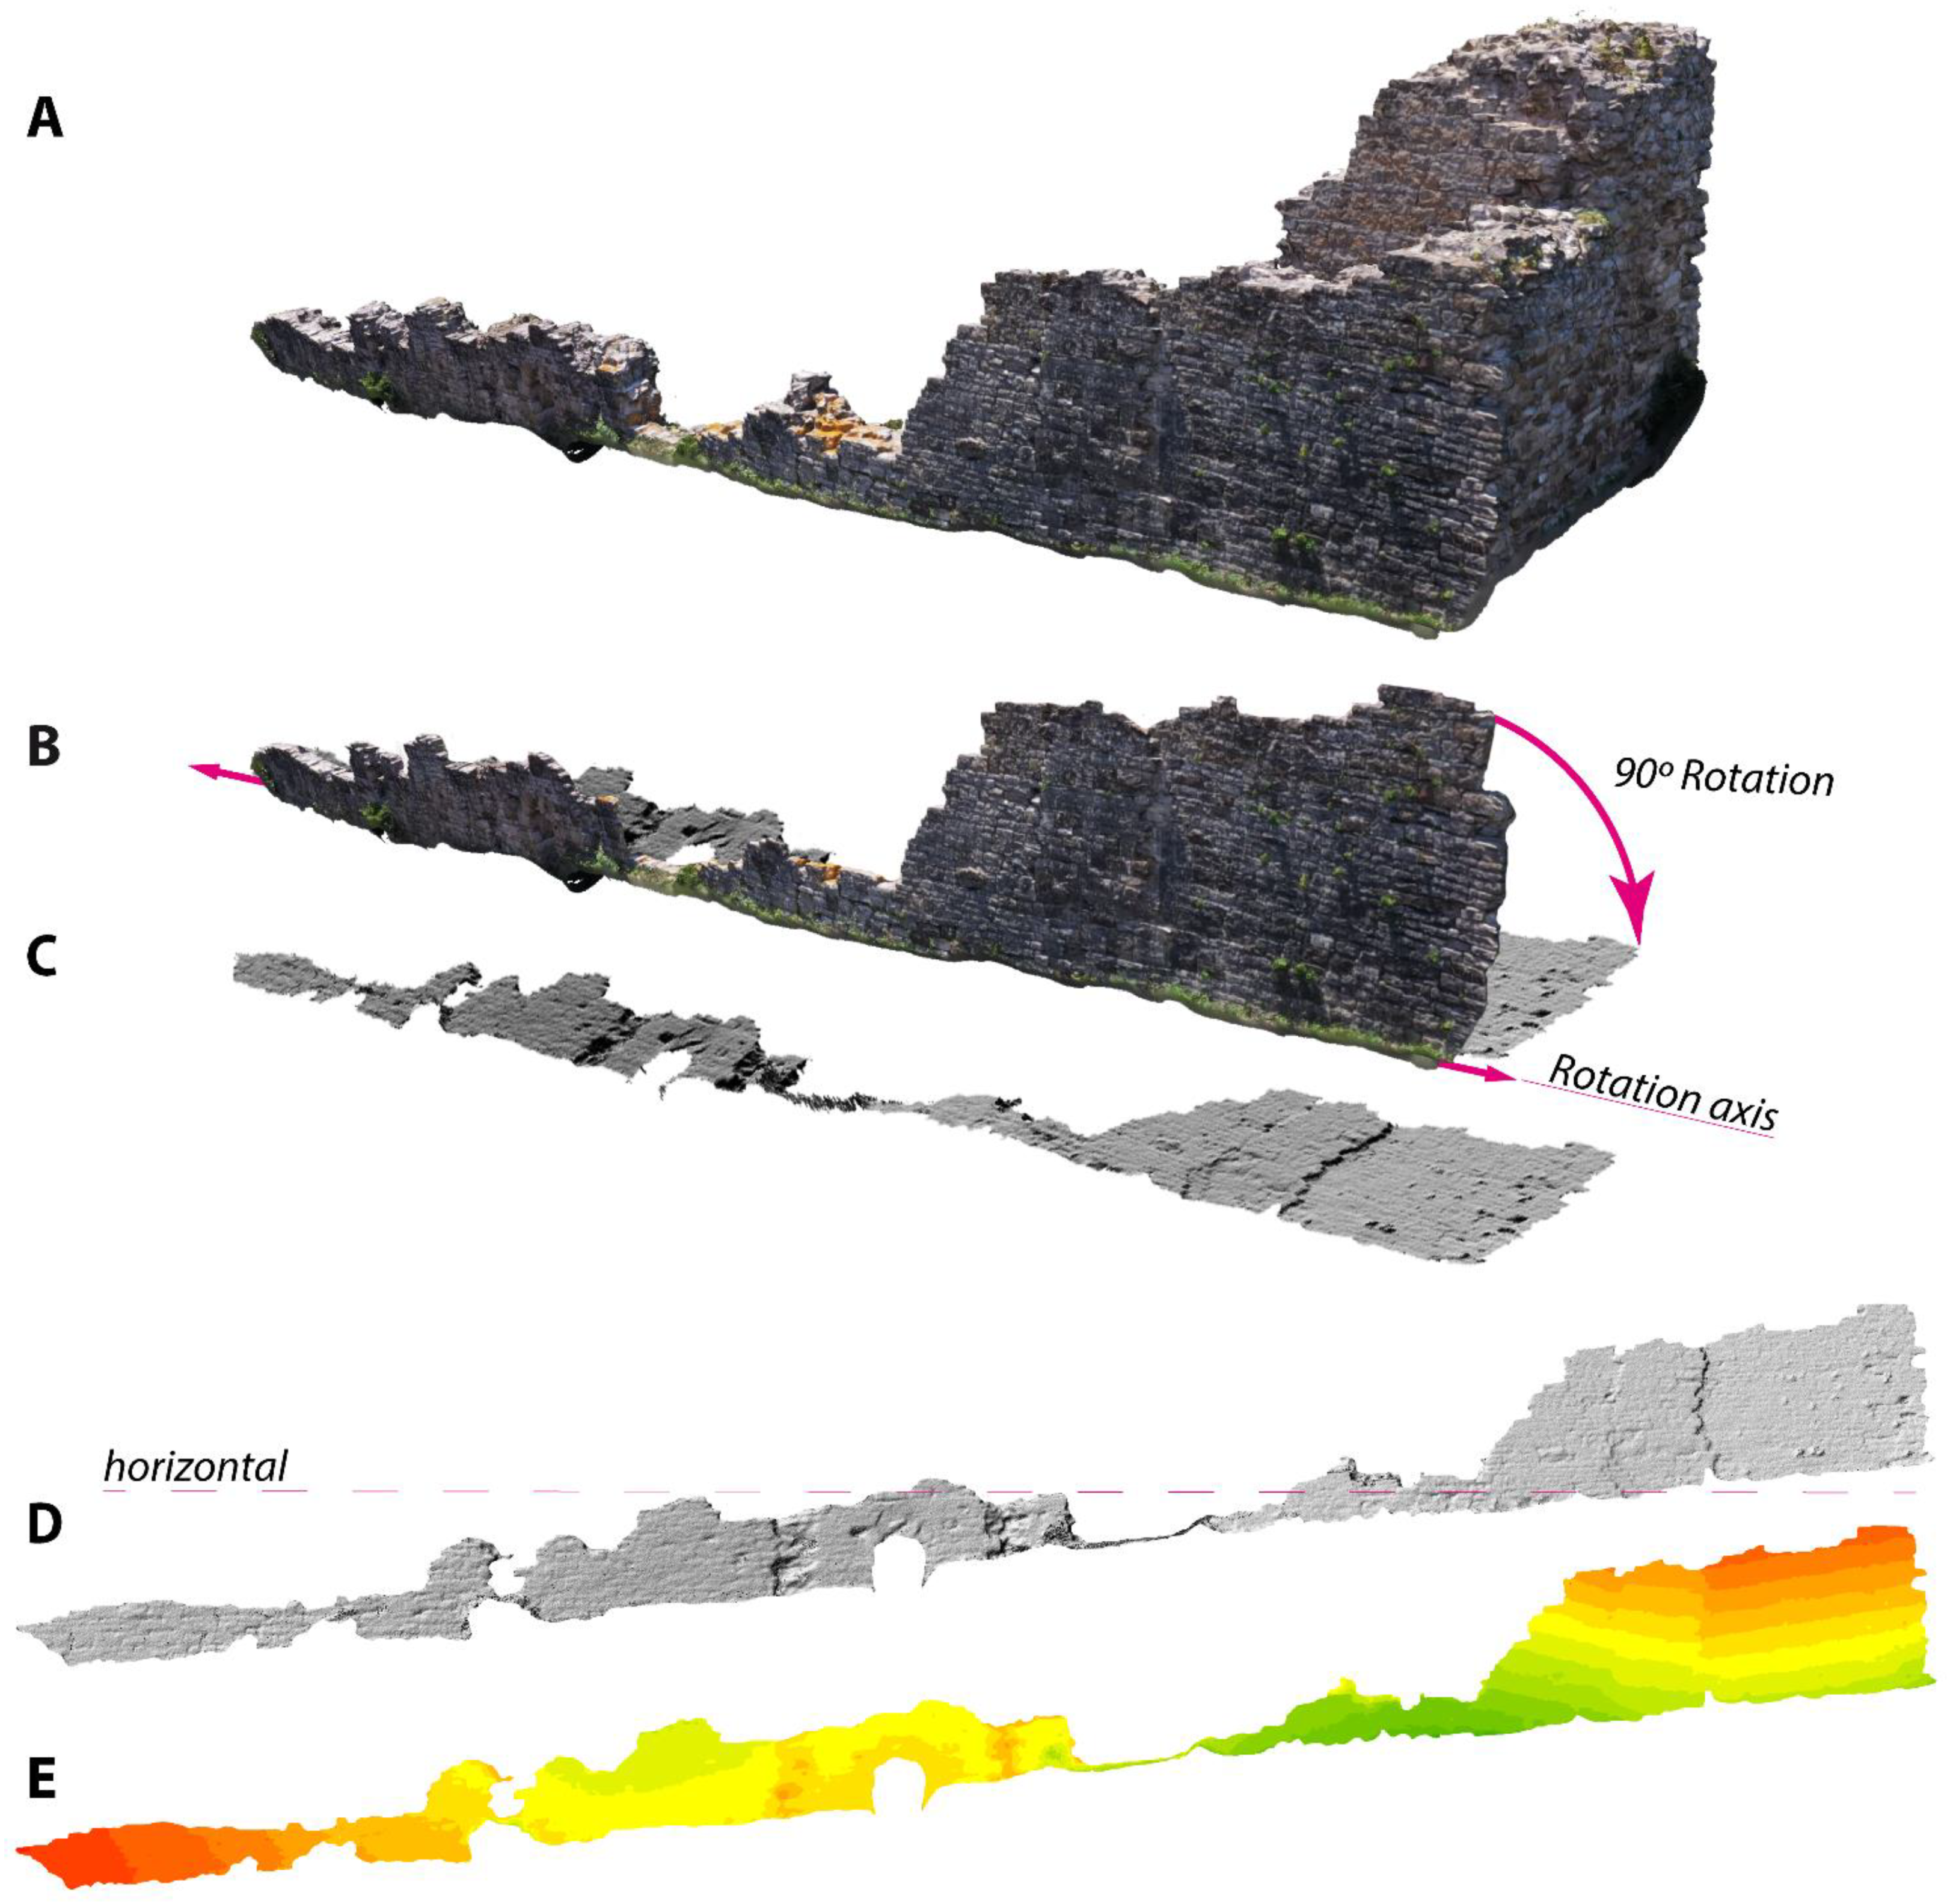
4.1. Quantifying the Deformation of the North Bastion of the City Wall

What remains of the northern bastion of the city wall (Figure 3(1)) is a sturdy 1.25 m wide piece of wall made up of limestone ashlars and crowned by a solid bastion up to 6 m thick. Nowadays, a segment of the city wall 49 m in length is archaeologically conditioned and preserved. The city wall and bastion are strongly deformed. In the field, tilting of up to 30 degrees from the original 90 degrees at which the wall and bastion were built can be measured. Seen in plan view, the entire construction is also deformed by a series of folds with a vertical axis that give a wavy appearance to what remains of the wall (Figure 6A).
Once a DEM of the eastern canvas of the wall was obtained and rotated 90º for convenience (see Figure 5 in the methodological section), a series of derived models could be obtained. As usual, the hillshade model gave us a perception of the visual morphology of the reconstructed element, from which we can interpret and map the best-observed deformation features, in this case, the fractures (Figure 6B). On the other hand, a hypsometric distribution allowed us to characterize the domains/segments of the studied canvas that were tilted in a similar manner, which were also quite visible in the bastion (see Figure 6C). Additionally, the set of tilted domains defined the zones in which vertical-axis folds developed; these were very visible both in the wall near the bastion and southwards. This set of folds can be characterized in several ways and through various classical GIS algorithms, such as topographic profiles (Figure 6D), slope (Figure 6E) or aspect (Figure 6F). Based on the several obtained models, these vertical folds that developed on the city wall range between 11 and 6 m in wavelength, with maximum amplitudes of c. 30 cm and a minimum of only 9. It is worth noting that the axial trace of the folds was not rectilinear (Figure 6C), and the axial plunge (inclination direction of the fold axis) varied along the studied area, from eastward in the northernmost sector of the city wall to westward towards the south (Figure 6D). The axial plunge was also different for both sets of folds, in the range of 81–78° for the northernmost ones and of 82–88° for the southern ones.
In regards to the tilted segments in the bastion (north segment of the study area), it is remarkable how a detailed analysis of the hypsometric distribution (highlighting the tilted domains of the wall with similar dips) and slope over a very detailed DEM (1 mm pixel) allowed the identification and mapping of the exact fractures responsible for resolving the deformation with extreme precision (Figure 7).

4.2. Sedimentological Characterization of the Late Fourth Century CE Tsunami Deposit

The studied area is the remains of the archaeological excavation protected under a large (1.88 m in diameter and some tens of cm thick) bath dish made of black marble. This bath dish was probably transported with the tsunami following the earthquake in the late fourth century CE, trapping tsunamite deposits below [11,24,25]. Modern archaeological excavations exposed the marble bath dish and the deposits housed below—some 52 cm of hardly organized debris, which is dominantly sandy but includes fragments of bone, pottery, bricks, etc. The bath dish itself shows little damage, something relatively usual in mass transports such as tsunamite ones with high energy levels and charge of sediments but short times of displacement.
Under the bath dish, the tsunami deposit was poorly organized, but the major clasts showed a certain organization, displaying a clear reduction in the clast size of the deposit from SE to NW (Figure 8A–C), as well as a certain imbrication of the major clasts (Figure 8A). In general, the imbrication of clasts in a depositional system indicates not only the dominant flow direction but also a sense of sediment transport.
After mapping the aforementioned long axes of the largest clasts, we calculated the azimuth and size in a GIS environment. The largest clasts were approximately 60 cm in length, but the average value ranged around 10–11 cm. Regarding the orientation (Figure 8E), although there was some chaotic distribution typical of a not-well-organized deposit, the dominant transport direction was clearly NE–SW. From mapping and field inspection arise indications that the dominant imbrication direction is towards the SW (Figure 8E). Note that even the bathing plate is inclined (Figure 8D) and has a dip of seven degrees to the N, perfectly consistent with the described imbrication.

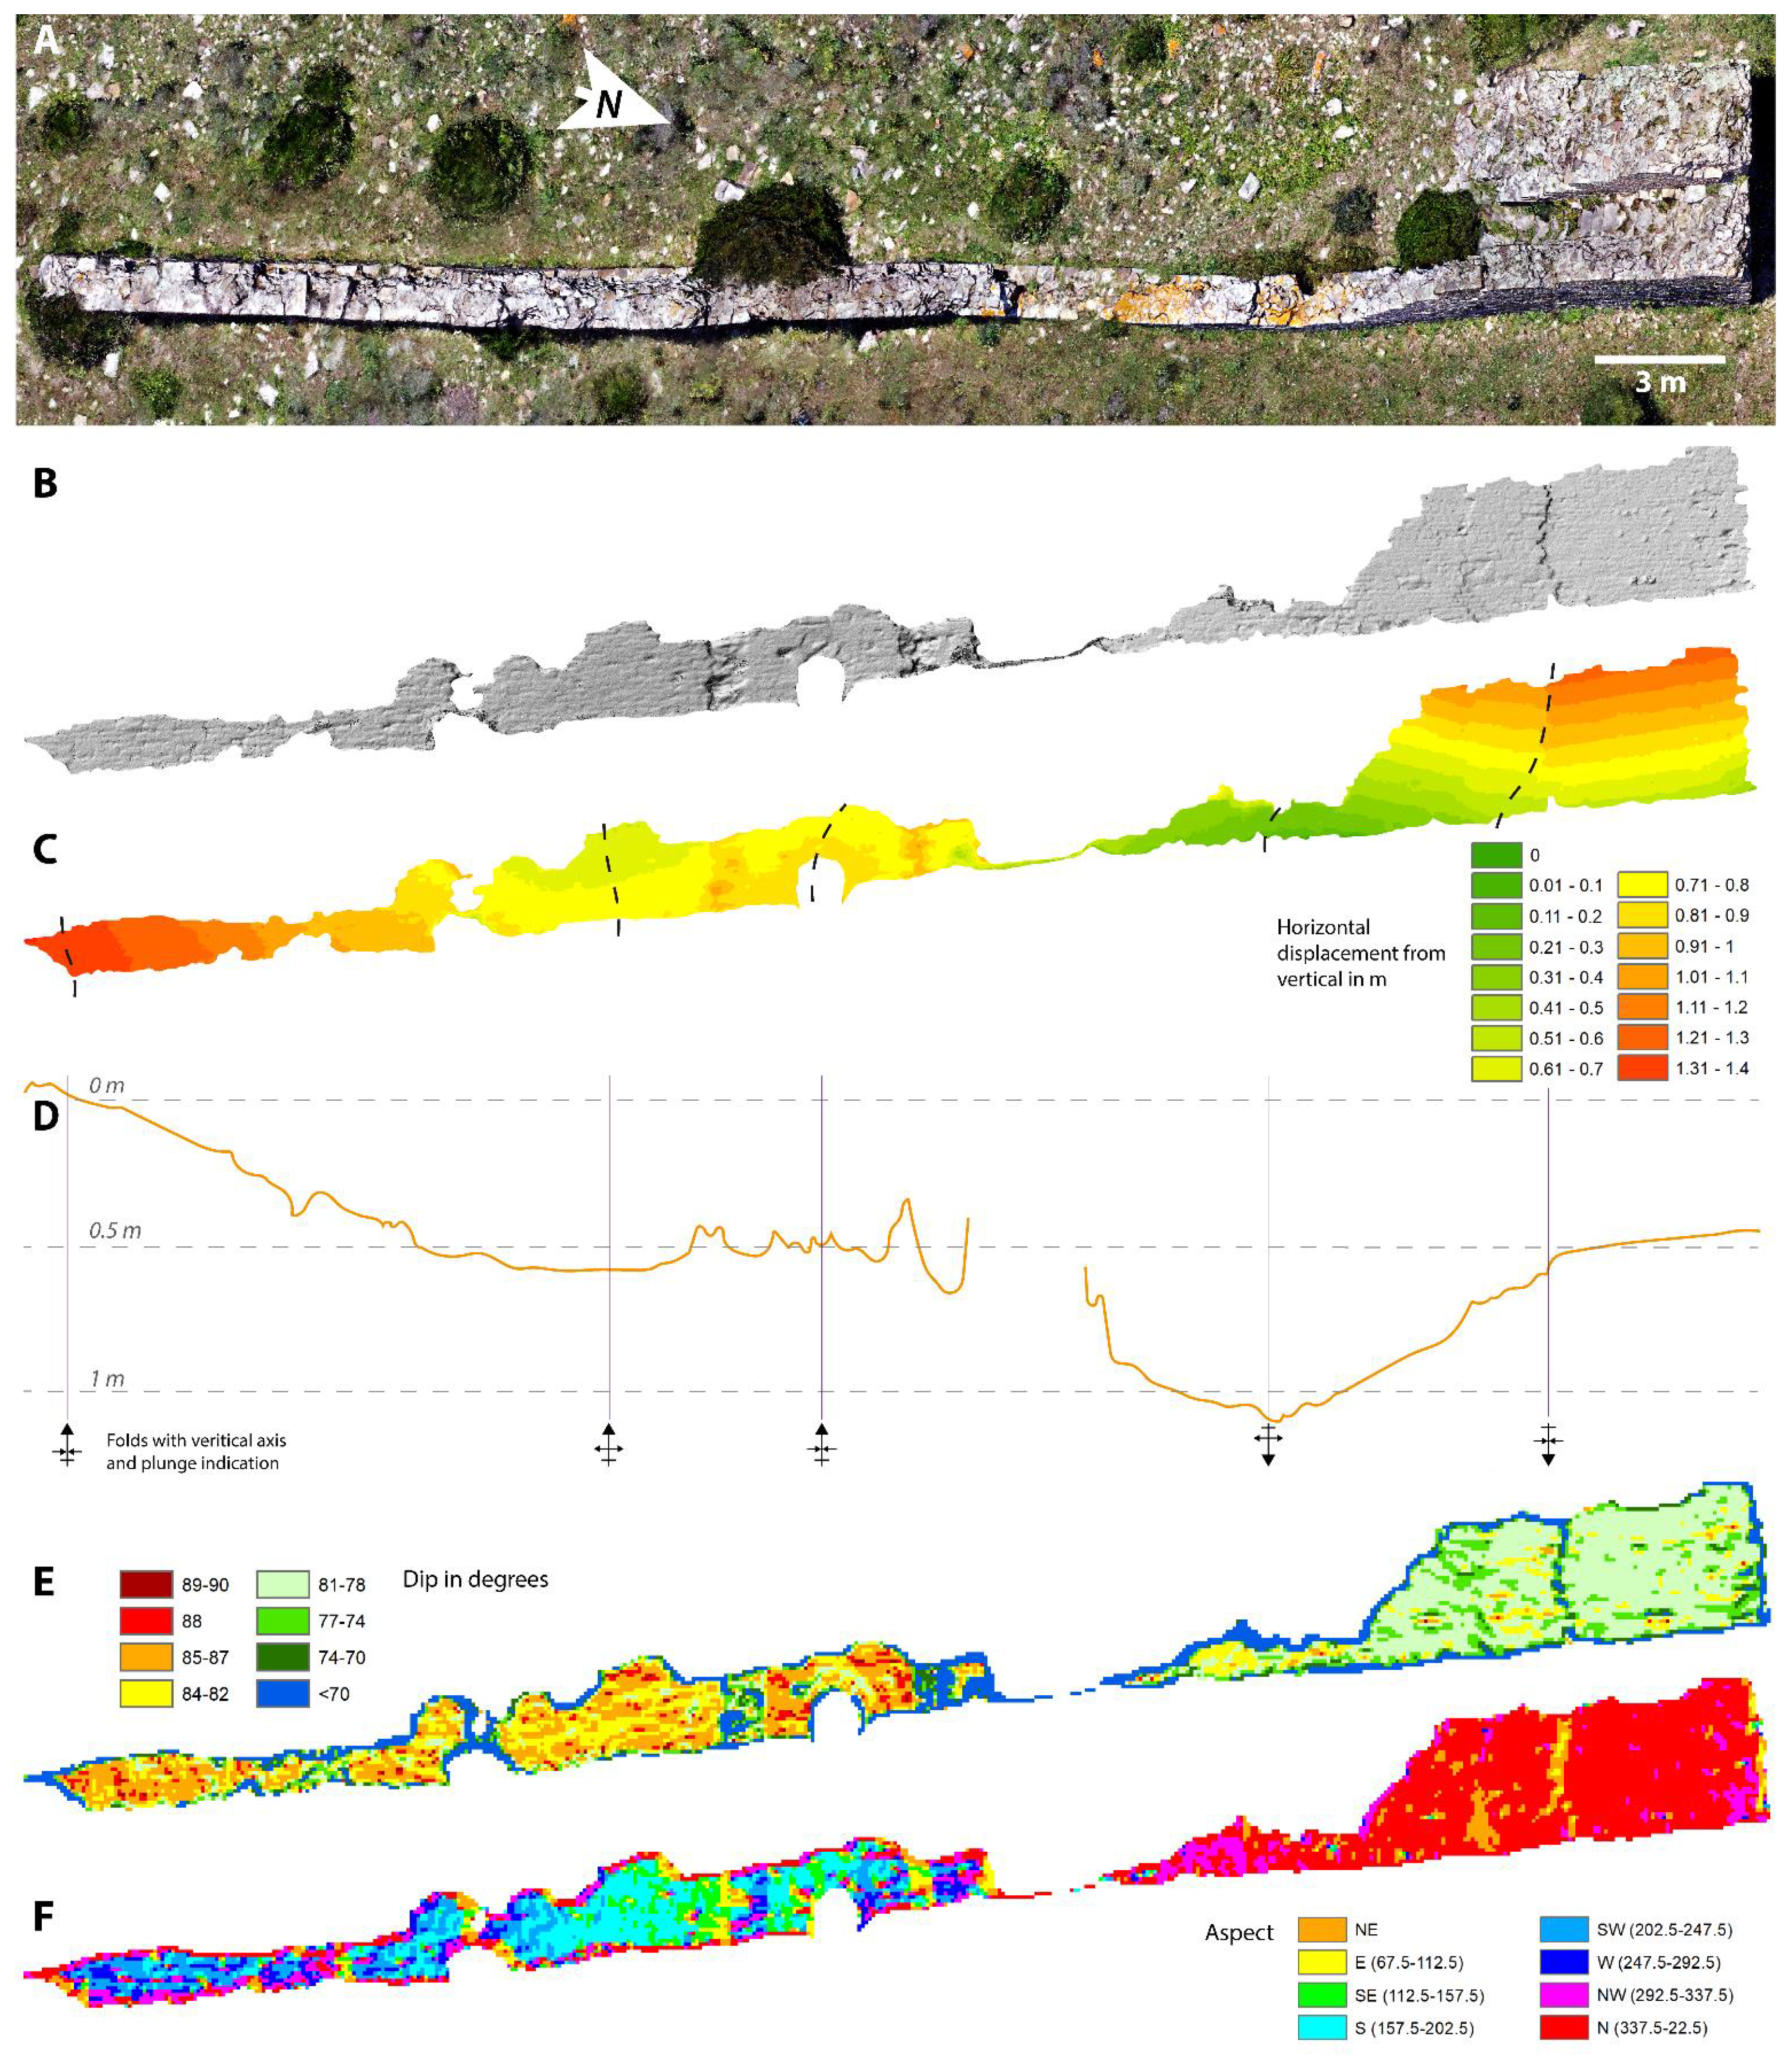
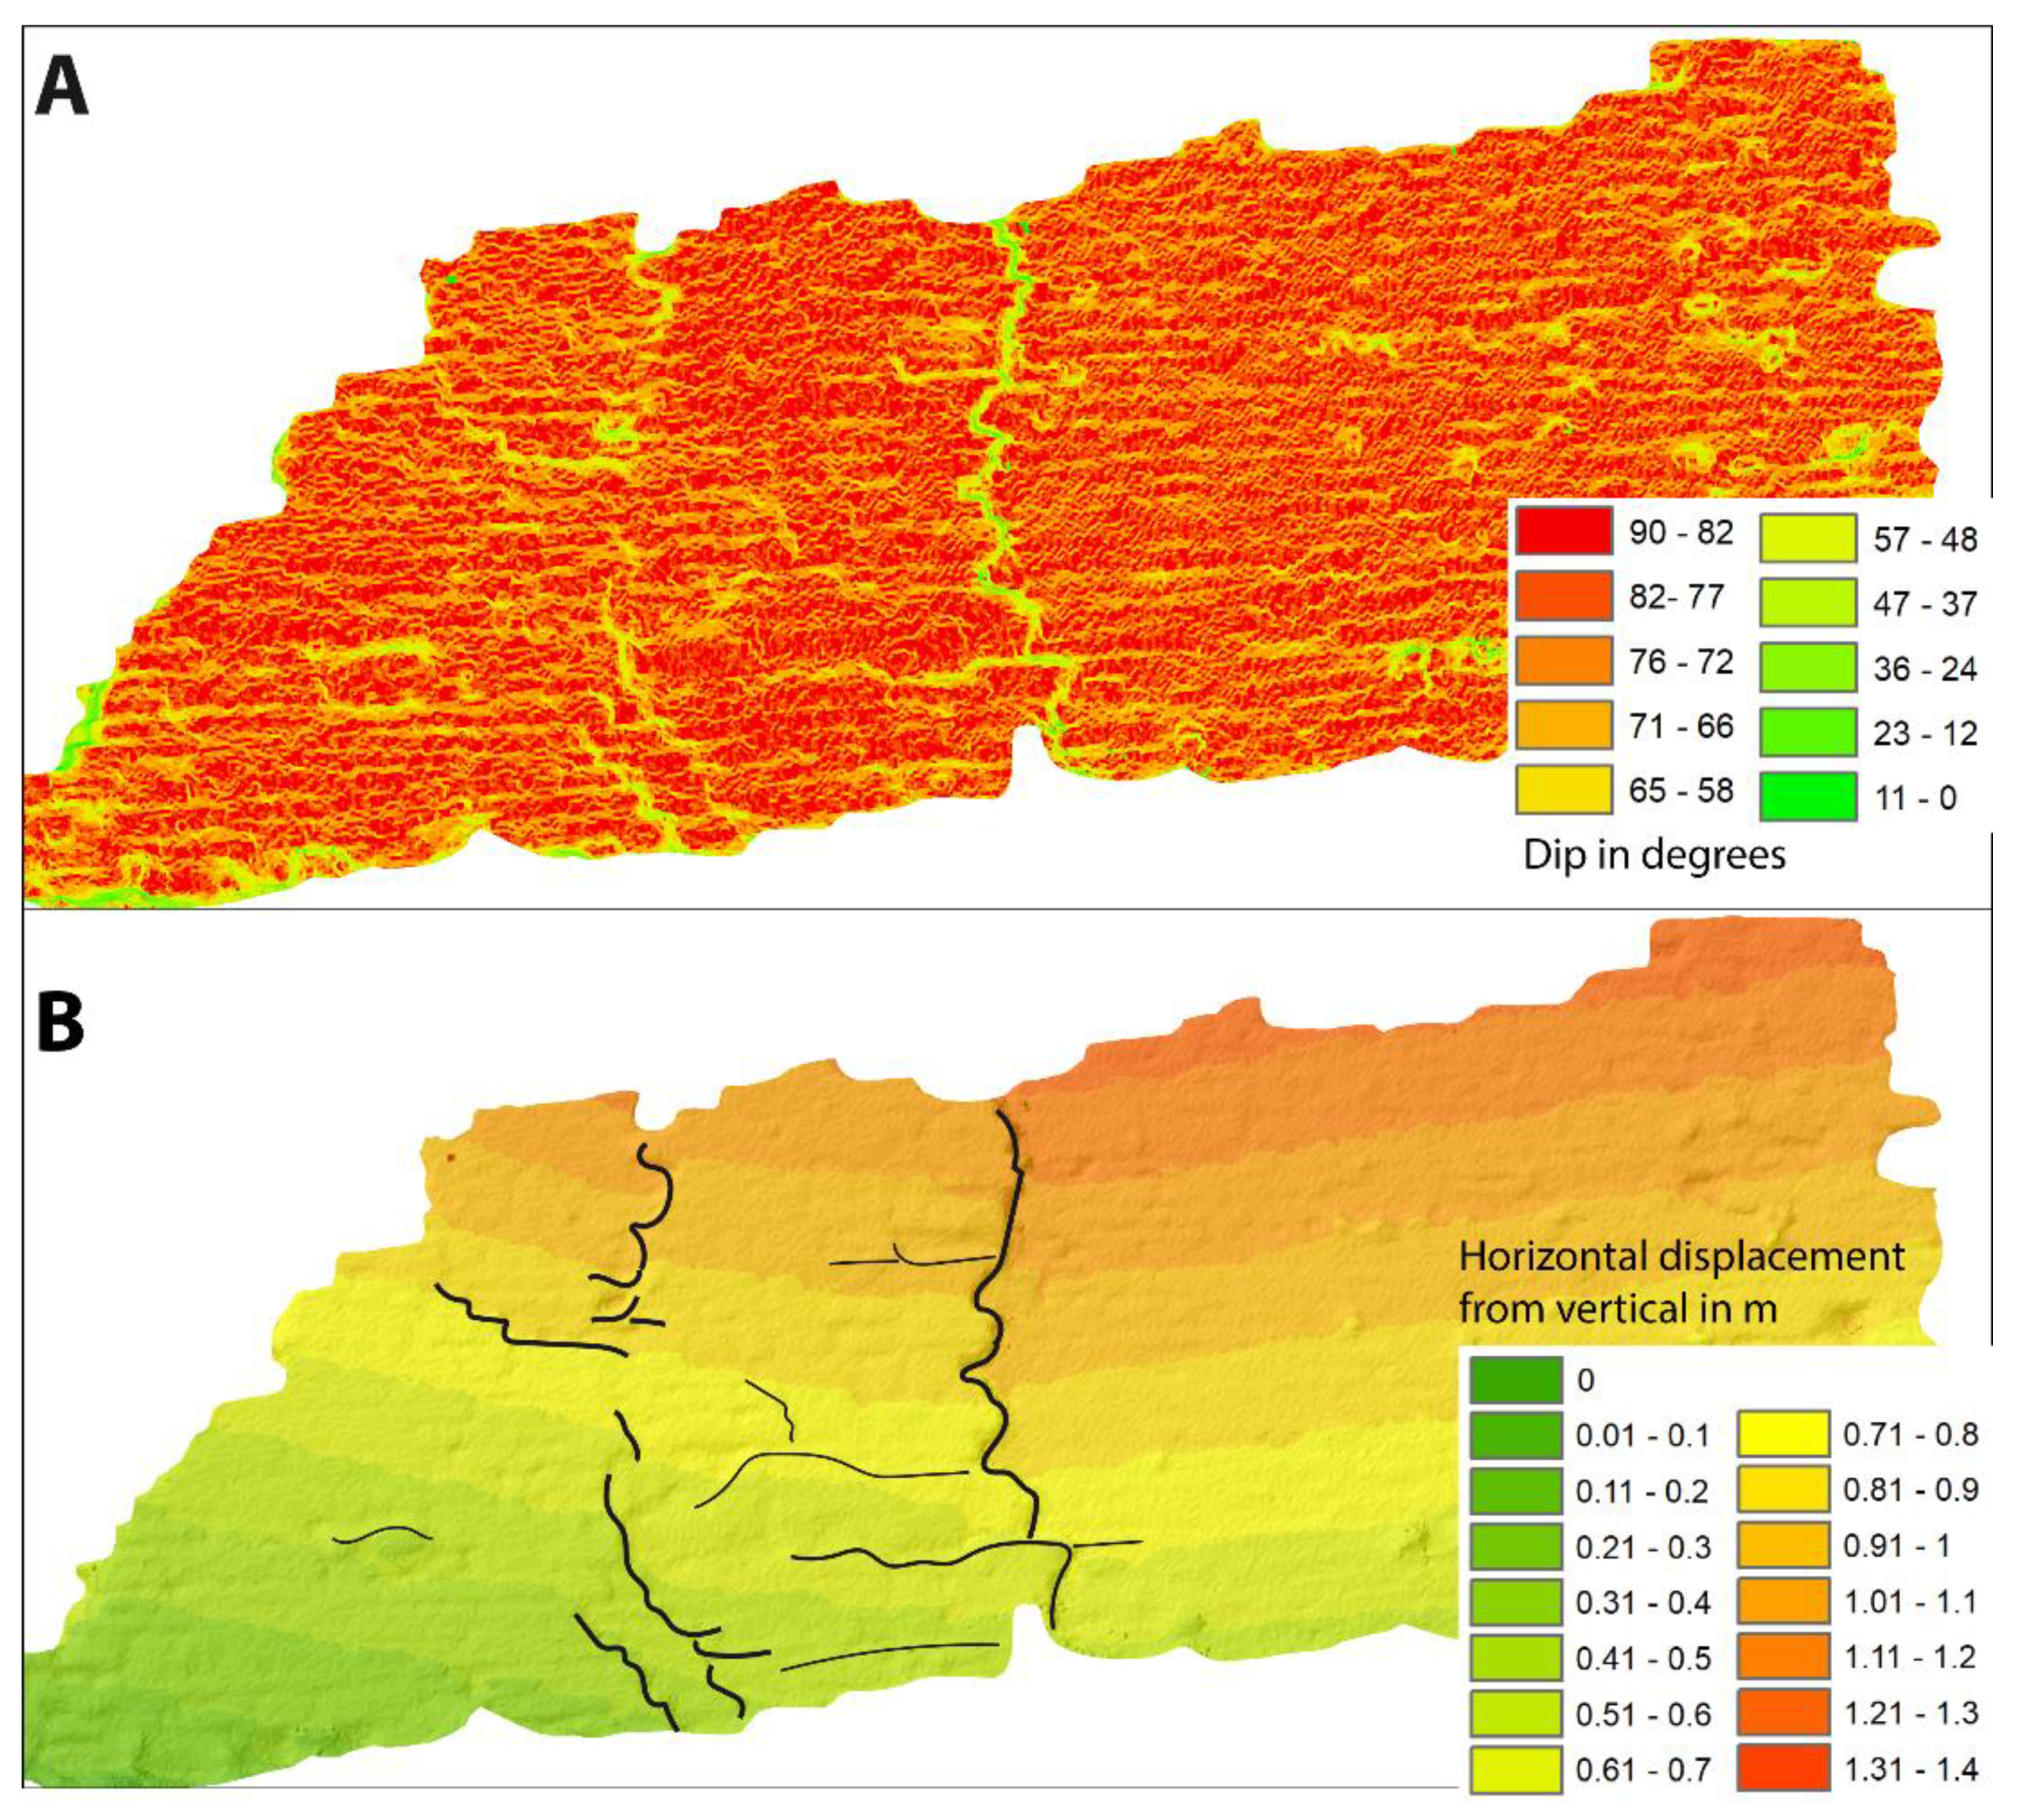
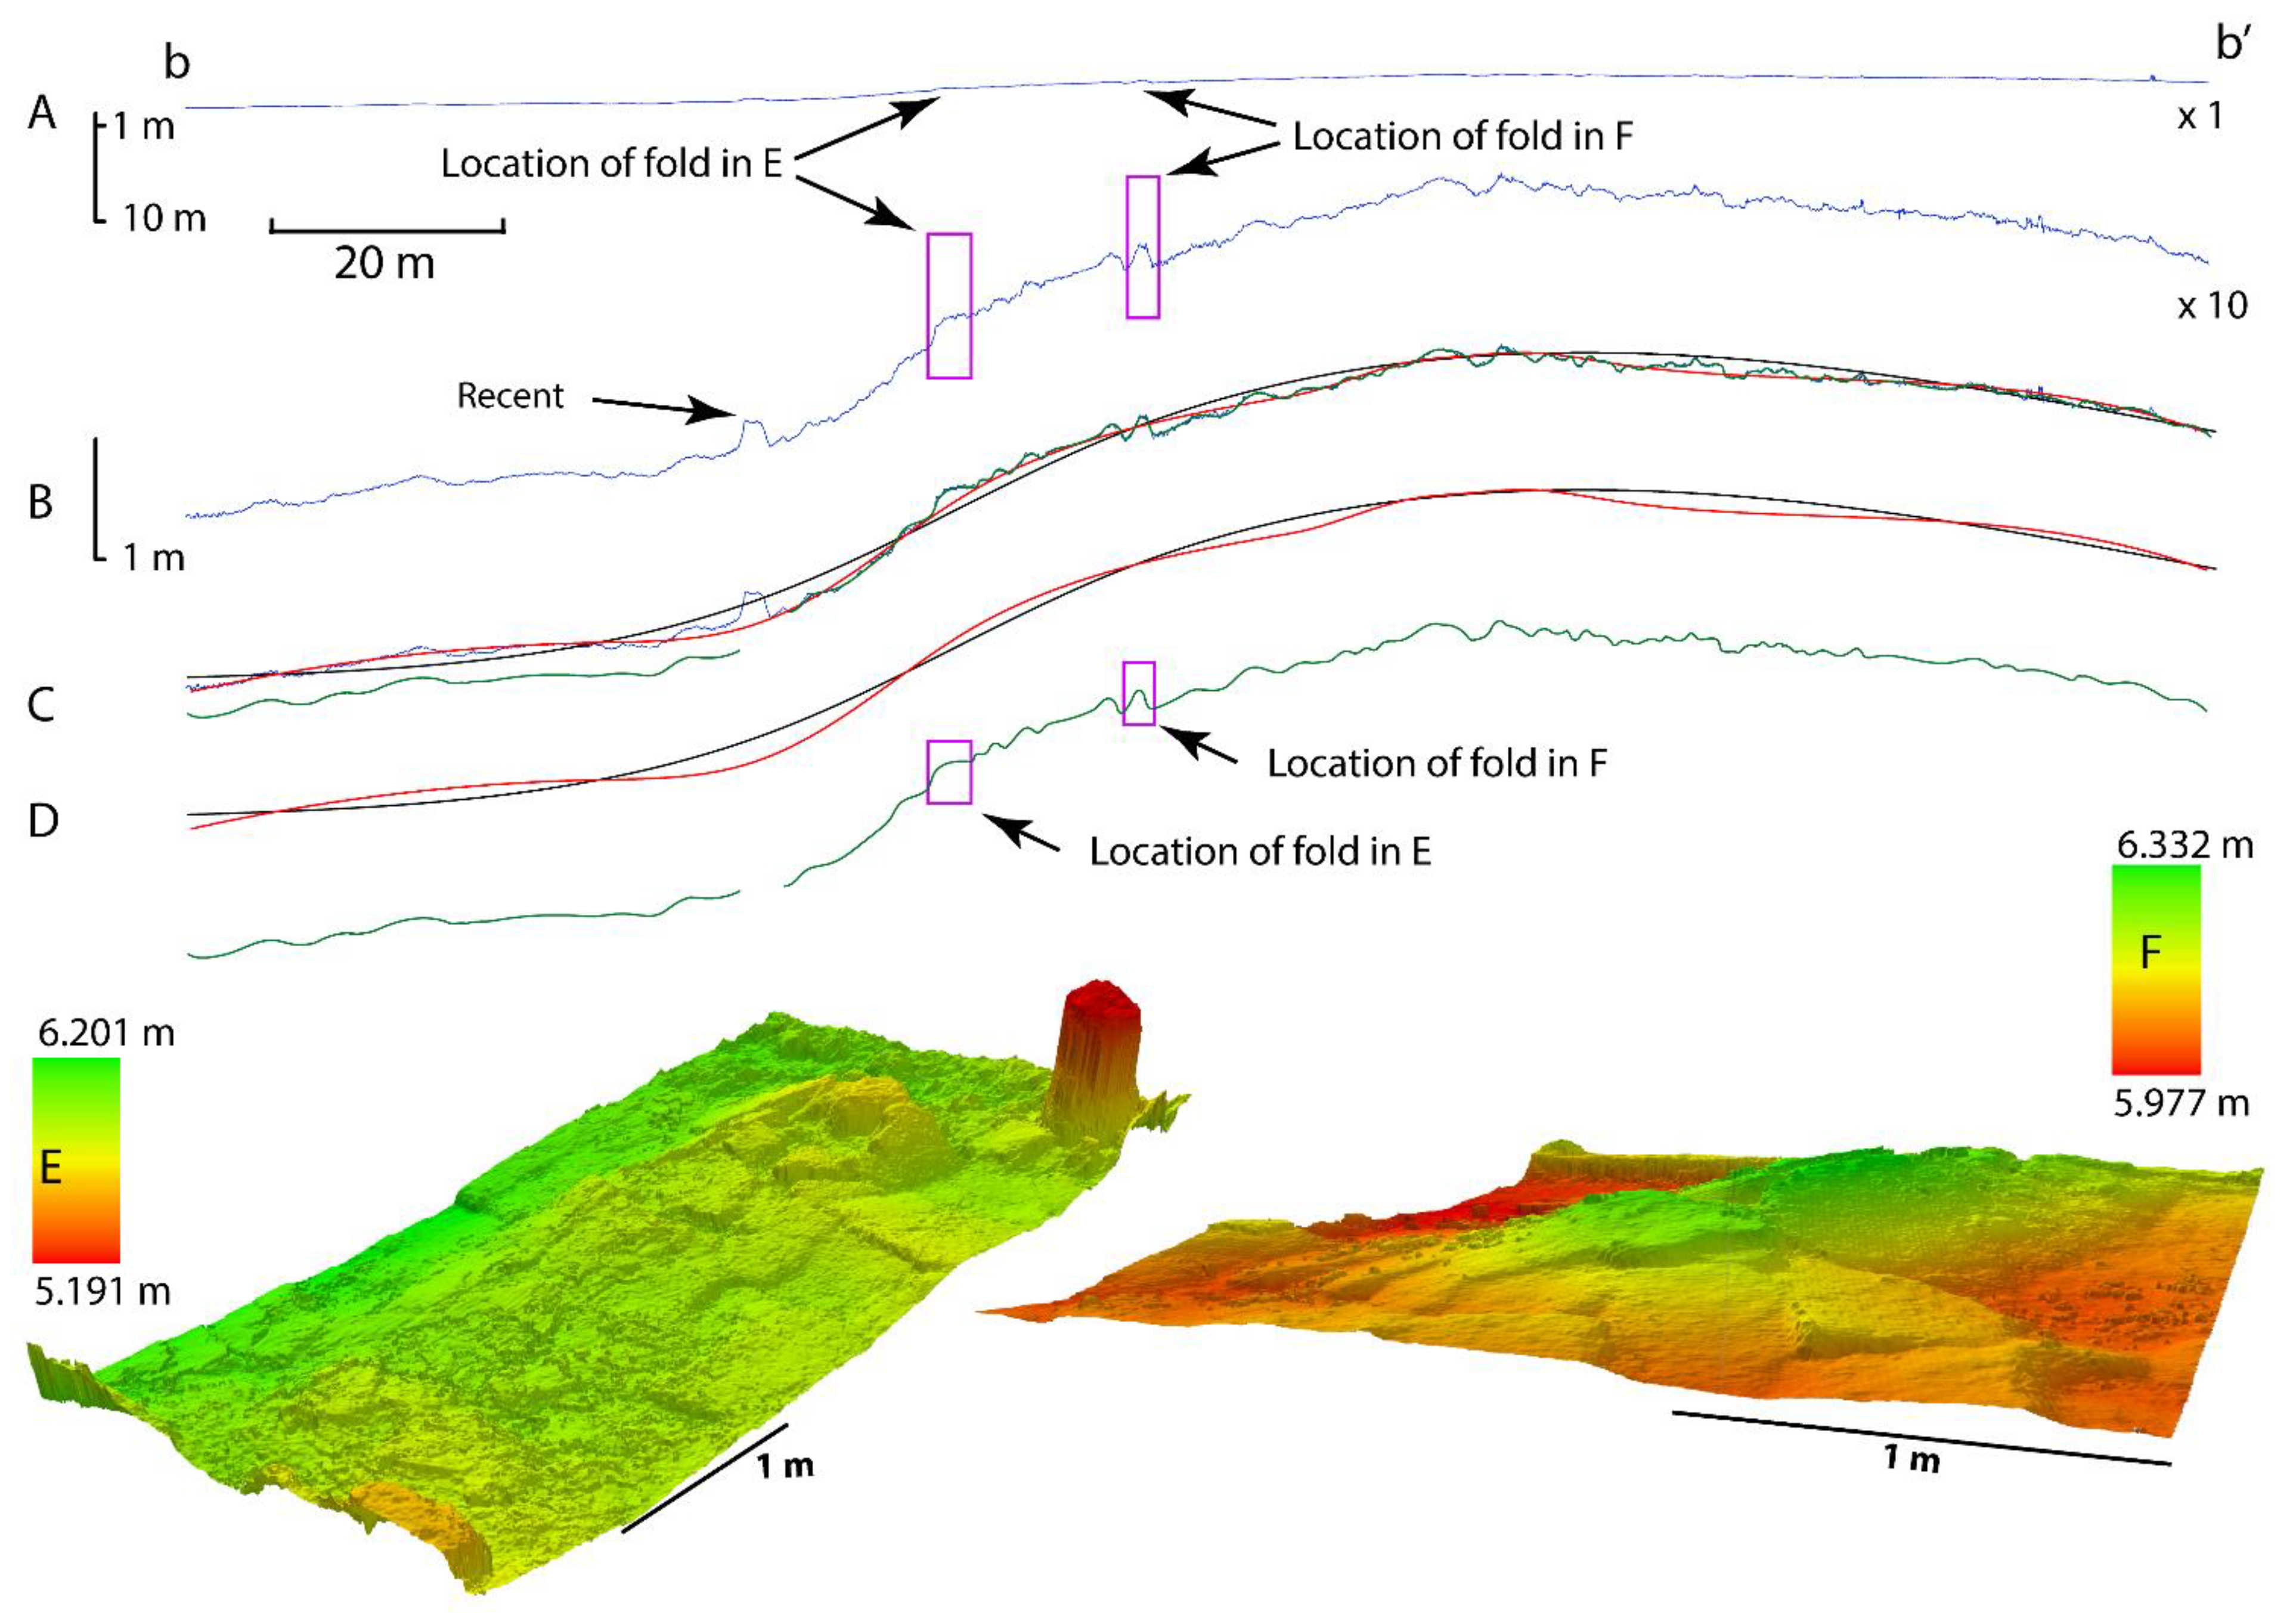
4.3. Fold Characterization in the Pavement of the Decumanus maximus

The studied sector of the folded Decumanus maximus of the city covers a sector of 180 m of the main street in the Roman city of Baelo Claudia (Figure 9). Originally, the street was paved with flat but irregularly shaped tiles that were several tens of cm long and wide and were made up of limestones. The covered area shows impressive examples of folds, pop-up structures, conjugate fractures and impact marks. The Decumanus maximus is N110E oriented and is completely excavated in the studied area exposing the paved street. The resulting DEM obtained from the digital photogrammetric reconstruction from the drone imagery allowed pixel resolutions of up to 3 mm without model over-interpolation or distortion.
We assume that at the construction of this street was almost flat and well-finished, as was usual in the Roman construction pattern in the interior of cities, even more when the Decumanus maximus is a very representative element of the city. From this standpoint, the pavement of the Decumanus maximus is an excellent marker of the deformation suffered in the ground, as its original geometry is well-known. Therefore, the suffered deformation was caused by later processes.
The main visible deformation that developed over the tiled pavement of the street was the evident folding of the entire street [14], evolving from a synclinal fold in the WNW extreme of the Decumanus to an anticlinal fold towards the ESE (Figure 9C–E and Figure 10A–D). This result of folding, with 105 m in wavelength and some 2.54 m in amplitude, was visible in all the obtained models. Due to the reduced width of the street, it is difficult to assess the exact direction of the axis of these main folds; in any case, it is not subparallel to the street and seems to be NW–SE directed and compatible with the main folding direction in the pavement of the Decumanus maximus measured for the smaller folds (see [14]).
The other impressive deformation feature associated with the earthquake is a pervasive set of small-scale folding and pop-up structures developed in the pavement of the Decumanus maximus. Those, widely identified in previous work (Figure 9A, modified from [11]), show wavelengths that in many cases do not exceed one meter and have very small amplitudes of only a few tens of centimeters (Figure 10B,D,F).
Some of these structures were easily identified in field work and in the hillshade models, but in general, they are largely unnoticed in the existing models (Figure 9B). To characterize them, we vertically exaggerated (up to 10 times) the topographic profile made along the nearly 180 m long model of the Decumanus maximus. By exaggerating the vertical, these structures clearly rise, distributed along the topographic profile. In the topographic profile, these features were interpreted (Figure 10) to ease the identification of the different fold geometries with different wavelengths and amplitudes. In addition, a new, hitherto unidentified set of folds with wavelengths of tens of meters and amplitudes in the range of tens of centimeters was also clearly identified (Figure 10D). These structures of such low amplitude and large wavelength are hardly perceptible in field work; therefore, high spatial resolution data are needed for their quantification and characterization in GIS environments. Thus, in Figure 10C,D, the mapped folds can be seen—in black, those with wavelengths of 105 m; in green, the smaller ones with wavelengths near 1 m; and in red, the intermediate and newly discover ones with wavelengths of several tens of meters.
Although this combination of fold geometries should be common in the development of surface deformation associated with an earthquake in archaeological contexts, it is little described in the actual literature because highly detailed topographies are needed to resolve the shape and main features of these folds It is noteworthy that some of the folds have wavelengths of tens of meters and amplitudes of only a few tens of centimeters. Therefore, the use of models obtained from high-resolution photogrammetric restitution with drones opens a new field of applications in this regard, being able to cover large areas with very detailed resolution for work in GIS environments at an affordable cost.

5. Discussion

5.1. Analysis of Deformation in Vertical Structures (the North Bastion of the City Wall)

The measured vertical fold trend in the city wall indicated wavelengths between 11 and 6 m and amplitudes from 9 to 30 cm; even features such as fold plunge, despite being quite subtle geometries, could be easily identified and measured in the several obtained models. Regarding the interpretation of the mapped deformation, those folds with a vertical axis were probably caused by the earthquake’s superficial waves, specifically Love waves, in which ground displacement involves lateral (perpendicular) displacement with respect to the seismic wave propagating direction. As the city wall is oriented N162E, the vertical folding is quite compatible with a Love superficial seismic wave propagating from WSW to ENE, the orientation of the deformation trajectories calculated for the whole Roman city of Baelo Claudia (e.g., [14]).
The advantage of using high-resolution DEM for complementing classic field observation and measurement in damage scenarios is due to the precise quantification of the deformation and the invaluable help it provides in identifying some of these structures that would otherwise go unnoticed because of their high wavelength/amplitude ratio and/or difficult location. It was also possible to almost automatically identify and later map quite precisely the brittle structures (fractures and faults) that allowed accommodation of the local deformation by sectors in the city wall (Figure 7).
Moreover, from the photogrammetric restitution of drone aerial imagery in GIS environments can be obtained DEMs with several resolutions. In the most detailed restitutions, even models with a submillimetric pixel resolution can be obtained. In this regard, we evidenced that higher resolution models are not always better and that resolution models adapted to each specific study case can improve the identification and parametrization of key elements in the damaged structures. Figure 11 illustrates the influence of the DEM resolution on the final outcomes (3D models), where the choice of an adequate pixel size is critical to highlight the general slope of the studied wall section. The 5 cm/pixel DEM in Figure 11D clearly displays an overall dipping of the wall between 78–82°, which is nearly masked in the 3 mm/pixel DEM in Figure 11C, since the pixels are too small, generating an extremely precise DEM. On the contrary, these detailed DEMs allow a better identification and definition of linear features, such as fractures (Figure 11B,C).

5.2. Analysis of the Deformation in Horizontal Structures (Decumanus maximus)

As for the interpretation of the set of folds characterized in the Decumanus maximus, it is quite likely that, in the case of those of greater wavelength, the origin has several factors involved apart from the earthquake in the fourth century AD. On the one hand, the street might have had a slight downward slope to the WNW, which accentuates the present amplitude of the folds (near 2.5 m), and on the other hand, just to the N of the ESE half of the segment of the Decumanus maximus studied, there is a complex gravity landslide of relevant size in terms of the city (see Figure 2), whose foot may be responsible for part of the positive elevation of the southeastern sector of the studied area. A reactivation of this landslide after the Roman abandonment of the city might have been responsible for the increase in amplitude of the original anticline, since it appears to be of very large amplitude for the intensity of damage observed on the surface and related to the earthquake (see Section 2).
In the case of the fold geometries of intermediate wavelength, of several tens of meters, and amplitudes of a few tens of centimeters (Figure 10C,D), their interpretation is more straightforward since they are of the same typical dimensions (wavelength and amplitude) of a seismic wave and, therefore, should be directly related. This implies once more that the city of Baelo Claudia is an exceptional natural laboratory regarding archaeoseismological studies, even providing data about the wavelength and amplitude of the seismic waves that struck the Roman city in the fourth century.
It is also remarkable that folds with shorter wavelengths, close to a meter (see 3D reconstructions of two characteristic examples in the Decumanus maximus; Figure 10E,F), show larger amplitudes than folds with wavelengths of several tens of meters. Here, it is quite likely that the dimensions (mainly amplitude) of these lower-trending folds must have been constrained by the anisotropy imposed by the size of the pavement tiles of the street.
The work presented here with high-resolution and high-precision DEMs obtained from photogrammetric restitution of drone-derived images allows for the straightforward identification, characterization and parameterization of geological features, such as folds. Some of these fold geometries can even be difficult to observe in plain view due to their wavelength/amplitude ratio. Not only that, but the extremely high-resolution topography of the different fold geometries as presented here allow for further analysis, for instance, using Fourier Transform Analysis [27].

5.3. 3D analysis of Sediments (Late Fourth Century CE Tsunami Deposit)

The whole set of sedimentological features of the tsunamite deposit (Figure 8) include: (a) northward dipping of the bath dish; (b) size reduction in the clast size from SSE to NNW; (c) NE–SW main paleocurrent direction and southward sense of clast imbrication deduced from field survey and modelling indicate that the tsunamite (including the marble dish) was deposited during the SW-directed backwash of the tsunami. This would also explain the large amount of rubbish anthropic material incorporated in the deposit and the mixture of fish and animal bones with pottery and glass or masonry blocks as highlighted in previous studies [10,11,24].
From the point of view of the characterization of the tsunami deposits, the capacity to map in 3D the detailed elements embedded in the sediments, as well as the spatial distribution in the tsunami deposits, allow a GIS-based geospatial processing of the strata. This methodology opens innovative working fields in stratigraphy, providing new tools for the characterization of deposits (and individual elements) from unusual energetic events (tsunami or earthquake) within archaeological contexts, using interlinks between ancient urban patterns and present sediment exposures to deduce past damaging processes. Under this kind of analyses will be the study of the damaged aqueduct in the eastern zone of the city (Figure 3). This element, presently under study, displays a high potential for the combined analyses of deformation in horizontal and vertical structures presented in this study. The geometry of the deformation of this structure indicates a double affection by the earthquake and the subsequent tsunami [24]. Further 3D modelling of the aqueduct will provide new insights to refine the 2D and 3D geometrical analyses of deformation examined in this work.

6. Conclusions

The use of drone-based technologies increases the range of possibilities in terms of the quantification and mapping of earthquake-associated deformation in archaeological sites. Additionally, the techniques allow accurate quantitative analyses, facilitating data acquisition and the modelling of structures in locations dominated by complex geometries, areas difficult to access or large-sized elements, making it possible to cover large areas with high resolution at affordable costs.
The use of 3D models obtained with drone technology also improves processing workflows and their subsequent implementation in GIS environments for morphometric and geometric analyses at different scales. One of the major advantages of 3D modelling is its improved ability to identify particular deformation elements that, due to their high wavelength/amplitude ratio, may go unnoticed in simpler analyses.
The models obtained in this study highlight the use of 3D modelling in the characterization and parameterization of earthquake damage in archaeological sites. In a next step, the set of Earthquake Archaeological Effects (EAEs) according to the classification of Rodríguez-Pascua et al. [18] would be digitally standardized for their automatic recognition and parametrization from drone-produced 3D models. In a further phase, their implementation in properly improved GIS environments with specific algorithms will be possible to produce automated 3D maps and models for oriented damage, facilitating low-cost archaeoseismological evaluations of sites or historical buildings from drone surveys.
These drone–GIS-based techniques can also be applied in present earthquake scenarios, allowing a prompt detailed evaluation of the damage and a better evaluation of seismic intensity. This will allow the modelling of both building and environmental damage (surface faulting, landslides, liquefaction, lateral spreading, etc.), achieving digital seismic disaster scenarios to be analyzed after an earthquake to improve seismic risk assessments or for the planning of earthquake trails around urban areas.
Finally, an additional, but important application of the 3D modelling produced in this study is its use for academic educational purposes in schools, universities and museums, providing students or the public with digital twins for their study, visualization or promotion.

Supplementary Materials

The following supporting information can be downloaded at: https://www.mdpi.com/article/10.3390/app12105223/s1. Figure S1: Tilted North City-Wall Bastion 3D Model and Figure S2: Marble Dish Tsunami 3D Model.

Author Contributions

Conceptualization, P.G.S. and Y.S.-S.; methodology, Y.S.-S. and J.E.; 3D data acquisition, Y.S.-S. and G.S.-D.; software and processing of 3D models, Y.S.-S., J.E. and G.S.-D.; validation, Y.S.-S. and P.G.S.; formal analysis, P.G.S., J.L.G.-R. and K.R.; investigation, Y.S.-S. and P.G.S.; resources, J.E. and J.L.G.-R.; writing—original draft preparation, Y.S.-S., J.E. and P.G.S.; writing—review and editing, Y.S.-S., J.E., P.G.S. and K.R.; visualization, J.E. and Y.S.-S.; supervision, P.G.S. and K.R.; funding acquisition, P.G.S. All authors have read and agreed to the published version of the manuscript.

Funding

This research was funded by the Spanish Research Project MINECO-FEDER CGL2015-67169-P (QTECTSPAIN-USAL) and The Spanish Ministry of Science grant PID2021-123510OB-I00 (QTECTIBERIA-USAL). This is a contribution of the QTECT-AEQUA Working Group.

Institutional Review Board Statement

Not applicable.

Informed Consent Statement

Not applicable.

Data Availability Statement

Not applicable.

Acknowledgments

The authors are grateful to the staff at the Archaeological Site of Baelo Claudia (Junta de Andalucia) for facilitating the fieldwork and drone operations, and especially to Iván Garcia Garcia, archaeologist in charge of the supervision of scientific excavations at the site.

Conflicts of Interest

The authors declare no conflict of interest. The funders had no role in the design of the study; in the collection, analyses, or interpretation of data; in the writing of the manuscript; or in the decision to publish the results.

References

  1. Montreuil, A.L.; Bullard, J.E.; Chandler, J.H.; Millett, J. Decadal and seasonal development of embryo dunes on an accreting macrotidal beach: North Lincolnshire, UK. Earth Surf. Process. Landf. 2013, 38, 1851–1868. [Google Scholar] [CrossRef]
  2. Taddia, Y.; Stecchi, F.; Pellegrinelli, A. Mapeo costero usando DJI Phantom 4 RTK en modo cinemático de post-procesamiento. Drones 2020, 4, 9. [Google Scholar] [CrossRef] [Green Version]
  3. Vitale, V. The case of the middle valley of the Sinni (Southern Basilicata). Methods of archaeological and architectural documentation: 3D photomodelling techniques and use of RPAS. Digit. Appl. Archaeol. Cult. Herit. 2018, 11, e00084. [Google Scholar] [CrossRef]
  4. Trebeleva, G.; Glazov, K.; Kizilov, A.; Sakania, S.; Yurkov, V.; Yurkov, G. Roman Fortress Pitiunt: 3D-Reconstruction of the Monument Based on the Materials of Archaeological Research and Geological Paleoreconstructions. Appl. Sci. 2021, 11, 4814. [Google Scholar] [CrossRef]
  5. Blanco, A.M.; Sánchez, J.G.; Costa-García, J.M.; Fonte, J.; González-Álvarez, D.; García, V.V. Following the Roman Army between the Southern Foothills of the Cantabrian Mountains and the Northern Plains of Castile and León (North of Spain): Archaeological Applications of Remote Sensing and Geospatial Tools. Geosciences 2020, 10, 485. [Google Scholar] [CrossRef]
  6. Karelin, D.A.; Zhitpeleva, T.I.; Karelin, M.A. Some problems and features of creation of 3d-reconstructions of late Roman fortresses in Egypt. AMIT 2015, 3, 32. [Google Scholar]
  7. Monterroso-Checa, A.; Redondo-Villa, A.; Gasparini, M.; Hornero, A.; Iraci, B.; Martín-Talaverano, R.; Moreno-Escribano, J.C.; Muñoz-Cádiz, J.; Murillo-Fragero, J.I.; Obregón-Romero, R. A heritage science workflow to preserve and narrate a rural archeological landscape using virtual reality: The cerro del castillo of belmez and its surrounding environment (Cordoba, Spain). Appl. Sci. 2020, 10, 8659. [Google Scholar] [CrossRef]
  8. Sillières, P. Baelo Claudia, Una Ciudad Romana de la Bética; Casa de Velázquez: Madrid, Spain, 1997; Volume 61, ISBN 848683984X. [Google Scholar]
  9. Silva, P.G.; Borja, F.; Zazo, C.; Goy, J.L.; Bardají, T.; De Luque, L.; Lario, J.; Dabrio, C.J. Archaeoseismic record at the ancient Roman City of Baelo Claudia (Cádiz, south Spain). Tectonophysics 2005, 408, 129–146. [Google Scholar] [CrossRef] [Green Version]
  10. Röth, J.; Mathes-Schmidt, M.; Jiménez, I.G.; Pichardo, F.J.R.; Grützner, C.; Silva, P.G.; Reicherter, K. The Baelo Claudia tsunami hypothesis: Results from a multi-method sediment analysis of late-Roman deposits (Gibraltar Strait, Southern Spain). In Proceedings of the 6th International Inqua Meeting on Paleoseismology, Active Tectonics and Archaeoseismology, Pescina, Italy, 19–24 April 2015; pp. 19–24. [Google Scholar]
  11. Reicherter, K.; Prados, F.; Jiménez-Vialás, H.; Jiménez, I.G.; Feist, L.; Val-Peón, C.; Höbig, N.; Mathes-Schmidt, M.; López-Sáez, J.A.; Röth, J.; et al. The Baelo Claudia tsunami archive (SW Spain)—Archaeological deposits of high energy events. In Historical Earthquakes, Tsunamis and Archaeology in the Iberian Peninsula; Álvarez-Martí-Aguilar, M., Machuca-Prieto, F., Eds.; Springer: Berlin/Heidelberg, Germany, 2022; ISSN 1613-9712. [Google Scholar]
  12. Villalobos, C.A.; Andaluz, I.; Centro, H.; Subacuatica, A.; Gracia, F.J. Paleogeographie de l’anse de Bolonia (Tarifa, Espagne) à l’époque romaine. In The Mediterranean World Environment and History; Fouache, E., Ed.; Elsevier: Amsterdam, The Netherlands, 2003; pp. 407–417. ISBN 9782842994525. [Google Scholar]
  13. Silva, P.G.; Reicherter, K.; Grützner, C.; Bardají, T.; Lario, J.; Goy, J.L.; Zazo, C.; Becker-Heidmann, P. Surface and subsurface palaeoseismic records at the ancient Roman city of Baelo Claudia and the Bolonia Bay area, Cádiz (south Spain). Geol. Soc. Lond. Spec. Publ. 2009, 316, 93–121. [Google Scholar] [CrossRef]
  14. Silva, P.G.; Giner-Robles, J.L.; Reicherter, K.; Rodríguez-Pascua, M.A.; Grützner, C.; Jiménez, I.G.; García, P.C.; Bardají, T.; Santos, G.; Roquero, E.; et al. Los terremotos antiguos del conjunto arqueológico romano de Baelo Claudia (Cádiz, Sur de España): Quince años de investigación arqueosismológica. Estud. Geol. 2016, 72, e050. [Google Scholar] [CrossRef] [Green Version]
  15. Grützner, C.; Reicherter, K.; Hübscher, C.; Silva, P.G. Active faulting and neotectonics in the Baelo Claudia area, Campo de Gibraltar (southern Spain). Tectonophysics 2012, 554–557, 127–142. [Google Scholar] [CrossRef]
  16. Giner-Robles, J.L.; Rodríguez-Pascua, M.A.; Silva, P.G.; Pérez-López, R. Efectos sísmicos en yacimientos arqueológicos: Catalogación y cuantificación arqueosismológica. Boletín Geológico Min. 2018, 1129, 451–467. [Google Scholar] [CrossRef]
  17. Silva, P.G.; Bardají, T.; Roquero, E.; Martínez-Graña, A.; Perucha, M.A.; Huerta, P.; Lario, J.; Giner-Robles, J.L.; Rodríguez-Pascua, M.A.; Pérez-López, R.; et al. Seismic palaeogeography of coastal zones in the iberian peninsula: Understanding ancient and historic earthquakes in Spain. Cuatern. Geomorfol. 2015, 29, 31–56. [Google Scholar] [CrossRef] [Green Version]
  18. Rodríguez-Pascua, M.A.; Pérez-López, R.; Giner-Robles, J.L.; Silva, P.G.; Garduño-Monroy, V.H.; Reicherter, K. A comprehensive classification of Earthquake Archaeological Effects (EAE) in archaeoseismology: Application to ancient remains of Roman and Mesoamerican cultures. Quat. Int. 2011, 242, 20–30. [Google Scholar] [CrossRef]
  19. Giner-Robles, J.L.; Rodríguez-Pascua, M.Á.; Pérez-López, R.; Silva, P.G.; Bardají, T.; Roquero, E.; Elez, J.; Perucha, M.Á. Geological structural analysis applied to archaeoseismology. In Handbook of Cultural Heritage Analysis; D’Amico, S., Venuti, V., Eds.; Springer International Publishing: Cham, Switzerland, 2022; pp. 1763–1778. ISBN 978-3-030-60016-7. [Google Scholar]
  20. Rodríguez-Pascua, M.Á.; Silva, P.G.; Giner-Robles, J.L.; Perucha, M.Á.; Roquero, E.; Bardají, T.; Elez, J.; Pérez-López, R. Earthquake archaeological effects (EAEs) for identification of seismic damage and intensity assessments in the cultural heritage. In Handbook of Cultural Heritage Analysis; D’Amico, S., Venuti, V., Eds.; Springer International Publishing: Cham, Switzerland, 2022; pp. 1779–1789. ISBN 978-3-030-60016-7. [Google Scholar]
  21. Sillières, P. La datación de los grandes monumentos de Baelo Claudia: Aportación de los sondeos estratigráficos. In Actas II Jornadas Internacionales de Baelo Claudia; Consejería de Cultura, Junta de Andalucía: Sevilla, Spain, 2016; pp. 107–128. ISBN 978-84-9959-214-5. [Google Scholar]
  22. Ménanteau, L.; Vanney, J.R.; Zazo, C. Belo et Son Environement (Détroit de Gibraltar), Etude Physique d’un Site Antique; Casa de Velázquez: Madrid, Spain, 1983; 324p. [Google Scholar]
  23. Silva, P.G.; Rodríguez-Pascua, M.A.; Giner-Robles, J.L.; Elez, J.; Pérez-López, R.; Davila, M.B.B. Catalogue of the Geological Effects of Earthquakes in Spain Based on the ESI-07 Macroseismic Scale: A New Database for Seismic Hazard Analysis. Geoscience 2019, 9, 334. [Google Scholar] [CrossRef] [Green Version]
  24. Silva, P.G.; Elez, J.; Carrasco, P.; Santos, G.; Pérez-Tarruella, J.; Giner-Robles, J.L.; Roquero, E.; Reicherter, K.; Garcia-Jiménez, I.; Prados Martínez, F.; et al. Archaeoseismological analysis of the late 4th century tsunami event devastating the Roman City of Baelo Claudia (Gibraltar Arc, South Spain). In Proceedings of the 10th International INQUA Meeting on Paleoseismology, Active Tectonics and Archaeoseismology, Hornitos, Chile, 8–12 November 2021; p. 67. [Google Scholar]
  25. Martínez, F.P.; Vialás, H.J.; Abad, L. Primeros avances de la intervención arqueológica en los mausoleos de la puerta sureste de Baelo Claudia: El monumento de Iunia Rufina. Zephyrus 2020, 85, 163–184. [Google Scholar] [CrossRef]
  26. Martínez, F.P. La necrópolis oriental de Baelo Claudia (Tarifa, Cádiz) en el contexto de la religiosidad púnico-mauritana: Una lectura a partir de las últimas actuaciones arqueológicas. Zephyrus 2011, 68, 191–210. Available online: https://revistas.usal.es/index.php/0514-7336/article/view/8758 (accessed on 20 May 2022).
  27. Grose, L.; Laurent, G.; Aillères, L.; Armit, R.; Jessell, M.; Cousin-Dechenaud, T. Inversion of structural geology data for fold geometry. J. Geophys. Res. Solid Earth 2018, 123, 6318–6333. [Google Scholar] [CrossRef]
Figure 1. Geological context of the Bolonia Bay showing the most important fault systems in the central area of the Strait of Gibraltar and the most probable seismic sources (CGF and MOF) in the area responsible for the earthquake in the fourth century AD (red stars). Legend: (1) Cretaceous–Eocene Almarchal Fm. (clayey marls and limestones); (2) Paleogene Bolonia Fm. (red clays and limestones); (3) Lower Miocene Facinas Fm. (clayey olisthostromic unit); (4) Miocene Aljibe Sandstones and Algeciras Fms. (flysch units); (5) Pliocene (with circles) and Quaternary post-orogenic materials; (6) Major landslides identified in the area. Stratification directions and subvertical folds are identified with dashed lines. Normal faults (with squares) and reverse faults (with triangles) are identified using conventional symbology. Modified from Silva et al. [14].
Applsci 12 05223 g001
Figure 2. Paleogeography of Baelo Claudia (after [11,24]). (1) Betic Substratum (Almarchal Fm. Cretaceous–Eocene); (2) and (3) Pleistocene marine terraces; (4) Post-Roman colluvium; (5) Beach barrier (c. 4 ka BP); (6) Roman spit-bar and beach deposits; (7) Lagoon and river coastal floodplains; (8) Modern fluvial terraces; (9) Active channels; (10) Paleo-channels; (11) Roman buildings; (12) Harbor moorings; (13) Submerged ashlars and blocks; (14) Scarps; (15) Flooded areas, late fourth century CE. S1–S5, boreholes [9]; A1–A5, sample sites [12]; R1–R4, sample sites [10]; K1–K11, boreholes [11]; P1–P3, tsunami sample sites [24].
Applsci 12 05223 g002
Figure 3. Aerial oblique view of the Baelo Claudia archaeological site highlighting the main buildings cited in the text with enlarged images of the 3D models analyzed in this paper.
Applsci 12 05223 g003
Figure 4. Different flight plans to obtain photographs from drone images. In each image, you can see the situation of the images taken by the drone and the control points taken on the ground. (A) Cameras for North City-Wall Bastion with two orbit flights. (B) Orbital flight plans and cameras for Marble dish tsunami. (C) Grid flight plan and cameras for Decumanus maximus.
Applsci 12 05223 g004
Figure 5. (A) A 3D model of the studied area reconstructing the North City-Wall Bastion from photogrammetry of drone aerial photographs. The overall orientation of the city wall is N162 E and shows strong damage from the earthquake. (B) The sense of rotation and axis of rotation of the original elevation points of the east-facing side of the wall in order to soundly operate in a GIS environment. (C) Hillshade model of the tilted DEM of the east-facing side of the city wall. (D) Map view (elevation view) of the DEM of the east-facing side of the city wall (after tilting); note that a horizontal guide has been added to ease reconstruction. (E) Hypsometric distribution of the deviation from the vertical (distance from the wall to the ration axis located at the base of the wall) in cm (color intervals each 10 cm) on the E side of the city wall; note the different sectors all constrained by the deformation caused by the earthquake.
Applsci 12 05223 g005
Figure 6. (A) Orthophoto of the northern bastion of the city walls obtained in this work. Note the strong deformation in the form of folds with a vertical axis and the relevant tilting of the most northeastern part of the east side of the city wall. (B) Hillshade model of the east side of the city wall and bastion. (C) Hypsometric distribution of the horizontal displacement from the vertical in cm on the E side of the city wall; note the different sectors all constrained by the deformation caused by the earthquake. Those sectors correspond with fractures and overall folding. (D) Vertically exaggerated topographic profile along the mid part of the remains of the studied wall. The profile shows up to five folds developed in the city wall. (E) Slope distribution (dip in degrees) along the studied side of the city wall. Note how the city wall is more tilted towards the NE. (F) Aspect model of the east panel of the wall coherent with the deformation depicted in D and F. Note that models B and C were obtained from a DEM with 1 mm of pixel resolution and models E and F with a 10 cm DEM pixel resolution.
Applsci 12 05223 g006
Figure 7. (A) Dip in degrees of the most northeastern part of the east side of the city wall (for location, see Figure 5A). (B) Interpretation of the fractures (faults) accumulating fragile deformation and delimitating sectors with similar tilting in the city wall over the hypsometric distribution of the horizontal displacement from vertical in the city wall, characterizing the different tilted sector in the city wall. Models A and B were obtained from a DEM with 1 mm of pixel resolution.
Applsci 12 05223 g007
Figure 8. (A) View from the E of the tsunamite deposit with the bath dish on top (left) and 3D map distribution of the long axis of the largest clast embedded in the tsunami deposit (right). (B) View from the NNE of the tsunamite deposit (left) and 3D map distribution of the long axis of the largest clast embedded in the tsunami deposit (right). (C) View from the NNW of the tsunamite deposit (left) and the 3D map distribution of the long axis of the largest embedded clast (right). (D) Hypsometry in plan view of the tsunami deposit with the Roman bath dish in the first plane. Note the gentle slope indicating that the surface of the dish is dipping towards the N. (E) Rose diagram of the direction of the mapped long axis of the largest clast (69 in total) embedded in the tsunamite deposit, indicating a NE–SW transport direction.
Applsci 12 05223 g008
Figure 9. (A) Folds and deformational structures related to the CE VI s. earthquake in the Decumanus maximus mapped in a conventional topographic map, modified from Silva et al. [14]. (B) Hillshade model derived from a DEM obtained from drone aerial photogrammetry; area of the Decumanus maximus. Purple rectangles indicate folds E (1) and F (2) in Figure 9. (C) Hypsometry of the DEM of the Decumanus maximus obtained from drone aerial photogrammetry; note that the total differential elevation accounts for 5.339 m in more than 180 m. (D) Topographic profile from b to b’ (see location in C) without vertical exaggeration. A gentle folding in the paving of the Decumanus maximus can be seen. (E) A 3D view from the SW of the Decumanus maximus; note the overall folding of the street.
Applsci 12 05223 g009
Figure 10. (A) Topographic profile obtained from a 3 mm pixel DEM obtained from drone photogrammetry, from b to b’ (see Figure 9 for location) and without vertical exaggeration. (B) Same topographic profile, from b to b’, with ×10 vertical exaggeration. (C) Superimposed mapped fold geometry from the exaggerated topographic profile showing different amplitude and wavelengths from several tens of m (black) to a couple of tens of m (red) to individual metric folds (green). (D) Disaggregated fold geometry, with the comparison of the larger folds (black and red, up) and individualized minor folding (green, down). (E) Example of the smaller folds with centimetric amplitude and metric wavelength; those folds were probably constrained by the dimension of the slabs of the paving; see location in D, A and Figure 9. (F) Example of the smaller folds with centimetric amplitude and metric wavelength; note the periclinal termination of the fold at both extremes of the structure and the amplitude of some 35 cm; these structures were identified and previously mapped in Silva et al. [14].
Applsci 12 05223 g010
Figure 11. (A) Location of the sector of the city wall topographed in B, C and D. (B) Hillshade model of the tilted DEM of the exemplified area; note the presence of fractures and displaced zones in sectors of the wall due to the earthquake. (C) Slope in degrees derived from a DEM of 3 mm pixel; note the absence of a clear spatial slope distribution despite the fact that the model presents a high resolution and that the whole has a very characteristic slope; see A. (D) Slope model derived from a 5 cm pixel DEM evidencing changes in slope domains (dip) from an originally flat and vertical city wall. More frequent actual dips range between 82 and 78 degrees.
Applsci 12 05223 g011
Table 1. This table shows the errors (RMSE) in longitude, latitude and altitude for both the images and the control points of each archaeological site studied.
Archaeological SitesAverage Error Long. Error (m)Lat. Error (m)Alt. Error (m)Error (m)
Marble dish tsunamiCamera2950.1770.1680.3230.405
GCP30.0350.0170.0180.043
North City-Wall BastionCamera2210.250.320.290.51
GCP50.560.230.0000.60
Decumanus maximusCamera3500.270.561.751.85
GCP100.240.390.0040.46
Publisher’s Note: MDPI stays neutral with regard to jurisdictional claims in published maps and institutional affiliations.

