Abstract
The in situ detection of trace heavy metal is very important for human health and environmental protection. In this paper, a novel and stable nebulized discharge excited by an alternating current (AC) power supply at atmospheric pressure is employed to detect the trace metal copper by atomic emission spectrometry. Different from the previous experiments in which a conductive object was wrapped around a pneumatic nebulizer directly as a discharge electrode. Plasma is generated near needle electrodes and aerosol is introduced from above the electrode gap by a pneumatic nebulizer, which avoid damage to the fragile device. The effects of applied voltage, gas flow rate, pH value of liquid, and concentration of organic addition agents on the emission intensity of Cu I (3d104p-3d104s, 324.75 nm) are investigated for the purpose of optimizing the experiment conditions. For studying the discharge characteristics and understanding the mechanisms of metal atomic excitation, the waveforms of applied voltage and discharge current are measured, and the vibrational and rotational temperature are calculated by the spectra of N2 (C3∏u-B3∏g, Δυ = −2). In addition, gas temperature evolution of nebulized discharge is acquired and it is found that the emission intensity of Cu I (3d104p-3d104s, 324.75 nm) can be affected by applied voltage, gas flow rate, pH value of liquid, and concentration of organic addition agents. An optimized experimental condition of nebulized discharge for Cu detection is 3.59 of the pH, 5.6 kV of applied voltage, 1.68 L/min of Ar flow rate, and 2% of the ethanol. Under this condition, the limit of detection (LOD) of Cu can reach up to 0.083 mg/L.
1. Introduction
In the last few decades, with the rapid development of industry and agriculture, heavy metal pollutants have been widely found in soil, water, and atmospheric particulates, and are causing serious harm for human health and destroying the ecological balance by their long-term toxicity, difficulty in degradation and accumulation along the food chain [1]. It is important to detect trace heavy metal ions, because heavy metal pollution processes are slow, and there are serious consequences when the content exceeds the critical value [2]. In the conventional methods, inductively coupled plasma atomic emission spectrometry (ICP-AES), inductively coupled plasma mass spectrometry (ICP-MS), and atomic absorption spectrometry (AAS) have good sensitivity and stability in metal detection, and AES has the ability to detect multiple elements simultaneously [3,4,5]. However, these technologies often require large equipment, complex operation, or even vacuum operation, so they cannot satisfy demand for fast and in situ detection [6]. Against this background, researchers have begun to use atmospheric pressure discharge plasma (APDP)-AES for the analysis of metal elements.
APDP is characterized by high electron temperature, high density of active species, simple equipment, and multiple discharge forms [7], which can directly detect heavy metal elements in solid, liquid, and gas particles [8,9,10]. Among them, the detection of heavy metal in water is the most commonly used. Electrolyte cathode discharge (ELCAD), as a way to generate APDP, was first introduced in elemental analysis by Cserfalvi et al. in 1993 [11]. Based on the original ELCAD, researchers made a series of efforts to improve the detection ability of heavy metal and discharge stability, such as to change the excitation power supply and discharge form, reduce the size of the device, and add some surfactants, etc. [12]. Yuan et al. [13] used a new microsecond pulse energy supply driven–ELCAD for Cu element analysis, and by inhibiting the interference of N2 (C3∏u-B3∏g) and OH (A2∑-X2∏) on detection and changing the trigger mode of ICCD, the detection limit of Cu is 0.092 mg/L. Jamroz et al. [14] developed direct current-APDG-AES system for direct determination of Cd in liquid, different from conventional needle electrode as anode, plasma is generated between a solid pin-type tungsten cathode and a liquid drop (50 mL) placed on a graphite disk anode, and a LOD of 0.20–0.40 mg/L is obtained for Cd with high tolerance to Ca, K, Mg, and Na (up to 200 mg/L) in solution.
To further improve the detection performance, the researchers began to convert the liquid analytes into a gaseous or small particle liquid bead form to improve the excitation efficiency of the analytes [15,16,17,18]. Greda et al. [19] studied an original SCGD-ultrasonic nebulizer (USN) to do elemental analysis. By comparing the performance of plasma with and without USN, they found that the analytical lines’ intensities of the studied metals are increased from several to 35 times, and in the novel method, the detection limits of Li and Mn are 0.08 μg/L and 52 μg/L, respectively. Cai et al. [20] generated microplasma-dielectric barrier discharge (DBD) on the nozzle of a pneumatic nebulizer as the excitation source for simultaneous multi-element analysis and the acquired LODs of 19 elements are between 0.9 and 880 μg/L (for Cd and Cr, respectively). Compared with the other optical emission spectrometry (OES), this system balanced the scope of the simultaneous detection of elements and the detection sensitivity. Jiang et al. [21] adopted an on-line detection approach to introduce the gas phase analytes into the discharge area by a low power DBD-tungsten coil electro-thermal vaporization-AES, and with a 10 mL sample solution, LODs of 0.8 mg/L for Cd and 24 mg/L for Zn are acquired. Compared to conventional APDP-AES, nebulized discharge techniques demonstrated improved sensitivity and stability and could also be applied to build a portable device.
Nebulized discharge takes the form of analytes nebulization to transport more liquid into the plasma area, which can effectively increase the contact area and duration, improve the sensitivity of heavy metal detection, and reduce device volume. Therefore, APDP as an excitation source coupled with nebulization introduction is considered to have a good application prospect in reducing LODs and in situ and rapid detection of heavy metal [22]. However, there are few studies on heavy metal detection by nebulized discharge in atmospheric pressure, and the plasma characteristics and heavy metal detection mechanism are not studied in depth. In addition, the pneumatic nebulizer is directly used as the jet electrode [23], which can affect the service lifetime and testing accuracy of the device. In this work, a novel atmospheric pressure nebulized discharge plasma (APNDP) coupled with AES is employed for detecting trace Cu. Plasma is generated near needle electrodes and aerosol is introduced from above the electrode gap by pneumatic nebulizer, which avoids damage to the fragile device. The waveforms of applied voltage and discharge current, optical emission spectrometry, the rotational and vibrational temperature of N2 (C3∏u), and temperature evolution of nebulized discharge are measured. In addition, the heavy metal detection mechanism is studied in depth, and the effects of applied voltage, gas flow rate, pH value, and organic matter on the atomic emission intensity of Cu are investigated to determine the optimal experimental conditions. Eventually, the working curve and LOD of Cu are calculated, and the LOD of Cu is compared with the present studies.
2. Experimental
2.1. Experimental Setup
The diagram of the experimental setup for detecting the Cu element is illustrated in Figure 1 schematically, which is composed of a nebulization plasma reactor, an AC power supply, an optical detection system and an electrical measurement system. For the nebulization plasma reactor, the aerosol is generated by pneumatic nebulizer (Beijing Puxi, WNA-II). The solution containing the Cu element is pumped into the pneumatic nebulizer by the peristaltic pump (Chongqing Jieheng, BT-50EA/153Yx) with a solution flow rate of 2 mL/min, and argon (99.999%) controlled by a mass flow controller (Beijing Huibolong, D07-7K) with a range of 0–20 L/min, employed as the working gas in the experiment. In addition, high-purity tungsten rods (≥99.99%) are used as high-voltage electrode and ground electrode with 4 mm diameter, 70 mm length, and 45° cone angle of tip. The discharge gap is kept at 2 mm, and the aerosol is sprayed on the discharge gap. Under the excitation of AC power supply, gas breakdown occurs between the two electrodes and APNDP is generated. To collect the waste solution treated by APNDP, a culture dish is placed under the plasma reactor as a container for recycling waste liquid.
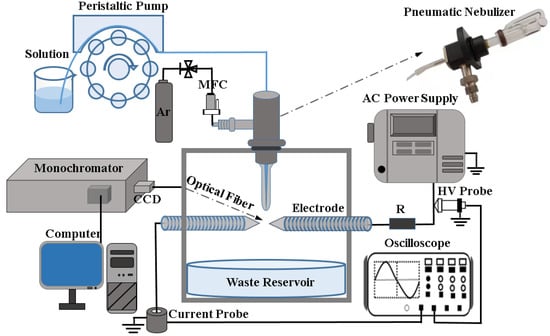
Figure 1.
The experiment setup of nebulized discharge plasma-AES for detecting trace Cu.
The AC power supply (Corona Lab, CTP-2000 K) can provide a sine AC high voltage with the range of 0–30 kV. A 3 kΩ ballast resistor is used to connect the power supply and anode electrode to stabilize the discharge current. The waveforms of applied voltage and discharge current are measured by a 1:1000 high voltage probe (Tektronix P6015A 1000×, 3.0 pF, 100 MΩ) and a current probe (Tektronix TCP312, 100 MHz), respectively. An oscilloscope (Tektronix MDO3034, 350 MHz) is used to store waveforms of voltage and current. The optical fiber fixed on a 3D platform is placed in front of the discharge region and the optimal spectral intensity is obtained by adjusting 3D platform directions in the vertical and horizontal. The grating monochromator (Andor SR-750i, grating groove is 2400 lines/mm and blaze wavelength is 300 nm) is connected to the CCD at the other end of the optical fiber. The spectral light emitted from the discharge area passes through the optical fiber and enters the monochromator, and is then converted into a digital signal by CCD and recorded in the computer.
2.2. Reagents and Samples
In this study, Cu(NO3)2·3H2O, nitric acid (analytical reagent grade) is produced by the Tianjin Damao Chemical Reagent Factory. Nitric acid is diluted with ultrapure water, and the pH value of HNO3 solution is measured by a pH meter (Ohaus ST2100, 0.01 pH) in the range of 2.08–5.32. Then, Cu(NO3)2·3H2O is dissolved in HNO3 solutions to obtain a standard solution of 1 mg/L Cu2+. Methanol, ethanol, and acetone are added to sample solutions with volume percentages of 1%, 2%, 3%, 4%, and 5%, respectively. After the optimization of experimental conditions, the blank solution and solutions containing Cu2+ with a series of concentrations (1, 2, 3, 4, and 5 mg/L) are prepared to determine the working curve and LOD of Cu detection.
3. Results and Discussion
3.1. Electrical and Spectral Characteristics
The waveforms of applied voltage and discharge current that explain the time evolution characteristics of nebulized discharge are shown in Figure 2. The result is obtained under the conditions of a 2.1 L/min Ar flow rate, a 2 mm discharge gap, and a 6.2 kV applied voltage. In the condition of atmospheric pressure Ar, when the high voltage applied on the positive electrode exceeds the breakdown voltage, the gas between the electrodes is broken down and stable discharge plasma is produced in the AC power. When the discharge current is present, it shows that the gas is broken down and the conductivity is increased in the discharge gap, so the application voltage drops significantly from about 3.26 kV to 1.87 kV. When applied voltage is 6.2 kV, the current duration of nebulized discharge is almost 27 µs, and with the existence of 3 kΩ ballast resistor, and the current reaches a peak of 0.1 A.
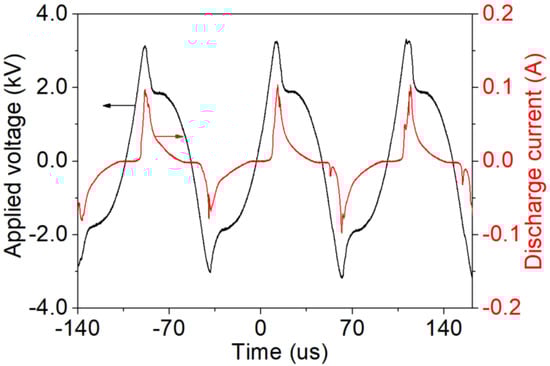
Figure 2.
Waveforms of applied voltage and discharge current. (Ar flow rate: 2.1 L/min, discharge gap: 2 mm, applied voltage: 6.2 kV).
The image of the nebulization plasma reactor is shown in Figure 3a. A larger view of the discharge region in Figure 3a is shown in Figure 3b. In Figure 3b, the image of nebulized discharge is captured using a digital camera (a Cannon 5D mark IV) with an Ar flow rate of 1.68 L/min, a discharge gap of 2 mm, and an applied voltage of 5.6 kV. It is obvious that the shape of the discharge region is fan-shaped. Because of the action of Ar airflow, the discharge does not occur between the axial directions of the electrodes, but forms a fan-shaped discharge. In addition, the maximum discharge luminescence intensity appears above the plasma on either side and has uniform distribution of luminescence intensity. In nebulized discharge, the formed fan-shaped discharge region has a larger particle contact area than the normal needle discharge, and the aerosol stays in the discharge region for a longer time, which makes it easier to detect heavy metal.
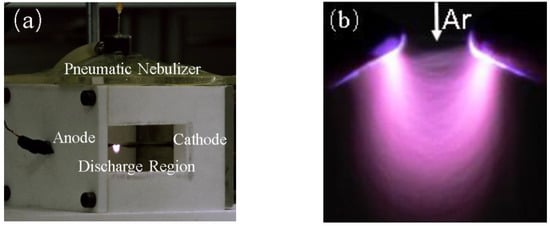
Figure 3.
(a) Nebulization plasma reactor; (b) image of nebulized discharge. (Ar flow rate: 1.68 L/min, discharge gap: 2 mm, applied voltage: 5.6 kV).
The OES in the range of 300–420 nm containing 1 mg/L Cu2+ is shown in Figure 4, which is mainly composed of the atomic spectral lines of Cu I (3d104p-3d104s, 324.75 nm), the bands of OH (A2∑-X2∏) and N2 (C3∏u-B3∏g). Under the action of the high-temperature and high-energy plasma, the atoms and molecules of the discharge region are collided, excited, and ionized to generate excited atoms, excited molecules, and free radicals, etc., and, eventually, OES is generated [24].
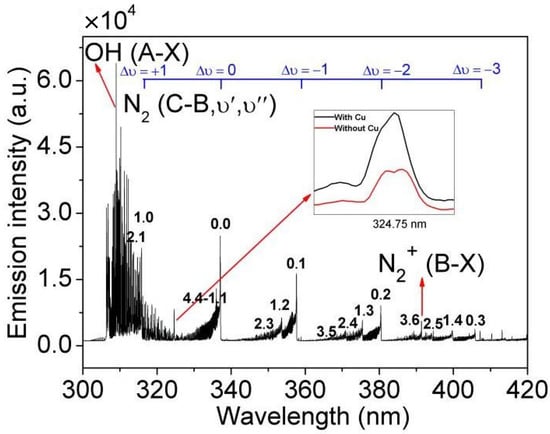
Figure 4.
Typical spectrum of 1 mg/L Cu2+ in the range of 300–420 nm (applied voltage: 6.2 kV, Ar flow rate: 2.1 L/min, no organic matter and nitric acid added).
Among them, the generation of Cu atoms includes two main processes which are the atomization process of positive Cu ions and the excitation of Cu atoms [13]. The Cu element mainly exists in the solution composed of positive Cu ions and there are amounts of positive Cu ions in the discharge region.
Atomization of Cu is mainly through the recombination reaction of electrons and positive Cu ions under a high gas temperature, as the following process.
2e− + Cu2+ → Cu
In addition, the inelastic collision occurring between positive Cu ions and hydrogen atoms is also an important pathway for the formation of Cu atoms, as the following processes.
2H + Cu2+ → Cu + 2H+
In the nebulized discharge, H atoms are released, because vaporized H2O molecules are dissociated by electron impact.
H2O + e− → OH + H + e−
On the other hand, the main processes of copper atoms’ excitation are shown as the following processes.
e− + Cu→ Cu I (3d104p) + e−
Cu I (3d104p)→ Cu I (3d104s) + hν
So, the metal atoms are excited to the excitation state through the electron impact excitation and thermal excitation. Abundant excited metal atoms result in a strong emission intensity of Cu I (3d104p-3d104s, 324.75 nm), which indicates that the Cu element can be determined by OES.
Based on previous research, plasma gas temperature plays an important role in the detection of heavy metal elements, which will influence the emission intensities of metal elements [25]. In general, the gas temperature can be approximately considered as equal to the rotational temperature of N2 (C3∏u) at atmospheric plasma. Because the energy gap between rotational levels of molecules is very small, equilibrium can be easily achieved between translational motion and rotational motion for the frequent collisions with heavy particles at atmospheric pressure. Furthermore, the rotational temperature of N2 (C3∏u) is a reliable method for estimating the gas temperature [26], depending on the fast rotational relaxation and the frequent collisions between heavy particles. The rotational temperature of N2 (C3∏u) can be acquired by “Specair” code [27].
Using “Specair”, when the rotational and vibration temperature are inputted, a simulated spectrum of N2 (C3∏u-B3∏g, Δυ = −2) is calculated. Then, the simulated spectrum is compared repeatedly with the experiment until the most fitting one is found, as shown in Figure 5. The result is obtained under the conditions of 5.6 kV applied voltage, 1.68 L/min Ar flow rate, pH = 3.59 and 2% (V/V) ethanol. It is clearly shown that the gas temperature is about 2190 K, and the vibrational temperature of N2 (C3∏u) can also be acquired, which is about 3165 K. In the nebulized discharge, it is obvious that a very high gas temperature is obtained, which can promote the processes of reaction (1–4), thus obtaining a higher emission intensity [28].
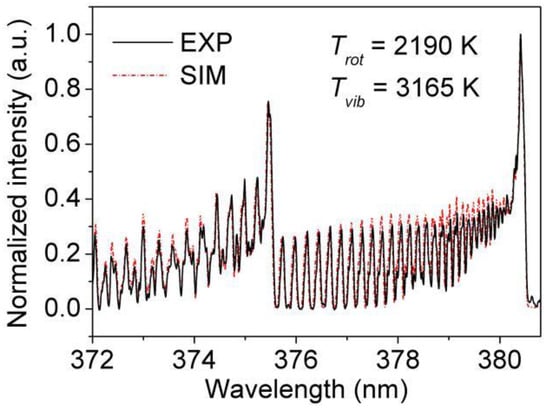
Figure 5.
Experiment and simulation N2 (C3∏u) temperature (applied voltage: 5.6 kV, Ar flow rate: 1.68 L/min, pH = 3.59, 2% (V/V) ethanol).
To understand the temperature evolution of nebulized discharge, the gas temperature distribution of plasma is obtained under the conditions of an Ar flow rate of 1.68 L/min, a discharge gap of 2 mm, and an applied voltage of 5.6 kV. As shown in Figure 6a, the area in white dash line is the region for measuring plasma gas temperature, and the corresponding gas temperatures at the respective positions are displayed in Figure 6b. At 0 mm, the local maximum of plasma gas temperature is acquired. With the increase of horizontal position, the gas temperature of the plasma first decreases to a certain degree and then increases. In addition, at about 1.7 mm, another absolute maximum of plasma gas temperature is acquired. The symmetrical gas temperature distribution is mainly due to needle-needle electrode structure as shown in Figure 1. Besides, comparing with Figure 6a,b, it is found that the saddle-shaped gas temperature distribution is approximate to the luminous intensity distribution in the dash line region.
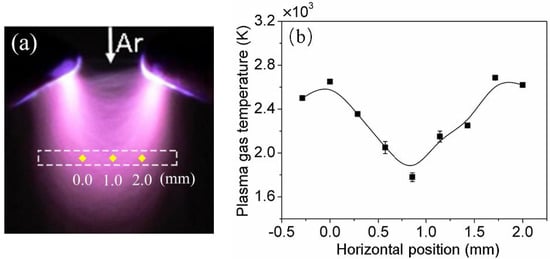
Figure 6.
(a) Measurement area of plasma gas temperature; (b) the distribution of plasma gas temperature with horizontal position (Ar flow rate: 1.68 L/min, discharge gap: 2 mm, applied voltage: 5.6 kV).
3.2. Optimization of Experimental Conditions
The emission intensities of spectral lines can reflect the population of the excited species. The content of elements in the measured material can be expressed by the emission intensity of corresponding elements. Therefore, in order to decrease the LOD of Cu, the optimization experiment is mainly focused on the change of the Cu I (3d104p-3d104s, 324.75 nm) emission intensity. The effects of voltage, gas flow rate, pH, and organic matter on the emission intensity of Cu I (3d104p-3d104s, 324.75 nm) are researched, and measured with 1 mg/L Cu 2+ to obtain the optimal parameters.
The effect of applied voltage on the emission intensity of Cu I (3d104p-3d104s, 324.75 nm) is shown in Figure 7, which affected energy efficiency [29]. The result is obtained under the conditions of the 2.1 L/min Ar flow rate, and no organic matter and nitric acid is added. The emission intensity increases almost linearly with the increase in applied voltage from 3.8 to 6.7 kV. With the increase in applied voltage, more energetic electrons are produced in a stronger electric field, which leads to the generation of more excited atoms, and the emission intensity of Cu I (3d104p-3d104s, 324.75 nm) increases correspondingly [25].
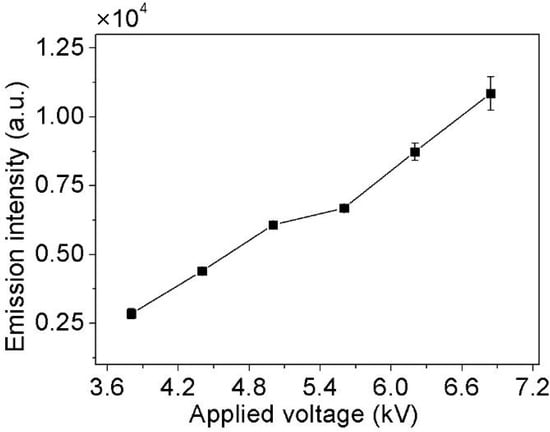
Figure 7.
The effect of the applied voltage on emission intensity (Ar flow rate: 2.1 L/min, no organic matter and nitric acid added).
The effect of the Ar flow rate on Cu I (3d104p-3d104s, 324.75 nm) emission intensity is also investigated and the result is illustrated in Figure 8, because it affected the stability of the plasma and nebulization efficiency [30]. The result is obtained under the conditions of a 5.6 kV applied voltage, no organic matter and nitric acid, and a 2 mL/min solution flow rate. The emission intensity increases with the increase in the Ar flow rate, and reaches the maximum value when the flow rate of Ar is 1.68 L/min. However, when the flow rate is greater than 1.68 L/min, the emission intensity decreases gradually with the continuous increase in the Ar flow rate. Given that the liquid inlet speed is stable at 2 mL/min, the optimal gas flow rate produces a more nebulized solution in the discharge region, makes a series of sufficient reactions about the formation of Cu atoms, and promotes a more stable discharge.
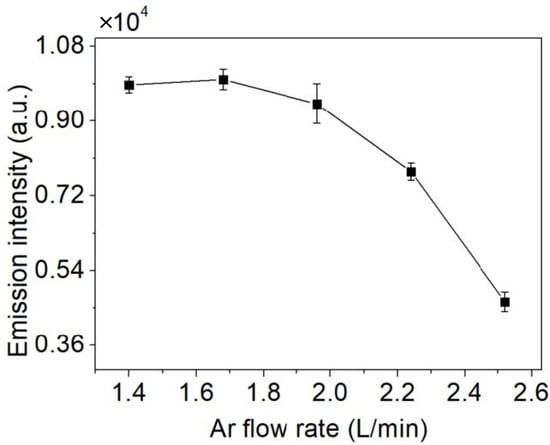
Figure 8.
The effect of the Ar flow rate on emission intensity (applied voltage: 5.6 kV, no organic matter and nitric acid, solution flow rate: 2 mL/min).
The pH also has a significant influence on the Cu I (3d104p-3d104s, 324.75 nm) emission intensity, affecting the chemical characteristic because it changes the liquid ingredient [31]. The result is obtained under the conditions of 5.6 kV applied voltage, 1.68 L/min Ar flow rate, and no organic matter added, as shown in Figure 9. The emission intensity increases with the pH value from 2.08 to 3.59 and reaches the maximum value, and when the pH value is higher than 3.59, the emission intensity gradually decreases. The result indicates that Cu ions are more favorably converted to their volatile species in a weak acidic condition, promoting the progress of reaction (2), so the emission intensity is increased [16]. Cu ions are largely unstable at near neutral pH, resulting in an enhanced hydrolysis of metal ions, so the emission intensity is reduced [23]. Therefore, 3.59 pH with HNO3 is selected to improve the sensitivity of detection and the atomization efficiency of copper.
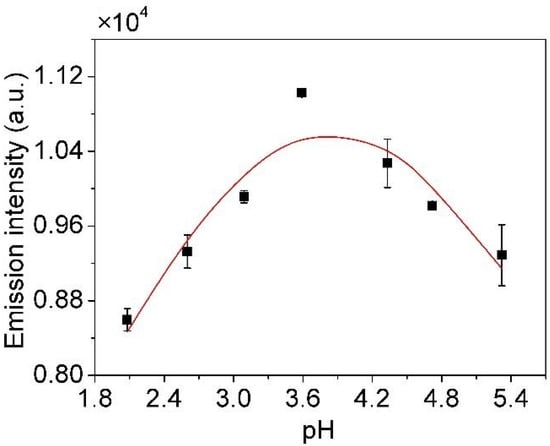
Figure 9.
The effect of the solution pH on emission intensity (applied voltage: 5.6 kV, Ar flow rate: 1.68 L/min, no organic matter added).
It is observed that the presence of specific organics greatly enhances the signal intensity of Cu I (3d104p-3d104s, 324.75 nm), because it changes the chemical characteristics [32]. The result is obtained under the conditions of 5.6 kV applied voltage, 1.68 L/min Ar flow rate, and pH = 3.59. As shown in Figure 10, with the increase in organics concentration, the emission intensity of copper increases initially and then decreases. A small amount of specific organics can reduce the surface activation energy of positive Cu ions and promote the progress of reaction (1) [33], and can accelerate decomposition of the sample solution to produce H radicals and promote the progress of reaction (2) [34], so the emission intensity is increased. When excess organic matter molecules enter the discharge region, the average energy used for molecular decomposition is decreased under the condition of constant applied voltage, resulting in a decrease in the number of dissociated organic molecules and active free radicals, so the emission intensity is reduced. In addition, different organic compounds have different effects, among which 2% (V/V) ethanol promotes copper atomization the most.
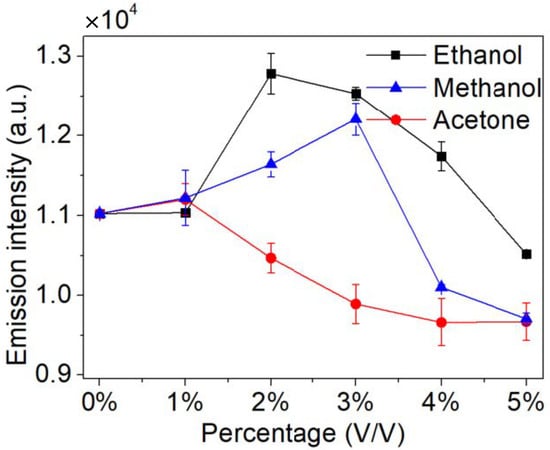
Figure 10.
The effects of the low molecular weight organics on emission intensities (applied voltage: 5.6 kV, Ar flow rate: 1.68 L/min, pH = 3.59).
To summarize, the optimal experimental conditions are 5.6 kV applied voltage, 1.68 L/min Ar flow rate, pH = 3.59, and 2% ethanol, respectively.
3.3. Limit of Detection
The solution with a series of concentrations of metal element (Cu2+ of 1, 2, 3, 4, 5 mg/L) and the blank solution are used to determine the working curve of Cu, as shown in Figure 11. The LOD is calculated by the following equation.
where s reflects the noise of spectra of the Cu I (3d104s-3d104p, 324.75 nm) in detection and it is obtained by the standard deviation of 10 measurements of the blank solution in this study, and k is the slope of the working curve. The results are listed in Table 1, with the r2 and linear function. It can be seen that the LOD of the Cu element is 0.083 mg/L. In addition, the r2 of working curve is 0.9975, which presents a good linearity of detection, and has a higher accuracy.
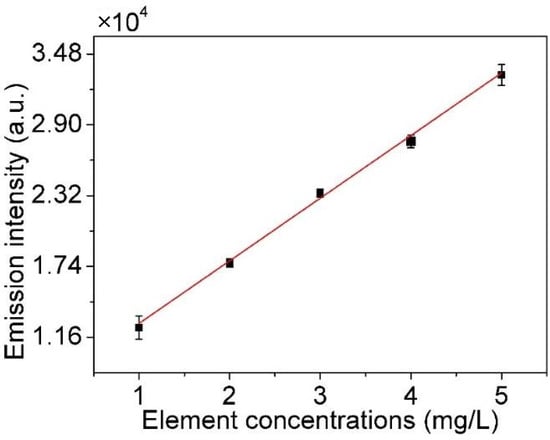
Figure 11.
Working curve for Cu.

Table 1.
Analytical performance of APNDP for detecting the Cu element.
3.4. Comparison of LOD with Other Techniques
A comparison of the LOD obtained by APNDP-AES with other techniques is shown in Table 2. The results show that the LOD of Cu in this study is lower than that of other studies and is in the same order of magnitude as that of ICP-OES.
Table 2.
Comparison of LOD obtained by this work (APNDP) with other techniques for detecting trace heavy metal Cu.
The LOD of APNDP-AES is much lower than the standard value of Cu for drinking water provided by WHO [36]. Because APNDP has a small experimental device, lower LOD and a relatively high detection sensitivity, it has great potential for portable and in situ application. In the future, it can be optimized by changing different types of pneumatic nebulizers and distance between the nozzle and the discharge region and so on to reduce the LOD. Finally, it has a better application prospect of in situ detection and lower consumption.
4. Conclusions
In conclusion, a novel nebulized discharge plasma generated at atmospheric pressure is employed to detect the Cu element by AES. Plasma is generated near needle electrodes and aerosol is introduced from above the electrode gap by a pneumatic nebulizer, which avoids damage to the fragile device. The discharge image also indicates that a stable glow discharge is obtained. Under optimal conditions, the rotational and vibrational temperatures are calculated by the spectra of N2 (C3∏u-B3∏g, Δυ = − 2), which are about 2190 K and 3165 K, respectively. From the gas temperature evolution of nebulized discharge, it can be seen that the temperature obtained is nearly symmetrical and has higher energy at both ends. When the electrode gap is 2 mm and the flow rate of solution is 2 mL/min, the optimal experimental conditions of nebulized discharge are HNO3 solution with pH = 3.59, 5.6 kV applied voltage, 1.68 L/min Ar flow rate, and 2% (V/V) ethanol. Among them, the applied voltage effects the energy efficiency and the number of high energy electrons and excited atoms, the gas flow rate affects the area of the discharge region and the solution-nebulized efficiency, and the solution pH value and organic matter changes the composition of the solution and some reaction processes of trace heavy metal Cu detection. Finally, the emission intensity of Cu I (3d104p-3d104s, 324.75 nm) is affected. Under the experimental conditions, the LOD of Cu is 0.083 mg/L and has a good linearity of detection. This work can detect trace heavy metal Cu directly, and after solution nebulization, the Cu element is easier to be excited under the action of plasma.
Author Contributions
Writing—original draft, H.Y. (Huixue Yang); Writing review & editing, H.Y. (Hao Yuan), S.L., W.W. and D.Y. All authors have read and agreed to the published version of the manuscript.
Funding
This research was funded by the National Natural Science Foundation of China (52077026 and 11965018), the Science and Technology Development Fund of Xinjiang Production and Construction (2019BC009) and the Fundamental Research Funds for the Central Universities (DUT21LK31).
Institutional Review Board Statement
Not applicable.
Informed Consent Statement
Not applicable.
Conflicts of Interest
The authors declare no conflict of interest.
References
- Mukherjee, S.; Bhattacharyya, S.; Ghosh, K.; Pal, S.; Halder, A.; Naseri, M.; Mohammadniaei, M.; Sarkar, S.; Ghosh, A.; Sun, Y.; et al. Sensory development for heavy metal detection: A review on translation from conventional analysis to field-portable sensor. Trends Food Sci. Technol. 2021, 109, 674–689. [Google Scholar] [CrossRef]
- Niu, G.-H.; Knodel, A.; Burhenn, S.; Brandt, S.; Franzke, J. Review: Miniature dielectric barrier discharge (DBD) in analytical atomic spectrometry. Anal. Chim. Acta 2021, 1147, 211–239. [Google Scholar] [CrossRef] [PubMed]
- Li, K.-J.; Yang, H.-Y.; Yuan, X.; Zhang, M. Recent developments of heavy metals detection in traditional Chinese medicine by atomic spectrometry. Microchem. J. 2021, 160, 105726. [Google Scholar] [CrossRef]
- Liu, S.; Yu, Y.-L.; Wang, J.-H. Advances in discharge-based microplasmas for the analysis of trace species by atomic spectrometry. J. Anal. At. Spectrom. 2017, 32, 2118–2126. [Google Scholar] [CrossRef]
- Souza, S.-O.; Costa, S.-S.-L.; Brum, B.-C.-T.; Santos, S.-H.; Garcia, C.-A.-B.; Araujo, R.-G.-O. Determination of nutrients in sugarcane juice using slurry sampling and detection by ICP OES. Food Chem. 2019, 273, 57–63. [Google Scholar] [CrossRef] [PubMed]
- Jin, M.-T.; Yuan, H.; Liu, B.; Peng, J.-J.; Xu, L.-P.; Yang, D.Z. Review of the distribution and detection methods of heavy metals in the environment. Anal. Methods 2020, 12, 5747–5766. [Google Scholar] [CrossRef]
- Bruggeman, P.-J.; Iza, F.; Brandenburg, R. Foundations of atmospheric pressure non-equilibrium plasmas. Plasma Sources Sci. Technol. 2017, 26, 123002. [Google Scholar] [CrossRef] [Green Version]
- Deng, Q.-S.; Yang, C.; Zheng, H.-T.; Liu, J.-X.; Mao, X.-F.; Hu, S.-H.; Zhu, Z.-L. Direct determination of cadmium in rice by solid sampling electrothermal vaporization atmospheric pressure glow discharge atomic emission spectrometry using a tungsten coil trap. J. Anal. At. Spectrom. 2019, 34, 1786–1793. [Google Scholar] [CrossRef]
- Jiang, J.; Li, Z.-J.; Wang, Y.-Y.; Zhang, X.-N.; Yu, K.; Zhang, H.; Zhang, J.; Gao, J.; Liu, X.-Y.; Zhang, H.-N.; et al. Rapid determination of cadmium in rice by portable dielectric barrier discharge-atomic emission spectrometer. Food Chem. 2020, 310, 125824. [Google Scholar] [CrossRef]
- Zhang, Y.-R.; Liu, J.-X.; Mao, X.-F.; Chen, G.-Y.; Tian, D. Review of miniaturized and portable optical emission spectrometry based on microplasma for elemental analysis. Trends Anal. Chem. 2021, 144, 116437. [Google Scholar] [CrossRef]
- Cserfalvi, T.; Mezei, P.; Apai, P. Emission studies on a glow discharge in atmospheric pressure air using water as a cathode. J. Phys. D Appl. Phys. 1993, 26, 2184–2188. [Google Scholar] [CrossRef]
- Yu, J.; Zhang, X.-M.; Lu, Q.-F.; Sun, D.-X.; Wang, X.; Zhu, S.-W.; Zhang, Z.-C.; Yang, W. Evaluation of analytical performance for the simultaneous detection of trace Cu, Co and Ni by using liquid cathode glow discharge-atomic emission spectrometry. Spectrochim. Acta Part B 2018, 145, 64–70. [Google Scholar] [CrossRef]
- Yuan, H.; Zhou, X.-F.; Nie, Y.; Li, Y.; Liang, J.-P.; Yang, D.-Z.; Yan, E.-Y.; Wang, W.-C.; Xu, Y. Temporal resolved atomic emission spectroscopy on a pulsed electrolyte cathode discharge for improving the detection sensitivity of Cu. Spectrochim. Acta Part B 2021, 177, 106072. [Google Scholar] [CrossRef]
- Jamroz, P.; Greda, K.; Dzimitrowicz, A.; Swiderski, K.; Pohl, P. Sensitive Determination of Cd in Small-Volume Samples by Miniaturized Liquid Drop Anode Atmospheric Pressure Glow Discharge Optical Emission Spectrometry. Anal. Chem. 2017, 89, 5729–5733. [Google Scholar] [CrossRef] [PubMed]
- Li, N.; Wu, Z.-C.; Wang, Y.-Y.; Zhang, J.; Zhang, X.-N.; Zhang, H.-N.; Wu, W.-H.; Gao, J.; Jiang, J. Portable Dielectric Barrier Discharge-Atomic Emission Spectrometer. Anal. Chem. 2017, 89, 2205–2210. [Google Scholar] [CrossRef]
- Li, Z.-A.; Tan, Q.; Hou, X.-D.; Xu, K.-L.; Zheng, C.-B. Single Drop Solution Electrode Glow Discharge for Plasma Assisted-Chemical Vapor Generation: Sensitive Detection of Zinc and Cadmium in Limited Amounts of Samples. Anal. Chem. 2014, 86, 12093–12099. [Google Scholar] [CrossRef]
- Zheng, H.-T.; Ma, J.-Z.; Zhu, Z.-L.; Tang, Z.-Y.; Hu, S.-H. Dielectric barrier discharge micro-plasma emission source for the determination of lead in water samples by tungsten coil electro-thermal vaporization. Talanta 2015, 132, 106–111. [Google Scholar] [CrossRef]
- Yuan, X.; Li, K.-J.; Zhang, Y.-T.; Miao, Y.-T.; Xiang, Y.; Sha, Y.; Zhang, M.; Huang, K. Point discharge microplasma for the determination of mercury in Traditional Chinese Medicines by chemical vapor generation atomic emission spectrometry. Microchem. J. 2020, 155, 104695. [Google Scholar] [CrossRef]
- Greda, K.; Jamroz, P.; Pohl, P. Ultrasonic nebulization atmospheric pressure glow discharge- Preliminary study. Spectrochim. Acta Part B 2016, 121, 22–27. [Google Scholar] [CrossRef]
- Cai, Y.; Yu, Y.-L.; Wang, J.-H. Alternating-Current-Driven Microplasma for Multielement Excitation and Determination by Optical-Emission Spectrometry. Anal. Chem. 2018, 90, 10607–10613. [Google Scholar] [CrossRef]
- Jiang, X.-M.; Chen, Y.; Zheng, C.-B.; Hou, X.-D. Electrothermal Vaporization for Universal Liquid Sample Introduction to Dielectric Barrier Discharge Microplasma for Portable Atomic Emission Spectrometry. Anal. Chem. 2014, 86, 5220–5224. [Google Scholar] [CrossRef] [PubMed]
- Sturgeon, R.-E. Photochemical vapor generation: A radical approach to analyte introduction for atomic spectrometry. J. Anal. At. Spectrom. 2017, 32, 2319–2340. [Google Scholar] [CrossRef] [Green Version]
- Cai, Y.; Gao, X.-G.; Ji, Z.-N.; Yu, Y.-L.; Wang, J.-H. Nonthermal optical emission spectrometry for simultaneous and direct determination of zinc, cadmium and mercury in spray. Analyst 2018, 143, 930–935. [Google Scholar] [CrossRef] [PubMed]
- Li, X.; Yang, D.-Z.; Yuan, H.; Liang, J.-P.; Xu, T.; Zhao, Z.-L.; Zhou, X.-F.; Zhang, L.; Wang, W.-C. Detection of trace heavy metals using atmospheric pressure glow discharge by optical emission spectra. High Volt. 2019, 4, 228–233. [Google Scholar] [CrossRef]
- Yuan, H.; Yang, D.-Z.; Li, X.; Zhang, L.; Zhou, X.-F.; Wang, W.-C.; Xu, Y. A pulsed electrolyte cathode discharge used for metal element analysis by atomic emission spectrometry. Phys. Plasmas 2019, 26, 053505. [Google Scholar] [CrossRef]
- Zhao, T.-L.; Xu, Y.; Song, Y.-H.; Li, X.-S.; Liu, J.-L.; Liu, J.-B.; Zhu, A.-M. Determination of vibrational and rotational temperatures in a gliding arc discharge by using overlapped molecular emission spectra. J. Phys. D Appl. Phys. 2013, 46, 345201. [Google Scholar] [CrossRef]
- Huang, S.; Lia, T.; Zhang, Z.-F.; Ma, P.-F. Rotational and vibrational temperatures in the spark plasma by various discharge energies and strategies. Appl. Energy 2019, 251, 113358. [Google Scholar] [CrossRef]
- Liu, K.; Ren, W.; Ran, C.-F.; Zhou, R.-S.; Tang, W.-B.; Zhou, R.-W.; Yang, Z.-H.; Ostrikov, K. Long-lived species in plasma-activated water generated by an AC multi-needle-to-water discharge: Effects of gas flow on chemical reactions. J. Phys. D Appl. Phys. 2021, 54, 065201. [Google Scholar] [CrossRef]
- Lu, Q.-F.; Yang, S.-X.; Sun, D.-X.; Zheng, J.-D.; Li, Y.; Yu, J.; Su, M.-G. Direct determination of Cu by liquid cathode glow discharge-atomic emission spectrometry. Spectrochim. Acta Part B 2016, 125, 136–139. [Google Scholar] [CrossRef]
- He, Q.; Wang, X.-X.; He, H.-J.; Zhang, J. A Feasibility Study of Rare-Earth Element Vapor Generation by Nebulized Film Dielectric Barrier Discharge and Its Application in Environmental Sample Determination. Anal. Chem. 2020, 92, 2535–2542. [Google Scholar] [CrossRef]
- Liu, X.; Zhu, Z.-L.; Bao, Z.-Y.; Zheng, H.-T.; Hu, S.-H. Determination of trace cadmium in rice by liquid spray dielectric barrier discharge induced plasma−chemical vapor generation coupled with atomic fluorescence spectrometry. Spectrochim. Acta Part B 2018, 141, 15–21. [Google Scholar] [CrossRef]
- Liu, X.; Zhu, Z.-L.; Li, H.-L.; He, D.; Li, Y.-T.; Zheng, H.-T.; Gan, Y.-Q.; Li, Y.-X.; Belshaw, N.-S.; Hu, S.H. Liquid Spray Dielectric Barrier Discharge Induced Plasma−Chemical Vapor Generation for the Determination of Lead by ICPMS. Anal. Chem. 2017, 89, 6827–6833. [Google Scholar] [CrossRef] [PubMed]
- Greda, K.; Jamro, P.; Pohl, P. The improvement of the analytical performance of direct current atmospheric pressure glow discharge generated in contact with the small-sized liquid cathode after the addition of non-ionic surfactants to electrolyte solutions. Talanta 2013, 108, 74–82. [Google Scholar] [CrossRef] [PubMed]
- Cai, Y.; Zhang, Y.-J.; Wu, D.-F.; Yu, Y.-L.; Wang, J.-H. Nonthermal Optical Emission Spectrometry: Direct Atomization and Excitation of Cadmium for Highly Sensitive Determination. Anal. Chem. 2016, 88, 4192–4195. [Google Scholar] [CrossRef] [Green Version]
- Yu, J.; Zhu, S.-W.; Lu, Q.-F.; Zhang, Z.-C.; Sun, D.-X.; Zhang, X.-M.; Wang, X.; Yang, W. Liquid Cathode Glow Discharge as a Microplasma Excitation Source for Atomic Emission Spectrometry for the Determination of Trace Heavy Metals in Ore Samples. Anal. Lett. 2018, 51, 2128–2140. [Google Scholar] [CrossRef]
- World Health Organisation. Guidelines for Drinking-Water Quality, 4th ed.; WHO: Geneva, Switzerland, 2011; pp. 229–230, 433–434. [Google Scholar]
Publisher’s Note: MDPI stays neutral with regard to jurisdictional claims in published maps and institutional affiliations. |
© 2022 by the authors. Licensee MDPI, Basel, Switzerland. This article is an open access article distributed under the terms and conditions of the Creative Commons Attribution (CC BY) license (https://creativecommons.org/licenses/by/4.0/).